
Body Shape Phenotypes and Breast Cancer Risk: A Mendelian Randomization Analysis
 , , and
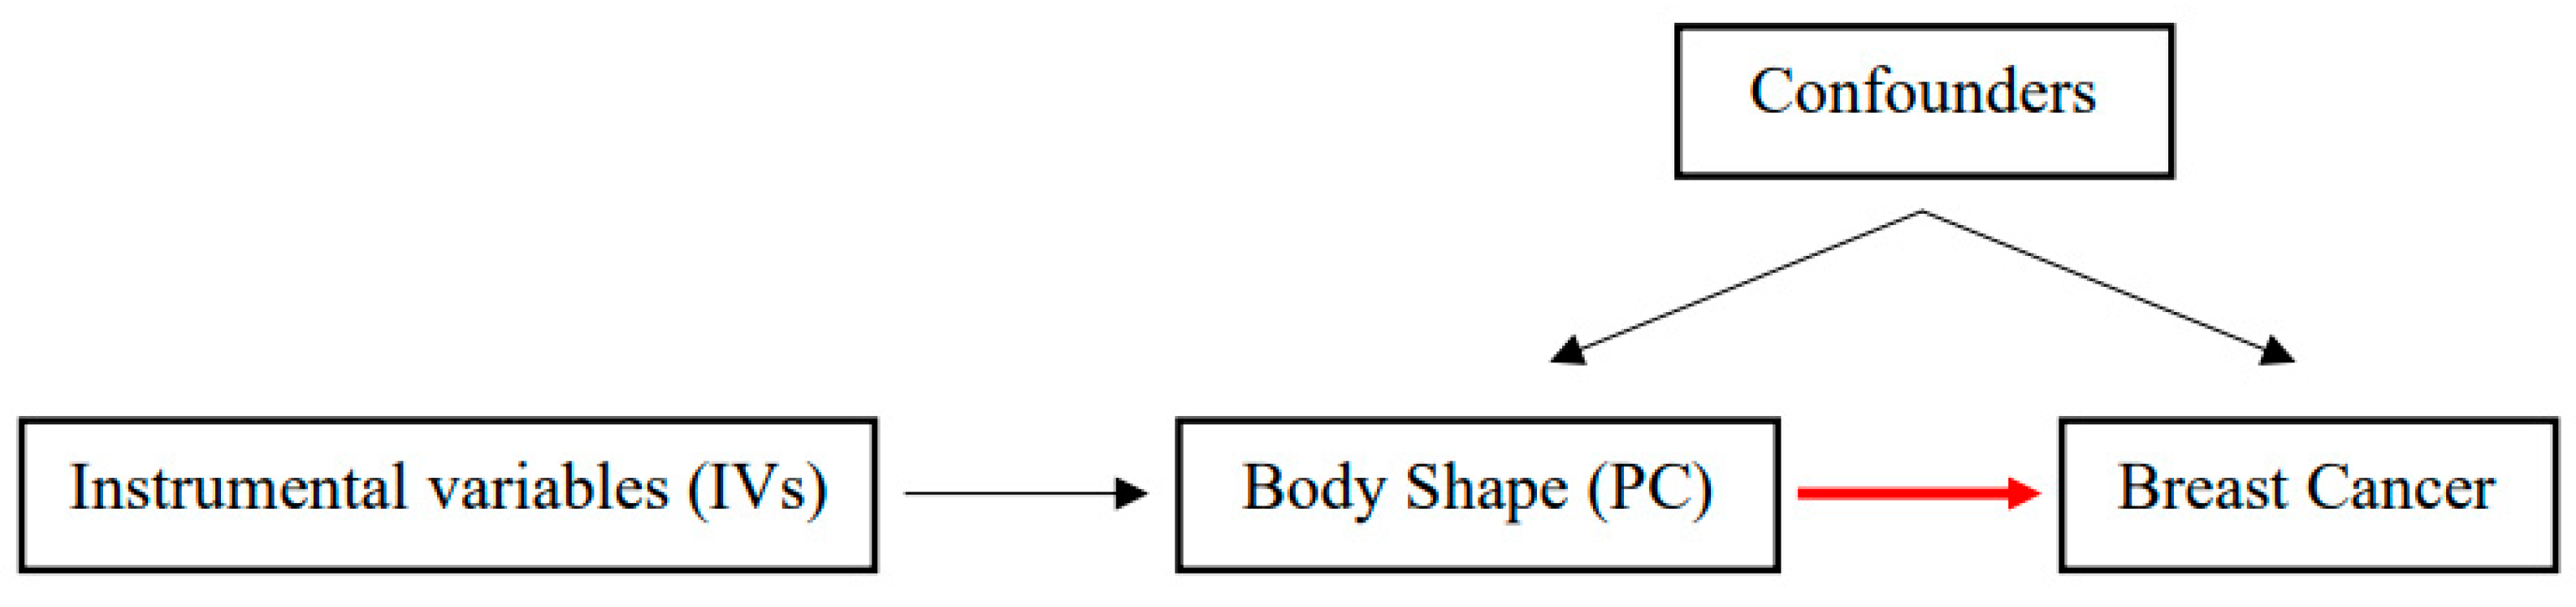
Abstract
Simple Summary
Abstract
1. Introduction
2. Materials and Methods
2.1. Body Shape Phenotypes and Related Genetic Variants
2.2. Breast Cancer Risk Data
2.3. Statistical Analysis
2.4. Sensitivity Analyses
3. Results
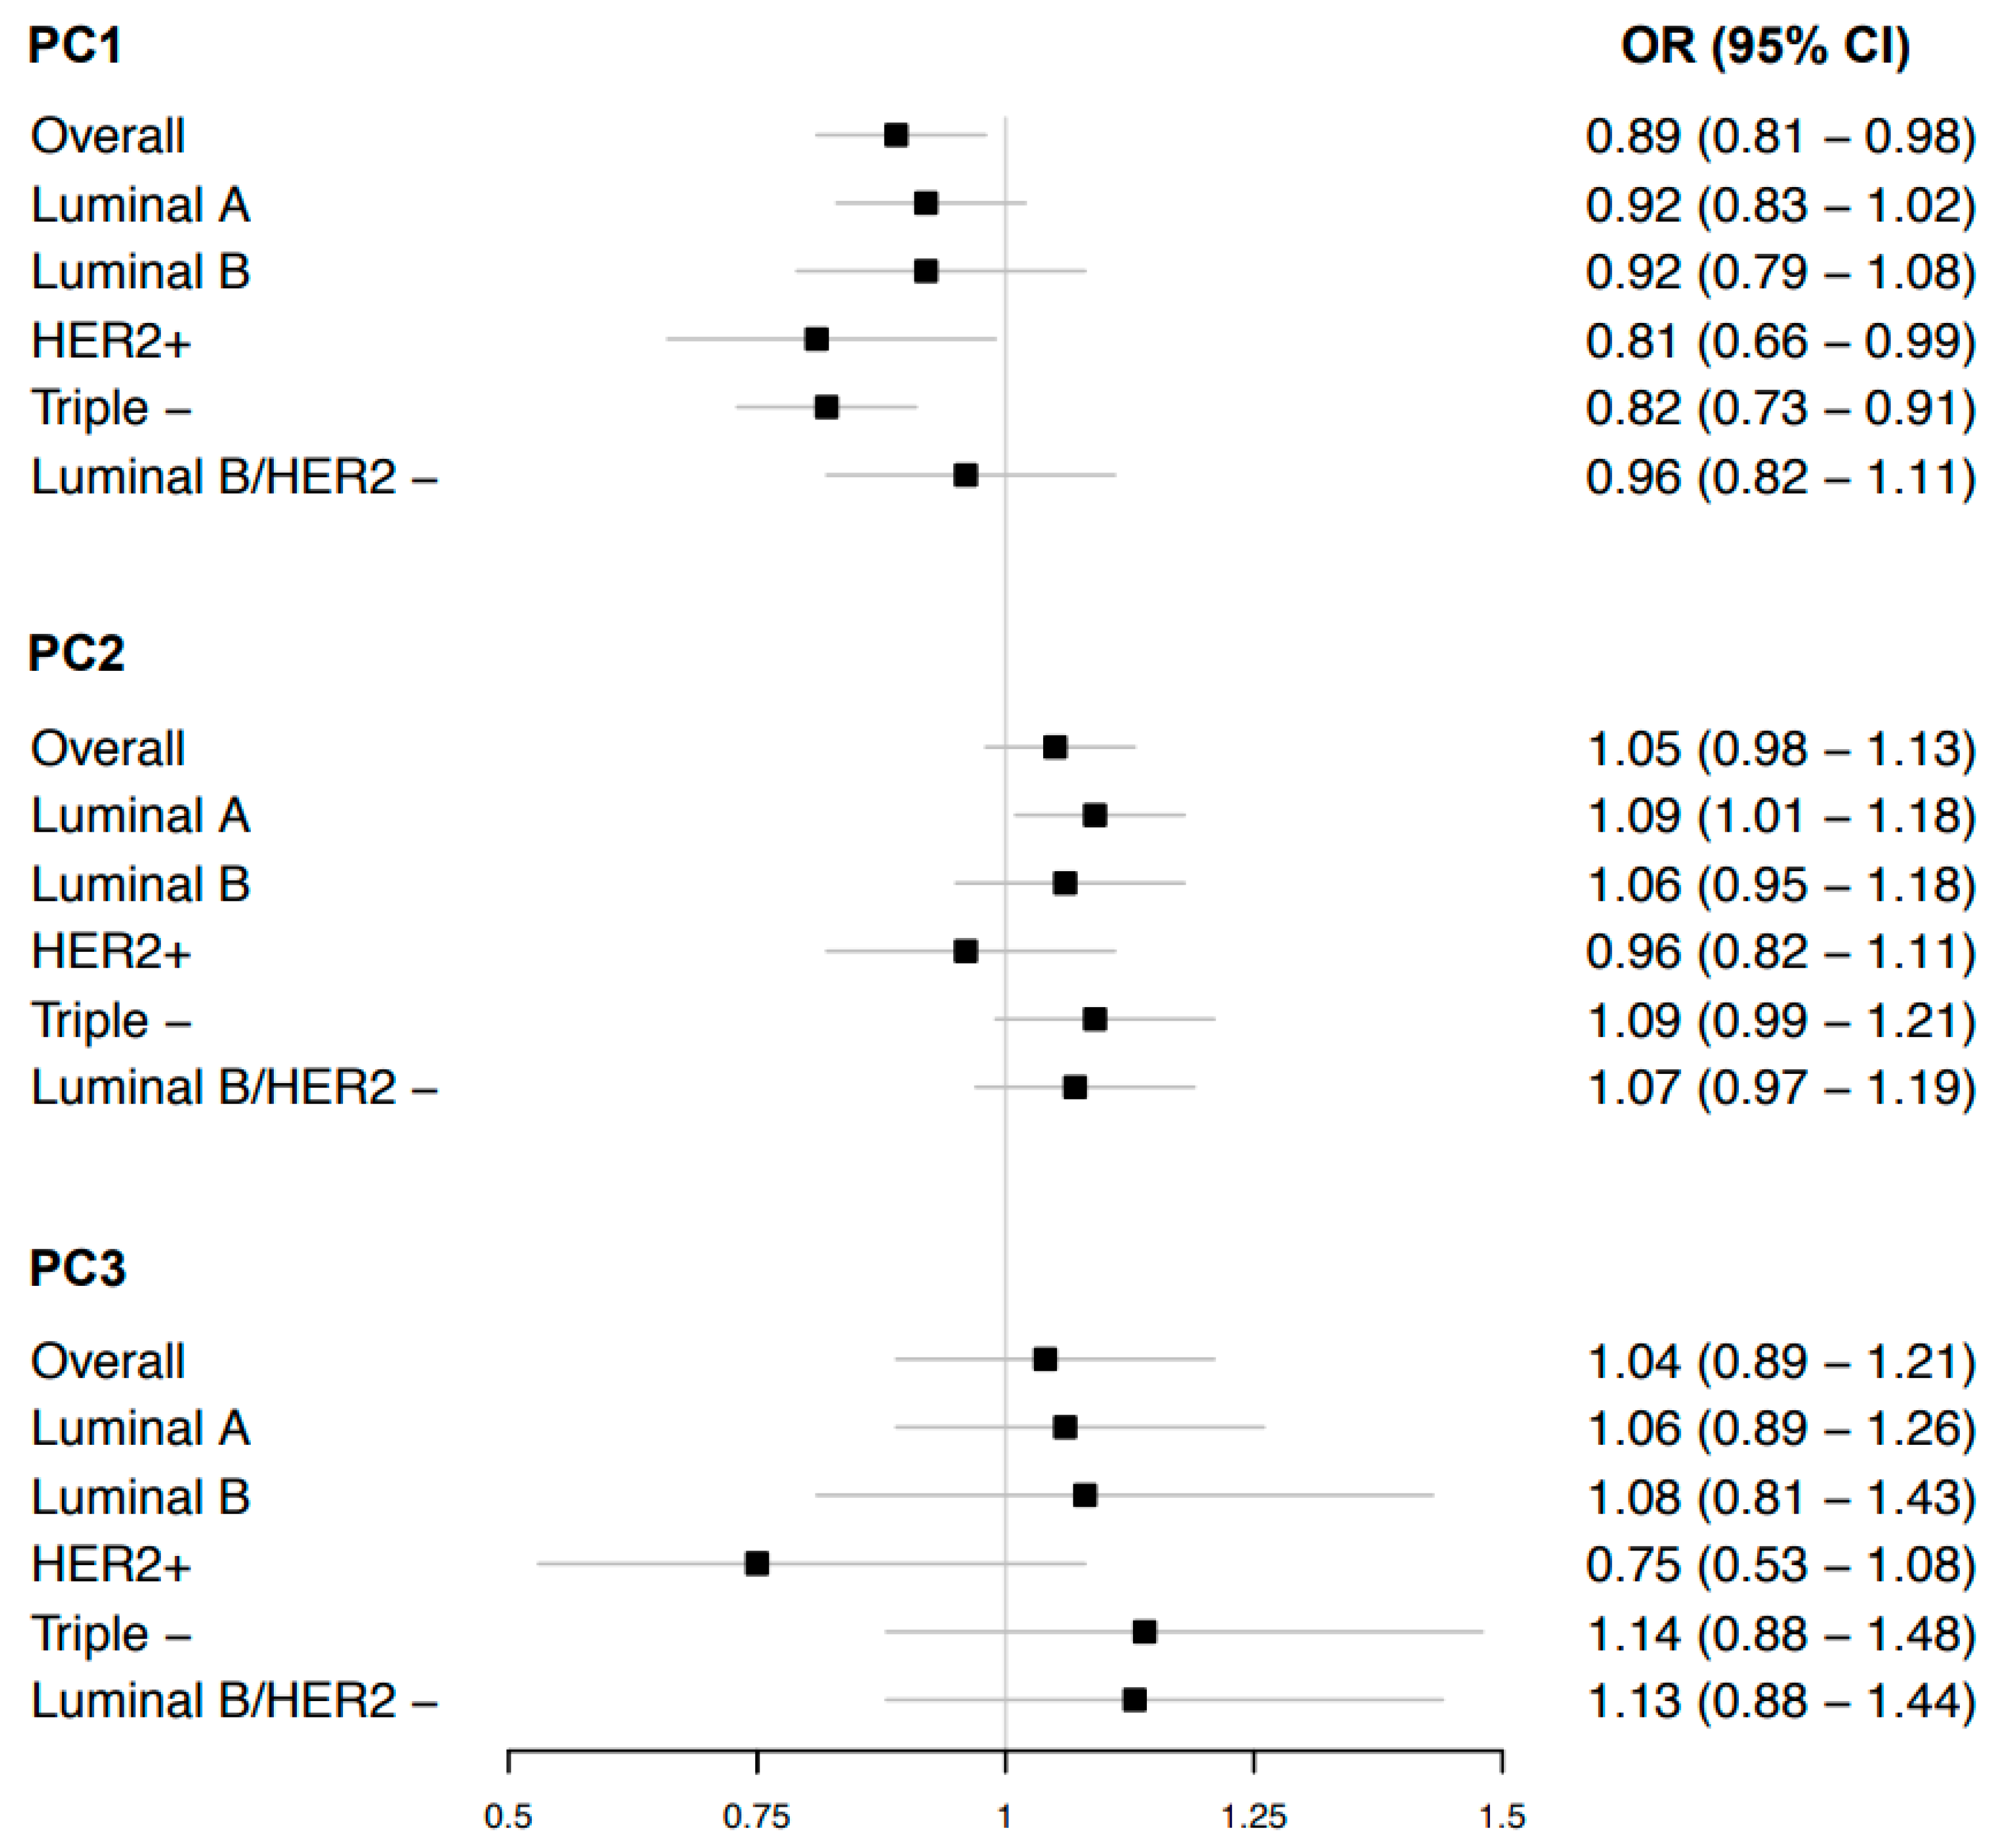
3.1. Body Shape Phenotypes and Risk of Overall Breast Cancer
3.2. Body Shape Phenotypes and Risk of Breast Cancer Sub-Types
4. Discussion
5. Conclusions
Supplementary Materials
Author Contributions
Funding
Institutional Review Board Statement
Informed Consent Statement
Data Availability Statement
Acknowledgments
Conflicts of Interest
Disclaimer
References
- Ferlay, J.; Ervik, M.; Lam, F.; Colombet, M.; Mery, L.; Piñeros, M.; Znaor, A.; Soerjomataram, I.; Bray, F. Global Cancer Observatory: Cancer Today; International Agency for Research on Cancer: Lyon, France, 2020; Available online: https://gco.iarc.fr/today (accessed on 29 September 2021).
- Løberg, M.; Lousdal, M.L.; Bretthauer, M.; Kalager, M. Benefits and harms of mammography screening. Breast Cancer Res. 2015, 17, 63. [Google Scholar] [CrossRef] [PubMed]
- Thorat, M.A.; Balasubramanian, R. Breast cancer prevention in high-risk women. Best Pract. Res. Clin. Obstet. Gynaecol. 2020, 65, 18–31. [Google Scholar] [CrossRef] [PubMed]
- Mandrik, O.; Tolma, E.; Zielonke, N.; Meheus, F.; Ordóñez-Reyes, C.; Severens, J.; Murillo, R. Systematic reviews as a “lens of evidence”: Determinants of participation in breast cancer screening. J. Med. Screen. 2020, 28, 70–79. [Google Scholar] [CrossRef] [PubMed]
- Oldenburg, R.; Meijers-Heijboer, H.; Cornelisse, C.; Devilee, P. Genetic susceptibility for breast cancer: How many more genes to be found? Crit. Rev. Oncol. 2007, 63, 125–149. [Google Scholar] [CrossRef] [PubMed]
- World Cancer Research Fund; American Institute for Cancer Research. Continuous Update Project Expert Report 2018. Diet, Nutrition, Physical Activity and Breast Cancer. Available online: dietandcancerreport.org (accessed on 14 September 2021).
- Larsson, S.C.; Burgess, S. Causal role of high body mass index in multiple chronic diseases: A systematic review and meta-analysis of Mendelian randomization studies. BMC Med. 2021, 19, 320. [Google Scholar] [CrossRef]
- Zhang, B.; Shu, X.-O.; Delahanty, R.J.; Zeng, C.; Michailidou, K.; Bolla, M.K.; Wang, Q.; Dennis, J.; Wen, W.; Long, J.; et al. Height and breast cancer risk: Evidence from prospective studies and mendelian randomization. Gynecol. Oncol. 2015, 107, djv219. [Google Scholar] [CrossRef]
- Ried, J.S.; Jeff, M.J.; Chu, A.Y.; Bragg-Gresham, J.L.; van Dongen, J.; Huffman, J.E.; Ahluwalia, T.S.; Cadby, G.; Eklund, N.; Eriksson, J.; et al. A principal component meta-analysis on multiple anthropometric traits identifies novel loci for body shape. Nat. Commun. 2016, 7, 13357. [Google Scholar] [CrossRef]
- Sedlmeier, A.M.; Viallon, V.; Ferrari, P.; Peruchet-Noray, L.; Fontvieille, E.; Amadou, A.; Khoei, N.S.; Weber, A.; Baurecht, H.; Heath, A.K.; et al. Body shape phenotypes of multiple anthropometric traits and cancer risk: A multi-national cohort study. Br. J. Cancer 2022. [Google Scholar] [CrossRef]
- Smith, G.D.; Ebrahim, S. “Mendelian randomization”: Can genetic epidemiology contribute to understanding environmental determinants of disease? Int. J. Epidemiol. 2003, 32, 1–22. [Google Scholar] [CrossRef]
- Zhang, H.; Ahearn, T.U.; Lecarpentier, J.; Barnes, D.; Beesley, J.; Qi, G.; Jiang, X.; O’Mara, T.A.; Zhao, N.; Bolla, M.K.; et al. Genome-wide association study identifies 32 novel breast cancer susceptibility loci from overall and subtype-specific analyses. Nat. Genet. 2020, 52, 572–581. [Google Scholar] [CrossRef]
- Skrivankova, V.W.; Richmond, R.C.; Woolf, B.A.R.; Davies, N.M.; Swanson, S.A.; VanderWeele, T.J.; Timpson, N.J.; Higgins, J.P.T.; Dimou, N.; Langenberg, C.; et al. Strengthening the reporting of observational studies in epidemiology using mendelian randomisation (STROBE-MR): Explanation and elaboration. BMJ 2021, 375, n2233. [Google Scholar] [CrossRef] [PubMed]
- Skrivankova, V.W.; Richmond, R.C.; Woolf, B.A.R.; Yarmolinsky, J.; Davies, N.M.; Swanson, S.A.; VanderWeele, T.J.; Higgins, J.P.T.; Timpson, N.J.; Dimou, N.; et al. Strengthening the reporting of observational studies in epidemiology using mendelian randomization: The STROBE-MR Statement. JAMA 2021, 326, 1614. [Google Scholar] [CrossRef] [PubMed]
- Lawlor, D.A.; Harbord, R.M.; Sterne, J.A.C.; Timpson, N.; Smith, G.D. Mendelian randomization: Using genes as instruments for making causal inferences in epidemiology. Stat. Med. 2008, 27, 1133–1163. [Google Scholar] [CrossRef] [PubMed]
- Didelez, V.; Sheehan, N. Mendelian randomization as an instrumental variable approach to causal inference. Stat. Methods Med. Res. 2007, 16, 309–330. [Google Scholar] [CrossRef] [PubMed]
- Burgess, S.; Scott, R.A.; Timpson, N.J.; Smith, G.D.; Thompson, S.G.; EPIC-InterAct Consortium. Using published data in Mendelian randomization: A blueprint for efficient identification of causal risk factors. Eur. J. Epidemiol. 2015, 30, 543–552. [Google Scholar] [CrossRef]
- Burgess, S.; Butterworth, A.; Thompson, S.G. Mendelian randomization analysis with multiple genetic variants using summarized data. Genet. Epidemiol. 2013, 37, 658–665. [Google Scholar] [CrossRef]
- Dimou, N.L.; Tsilidis, K.K. A primer in mendelian randomization methodology with a focus on utilizing published summary association data. Genet. Epidemiol. Methods Protoc. 2018, 1793, 211–230. [Google Scholar] [CrossRef]
- MacArthur, J.; Bowler-Barnett, E.; Cerezo, M.; Gil, L.; Hall, P.; Hastings, E.; Junkins, H.; McMahon, A.; Milano, A.; Morales, J.; et al. The new NHGRI-EBI Catalog of published genome-wide association studies (GWAS Catalog). Nucleic Acids Res. 2016, 45, D896–D901. [Google Scholar] [CrossRef]
- Staley, J.R.; Blackshaw, J.; Kamat, M.A.; Ellis, S.; Surendran, P.; Sun, B.B.; Paul, D.S.; Freitag, D.; Burgess, S.; Danesh, J.; et al. PhenoScanner: A database of human genotype–phenotype associations. Bioinformatics 2016, 32, 3207–3209. [Google Scholar] [CrossRef]
- Higgins, J.P.T.; Thompson, S.G.; Deeks, J.J.; Altman, D.G. Measuring inconsistency in meta-analyses. BMJ 2003, 327, 557–560. [Google Scholar] [CrossRef]
- Pagoni, P.; Dimou, N.L.; Murphy, N.; Stergiakouli, E. Using Mendelian randomisation to assess causality in observational studies. Evid. Based Ment. Health 2019, 22, 67–71. [Google Scholar] [CrossRef] [PubMed]
- Bowden, J.; Del Greco, M.F.; Minelli, C.; Davey Smith, G.; Sheehan, N.; Thompson, J. A framework for the investigation of pleiotropy in two-sample summary data Mendelian randomization. Stat. Med. 2017, 36, 1783–1802. [Google Scholar] [CrossRef] [PubMed]
- Bowden, J.; Davey Smith, G.; Burgess, S. Mendelian randomization with invalid instruments: Effect estimation and bias detection through Egger regression. Int. J. Epidemiol. 2015, 44, 512–525. [Google Scholar] [CrossRef] [PubMed]
- Bowden, J.; Smith, G.D.; Haycock, P.C.; Burgess, S. Consistent Estimation in Mendelian Randomization with Some Invalid Instruments Using a Weighted Median Estimator. Genet. Epidemiol. 2016, 40, 304–314. [Google Scholar] [CrossRef]
- Bowden, J.; Del Greco, M.F.; Minelli, C.; Smith, G.D.; Sheehan, N.A.; Thompson, J.R. Assessing the suitability of summary data for two-sample Mendelian randomization analyses using MR-Egger regression: The role of the I2 statistic. Leuk. Res. 2016, 45, 1961–1974. [Google Scholar] [CrossRef]
- Verbanck, M.; Chen, C.-Y.; Neale, B.; Do, R. Detection of widespread horizontal pleiotropy in causal relationships inferred from Mendelian randomization between complex traits and diseases. Nat. Genet. 2018, 50, 693–698. [Google Scholar] [CrossRef]
- Yavorska, O.O.; Burgess, S. MendelianRandomization: An R package for performing Mendelian randomization analyses using summarized data. Leuk. Res. 2017, 46, 1734–1739. [Google Scholar] [CrossRef]
- Guo, Y.; Andersen, S.W.; Shu, X.-O.; Michailidou, K.; Bolla, M.K.; Wang, Q.; Garcia-Closas, M.; Milne, R.L.; Schmidt, M.K.; Chang-Claude, J.; et al. Genetically predicted body mass index and breast cancer risk: Mendelian randomization analyses of data from 145,000 women of european descent. PLoS Med. 2016, 13, e1002105. [Google Scholar] [CrossRef]
- Ooi, B.N.S.; Loh, H.; Ho, P.J.; Milne, R.L.; Giles, G.; Gao, C.; Kraft, P.; John, E.M.; Swerdlow, A.; Brenner, H.; et al. The genetic interplay between body mass index, breast size and breast cancer risk: A Mendelian randomization analysis. Leuk. Res. 2019, 48, 781–794. [Google Scholar] [CrossRef]
- Gao, C.; Patel, C.J.; Michailidou, K.; Peters, U.; Gong, J.; Schildkraut, J.; Schumacher, F.R.; Zheng, W.; Boffetta, P.; Stucker, I.; et al. Mendelian randomization study of adiposity-related traits and risk of breast, ovarian, prostate, lung and colorectal cancer. Leuk. Res. 2016, 45, 896–908. [Google Scholar] [CrossRef]
- Shu, X.; Wu, L.; Khankari, N.K.; Shu, X.-O.; Wang, T.J.; Michailidou, K.; Bolla, M.K.; Wang, Q.; Dennis, J.; Milne, R.L.; et al. Associations of obesity and circulating insulin and glucose with breast cancer risk: A Mendelian randomization analysis. Leuk. Res. 2018, 48, 795–806. [Google Scholar] [CrossRef] [PubMed]
- Recalde, M.; Davila-Batista, V.; Díaz, Y.; Leitzmann, M.; Romieu, I.; Freisling, H.; Duarte-Salles, T. Body mass index and waist circumference in relation to the risk of 26 types of cancer: A prospective cohort study of 3.5 million adults in Spain. BMC Med. 2021, 19, 10. [Google Scholar] [CrossRef] [PubMed]
- Richardson, T.G.; Sanderson, E.; Elsworth, B.; Tilling, K.; Smith, G.D. Use of genetic variation to separate the effects of early and later life adiposity on disease risk: Mendelian randomisation study. BMJ 2020, 369, m1203. [Google Scholar] [CrossRef] [PubMed]
- Baer, H.J.; Tworoger, S.; Hankinson, S.E.; Willett, W.C. Body fatness at young ages and risk of breast cancer throughout life. Am. J. Epidemiol. 2010, 171, 1183–1194. [Google Scholar] [CrossRef]
- Yang, T.O.; Cairns, B.J.; Pirie, K.; Green, J.; Beral, V.; Floud, S.; Reeves, G.K. Body size in early life and the risk of postmenopausal breast cancer. BMC Cancer 2022, 22, 232. [Google Scholar] [CrossRef]
- Baer, H.J.; Colditz, G.A.; Rosner, B.; Michels, K.B.; Rich-Edwards, J.W.; Hunter, D.J.; Willett, W.C. Body fatness during childhood and adolescence and incidence of breast cancer in premenopausal women: A prospective cohort study. Breast Cancer Res. 2005, 7, R314. [Google Scholar] [CrossRef]
- Grubbs, C.J.; Farnell, D.R.; Hill, D.L.; McDonough, K.C. Chemoprevention of N-nitroso-N-methylurea-induced mammary cancers by pretreatment with 17β-estradiol and progesterone23. Gynecol. Oncol. 1985, 74, 927–931. [Google Scholar] [CrossRef]
- Picon-Ruiz, M.; Morata-Tarifa, C.; Valle-Goffin, J.J.; Friedman, E.R.; Slingerland, J.M. Obesity and adverse breast cancer risk and outcome: Mechanistic insights and strategies for intervention. CA Cancer J. Clin. 2017, 67, 378–397. [Google Scholar] [CrossRef]
- Blank, D.N.; Hermano, E.; Sonnenblick, A.; Maimon, O.; Rubinstein, A.M.; Drai, E.; Maly, B.; Vlodavsky, I.; Popovtzer, A.; Peretz, T.; et al. Macrophages upregulate estrogen receptor expression in the model of obesity-associated breast carcinoma. Cells 2022, 11, 2844. [Google Scholar] [CrossRef]
- Fichman, V.; Costa, R.D.S.S.D.; Miglioli, T.C.; Marinheiro, L.P.F. Association of obesity and anovulatory infertility. Einstein 2020, 18, eAO5150. [Google Scholar] [CrossRef]
- Lai, F.Y.; Nath, M.; Hamby, S.E.; Thompson, J.R.; Nelson, C.; Samani, N.J. Adult height and risk of 50 diseases: A combined epidemiological and genetic analysis. BMC Med. 2018, 16, 187. [Google Scholar] [CrossRef] [PubMed]
- Chen, G.-C.; Chen, S.-J.; Zhang, R.; Hidayat, K.; Qin, J.-B.; Zhang, Y.-S.; Qin, L.-Q. Central obesity and risks of pre- and postmenopausal breast cancer: A dose-response meta-analysis of prospective studies. Obes. Rev. 2016, 17, 1167–1177. [Google Scholar] [CrossRef] [PubMed]
- Subramani, R.; Nandy, S.B.; Pedroza, D.A.; Lakshmanaswamy, R. Role of growth hormone in breast cancer. Endocrinology 2017, 158, 1543–1555. [Google Scholar] [CrossRef] [PubMed]
- Ménard, S.; Balsari, A.; Casalini, P.; Tagliabue, E.; Campiglio, M.; Bufalino, R.; Cascinelli, N. HER-2-positive breast carcinomas as a particular subset with peculiar clinical behaviors. Clin. Cancer Res. 2002, 8, 520–525. [Google Scholar]
- Balsari, A.; Casalini, P.; Bufalino, R.; Berrino, F.; Ménard, S. Role of hormonal risk factors in HER2-positive breast carcinomas. Br. J. Cancer 2003, 88, 1032–1034. [Google Scholar] [CrossRef]
- Pingault, J.-B.; O’Reilly, P.F.; Schoeler, T.; Ploubidis, G.B.; Rijsdijk, F.; Dudbridge, F. Using genetic data to strengthen causal inference in observational research. Nat. Rev. Genet. 2018, 19, 566–580. [Google Scholar] [CrossRef]
- Brumpton, B.; Sanderson, E.; Heilbron, K.; Hartwig, F.P.; Harrison, S.; Vie, G.; Cho, Y.; Howe, L.D.; Hughes, A.; Boomsma, D.I.; et al. Avoiding dynastic, assortative mating, and population stratification biases in Mendelian randomization through within-family analyses. Nat. Commun. 2020, 11, 3519. [Google Scholar] [CrossRef]


Disclaimer/Publisher’s Note: The statements, opinions and data contained in all publications are solely those of the individual author(s) and contributor(s) and not of MDPI and/or the editor(s). MDPI and/or the editor(s) disclaim responsibility for any injury to people or property resulting from any ideas, methods, instructions or products referred to in the content. |
© 2023 by the authors. Licensee MDPI, Basel, Switzerland. This article is an open access article distributed under the terms and conditions of the Creative Commons Attribution (CC BY) license (https://creativecommons.org/licenses/by/4.0/).
Share and Cite
Peruchet-Noray, L.; Dimou, N.; Sedlmeier, A.M.; Fervers, B.; Romieu, I.; Viallon, V.; Ferrari, P.; Gunter, M.J.; Carreras-Torres, R.; Freisling, H. Body Shape Phenotypes and Breast Cancer Risk: A Mendelian Randomization Analysis. Cancers 2023, 15, 1296. https://doi.org/10.3390/cancers15041296
Peruchet-Noray L, Dimou N, Sedlmeier AM, Fervers B, Romieu I, Viallon V, Ferrari P, Gunter MJ, Carreras-Torres R, Freisling H. Body Shape Phenotypes and Breast Cancer Risk: A Mendelian Randomization Analysis. Cancers. 2023; 15(4):1296. https://doi.org/10.3390/cancers15041296
Chicago/Turabian StylePeruchet-Noray, Laia, Niki Dimou, Anja M. Sedlmeier, Béatrice Fervers, Isabelle Romieu, Vivian Viallon, Pietro Ferrari, Marc J. Gunter, Robert Carreras-Torres, and Heinz Freisling. 2023. "Body Shape Phenotypes and Breast Cancer Risk: A Mendelian Randomization Analysis" Cancers 15, no. 4: 1296. https://doi.org/10.3390/cancers15041296
APA StylePeruchet-Noray, L., Dimou, N., Sedlmeier, A. M., Fervers, B., Romieu, I., Viallon, V., Ferrari, P., Gunter, M. J., Carreras-Torres, R., & Freisling, H. (2023). Body Shape Phenotypes and Breast Cancer Risk: A Mendelian Randomization Analysis. Cancers, 15(4), 1296. https://doi.org/10.3390/cancers15041296