CD39-Expressing CD8+ T Cells as a New Molecular Marker for Diagnosis and Prognosis of Esophageal Squamous Cell Carcinoma
Abstract
Simple Summary
Abstract
1. Introduction
2. Materials and Methods
2.1. Patient Information
2.2. Multiplex Immunohistochemistry (mIHC) Test
2.3. Random Grouping and Determination of Optimal Cut-Off Values
2.4. Construction and Validation of the Nomogram
2.5. Risk Stratification
2.6. Differential Gene Expression Analysis
2.7. Immune Infiltration in the TME
2.8. Statistical Analysis
3. Results
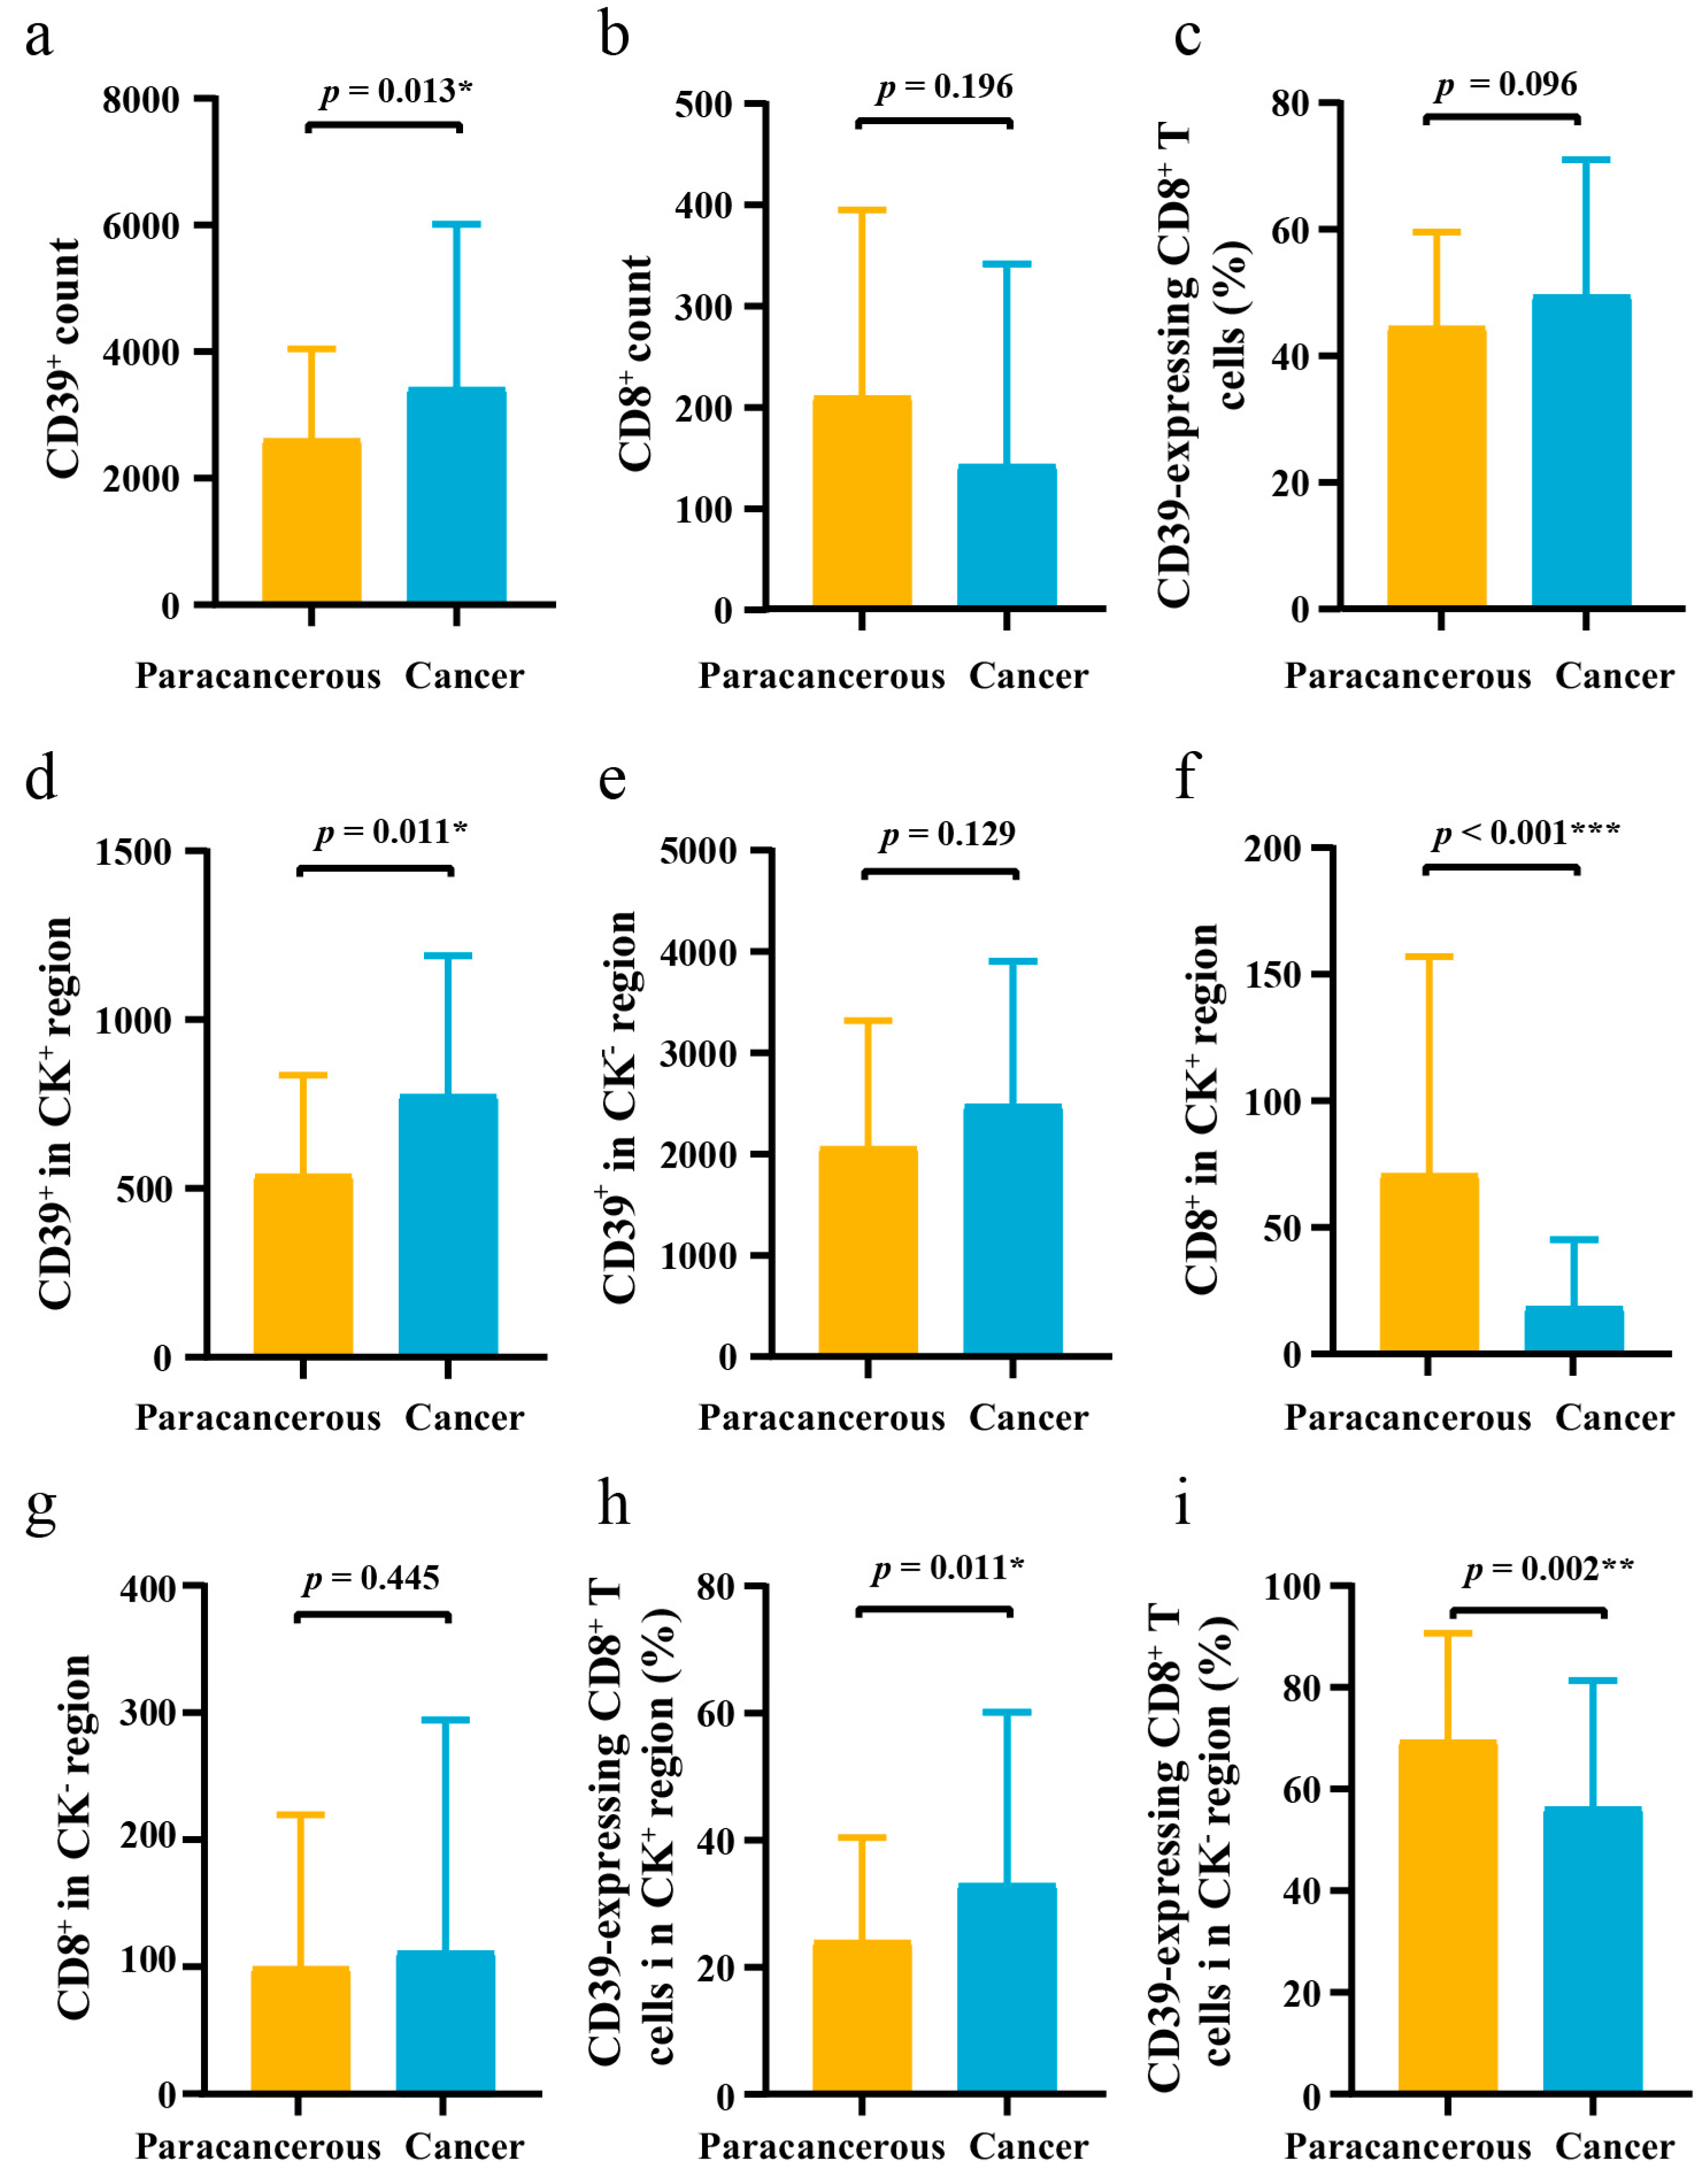
3.1. Differences in the Expression of CD39 in ESCC Cancer and Paracancerous Tissues
3.2. Clinical Characteristics of 95 ESCC Patients
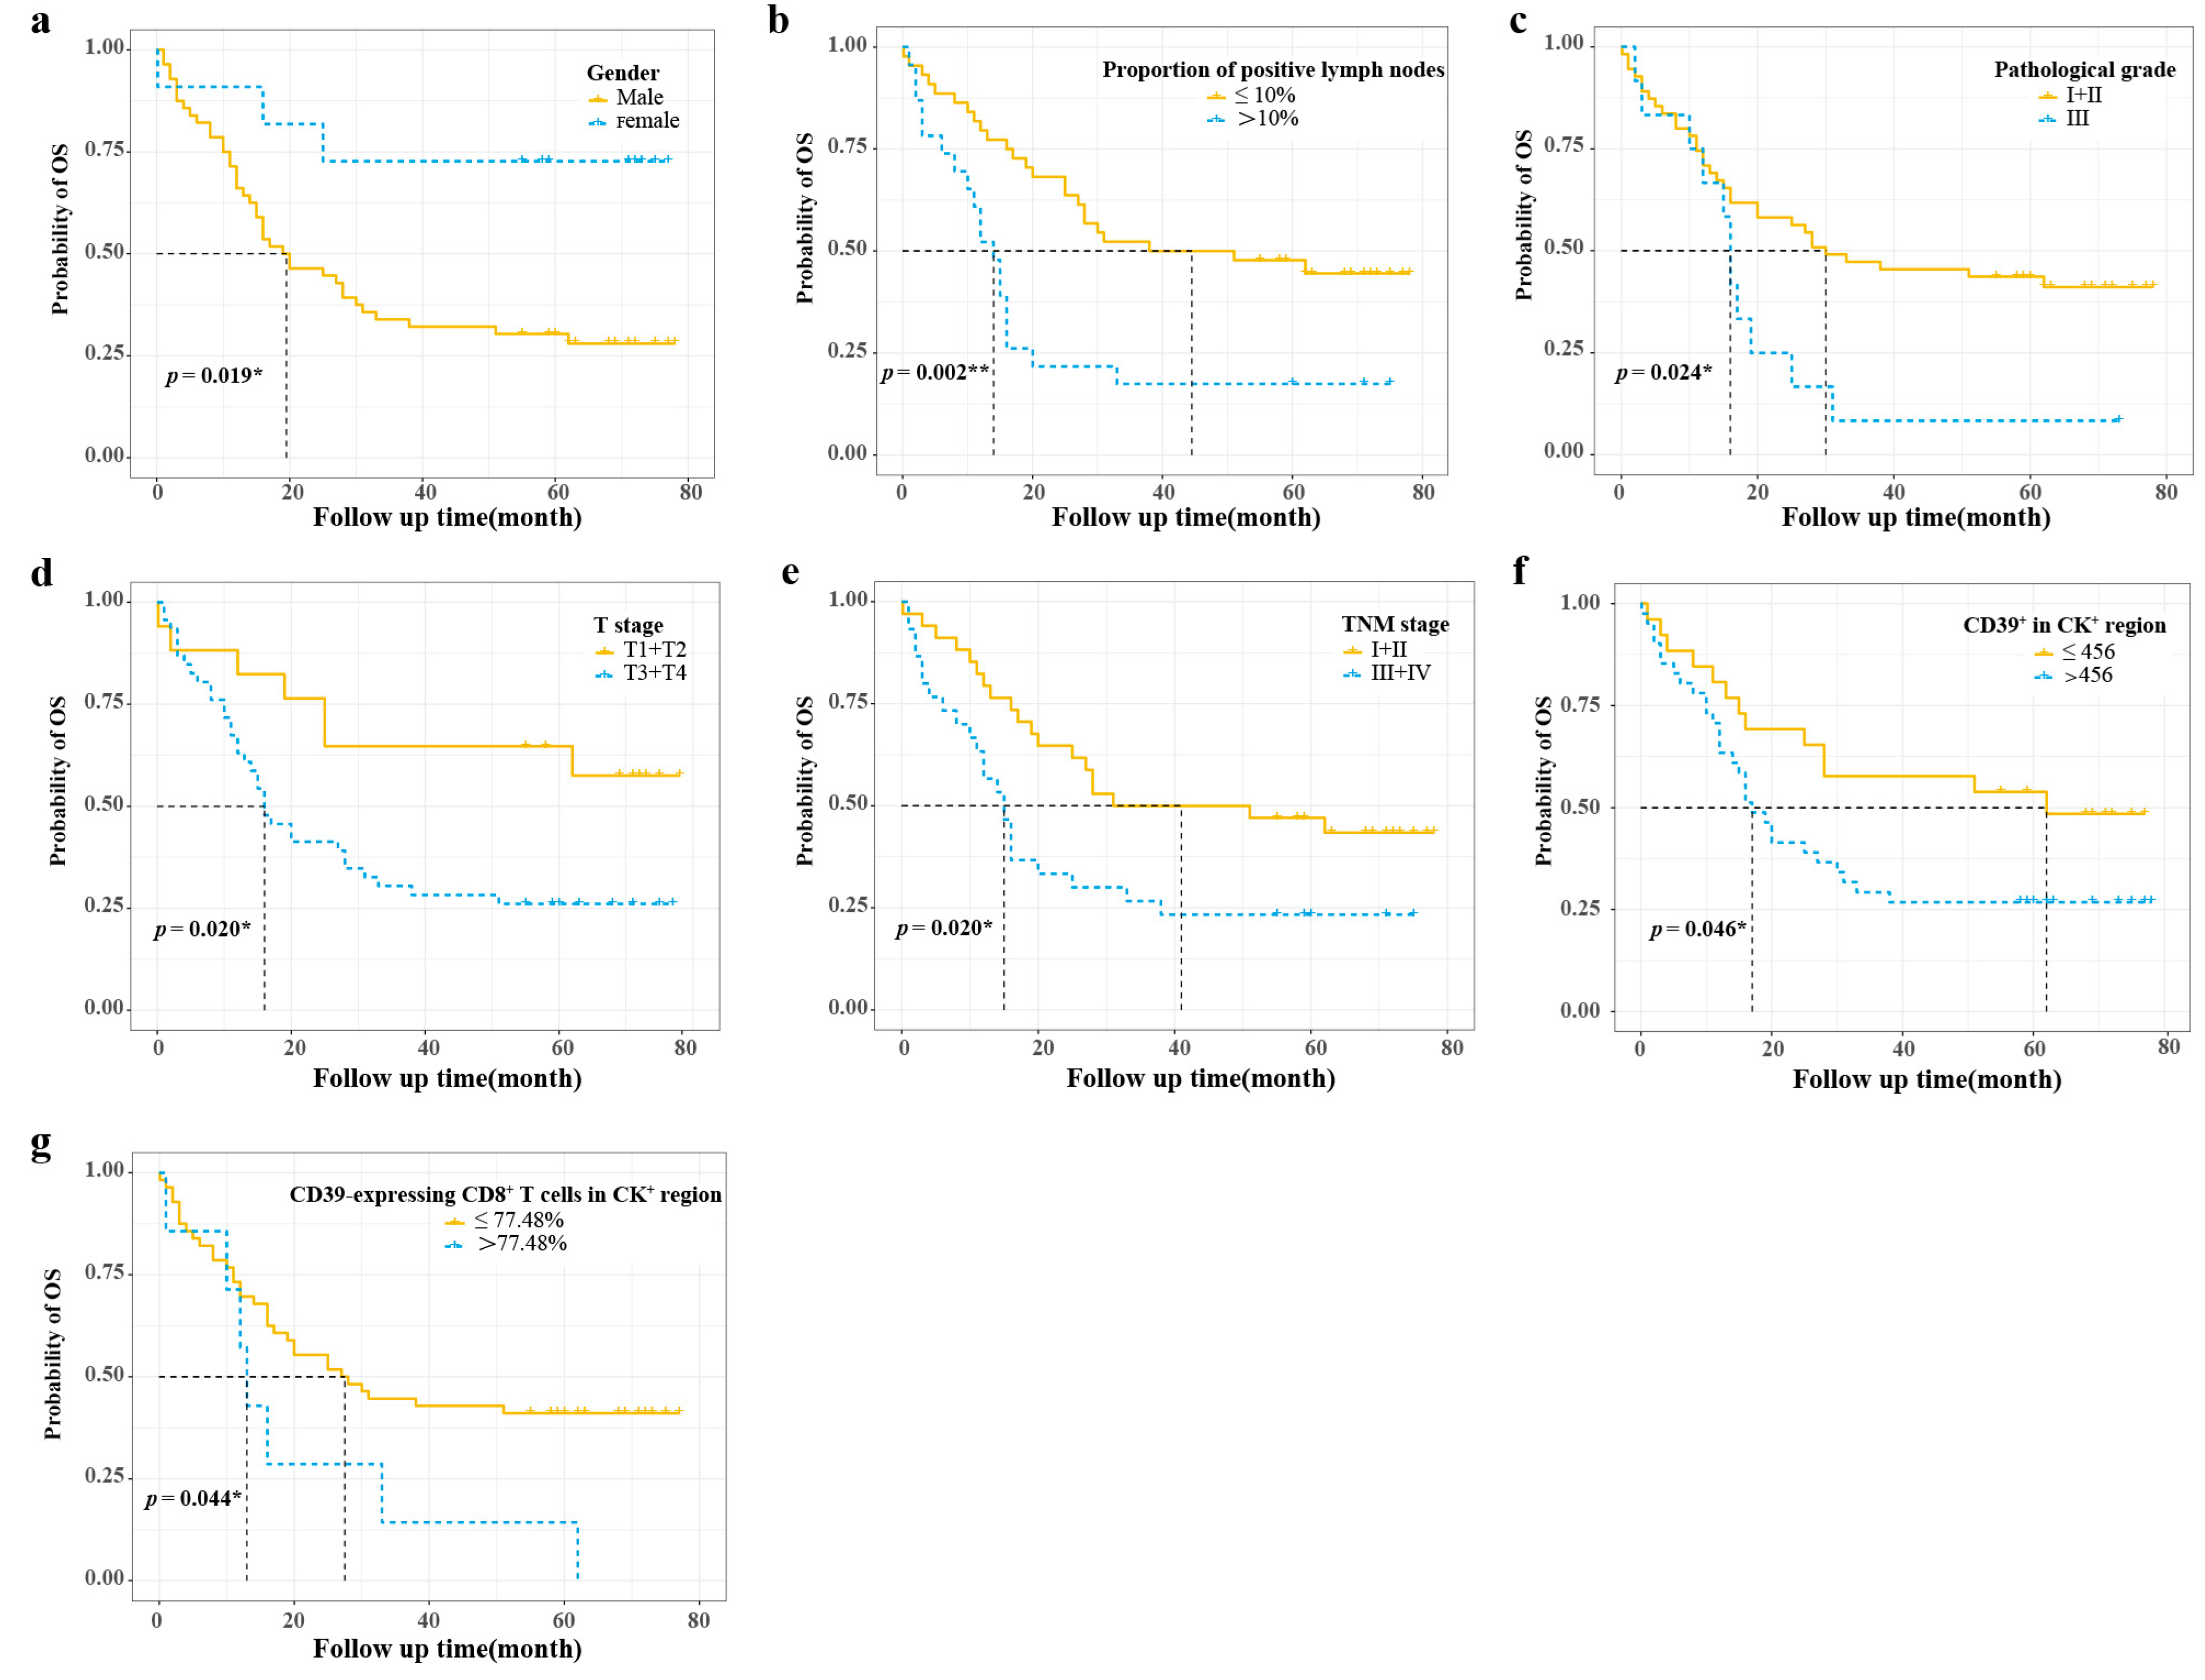
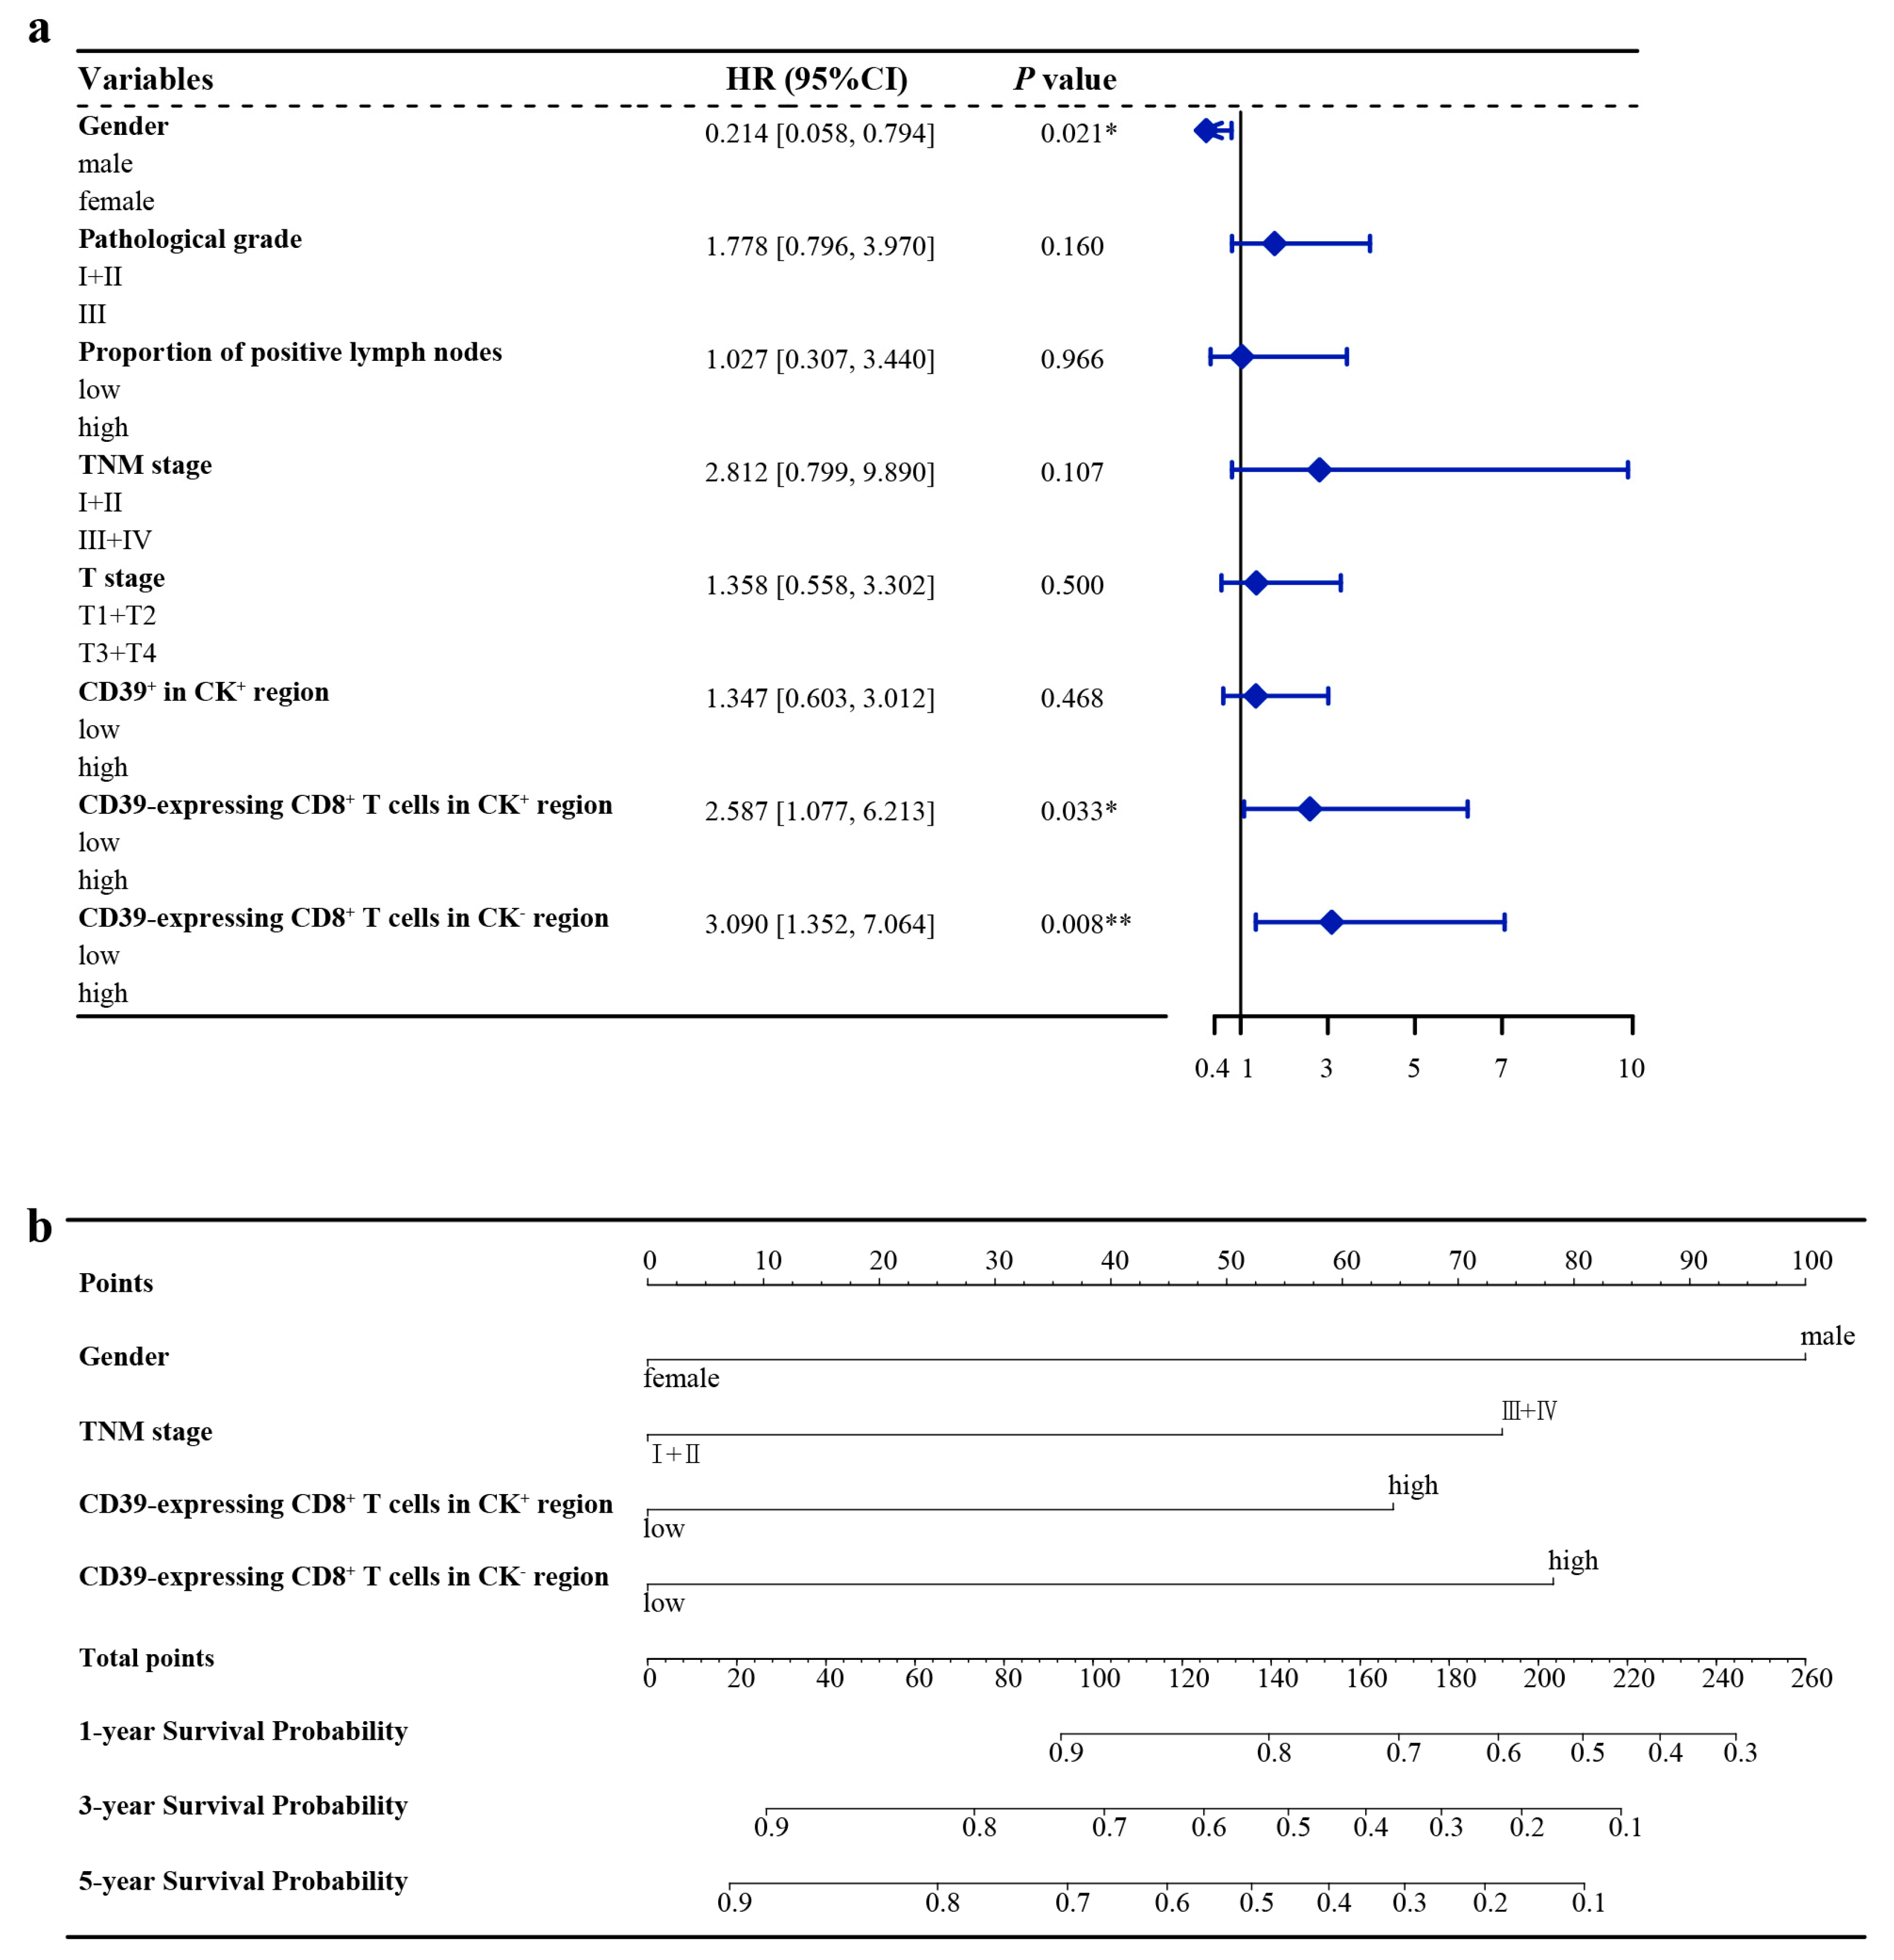
3.3. Optimal Cut-Off Values and Cox Regression Analysis of the Training Group
3.4. Nomogram Construction
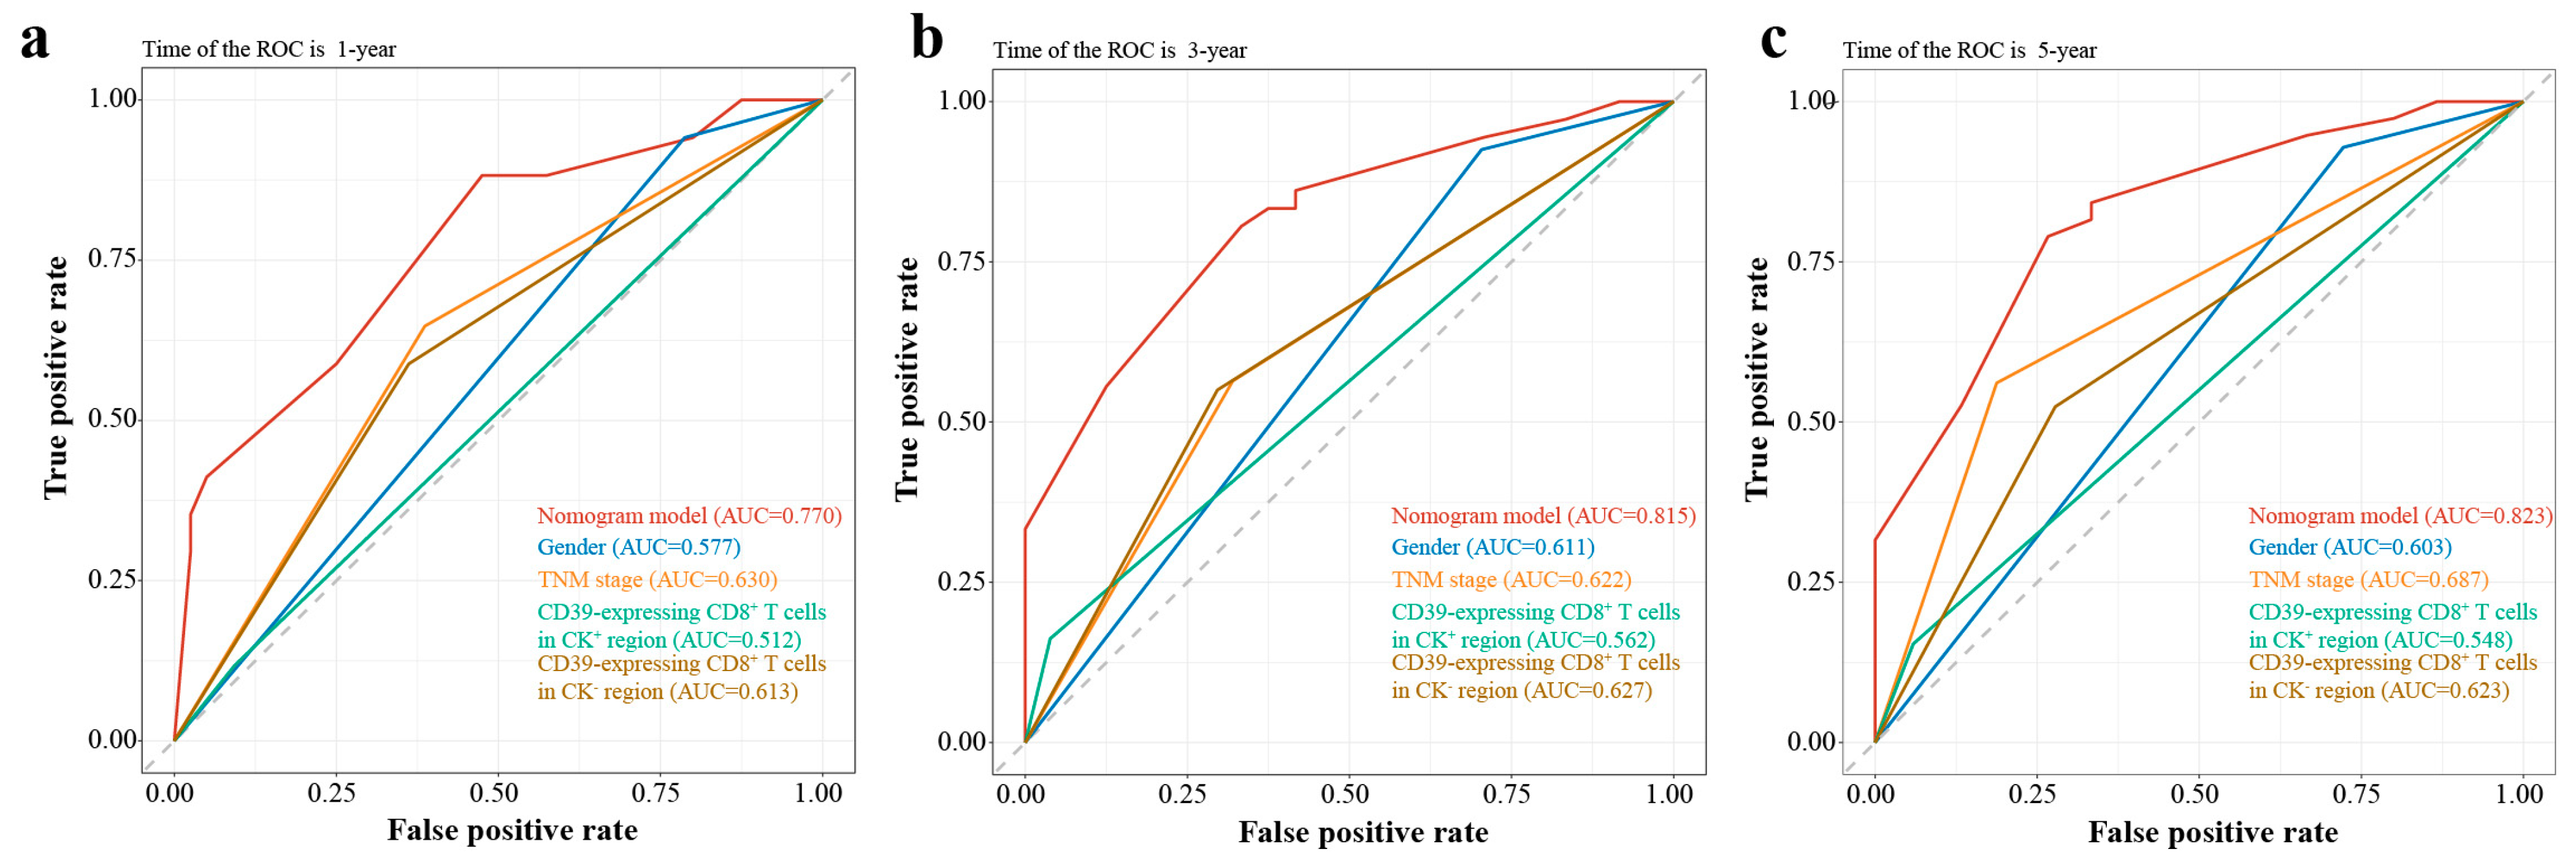
3.5. Nomogram Validation
3.6. Risk Stratification
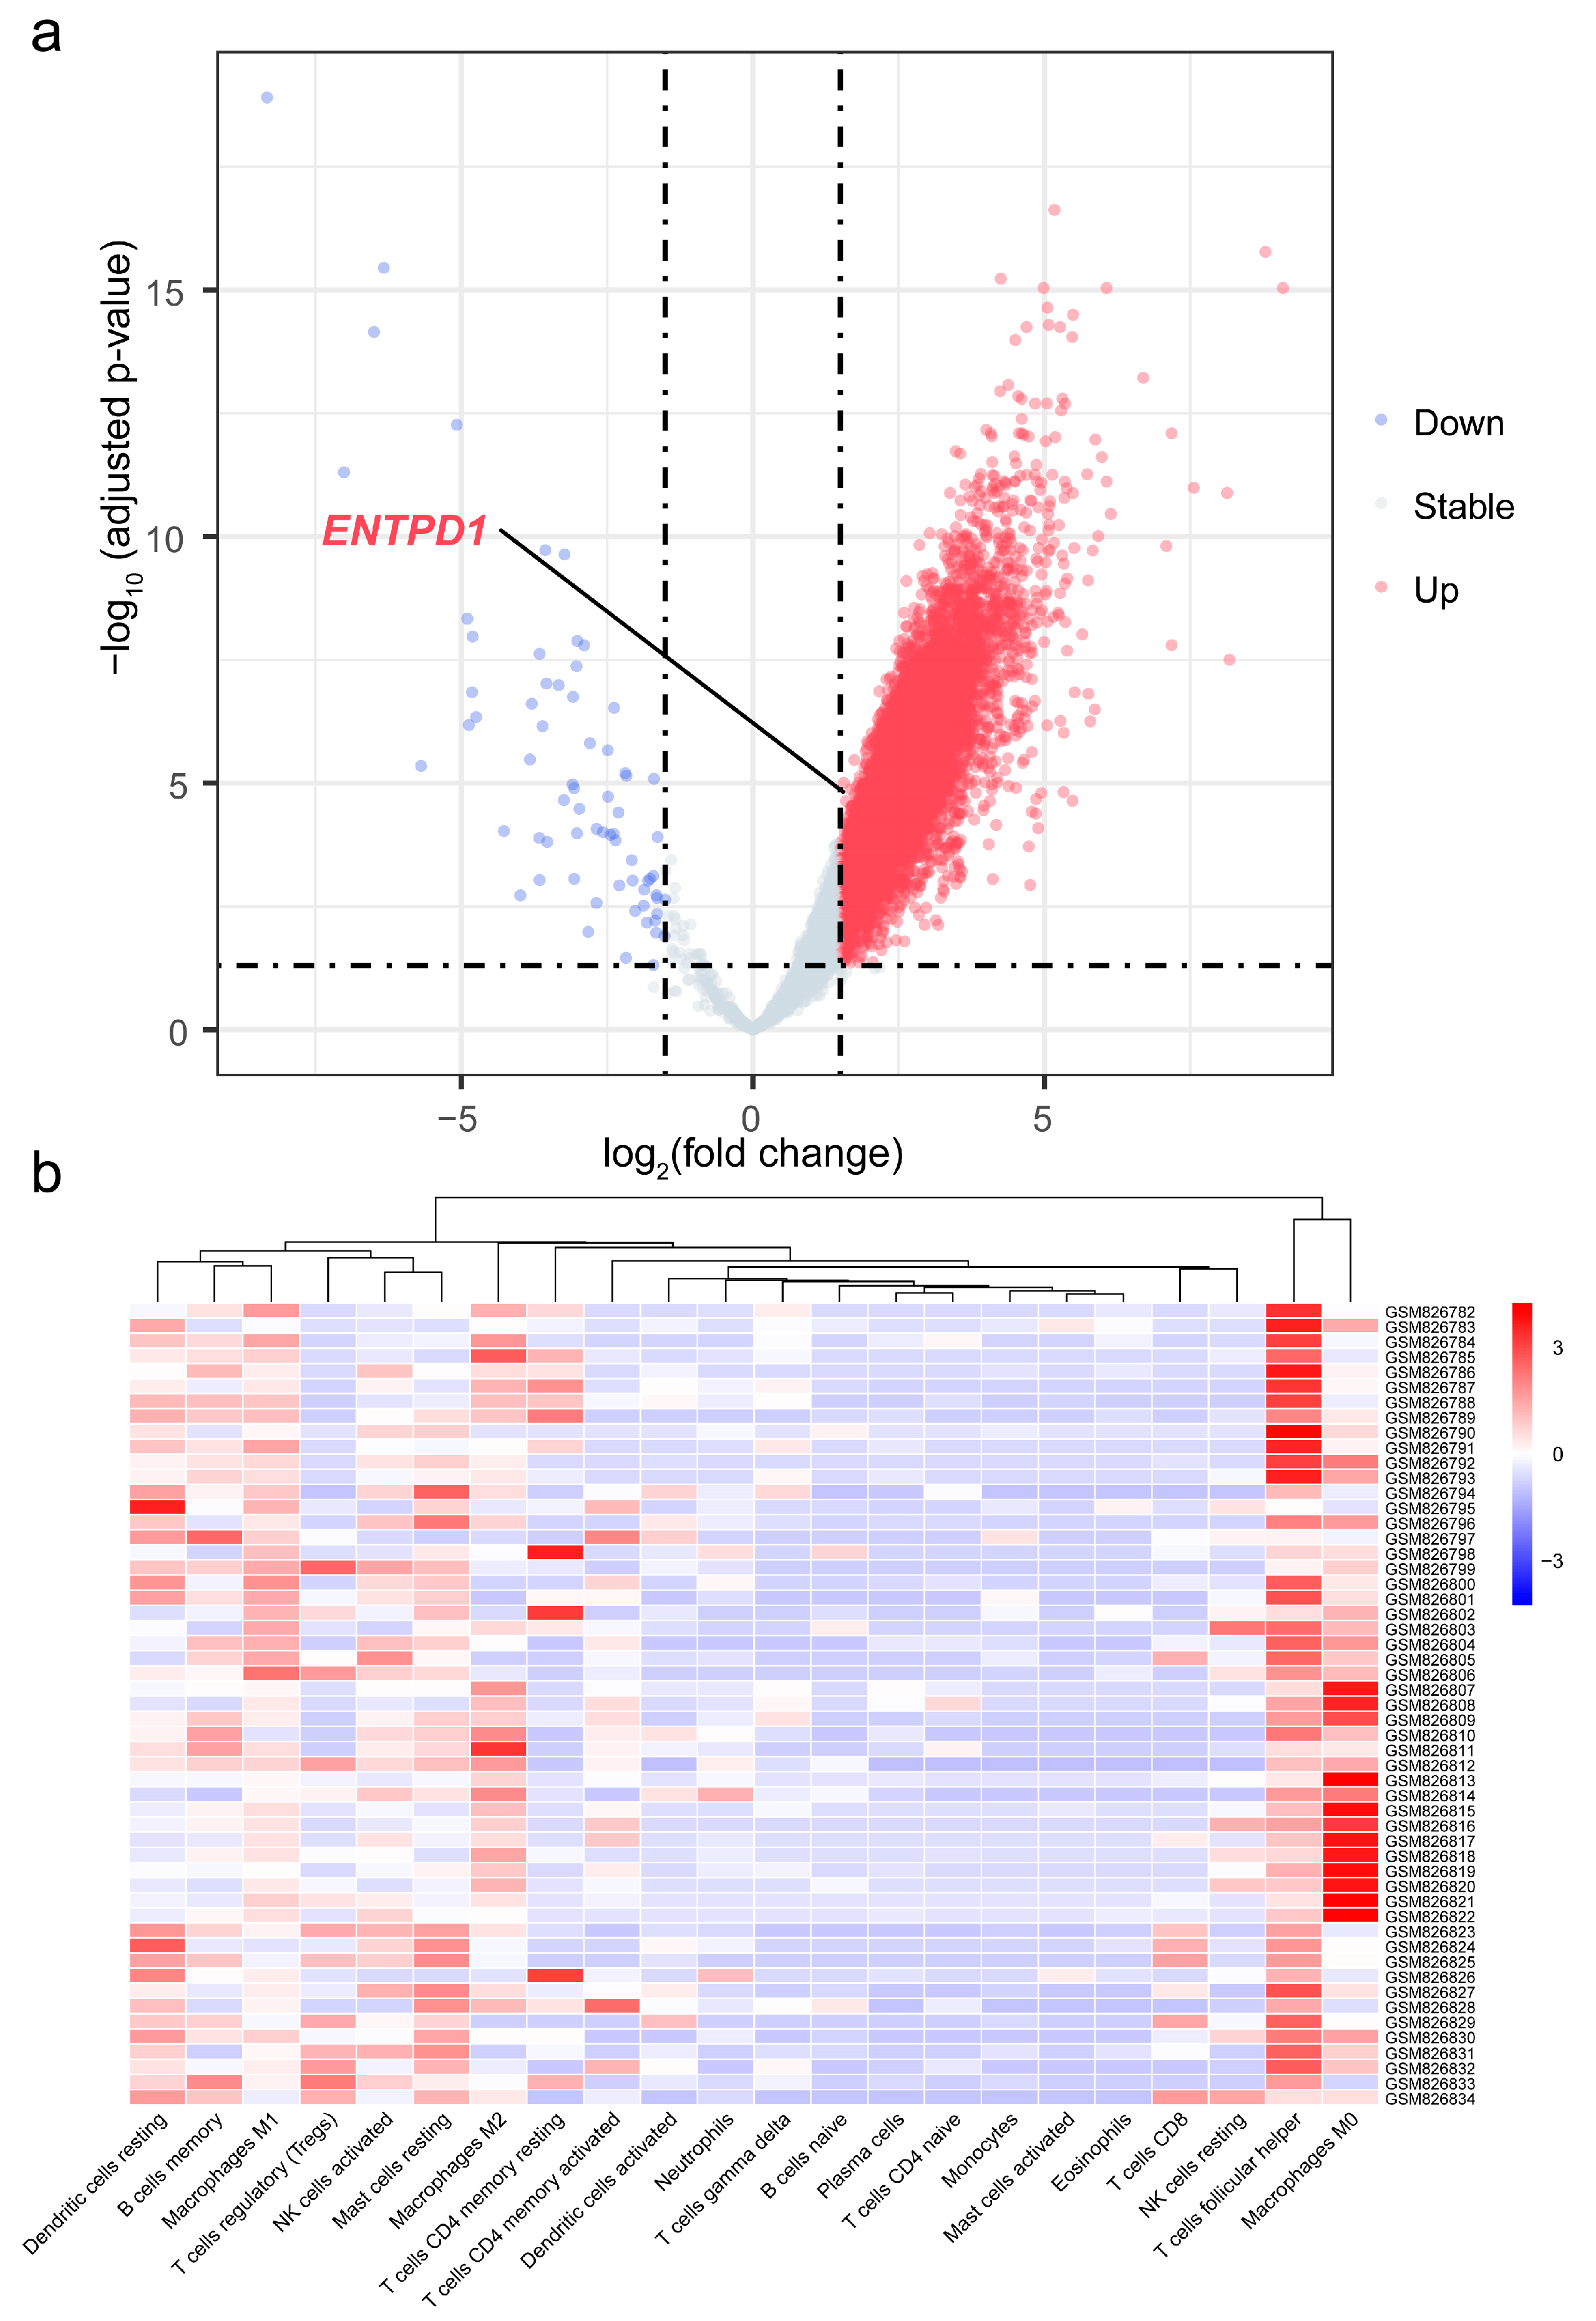
3.7. Differential Expression of ENTPD1 between ESCC and Normal Tissues
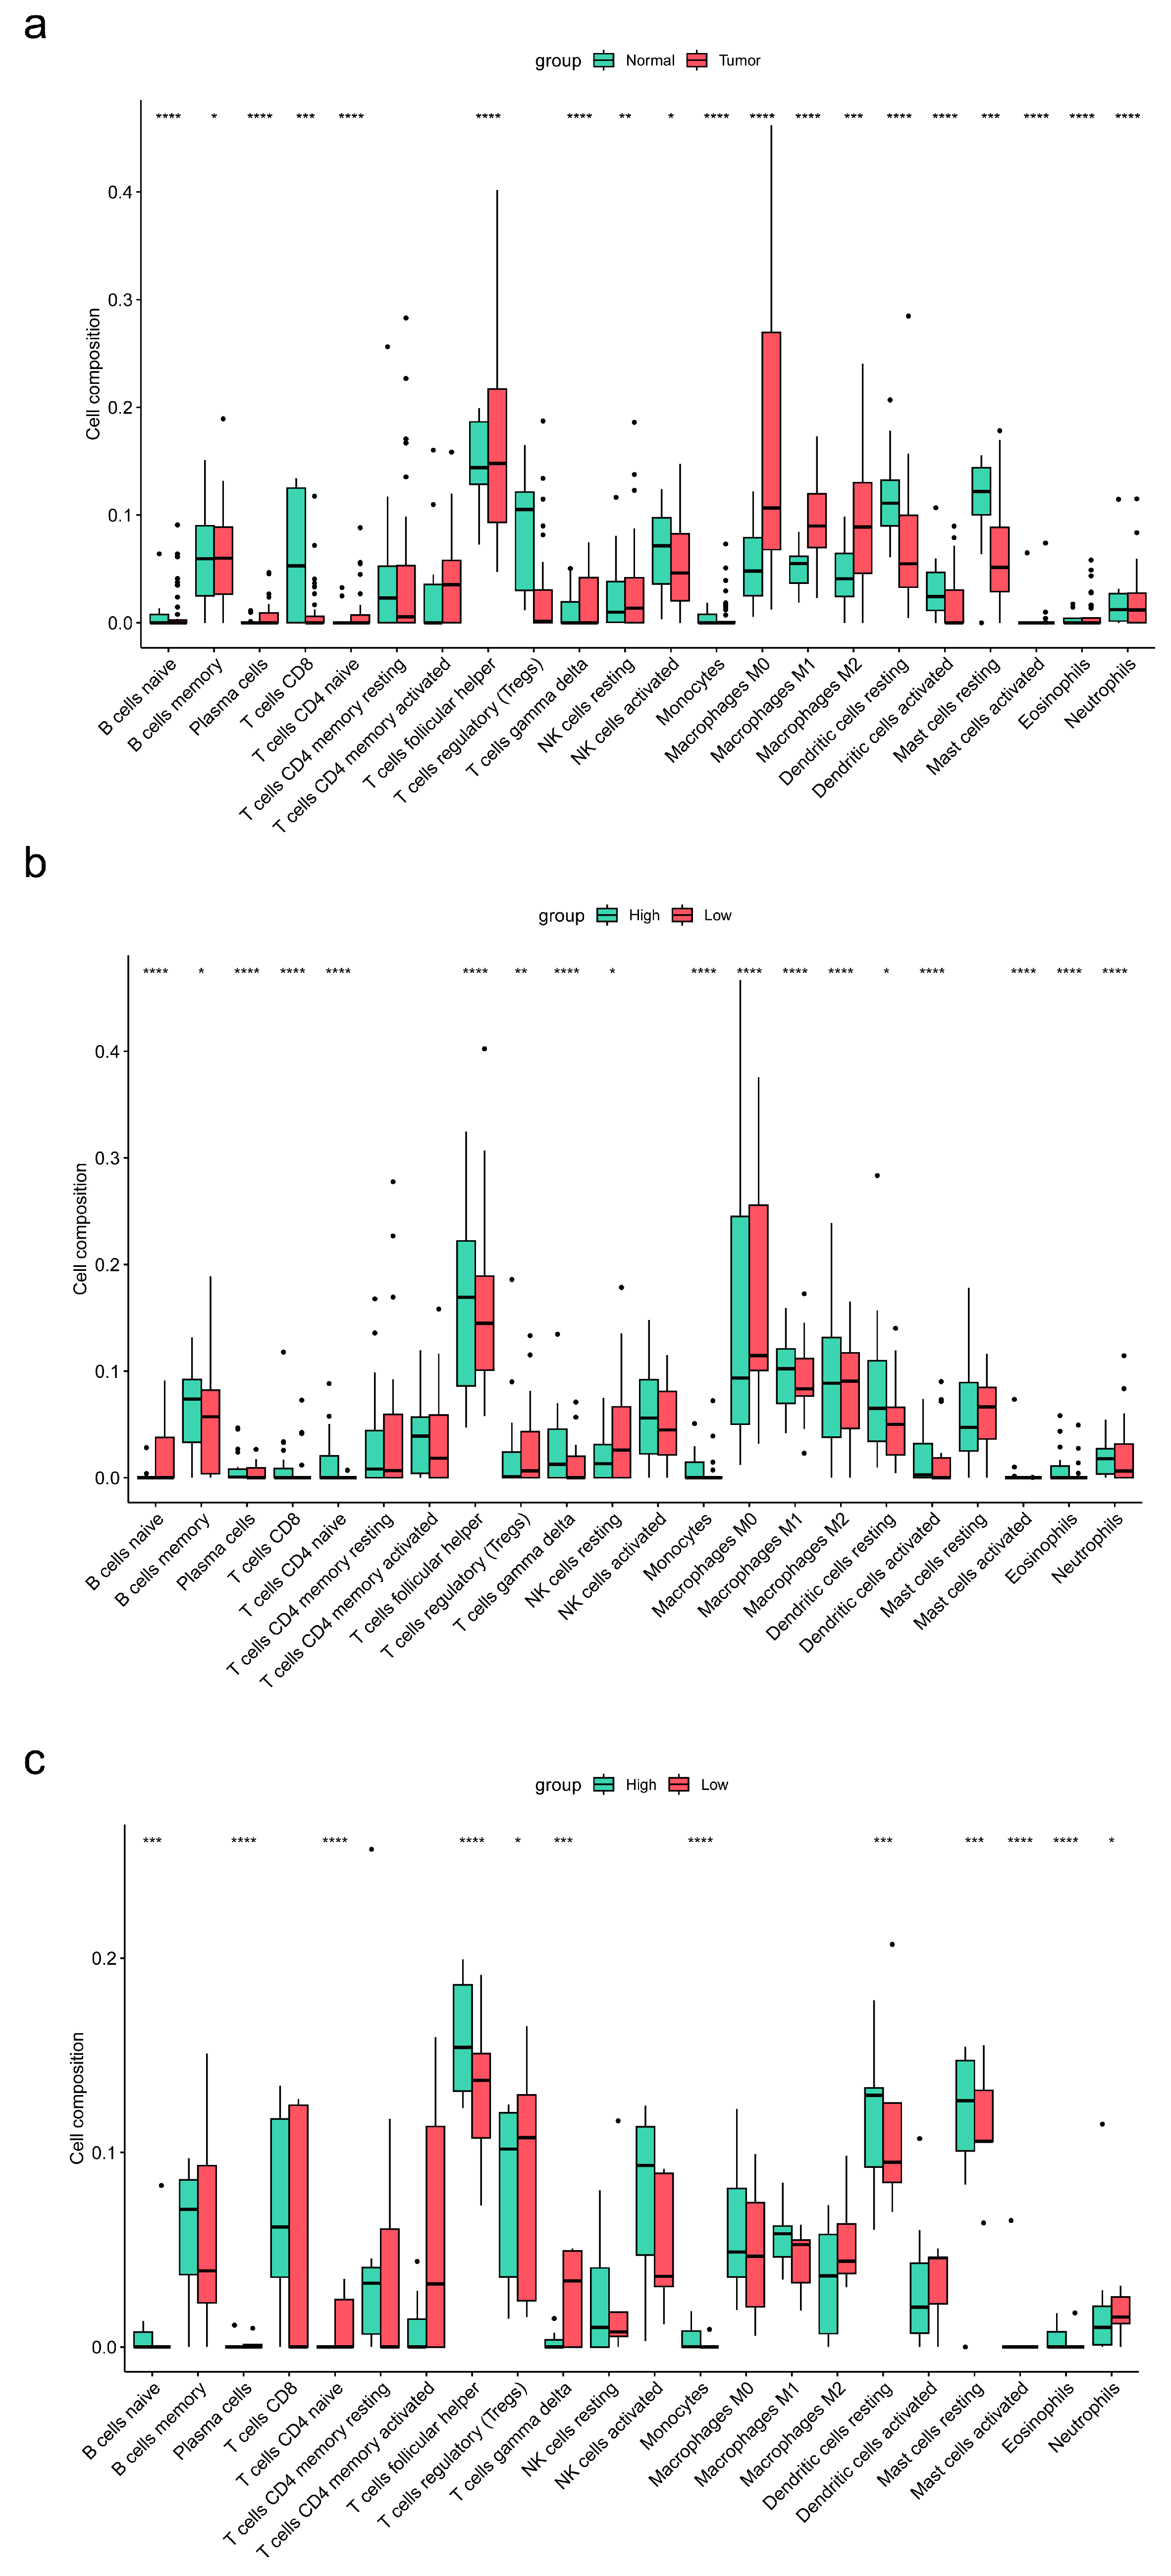
3.8. Association of ENTPD1 Expression with Immune Infiltration in TME of Esophageal Carcinoma
4. Discussion
5. Conclusions
Supplementary Materials
Author Contributions
Funding
Institutional Review Board Statement
Informed Consent Statement
Data Availability Statement
Acknowledgments
Conflicts of Interest
References
- Sung, H.; Ferlay, J.; Siegel, R.L.; Laversanne, M.; Soerjomataram, I.; Jemal, A.; Bray, F. Global Cancer Statistics 2020: GLOBOCAN Estimates of Incidence and Mortality Worldwide for 36 Cancers in 185 Countries. CA A Cancer J. Clin. 2021, 71, 209–249. [Google Scholar] [CrossRef] [PubMed]
- Pennathur, A.; Gibson, M.K.; Jobe, B.A.; Luketich, J.D. Oesophageal carcinoma. Lancet 2013, 381, 400–412. [Google Scholar] [CrossRef] [PubMed]
- Yang, R.; Elsaadi, S.; Misund, K.; Abdollahi, P.; Vandsemb, E.N.; Moen, S.H.; Kusnierczyk, A.; Slupphaug, G.; Standal, T.; Waage, A.; et al. Conversion of ATP to adenosine by CD39 and CD73 in multiple myeloma can be successfully targeted together with adenosine receptor A2A blockade. J. Immunother. Cancer 2020, 8, e000610. [Google Scholar] [CrossRef]
- Allard, B.; Allard, D.; Buisseret, L.; Stagg, J. The adenosine pathway in immuno-oncology. Nat. Rev. Clin. Oncol. 2020, 17, 611–629. [Google Scholar] [CrossRef]
- Tallón de Lara, P.; Castañón, H.; Vermeer, M.; Núñez, N.; Silina, K.; Sobottka, B.; Urdinez, J.; Cecconi, V.; Yagita, H.; Movahedian Attar, F.; et al. CD39(+)PD-1(+)CD8(+) T cells mediate metastatic dormancy in breast cancer. Nat. Commun. 2021, 12, 769. [Google Scholar] [CrossRef] [PubMed]
- Canale, F.P.; Ramello, M.C.; Núñez, N.; Araujo Furlan, C.L.; Bossio, S.N.; Gorosito Serrán, M.; Tosello Boari, J.; Del Castillo, A.; Ledesma, M.; Sedlik, C.; et al. CD39 Expression Defines Cell Exhaustion in Tumor-Infiltrating CD8(+) T Cells. Cancer Res. 2018, 78, 115–128. [Google Scholar] [CrossRef] [PubMed]
- Simoni, Y.; Becht, E.; Fehlings, M.; Loh, C.Y.; Koo, S.L.; Teng, K.W.W.; Yeong, J.P.S.; Nahar, R.; Zhang, T.; Kared, H.; et al. Bystander CD8(+) T cells are abundant and phenotypically distinct in human tumour infiltrates. Nature 2018, 557, 575–579. [Google Scholar] [CrossRef]
- Qin, G.H.; Liu, J.Y.; Lian, J.Y.; Zhang, H.Y.; Lei, Q.Y.; Yang, H.Y.; Shao, J.W.; Chen, X.F.; Zhang, B.; Zhang, Y. PMN-MDSCs-induced accumulation of CD8+CD39+T cells predicts the efficacy of chemotherapy in esophageal squamous cell carcinoma. Clin. Transl. Med. 2020, 10, e232. [Google Scholar] [CrossRef]
- Wang, Y.; Li, J.; Xia, Y.; Gong, R.; Wang, K.; Yan, Z.; Wan, X.; Liu, G.; Wu, D.; Shi, L.; et al. Prognostic nomogram for intrahepatic cholangiocarcinoma after partial hepatectomy. J. Clin. Oncol. 2013, 31, 1188–1195. [Google Scholar] [CrossRef]
- Wu, J.; Lu, L.; Chen, H.; Lin, Y.; Zhang, H.; Chen, E.; Lin, W.; Li, J.; Chen, X. Prognostic nomogram to predict the overall survival of patients with early-onset colorectal cancer: A population-based analysis. Int. J. Colorectal. Dis. 2021, 36, 1981–1993. [Google Scholar] [CrossRef]
- Balachandran, V.P.; Gonen, M.; Smith, J.J.; DeMatteo, R.P. Nomograms in oncology: More than meets the eye. Lancet Oncol. 2015, 16, e173–e180. [Google Scholar] [CrossRef]
- Rice, T.W.; Ishwaran, H.; Ferguson, M.K.; Blackstone, E.H.; Goldstraw, P. Cancer of the Esophagus and Esophagogastric Junction: An Eighth Edition Staging Primer. J. Thorac. Oncol. 2017, 12, 36–42. [Google Scholar] [CrossRef] [PubMed]
- Camp, R.L.; Dolled-Filhart, M.; Rimm, D.L. X-tile: A new bio-informatics tool for biomarker assessment and outcome-based cut-point optimization. Clin. Cancer Res. 2004, 10, 7252–7259. [Google Scholar] [CrossRef] [PubMed]
- Yan, W.; Shih, J.; Rodriguez-Canales, J.; Tangrea, M.A.; Player, A.; Diao, L.; Hu, N.; Goldstein, A.M.; Wang, J.; Taylor, P.R.; et al. Three-dimensional mRNA measurements reveal minimal regional heterogeneity in esophageal squamous cell carcinoma. Am. J. Pathol. 2013, 182, 529–539. [Google Scholar] [CrossRef] [PubMed]
- Zhou, G.; Soufan, O.; Ewald, J.; Hancock, R.E.W.; Basu, N.; Xia, J. NetworkAnalyst 3.0: A visual analytics platform for comprehensive gene expression profiling and meta-analysis. Nucleic Acids Res. 2019, 47, W234–W241. [Google Scholar] [CrossRef]
- Ru, B.; Wong, C.N.; Tong, Y.; Zhong, J.Y.; Zhong, S.S.W.; Wu, W.C.; Chu, K.C.; Wong, C.Y.; Lau, C.Y.; Chen, I.; et al. TISIDB: An integrated repository portal for tumor-immune system interactions. Bioinformatics 2019, 35, 4200–4202. [Google Scholar] [CrossRef]
- Li, T.; Fan, J.; Wang, B.; Traugh, N.; Chen, Q.; Liu, J.S.; Li, B.; Liu, X.S. TIMER: A Web Server for Comprehensive Analysis of Tumor-Infiltrating Immune Cells. Cancer Res. 2017, 77, e108–e110. [Google Scholar] [CrossRef]
- Li, T.; Fu, J.; Zeng, Z.; Cohen, D.; Li, J.; Chen, Q.; Li, B.; Liu, X.S. TIMER2.0 for analysis of tumor-infiltrating immune cells. Nucleic Acids Res. 2020, 48, W509–W514. [Google Scholar] [CrossRef]
- Tang, Z.; Kang, B.; Li, C.; Chen, T.; Zhang, Z. GEPIA2: An enhanced web server for large-scale expression profiling and interactive analysis. Nucleic Acids Res. 2019, 47, W556–W560. [Google Scholar] [CrossRef]
- Chatterjee, S.; Simonoff, J.S. Handbook of Regression Analysis; John Wiley and Sons: Hoboken, NJ, USA, 2013. [Google Scholar]
- Laumont, C.M.; Wouters, M.C.A.; Smazynski, J.; Gierc, N.S.; Chavez, E.A.; Chong, L.C.; Thornton, S.; Milne, K.; Webb, J.R.; Steidl, C.; et al. Single-cell Profiles and Prognostic Impact of Tumor-Infiltrating Lymphocytes Coexpressing CD39, CD103, and PD-1 in Ovarian Cancer. Clin. Cancer Res. 2021, 27, 4089–4100. [Google Scholar] [CrossRef]
- Gupta, P.K.; Godec, J.; Wolski, D.; Adland, E.; Yates, K.; Pauken, K.E.; Cosgrove, C.; Ledderose, C.; Junger, W.G.; Robson, S.C.; et al. CD39 Expression Identifies Terminally Exhausted CD8+ T Cells. PLoS Pathog. 2015, 11, e1005177. [Google Scholar] [CrossRef]
- Thelen, M.; Lechner, A.; Wennhold, K.; von Bergwelt-Baildon, M.; Schlößer, H.A. CD39 Expression Defines Cell Exhaustion in Tumor-Infiltrating CD8(+) T Cells-Letter. Cancer Res. 2018, 78, 5173–5174. [Google Scholar] [CrossRef] [PubMed]
- Qi, Y.; Xia, Y.; Lin, Z.; Qu, Y.; Qi, Y.; Chen, Y.; Zhou, Q.; Zeng, H.; Wang, J.; Chang, Y.; et al. Tumor-infiltrating CD39(+)CD8(+) T cells determine poor prognosis and immune evasion in clear cell renal cell carcinoma patients. Cancer Immunol. Immunother. 2020, 69, 1565–1576. [Google Scholar] [CrossRef]
- Li, X.Y.; Moesta, A.K.; Xiao, C.; Nakamura, K.; Casey, M.; Zhang, H.; Madore, J.; Lepletier, A.; Aguilera, A.R.; Sundarrajan, A.; et al. Targeting CD39 in Cancer Reveals an Extracellular ATP- and Inflammasome-Driven Tumor Immunity. Cancer Discov. 2019, 9, 1754–1773. [Google Scholar] [CrossRef] [PubMed]
- Gallerano, D.; Ciminati, S.; Grimaldi, A.; Piconese, S.; Cammarata, I.; Focaccetti, C.; Pacella, I.; Accapezzato, D.; Lancellotti, F.; Sacco, L.; et al. Genetically driven CD39 expression shapes human tumor-infiltrating CD8(+) T-cell functions. Int. J. Cancer 2020, 147, 2597–2610. [Google Scholar] [CrossRef] [PubMed]
- Yost, K.E.; Satpathy, A.T.; Wells, D.K.; Qi, Y.; Wang, C.; Kageyama, R.; McNamara, K.L.; Granja, J.M.; Sarin, K.Y.; Brown, R.A.; et al. Clonal replacement of tumor-specific T cells following PD-1 blockade. Nat. Med. 2019, 25, 1251–1259. [Google Scholar] [CrossRef] [PubMed]
- Duhen, T.; Duhen, R.; Montler, R.; Moses, J.; Moudgil, T.; de Miranda, N.F.; Goodall, C.P.; Blair, T.C.; Fox, B.A.; McDermott, J.E.; et al. Co-expression of CD39 and CD103 identifies tumor-reactive CD8 T cells in human solid tumors. Nat. Commun. 2018, 9, 2724. [Google Scholar] [CrossRef]
- Workel, H.H.; van Rooij, N.; Plat, A.; Spierings, D.C.J.; Fehrmann, R.S.N.; Nijman, H.W.; de Bruyn, M. Transcriptional Activity and Stability of CD39+CD103+CD8+ T Cells in Human High-Grade Endometrial Cancer. Int. J. Mol. Sci. 2020, 21, 3770. [Google Scholar] [CrossRef] [PubMed]
- Yang, Y.; Zhang, Y.J.; Zhu, Y.; Cao, J.Z.; Yuan, Z.Y.; Xu, L.M.; Wu, J.X.; Wang, W.; Wu, T.; Lu, B.; et al. Prognostic nomogram for overall survival in previously untreated patients with extranodal NK/T-cell lymphoma, nasal-type: A multicenter study. Leukemia 2015, 29, 1571–1577. [Google Scholar] [CrossRef] [PubMed]
- Tan, W.C.C.; Nerurkar, S.N.; Cai, H.Y.; Ng, H.H.M.; Wu, D.; Wee, Y.T.F.; Lim, J.C.T.; Yeong, J.; Lim, T.K.H. Overview of multiplex immunohistochemistry/immunofluorescence techniques in the era of cancer immunotherapy. Cancer Commun. 2020, 40, 135–153. [Google Scholar] [CrossRef]

| Variables | Training Group | Validation Group | p-Value a |
|---|---|---|---|
| Number | 67 | 28 | |
| Age, mean ± SD, months | 65.91 ± 9.12 | 66.43 ± 8.23 | 0.79 |
| Tumor length, mean ± SD, cm | 4.66 ± 1.79 | 5.06 ± 1.74 | 0.22 |
| Tumor volume, mean ± SD, cm3 | 21.18 ± 17.91 | 26.63 ± 27.16 | 0.52 |
| Proportion of positive lymph nodes, mean ± SD, % | 15.68 ± 24.61 | 13.93 ± 16.17 | 0.46 |
| CD39+ count, mean ± SD | 4014.48 ± 2957.20 | 3559.89 ± 2393.59 | 0.68 |
| CD8+ count, mean ± SD | 277.79 ± 418.32 | 278.93 ± 395.91 | 0.32 |
| CD39-expressing CD8+ T cells, mean ± SD, % | 50.53 ± 21.50 | 46.70 ± 21.83 | 0.44 |
| CD39+ in CK+ region, mean ± SD | 831.16 ± 753.49 | 1191.30 ± 1201.52 | 0.20 |
| CD39+ in CK− region, mean ± SD | 3183.31 ± 2786.14 | 2368.59 ± 1707.59 | 0.35 |
| CD8+ in CK+ region, mean ± SD | 45.93 ± 101.88 | 79.81 ± 200.42 | 0.44 |
| CD8+ in CK− region, mean ± SD | 231.87 ± 335.91 | 199.11 ± 231.87 | 0.49 |
| CD39-expressing CD8+ T cells in CK+ region, mean ± SD, % | 36.06 ± 28.32 | 26.21 ± 25.31 | 0.11 |
| CD39-expressing CD8+ T cells in CK− region, mean ± SD, % | 56.58 ± 24.80 | 55.14 ± 28.05 | 0.95 |
| Gender, n (%) | 0.49 | ||
| male | 56 (83.60) | 21 (75.00) | |
| female | 11 (16.40) | 7 (25.00) | |
| Pathological grade, n (%) | 1.00 | ||
| I + II | 55 (82.10) | 23 (82.10) | |
| III | 12 (17.90) | 5 (17.90) | |
| Vascular invasion, n (%) | 0.69 | ||
| no | 62 (92.50) | 25 (89.30) | |
| yes | 5 (7.50) | 3 (10.70) | |
| T stage, n (%) | 0.68 | ||
| T1 + T2 | 17 (27.00) | 5 (20.00) | |
| T3 + T4 | 46 (73.00) | 20 (80.00) | |
| TNM stage, n (%) | 0.49 | ||
| I + II | 34 (53.10) | 11 (42.30) | |
| III + IV | 30 (46.90) | 15 (57.70) |
| Variables | Cut-Off Value | PH | Univariate/Time-Dependent Cox Regression | Multicollinearity | Multivariate Cox Regression | ||||
|---|---|---|---|---|---|---|---|---|---|
| p-Value | HR | 95%CI | p-Value | VIF | HR | 95%CI | p-Value | ||
| Gender | 0.490 | 1.315 | |||||||
| male | 1.000 | Reference | 1.000 | Reference | |||||
| female | 0.271 | 0.084–0.877 | 0.029 ** | 0.214 | 0.058–0.794 | 0.021 ** | |||
| Age (years) | 72 | 0.880 | |||||||
| ≤72 | 1.000 | Reference | |||||||
| >72 | 0.676 | 0.333–1.373 | 0.279 | ||||||
| Tumor length (cm) | 3 | 0.019 ** | |||||||
| ≤3 | 1.000 | Reference | |||||||
| >3 | 1.078 | 0.752–1.546 | 0.680 | ||||||
| Tumor volume (cm3) | 12 | 0.180 | |||||||
| ≤12 | 1.000 | Reference | |||||||
| >12 | 0.605 | 0.329–1.112 | 0.106 | ||||||
| Proportion of positive lymph nodes | 10% | 0.390 | 3.025 | ||||||
| ≤10% | 1.000 | Reference | 1.000 | Reference | |||||
| >10% | 2.599 | 1.407–4.803 | 0.002 ** | 1.027 | 0.307–3.440 | 0.966 | |||
| Pathological grade | 0.100 | 1.142 | |||||||
| I + II | 1.000 | Reference | 1.000 | Reference | |||||
| III | 2.215 | 1.100–4.460 | 0.026 ** | 1.778 | 0.796–3.970 | 0.160 | |||
| Vascular invasion | 0.890 | ||||||||
| no | 1.000 | Reference | |||||||
| yes | 1.720 | 0.613–4.832 | 0.303 | ||||||
| T stage | 0.820 | 1.336 | |||||||
| T1 + T2 | 1.000 | Reference | 1.000 | Reference | |||||
| T3 + T4 | 2.554 | 1.126–5.793 | 0.025 ** | 1.358 | 0.558–3.302 | 0.500 | |||
| TNM stage | 0.260 | 2.778 | |||||||
| I + II | 1.000 | Reference | 1.000 | Reference | |||||
| III + IV | 2.049 | 1.110–3.784 | 0.022 ** | 2.812 | 0.799–9.890 | 0.107 | |||
| CD39+ count | 2821 | 0.100 | |||||||
| ≤2821 | 1.000 | Reference | |||||||
| >2821 | 1.616 | 0.879–2.969 | 0.122 | ||||||
| CD39-expressing CD8+ T cells | 30.10% | 0.610 | |||||||
| ≤30.10% | 1.000 | Reference | |||||||
| >30.10% | 1.722 | 0.726–4.084 | 0.217 | ||||||
| CD39+ in CK+ region | 456 | 0.980 | 1.321 | ||||||
| ≤456 | 1.000 | Reference | 1.000 | Reference | |||||
| >456 | 1.924 | 1.000–3.700 | 0.050 * | 1.347 | 0.603–3.012 | 0.468 | |||
| CD39+ in CK− region | 3248 | 0.880 | |||||||
| ≤3248 | 1.000 | Reference | |||||||
| >3248 | 1.424 | 0.771–2.633 | 0.259 | ||||||
| CD39-expressing CD8+ T cells in CK+ region | 77.48% | 0.220 | 1.053 | ||||||
| ≤77.48% | 1.000 | Reference | 1.000 | Reference | |||||
| >77.48% | 2.282 | 1.004–5.190 | 0.049 ** | 2.587 | 1.077–6.213 | 0.033 ** | |||
| CD39-expressing CD8+ T cells in CK− region | 59.46% | 0.450 | 1.167 | ||||||
| ≤59.46% | 1.000 | Reference | 1.000 | Reference | |||||
| >59.46% | 1.738 | 0.953–3.170 | 0.071 * | 3.090 | 1.352–7.064 | 0.008 ** | |||
Disclaimer/Publisher’s Note: The statements, opinions and data contained in all publications are solely those of the individual author(s) and contributor(s) and not of MDPI and/or the editor(s). MDPI and/or the editor(s) disclaim responsibility for any injury to people or property resulting from any ideas, methods, instructions or products referred to in the content. |
© 2023 by the authors. Licensee MDPI, Basel, Switzerland. This article is an open access article distributed under the terms and conditions of the Creative Commons Attribution (CC BY) license (https://creativecommons.org/licenses/by/4.0/).
Share and Cite
Liu, M.; Zhao, Y.; Xiao, Z.; Zhou, R.; Chen, X.; Cui, S.; Cao, S.; Huang, X.; Chen, T.; Huo, X.; et al. CD39-Expressing CD8+ T Cells as a New Molecular Marker for Diagnosis and Prognosis of Esophageal Squamous Cell Carcinoma. Cancers 2023, 15, 1184. https://doi.org/10.3390/cancers15041184
Liu M, Zhao Y, Xiao Z, Zhou R, Chen X, Cui S, Cao S, Huang X, Chen T, Huo X, et al. CD39-Expressing CD8+ T Cells as a New Molecular Marker for Diagnosis and Prognosis of Esophageal Squamous Cell Carcinoma. Cancers. 2023; 15(4):1184. https://doi.org/10.3390/cancers15041184
Chicago/Turabian StyleLiu, Meitong, Yaning Zhao, Zhuoyun Xiao, Rongmiao Zhou, Xiaodong Chen, Saijin Cui, Shiru Cao, Xi Huang, Tianyu Chen, Xiangran Huo, and et al. 2023. "CD39-Expressing CD8+ T Cells as a New Molecular Marker for Diagnosis and Prognosis of Esophageal Squamous Cell Carcinoma" Cancers 15, no. 4: 1184. https://doi.org/10.3390/cancers15041184
APA StyleLiu, M., Zhao, Y., Xiao, Z., Zhou, R., Chen, X., Cui, S., Cao, S., Huang, X., Chen, T., Huo, X., Zhang, G., Tian, Z., & Wang, N. (2023). CD39-Expressing CD8+ T Cells as a New Molecular Marker for Diagnosis and Prognosis of Esophageal Squamous Cell Carcinoma. Cancers, 15(4), 1184. https://doi.org/10.3390/cancers15041184


