1. Introduction
Progression of breast cancer to a metastatic disease relies in part on tumour cells at the primary tumour site becoming more migratory and invasive. This process is mediated by epithelial-to-mesenchymal transition (EMT) and is followed by the reverse phenomenon, mesenchymal-to-epithelial transition (MET) which enables new tumours to be established.
It is now accepted that cancer stem cells (CSCs) are important in disease progression. Their abilities for self-renewal, apoptosis resistance and efflux help to enable tumour regrowth. This ability of CSCs to efflux chemotherapeutic drugs, amongst other compounds, is primarily due to the expression of members of the ABC transporter family [
1]. Solute transporters may also have a role in the efficacy of chemotherapeutic treatments as substrates for several of these transporters are anticancer drugs [
2]. Side population (SP) cells can be isolated based on their ability to expel vital dyes, through expression of ABC transporters [
3]. SP cells have been found in both mouse and human breast tissue and have been shown to generate epithelial and luminal cells and structures in vitro and in vivo, [
4]. Increased SP cell prevalence has been associated with triple negative or hormonal non-responsive breast cancer patients and the presence of SP cells may be responsible for their poor clinical outcome [
5].
EMT is thought to contribute to the regulation of breast CSCs. Human mammary epithelial cells (HMLE) induced to undergo EMT gave rise to an increased percentage of CD44+/CD24- cells which had stem cell characteristics [
6]. In contrast, FOXC2 knockdown in EMT-induced HMLE cells led to the generation of cells with epithelial-like properties, and a decrease in CD44+/CD24- cells [
7].
While it is known that EMT is regulated by several growth factors and cytokines, one important signalling pathway is mediated by TGF-β. In breast cancer TGFB-RII expression is inversely correlated with ER expression [
8] and the CD44+/CD24- cell phenotype has been associated with ER-/TGFB-RII+ patients [
9]. This suggests that ER status and the presence of a functional TGF-β signalling pathway can determine the regulation of putative breast CSCs through EMT in different breast cancer patients.
TGF-β treatment appears to have a regulatory effect on SP cells. In human diffuse-type gastric carcinoma cells downregulation of ABCG2 resulted in reduced SP cell numbers [
10]. While TGF-β1 treatment of the MCF7 breast cancer cell line eliminated the SP population, decreased ABCG2 expression and reduced cell viability in the presence of mitoxantrone. These effects were reversable on removal of TGF-β1 [
11]. In addition, TGF-β1 treatment of thyroid cancer cell lines resulted in a reduction in ABCG2 mRNA and a reduction in SP cell numbers, while removal of endogenous TGF-β1 resulted in restoration of the SP cells [
12]. Exposure of ovarian cancer cell lines to TGF-β1 resulted in reduced SP cell numbers and an increase in some markers of EMT [
13].
Hypoxia has also been reported to drive EMT in cancer cells [
14,
15]. Hypoxia-induced EMT has resulted in the acquisition of mesenchymal properties and the upregulation of E-cadherin repressors [
16,
17]. Hypoxia also seems to stimulate the activation of known EMT-related pathways, including TGF-β, Notch, Wnt and Hedgehog [
16,
18,
19].
Hypoxia is also thought to have a positive regulatory impact on SP cells. Hypoxia and re-oxygenation led to an increase in ABCG2 expression in murine kidney SP cells and protection against hypoxic damage [
20]. In thyroid cancer cell lines, treatment with CoCl
2 led to a significant increase in SP cell numbers in two thyroid cancer cell lines [
21]. While HIF-2α expression has also been associated with high ABCG2 expression, histology-grade and Ki67 expression in invasive human breast cancer, suggesting that HIF-2α could be a reliable prognostic marker for development of drug resistance and metastasis in breast cancer [
22].
This study was designed to determine the effects of EMT through ΤGF-β1 and CoCl2 treatment on the SP population in the MDA-MB-231 (ER-/PR-/HER2-) and MCF7 (ER+/PR+/HER2-) cell lines. The impact of TGF-β exposure on the MCF7 SP cells alone was also confirmed in this study. Insight into the mechanisms that are involved in the regulation of these cells depending on breast cancer subtype could provide the basis of promising and more effective therapeutic strategies for the prevention of metastasis and drug resistance.
2. Materials and Methods
2.1. Cell Culture Conditions and Maintenance
MDA-MB-231 (validated by short tandem repeat (STR) DNA fingerprinting prior to being supplied by MD Anderson) and MCF7 (authenticated by STR finger printing by European Collection of Authenticated Cell Culture (ECACC) prior to purchase) were cultured in complete DMEM (cDMEM) (Sigma-Aldrich, St Louis, MI, USA) without phenol red, supplemented with 10% Foetal Bovine Serum (FBS) (Lonza, Basel, Switzerland), 2 mM L-glutamine (Sigma-Aldrich), 100 IU/mL penicillin, 100 μg/mL streptomycin (Life Technologies, Paisley, UK). The cells were maintained under standard oxygen conditions and medium was changed every 4–5 days. Cells were split 4:1 for protein and mRNA analysis.
2.2. TGF-β Induced EMT
1 × 10⁵ cells were seeded in 100 mm dishes. At 24 h cells were treated with TGF-β1 (R & D Systems, Abingdon, UK) 5 ng/mL for MDA-MB-231 and 10 ng/mL MCF7 for 3 days. As controls cells were treated in parallel without the addition of TGF-β1, 5 μΜ SB-505124 (Sigma-Aldrich) was added 30 min prior to TGF-β1 treatment to separate cells cultured under the same conditions and to confirm the inhibition of TGF-β1. After 72 h cells were harvested for further analysis.
2.3. CoCl2 Induced EMT
A total of 2 × 10⁵ cells were plated in 100 mm dishes. At 24 h cells were treated with 400 μM CoCl2 (Sigma-Aldrich). Controls were untreated cells. After 48 h cells were harvested for further analysis and culture medium was collected for ELISA assay.
2.4. Hypoxia Treatment
Cells were either plated in NuncTM Lab-TekTM II chamber slides (ICC) or six-well plates (qPCR). After 24 h the cells were placed in a Whitley H35 Hypoxystation set to an oxygen concentration of 3%. Controls were untreated cells. After 48 h, cells were harvested for further analysis and culture medium was collected for ELISA assay.
2.5. Treatment of MCF7 Cells with 4-Hydroxytamoxifen (Tam)
A total of 3 × 10⁵ cells were plated in 100 mm dishes and 1.5 or 2.5 μM Tam (Sigma-Aldrich) were added to the cell culture media at the time of plating. 24 h later cells were treated with CoCl2. Untreated cells and cells treated with 1.5 and 2.5 μM 4-hydroxytamoxifen were used as controls. After 48 h cells were harvested for SP analysis.
2.6. Flow Cytometry
Cells were trypsinized and diluted to give a final concentration of 1 × 10⁶ cells/mL in cDMEM. A total of 5 μL of DNase (Life Technologies) was added to each tube to prevent cell clumping. Additionally, 5 μL of fumitremorgin C (FTC,10 µM; Axxora, NY, USA) was added to one tube containing 1 × 10⁶ cells/mL. All cell samples were incubated at 37 °C using a MACsMix rotor (Miltenyi Biotec, Surrey, UK) for 15 min. All cell samples were then treated with Hoechst 33342 dye (Sigma-Aldrich), 5 μg/mL for MDA-MB-231 and 7 μg/mL for MCF7. The same concentrations of Hoechst 33342 were also added to the tubes containing FTC. For all SP experiments FTC was used as a control to confirm the SP phenotype. All cell samples were then incubated at 37 °C in the dark using a MACsMix rotor for 90 min, after which cells were washed in ice-cold 1X PBS and centrifuged at 3000 rpm for 5 min. Cells were re-suspended in 500 μL ice-cold 1X PBS and filtered through 70 μm cell strainers (BD Biosciences, Oxford, UK) into FACs tubes (BD falcon, Oxford, UK). All tubes were maintained on ice in the dark prior to cell analysis. Non-viable cells were excluded by the addition of 2 μL propidium iodide (PI; 2 μg/mL) (Sigma-Aldrich). A LSRII flow cytometer (BD Biosciences) was used for SP assays and data analysis was performed using FACS Diva software.
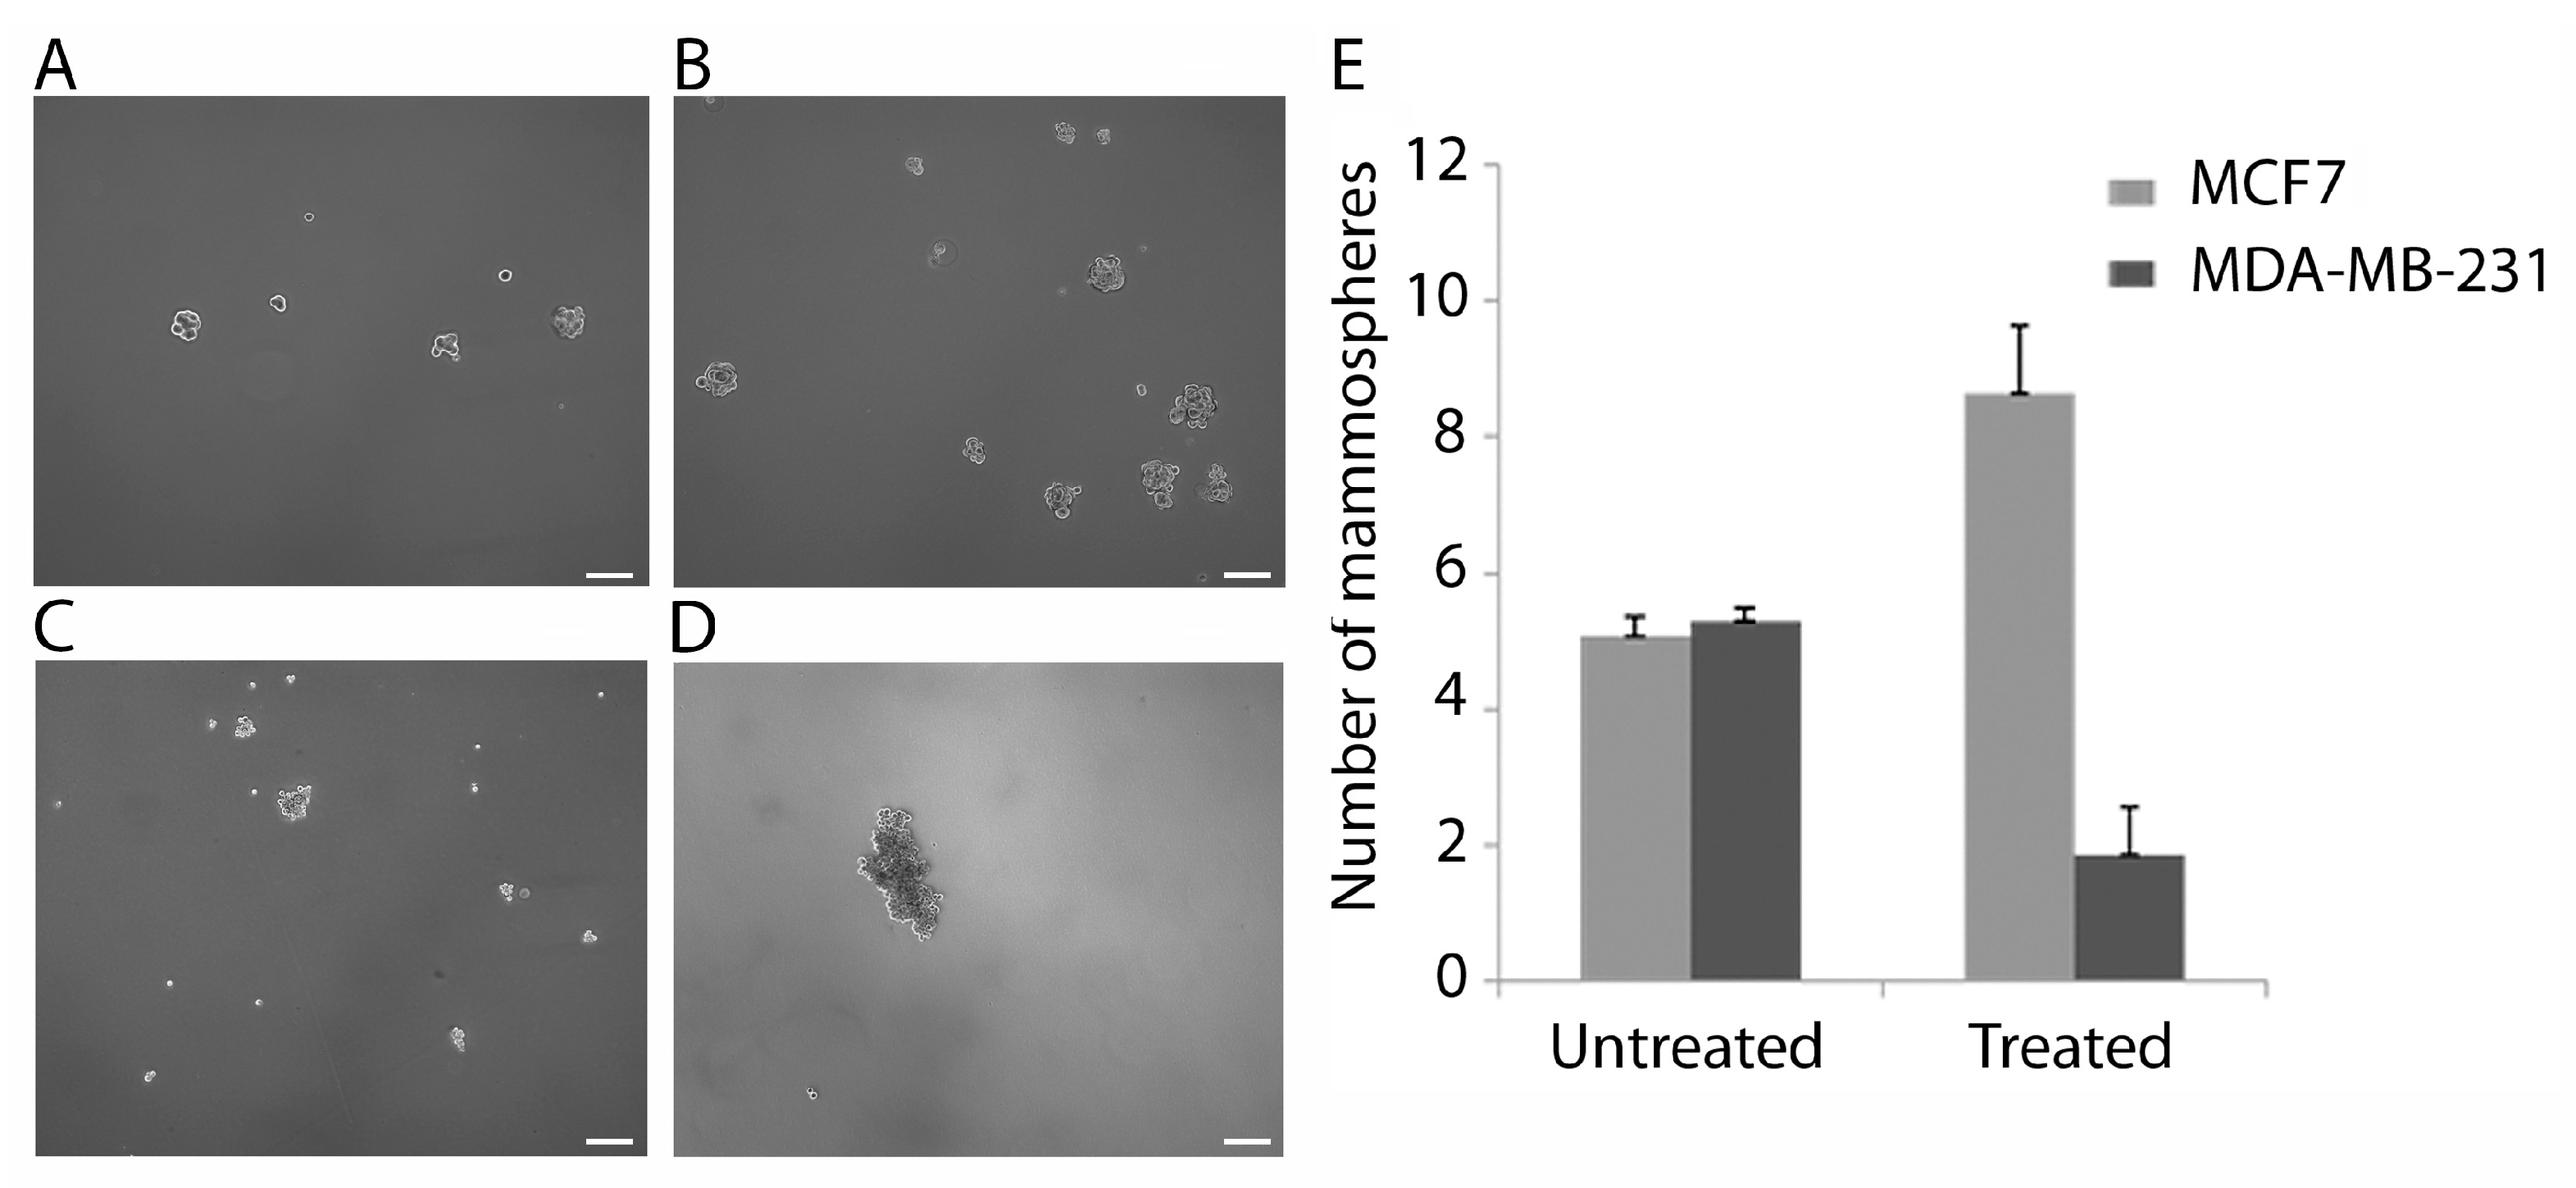
2.7. Mammosphere Forming Assay
Mammosphere formation efficiency was assessed using a modified protocol [
23]. Briefly, cells were treated with CoCl
2 as described above, detached when at 70–80% confluency, resuspended in PBS and counted. A 25 G needle was used to ensure that a single cell suspension was formed. A total of 1 × 10
5 MCF7 and 1.5 × 10
5 MDA-MB-231 cells were plated in low-adherent six-well plates containing 2 mL of mammosphere media. Cells were incubated in a humidified atmosphere at 37 °C and 5% CO
2 for 9 days without moving the plates. Mammospheres with size greater than 50 μM were counted on the 9th day of culture using 5× magnification. Data generated are representative of n = 3 individual experiments for each cell line.
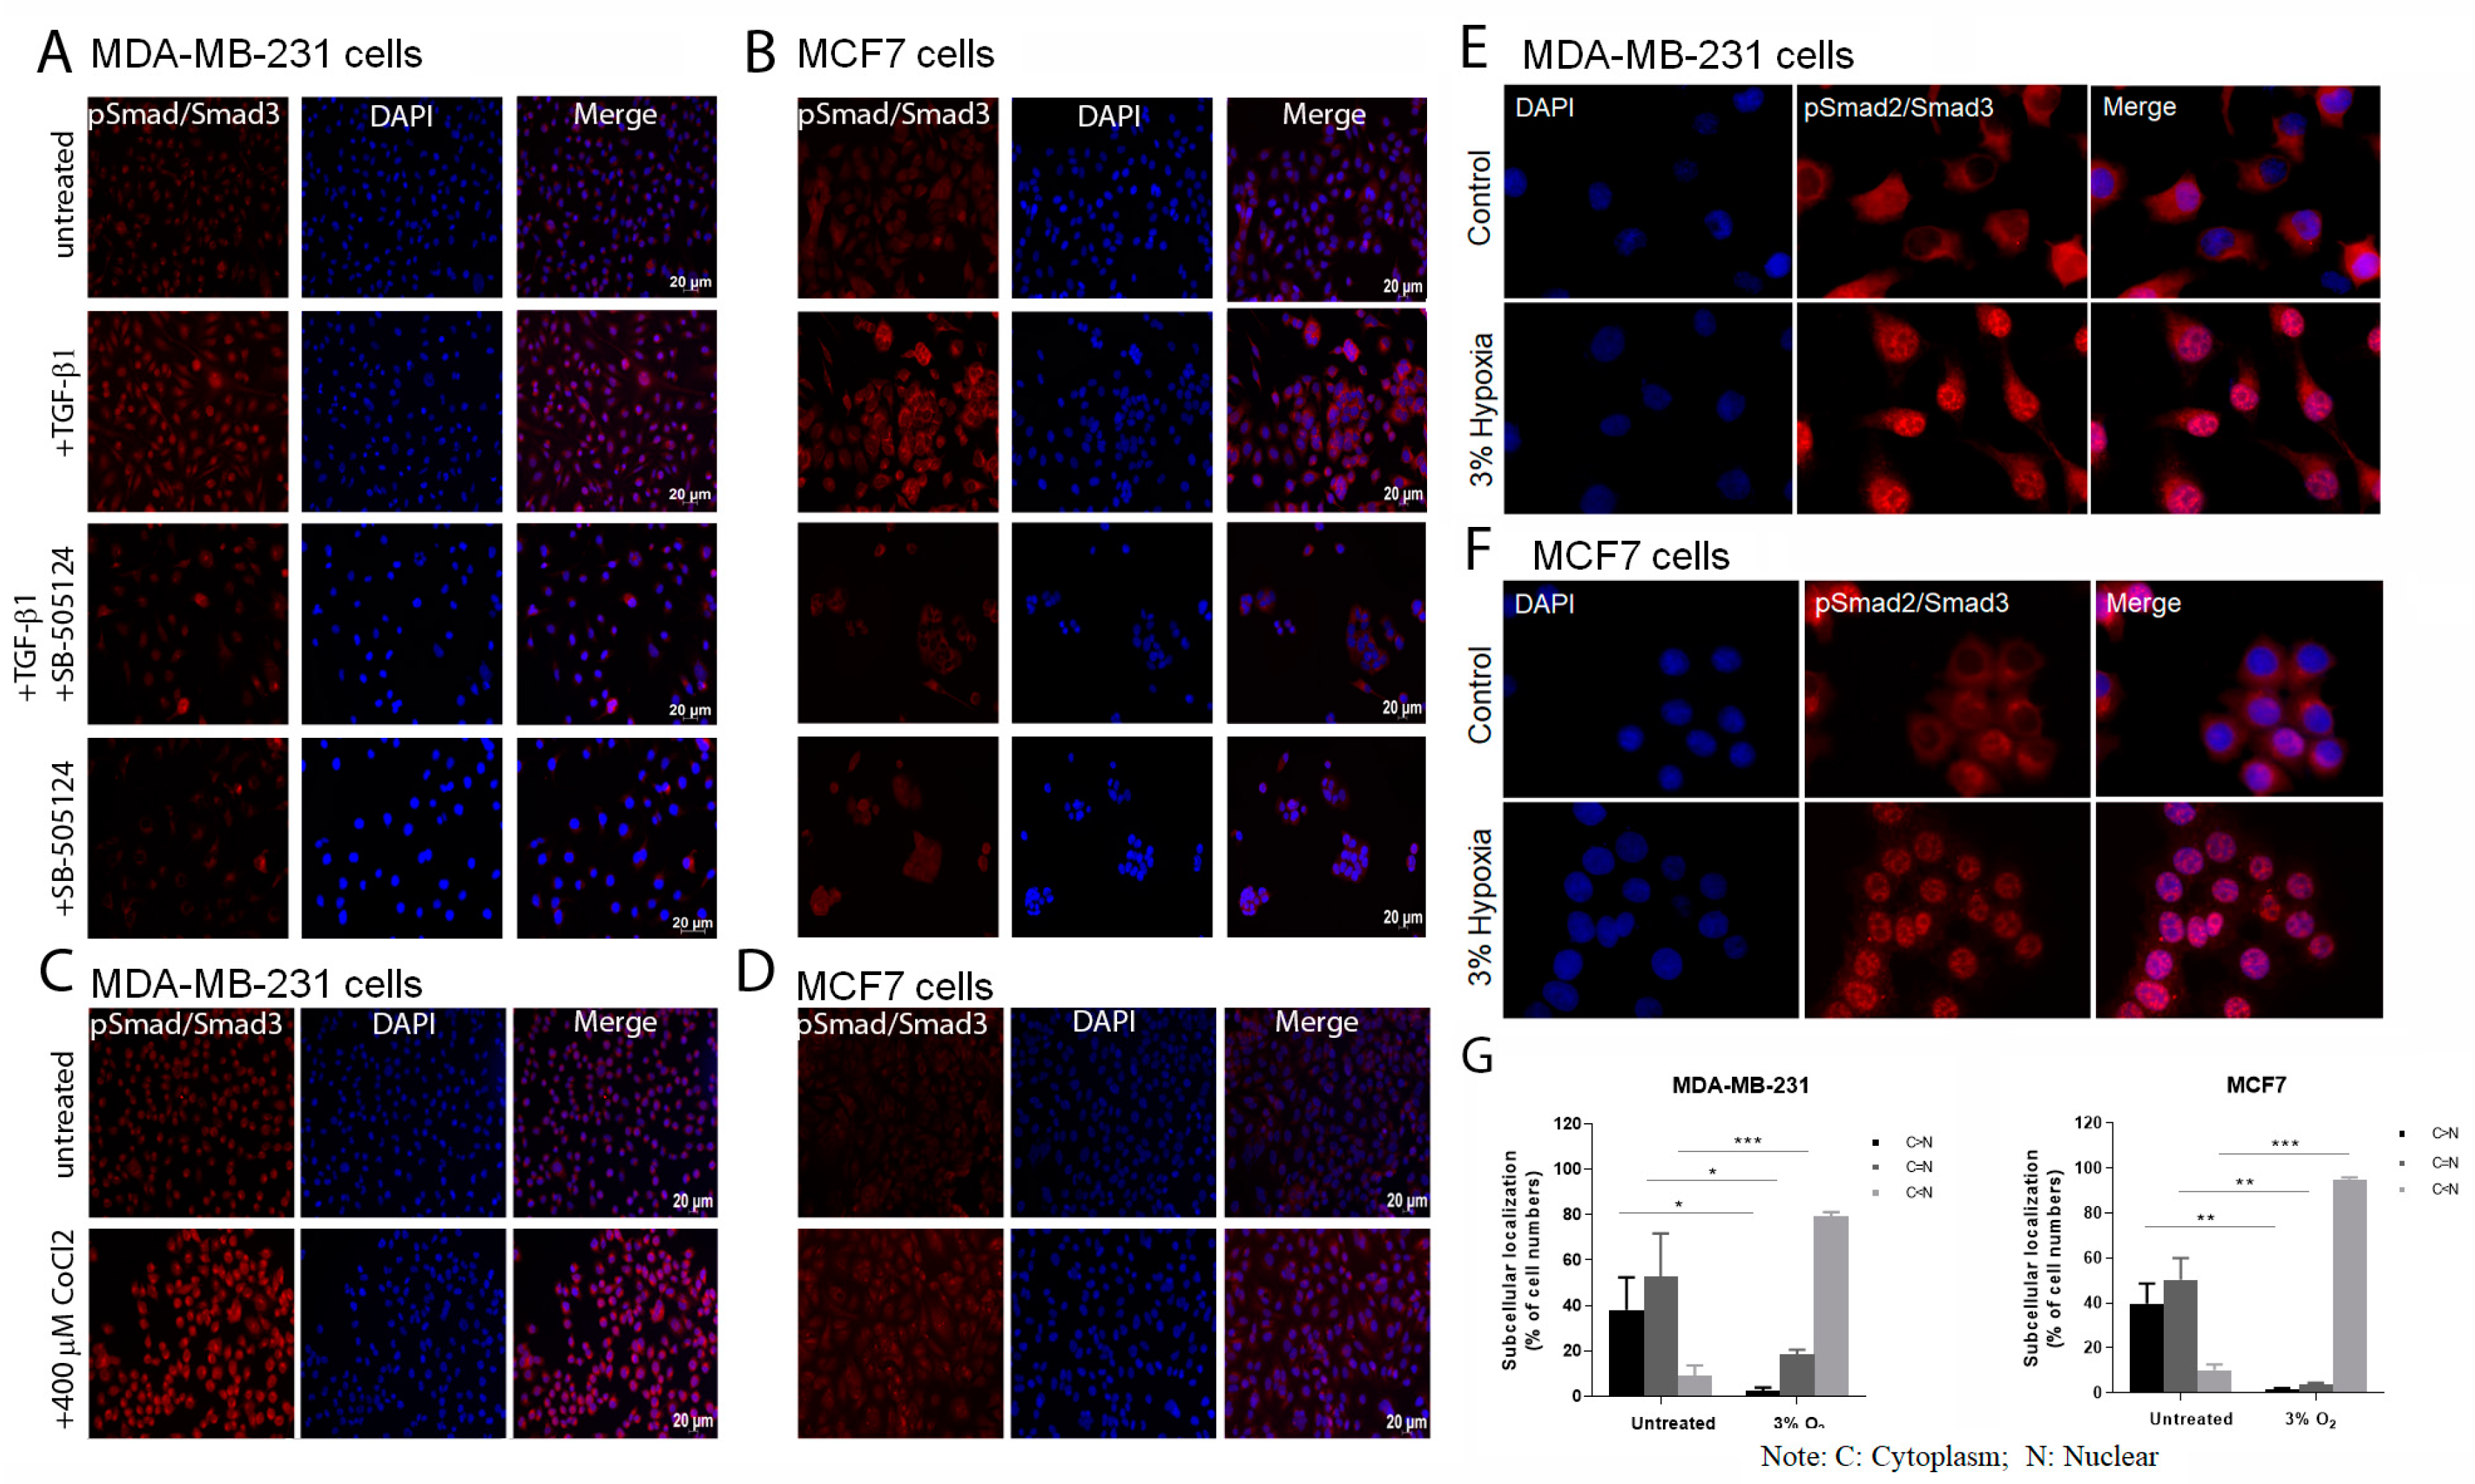
2.8. Immunocytochemistry
Cells were seeded in chamber slides or 6-well plates containing sterilized glass coverslips and cultured in cDMEM. When confluent, or after TGF-β1, CoCl2 or hypoxia treatment, cells were fixed in cold methanol (BDH Laboratory Supplies, Dubai, UAE) for 20 min at −20 °C, washed two times in 1× PBS and permeabilized in 0.3% (v/v) Triton X-100 (Fisher Scientific, Loughborough, UK) in PBS for 10 min. These were then incubated in 5% normal goat serum (NGS; Sigma-Aldrich)/PBS for 30 min. This was followed by an overnight incubation in a humid chamber with the primary antibody 1:100 anti-pSmad2/3 (sc-11769, Santa Cruz Biotechnology Inc., TX, USA) diluted in 0.5% NGS/PBS. Negative controls for the primary (0.5% NGS/PBS instead of the primary antibody) were used. Cells were then washed with PBS for 5 min followed by 1 h incubation in the presence of a rhodamine labelled secondary antibody (diluted 1:25; Jackson Immunoresearch Laboratories, Suffolk, UK), again in a humid chamber in the dark, washed again and then slides were mounted in vectashield anti-fading medium containing 4′, 6-diamidino-2-phenylindole (DAPI) (Vector Laboratories, Peterborough, UK) and visualized using an Axio Imager Zeiss (Jena, Germany) microscope. Nuclear to cytoplasmic expression of pSmad2/3 was determined by counting five randomly selected fields of stained cells imaged at 20× magnification. Data are representative of n = 3 experiments.
Cells were seeded in chamber slides and treated with CoCl2 or hypoxia for 48 h. Cells were then fixed in 4% paraformaldehyde (G1101, Servicebio, Wuhan, China) for 30 min at RT, washed two times in 1× PBS and permeabilized in 0.1% (v/v) Triton X-100 (Sigma-Aldrich) in PBS for 10 min. These were then blocked in 10% NGS/PBS for 1 h and incubated with the primary antibody against CXCR4 (1:100, AF6621, Beyotime Biotechnology, Nantong, China) diluted in 2% NGS/PBS overnight. Negative controls for the primary (2% NGS/PBS instead of the primary antibody) were used. Cells were then washed three times in 1× PBS and incubated with Alexa Flour 488-conjugated Goat anti-rabbit IgG secondary antibody or Alexa Flour 555-conjugated Goat anti-rabbit IgG secondary antibody (diluted 1:500; Thermo Fisher Scientific, Waltham, MA, USA) in the dark, washed again and were then counterstained with DAPI and visualized using a Leica SP8 confocal system.
2.9. Western Blot Analysis
Cells were harvested and treated with Western/IP lysis buffer (Beyotime Biotechnology, China) containing phenylmethyl sulonylfluoride (PMSF) and protease inhibitor cocktail set I (Millipore Corp, Burlington, MA, USA) at 4 °C for 20 min. Protein concentration was determined using the BCA protein assay kit (Beyotime Biotechnology, China). Proteins were separated using SDS-PAGE and subsequently transferred onto polyvinylidene difluoride (PVDF) membrane (Millipore Corp, USA). After blocking with 5% non-fat milk in TBST for 1 h, the membranes were incubated with primary antibodies against TGF-β1 (1:1000, 21898-1-AP, Proteintech, Wuhan, China), TGFBRII (1:1000, 66636-1-Ig, Proteintech, China), TGFBRI (1:1000, GB11271, Servicebio, China) and GAPDH (1:2000, ab181602, Abcam, Cambridge, UK) overnight at 4 °C. After washing with TBST buffer, the membranes were incubated with HRP-conjugated secondary antibody for 1 h at RT. The signal was detected with enhanced chemiluminescence (ECL) kit (Millipore Corp, USA).
2.10. Quantitative PCR (qPCR)
Total RNA was extracted using the RNeasy Micro kit (Qiagen, Hilden, Germany) as per manufacturer’s instructions. RNA aliquots were prepared by diluting the RNA samples to get a final concentration of 1000 ng/μL and reverse transcription was performed using the Bioline cDNA synthesis kit (Bioline, London, UK) for the preparation of cDNA as per manufacturer’s instructions. For qPCR analysis, 20 μL qPCR reactions were prepared in triplicates for each sample, containing 2 μL cDNA, 1 μL primer probes (TGFB-RI: Hs00610318_m1, TGFB-RII: Hs00559661_m1, TGF-β1: Hs00998129_m1, beta-actin: Hs01060665_g1, VEGF-A: Hs00900055_m1, CXCR4: Hs00607978_s1, (Life Technologies), 10 μL Brilliant II QPCR master mix with High ROX (Agilent Technologies LTD, Berkshire, UK) and DNase-free water (Promega, Wisconsin, USA) to make up a total volume of 20 μL. Non template controls (NTC) were used to ensure that all procedures were free of DNA contamination. All reactions were run in an Applied Biosystems Step One thermocycler. Relative expression levels for each gene of interest were calculated by normalizing the quantified gene of interest’s transcript level (threshold cycle; CT) to the CT value of the housekeeping gene b-actin using the 2−ΔCT formula and multiplying by 100 to present the values as percentage of b-actin. Fold change was calculated using the 2−ΔΔCt formula, where ΔΔCt = ΔCt of treated sample-ΔCt of untreated sample.
2.11. Determination for VEGF-A by ELISA Assay
Cell culture medium were centrifuged at 1500 rpm for 20 min to pellet potential contaminating cells and the clean supernatant was transferred into new E-tubes and stored at −80 °C. The Human VEGF-A ELISA Kit (BMS277-2, Thermo Fisher Scientific) was used to measure the expression of VEGF-A in the medium. The ELISA was determined according to the protocol provided by the supplier. The standard curve was determined by the recombinant VEGF-A provided in the kit. The absorbance of the samples was read at 450 nm.
2.12. Isolation of CoCl2 Treated and Control Cells for Single Cell Analysis
In order to determine the impact of CoCl2 at the transcriptional level on MCF7 SP cells we treated bulk cells with CoCl2 as described above, these were harvested at 48 h. Controls were cells from the same starting culture but cultured without CoCl2. We fluorescently barcoded one cell population (barcoding was reversed between CoCl2 treated and control cells over the several single cell experiments undertaken to determine that barcoding had no adverse effect on either cell population), for barcoding we used a CellTrace (TM) CFSE cell proliferation dye (Thermofisher, Waltham, MA, USA) as per manufacturer’s instructions. Then both cell preparations were stained using the SP assay described above and the two sorted SP populations were resuspended in PBS at a concentration of 250–300 cells/µL ready for single cell capture.
2.13. Single Cell Capture
Single SP cells were captured and pre-amplification performed using the C1 system (Fluidigm, San Francisco, CA, USA), as per manufacturer’s protocol. A 50:50 ratio of control to treated cell suspension was prepared at a concentration of 250–300 cells/µL PBS. Cells were separated using a C1 Single-Cell Preamp integrated fluidic circuit (size 10–17 μm) (Fluidigm). IFC priming, cell loading and lysis, reverse transcription and pre-amplification was then carried out using a range of kits including the C1 Single-Cell Auto Prep Reagent Kit (Fluidigm), Ambion Single Cell-to-CT qRT-PCR Kit (Thermo Fisher Scientific) and 20X TaqMan Gene Expression primers (Thermo Fisher Scientific). After loading, partitioned single cells were visualized under bright field and florescence using an Axiovert 200 M microscope (Zeiss). Following pre-amplification amplicons were transferred to a 96 well plate and stored at −20 °C.
2.14. Single Cell Gene Expression Analysis
This was carried out using a Biomark HD system (Data Collection software version 4.1.3) and IFC Controller HX (Fluidigm) following the manufacturer’s quick reference guide. Gene expression analysis was carried out using Dynamic Array Flex Six Gene Expression IFCs (Fluidigm). Assays were performed using the Flex Six Gene Expression Reagent Kit (Fluidigm) as per manufacturer’s instructions with 20× TaqMan Gene Expression primers (Thermo Fisher Scientific) and TaqMan Fast Advanced Master Mix (Thermo Fisher Scientific). Cells (both treated and untreated) where analysed from three separate cultures. After quality control 115 cells were included in the final analysis (52 treated and 64 control).
2.15. Statistics
Statistical analyses and graphical representation of results were performed using GraphPad Prism version 3 (GraphPad, San Diego, CA, USA) for analysis both, unpaired and paired two tailed student t-tests or column statistics were used. Data was considered statistically significant at p < 0.05.
4. Discussion
The role of TGF-β and hypoxia in EMT and CSC regulation in breast cancer has become of major interest. This pathway in breast cancer has a dual role, in early stages of the disease it has a tumour suppressive activity, while at later stages it promotes tumour progression. The impact of TGF-β driven EMT on several BCSCs populations has been studied previously, and leads to the enhancement in some, [
6] and to the reduction in others [
11].
In this study, we used the MDA-MB-231 and MCF7 breast cancer cell lines in order to study the role of EMT induced by TGF-β and hypoxia on the regulation of SP cells.
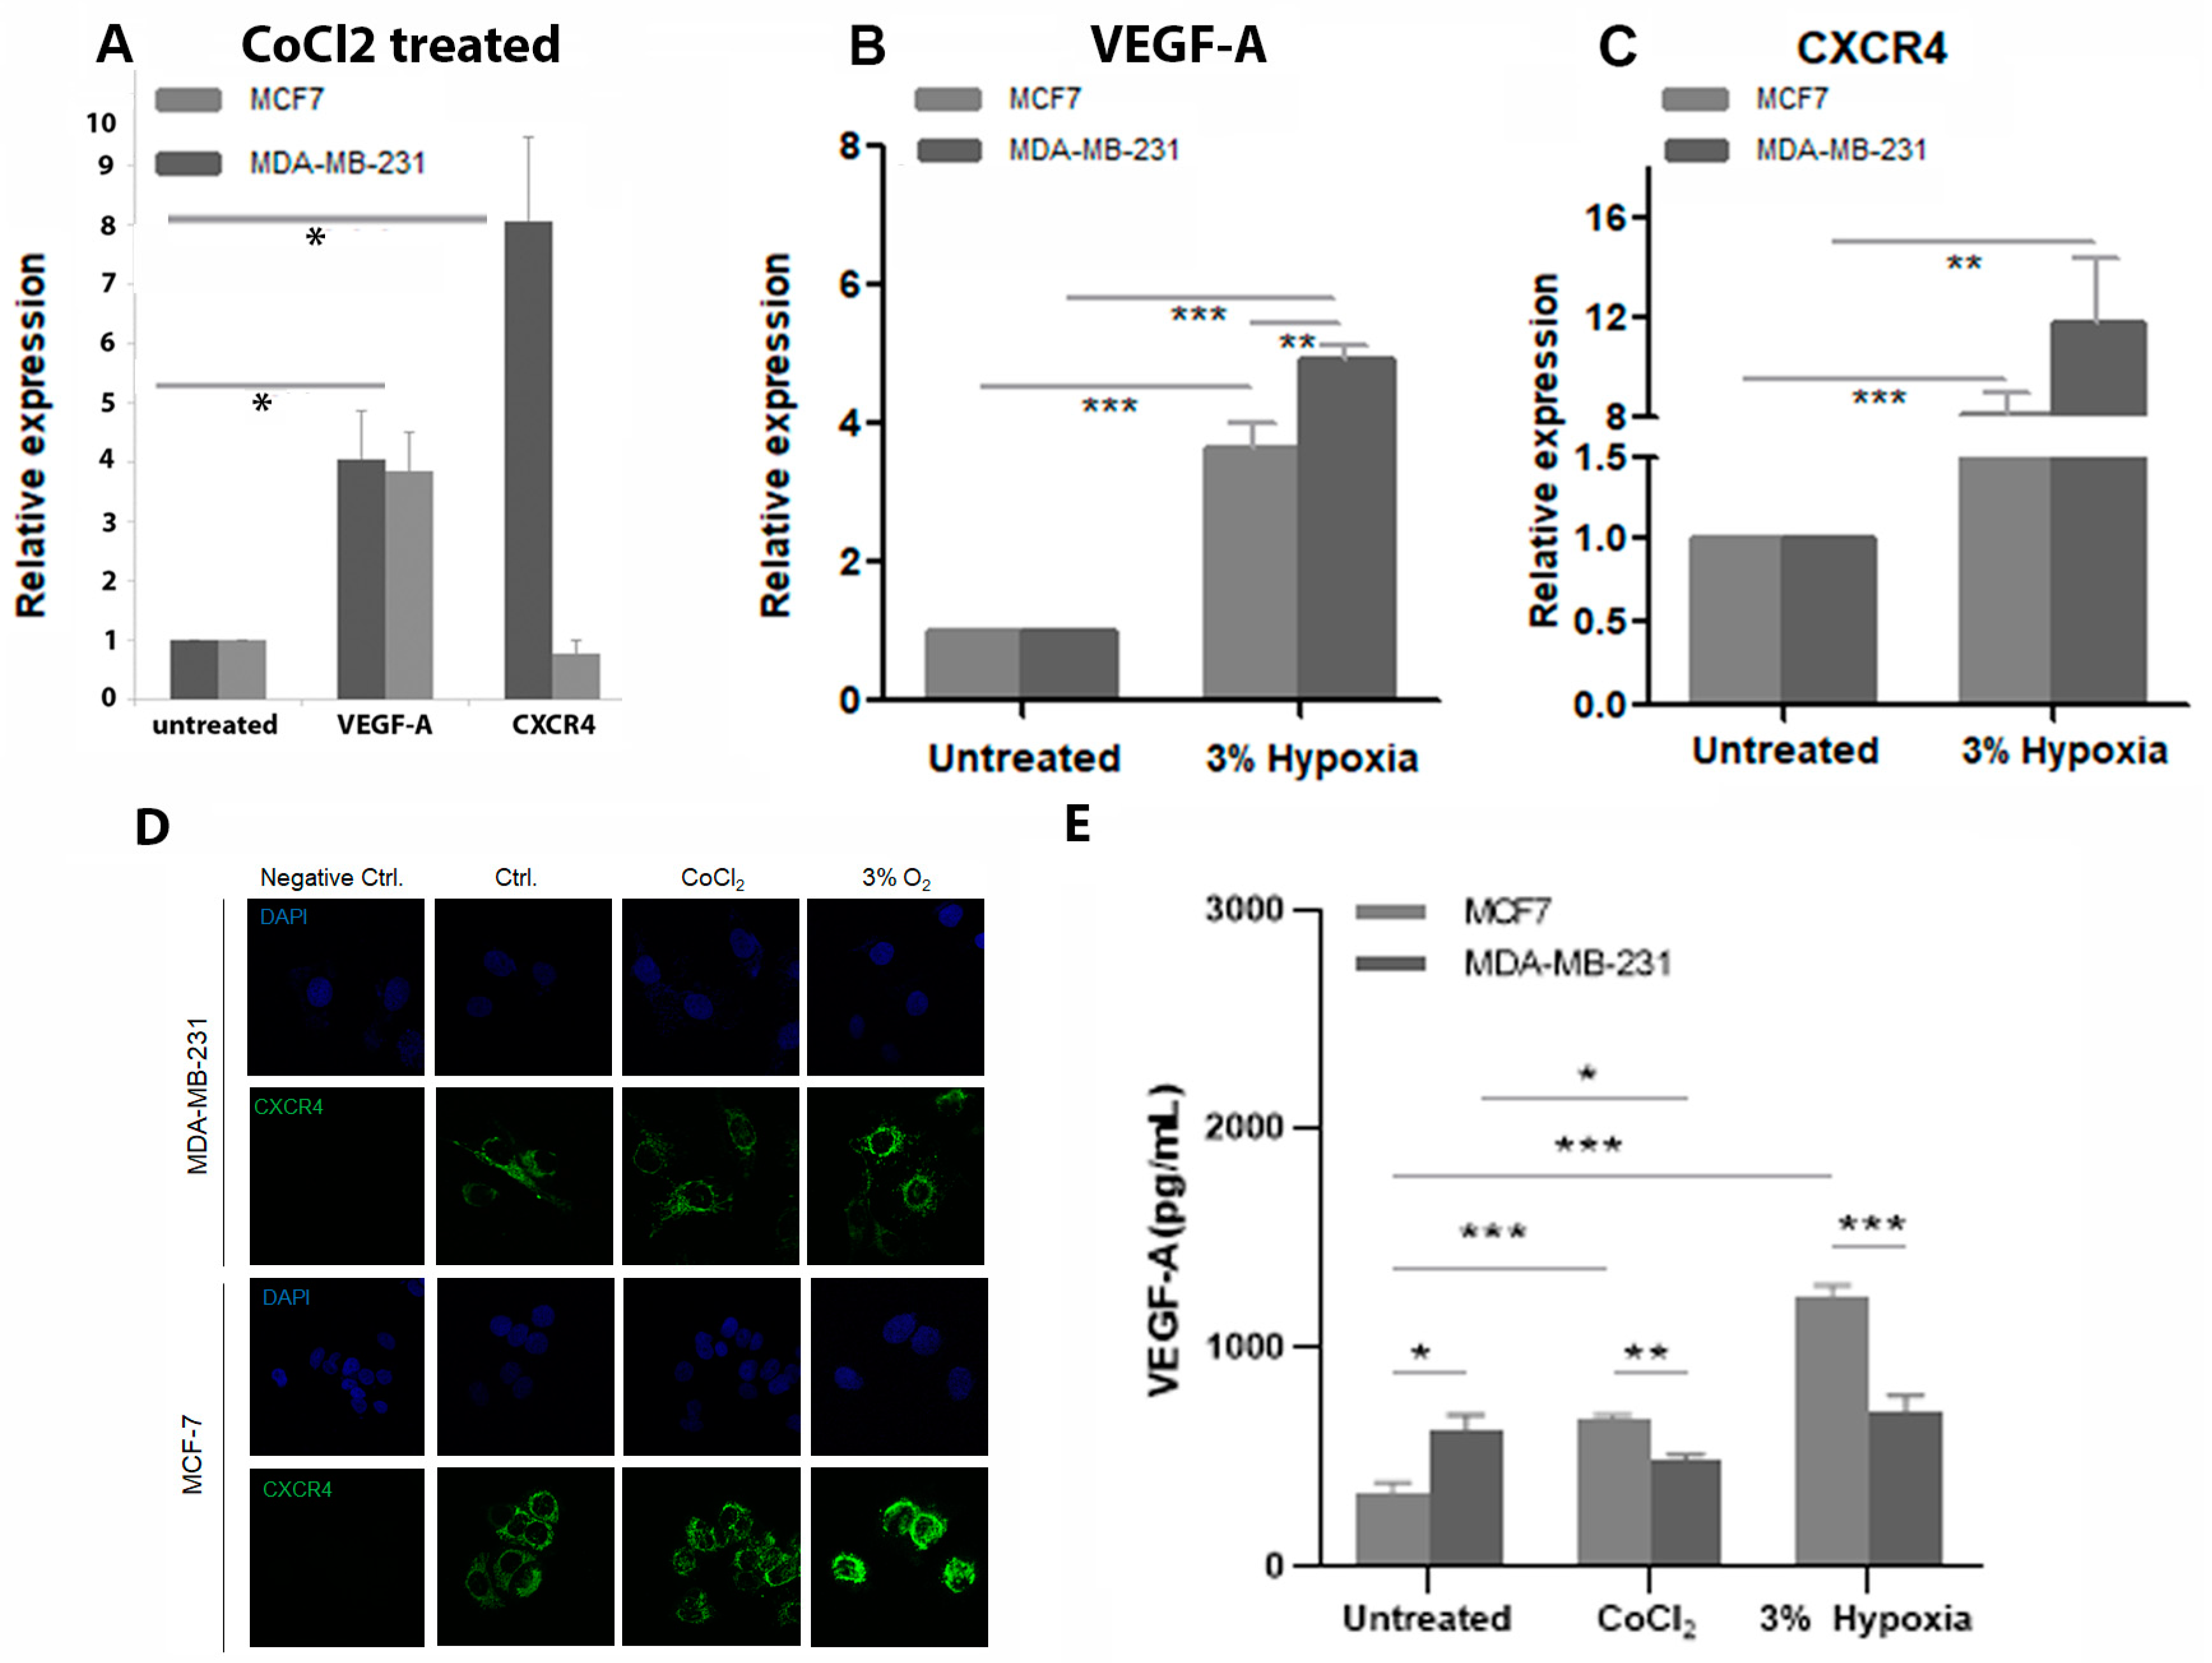
The use of the hypoxia mimetic CoCl2 was validated against low oxygen culture conditions by assessment of expression levels of two hypoxia responsive genes. There are advantages and limitations to both methods. Maintaining cells in low oxygen conditions can be difficult due to the need to remove cells for maintenance, and in the case of SP cells the need to be sorted for further analysis could lead to fluctuations in hypoxia levels, which could impact on experimental outcomes. In addition, neither cell line tolerated oxygen concentrations lower than 3% and CoCl2 treatment can be maintained in culture media for longer periods of time.
The activation of the TGF-β signalling pathway was confirmed by exposure of both cell lines to TGF-β, CoCl2 and low oxygen in both cell lines as shown by the significant increase in pSmad2/3 levels in the treated samples.
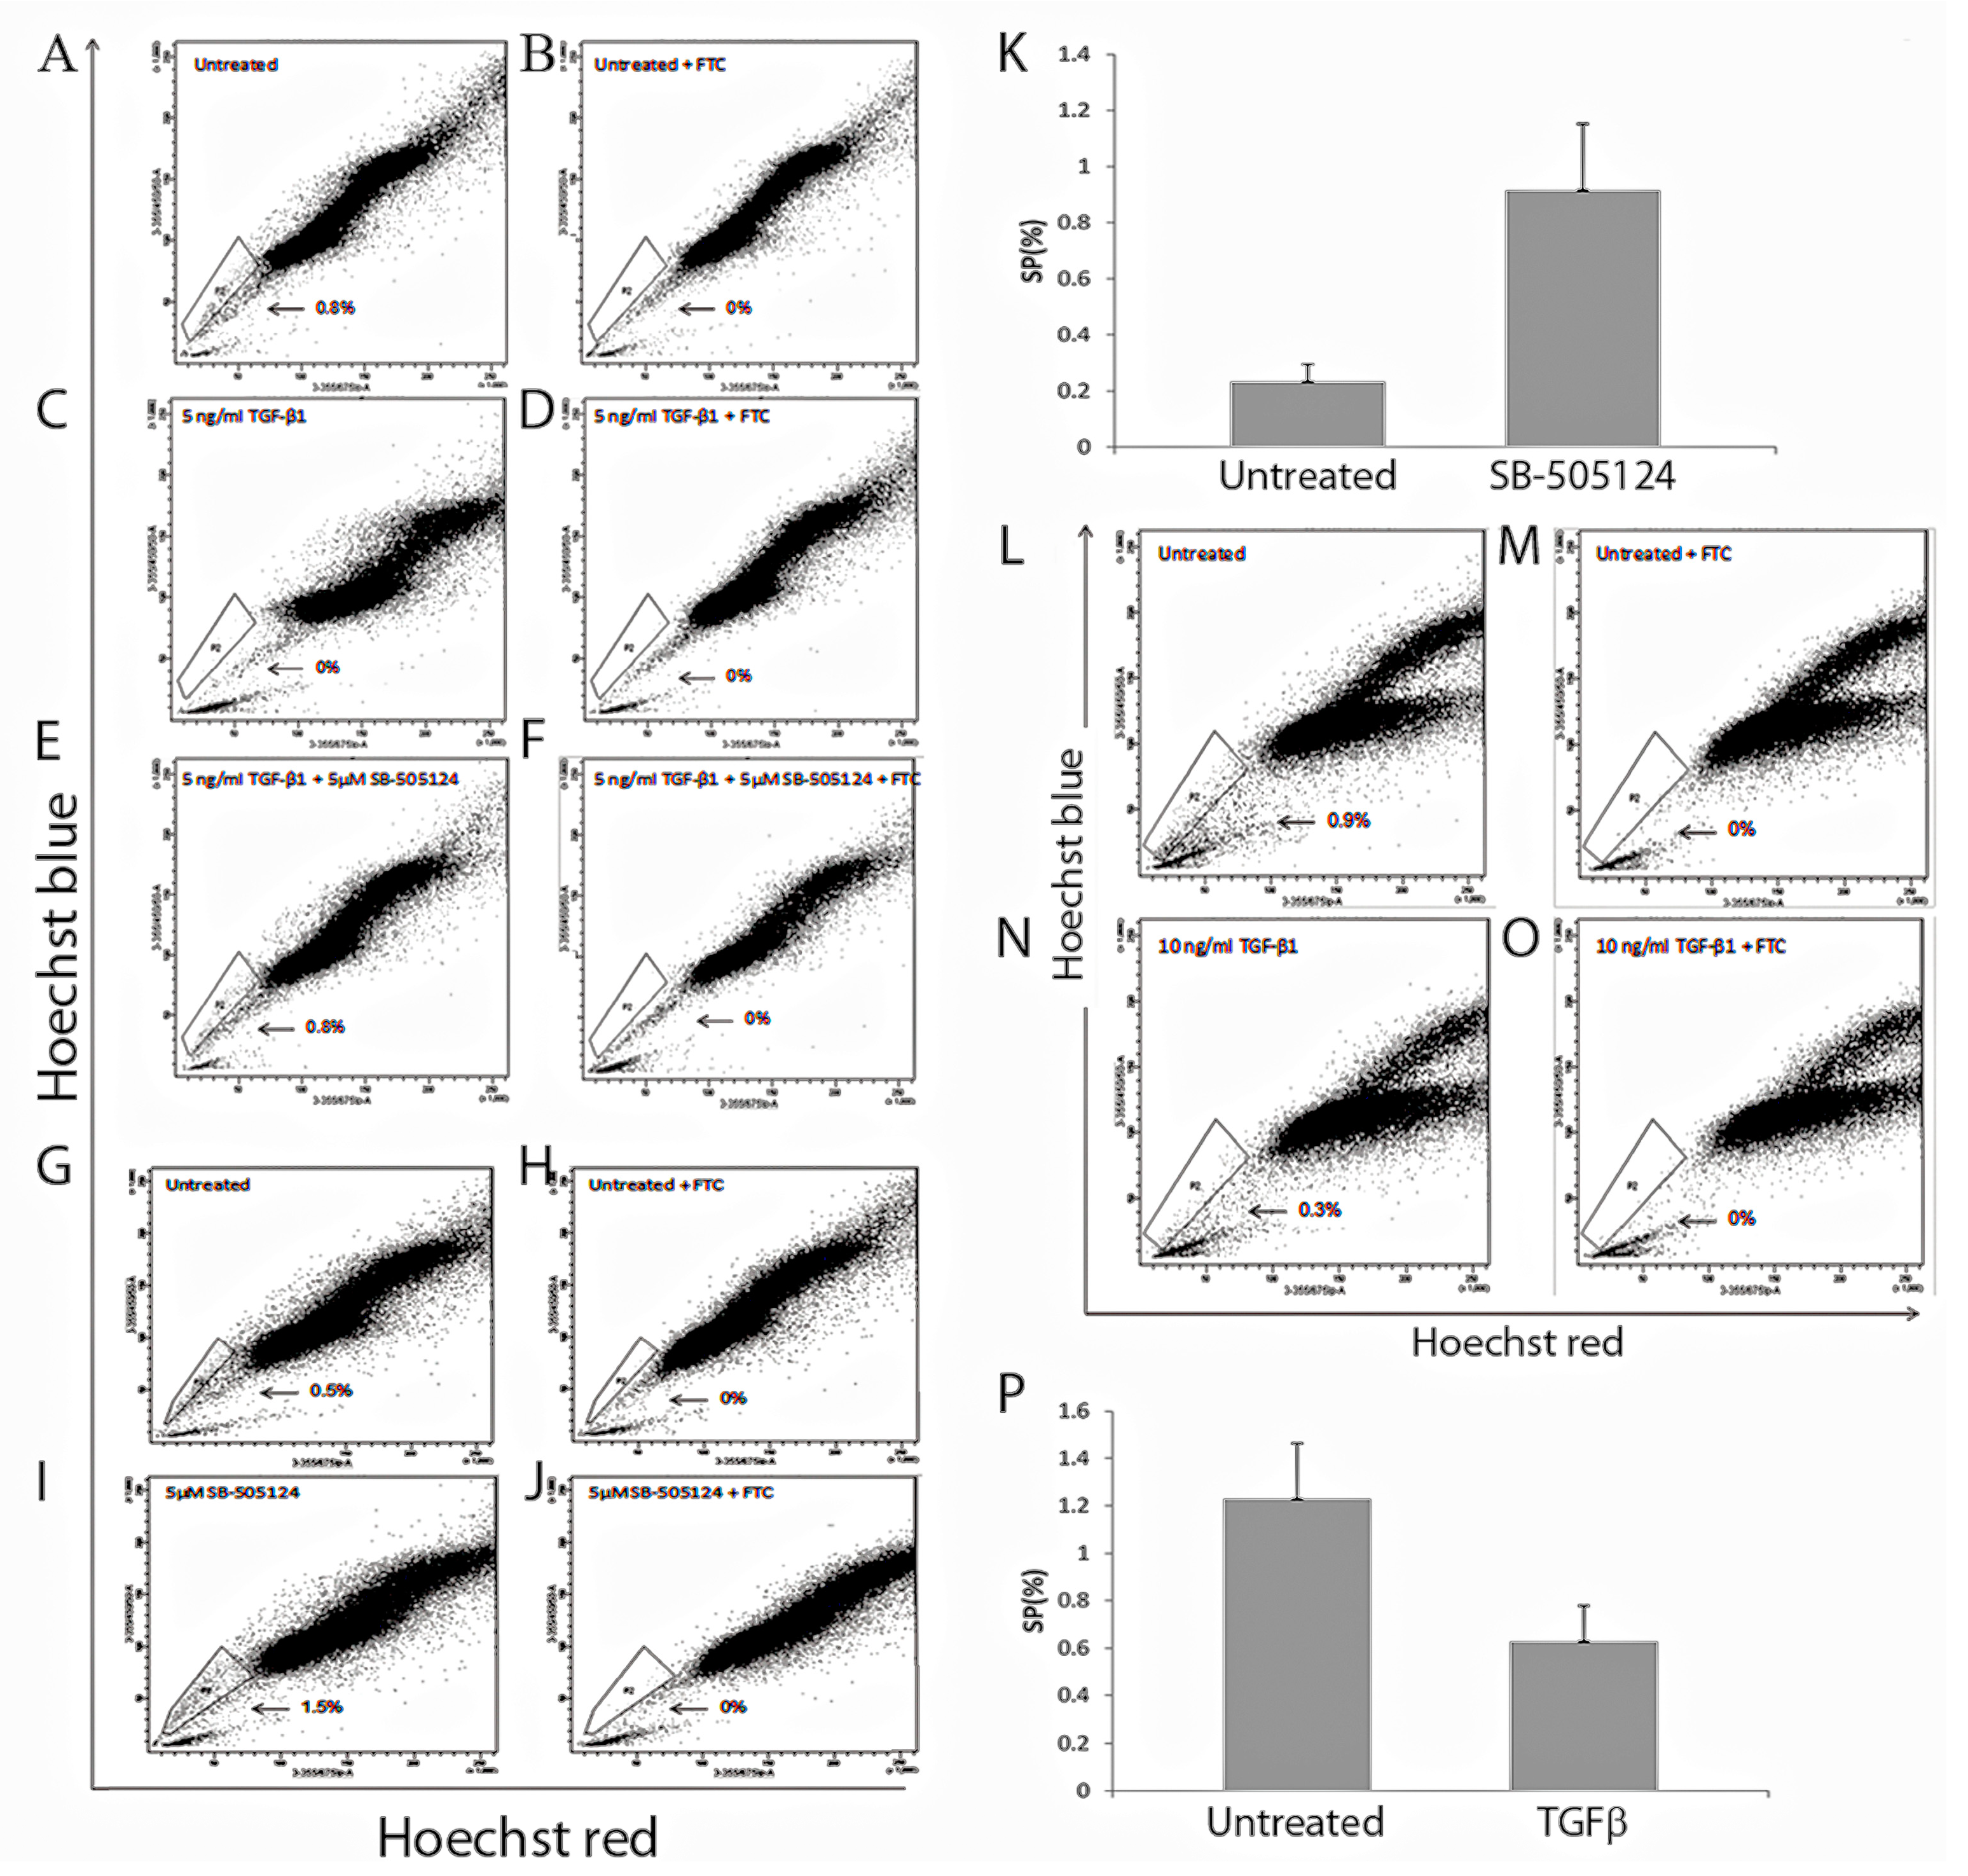
We then investigated the effect of TGF-β treatment on the SP population. This showed complete loss of the MDA-MB-231 SP phenotype [
24] and a significant reduction in the MCF7 SP population. Our MCF7 SP data is consistent with another study that demonstrated a significant decrease in the MCF7 SP which was reversed when TGF-β treatment was withdrawn [
11]. Our analysis of the responsiveness of the MCF7 and MDA-MB-231 cells lines to TGF-β1 treatment revealed differences between them. For the MDA-MB-231 the loss of SP following treatment could be reversed by the use of SB-505124, which resulted in the re-appearance of the SP population [
24]. Moreover, treatment of MDA-MB-231 cells with SB-505124 in the absence of exogenous TGF-β1 further enhanced the SP phenotype [
24], suggesting autocrine TGF-β1 production is responsible for reducing the SP numbers in this case. MCF7 cells did not survive the use of the SB-505124 inhibitor which we suggest was due to internalization of TGF-β1 and weak TGF-β signalling.
The negative regulatory role of TGF-β-driven EMT on SP cells has been shown in several other cell types. SP cells exhibited a higher tumorigenicity in vivo compared to the NSP cells from diffuse-type gastric carcinoma cell lines. This was however, reduced when cells were pre-treated with exogenous TGF-β before being injected into nude mice. Further, knock-down of Smad4 did not result in repression of ABCG2 expression in response to TGF-β, indicating that these effects were due to the TGF-β/Smad dependent pathway [
10]. SP cells from some pancreatic cell lines have also been reported to be more responsive to EMT changes induced by TGF-β in comparison to NSP cells [
25]. TGF-β treatment also caused a reduction in SP in hepatic stellate LX2 cells [
26]. In contrast, in the human gallbladder cancer cell line GBC-SD, following treatment the SP cells showed upregulated ABCG2 expression and increased drug resistance [
27].
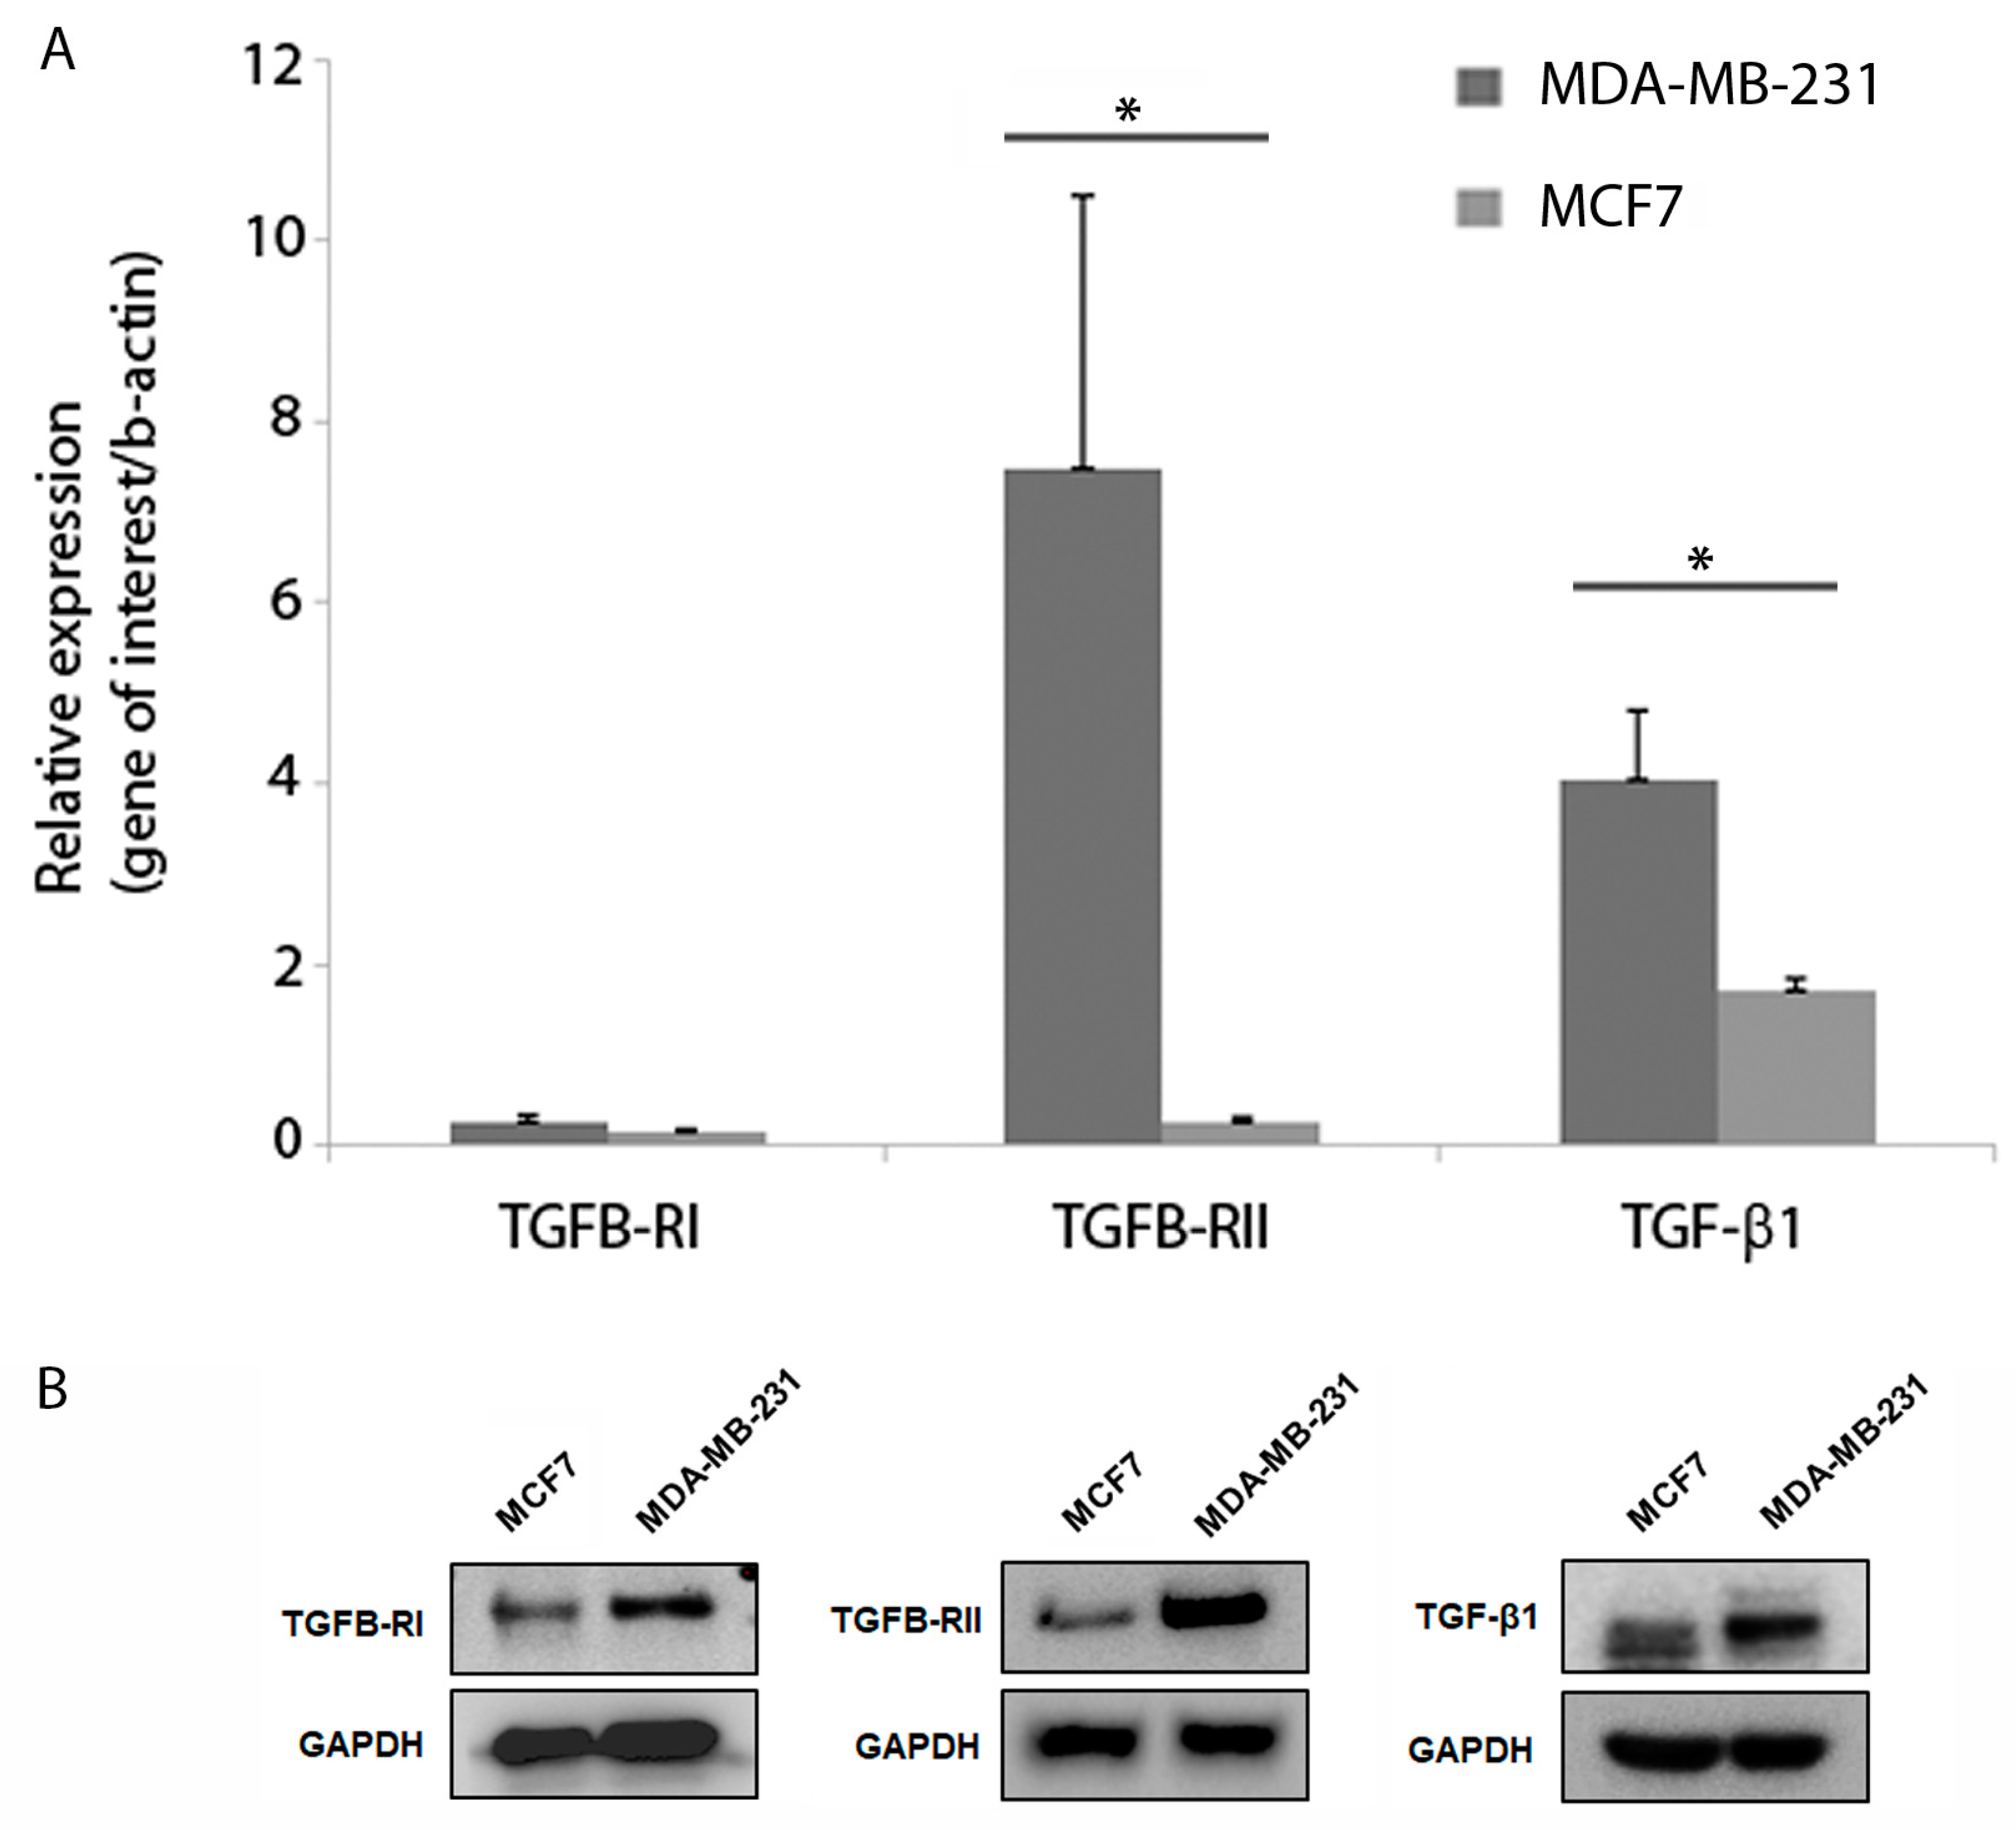
We also examined the mRNA expression of TGFB-RI and II and TGF-β1 in both cell lines and found that RII and TGF-β1 levels were significantly higher in the MDA-MB-231 cells, while RII expression was low in MCF7 cells. These results are consistent with published findings that MCF7 cells lack expression of RII, restoration of which led to the cells becoming less tumorigenic [
28]. It has been proposed that MCF7 cells are resistant to the inhibitory effects of TGF-β [
29] due to the fact that RII expression (low in MCF7) can be saturated by TGF-β1 and therefore it reaches the cells’ maximal autocrine TGF-β activity more easily [
30].
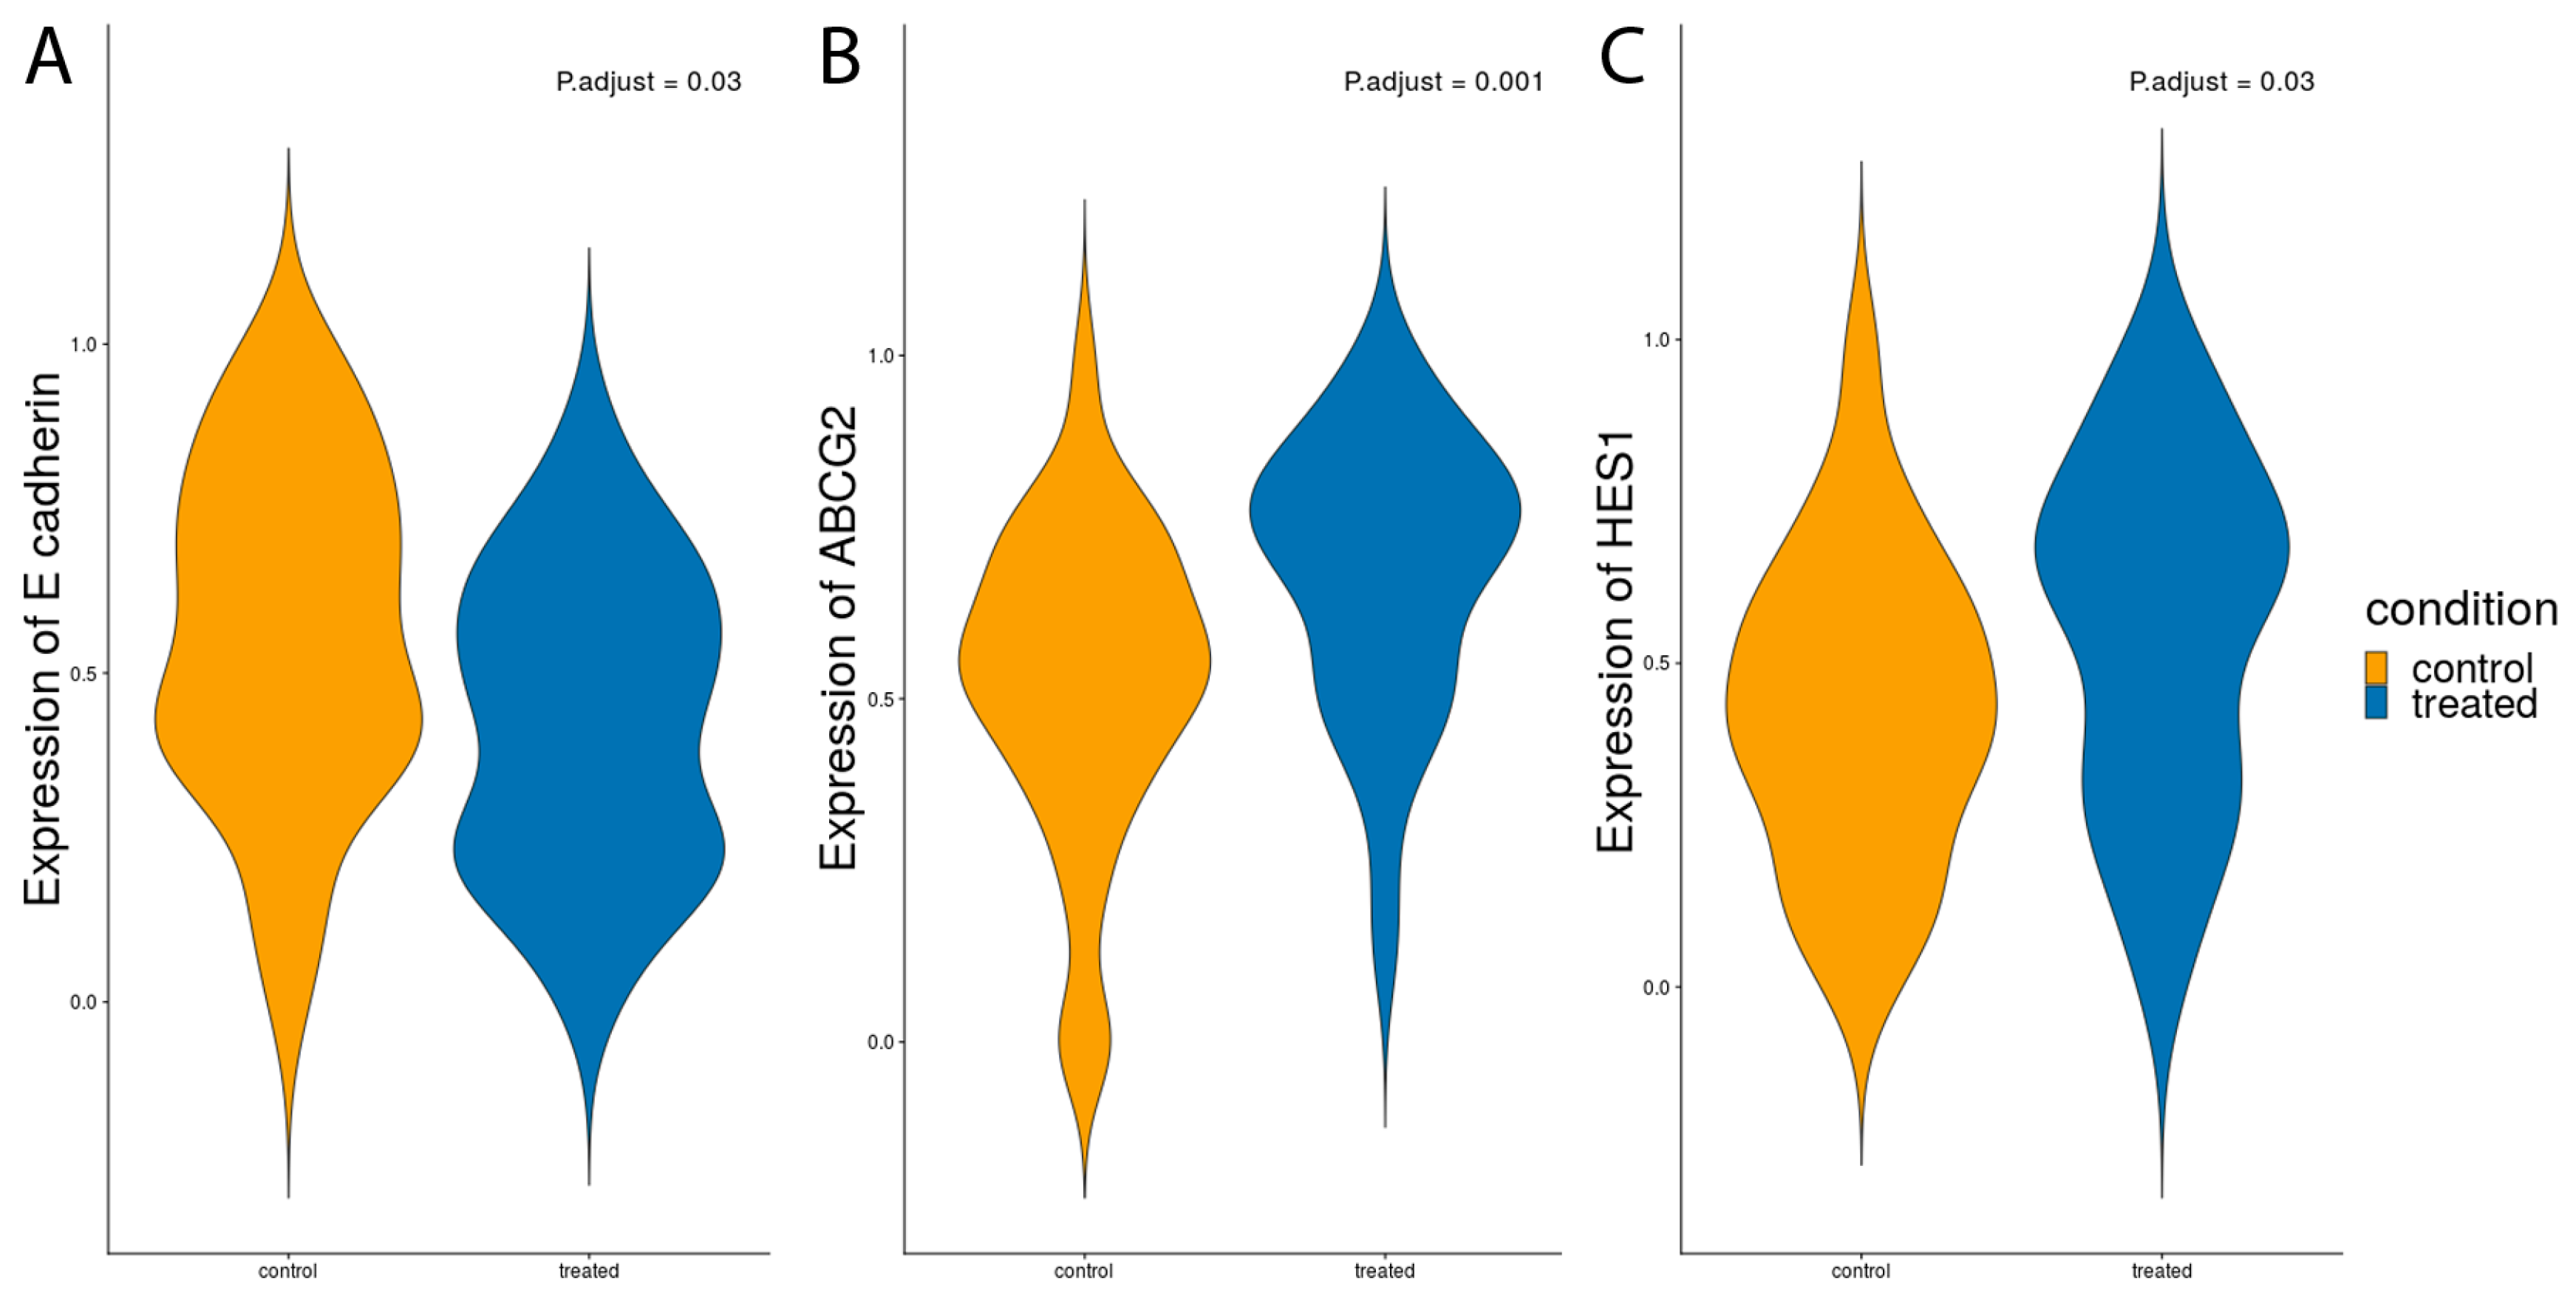
Using single cell analysis of MCF7 SP cells from the same cultures treated with and without CoCl
2, we also observed a significant increase in ABCG2 and HES1 expression and a decrease in e-cadherin in CoCl
2 treated MCF7 SP cells compared to control, suggesting activation of the EMT pathway and increased drug resistance in the treated MCF7 SP. HES1 has also been reported to promote EMT, contribute to metastasis and contribute to increased multidrug resistance of cancer cells [
31].
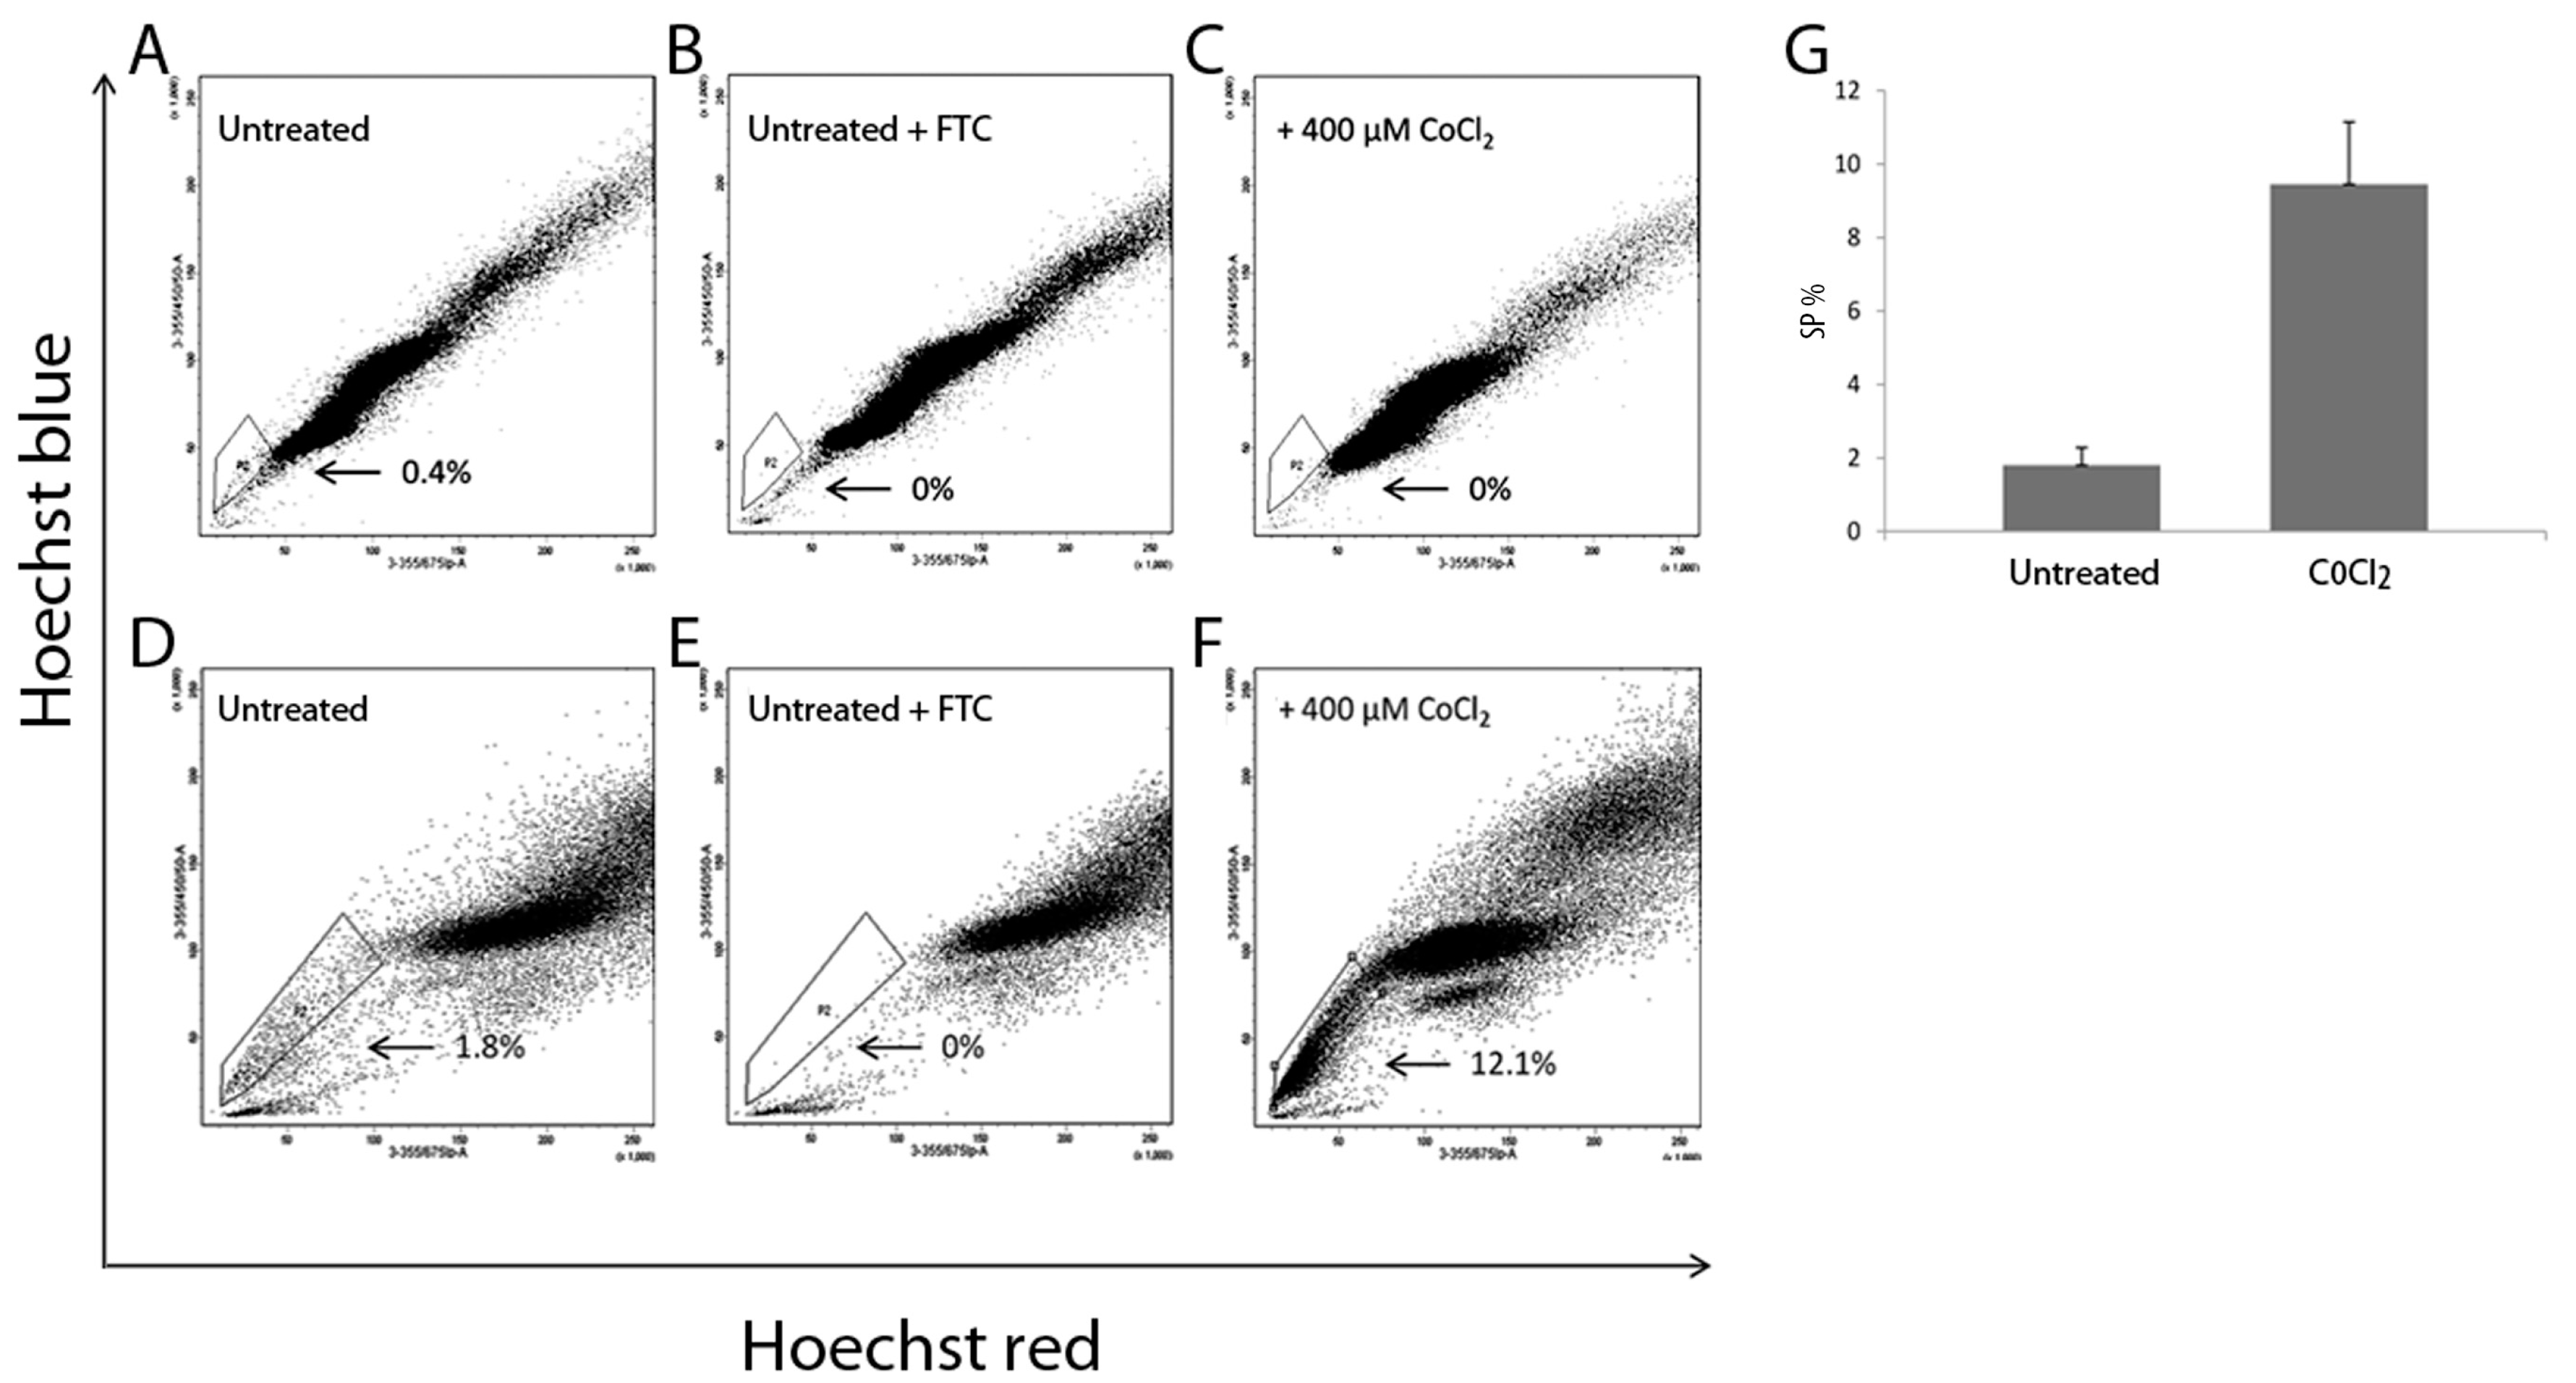
The impact of CoCl
2 on mammosphere formation in both cell lines followed a similar pattern to that of the treated SP cells, with the number of mammospheres being significantly reduced in MDA-MB-231 and significantly increased in MCF7 cells. These findings are consistent with another study that reported that estrogen receptor α (ERα) status affects the responsiveness of CSCs to hypoxia both in vitro and in vivo [
32]. In addition, they reported that ERα was essential for the induction of hypoxia-related changes, with mammosphere forming efficiency being increased in ERα-positive primary samples and cell lines and decreased in ERα-negative primary samples and cell lines in response to hypoxia. These effects were reversed on addition of 4-hydroxytamoxifen, confirming that they were due to the activation of the ERα pathway [
32].
There is accumulating evidence to support the crosstalk between the TGF-β and estrogen-signalling pathways. ER- breast cancer cell lines have been found to express receptors for TGF-β, while ER+ cell lines are characterized by low/no levels of these [
8]. Furthermore, two distinctive stem cell populations were identified in primary human breast cancer cells: CD44-, CD24+, ER+, TGFB-RII- or CD44+, CD24-, ER-, TGFB-RII+ with the latter only being able to undergo EMT due to TGF-β treatment [
9]. Therefore, ERα expression seems to play a pivotal role in the EMT response of breast CSCs. TGFB-RII receptor expression is inversely correlated with ERα expression in ERα positive breast cancer patients leading to weak TGF-β signalling. This could explain the observation that SP cells from the MCF7 cell line in our study were less responsive to the induction of EMT upon TGF-β exposure and were more prone to increase in CoCl
2 culture conditions.
HIF-1α seems to positively regulate the expression of ABCG2. However, ERα also promotes the activation of the Notch signalling pathway by activating Notch1 and Jagged1, resulting in the expression of stem cells markers and HIF-1α [
33], which can further increase ABCG2 expression. However, in ERα negative patients the TGF-β pathway is intact and thus ABCG2 expression is repressed. Further links between Erα, ABCG2 and cancer stem cells still need to be determined.
It has been reported that in MCF7 cells ERα induces pSmad2/3 degradation by forming a complex with it and ubiquitin ligase Smurf [
34]. Similarly, when the ERα gene was introduced into MDA-MB-231 cells it resulted in decreased tumour formation both in vitro and in vivo. These effects were reversed in cells overexpressing ERα and a constitutively active form of Smad2. Consequently, ERα was proposed as a negative regulator of the TGF-β/Smad dependent signalling pathway in later stages of breast cancer, although estrogen exposure drives tumour progression in early stages [
35].
To determine if CoCl
2 had an impact on drug resistance in MCF7 SP we looked at the impact of tamoxifen treatment in combination with CoCl
2. We observed that with combined treatment using a tamoxifen dose of 2.5 µM, the MCF7 SP cell numbers were reduced compared with use of CoCl
2 alone. We opted to use tamoxifen as it is known to target ER+ breast cancer cells and MCF7 cells are predominantly ER+. As the combined treatment did not deplete the MCF7 SP it could be that hypoxia has a protective effect on the SP cells [
20,
21] or be due to the presence of a tamoxifen resistant subpopulation of MCF7 cells that have been reported to have cytotoxic resistance to tamoxifen [
36].


 ,
, 