
A Novel Molecular Analysis Approach in Colorectal Cancer Suggests New Treatment Opportunities

 , , ,
, , ,
Abstract
Simple Summary
Abstract
1. Introduction
2. Material and Methods
2.1. Data Search and Curation
2.2. Gene Selection and Probabilistic Graphical Model Analysis
2.3. Biological Layer Analyses
2.4. Statistical Analyses
3. Results
3.1. Pre-Processing of Gene Expression and Clinical Data
3.2. Patient Characteristics
3.3. Functional Characterization
3.4. Biological Layer Analysis
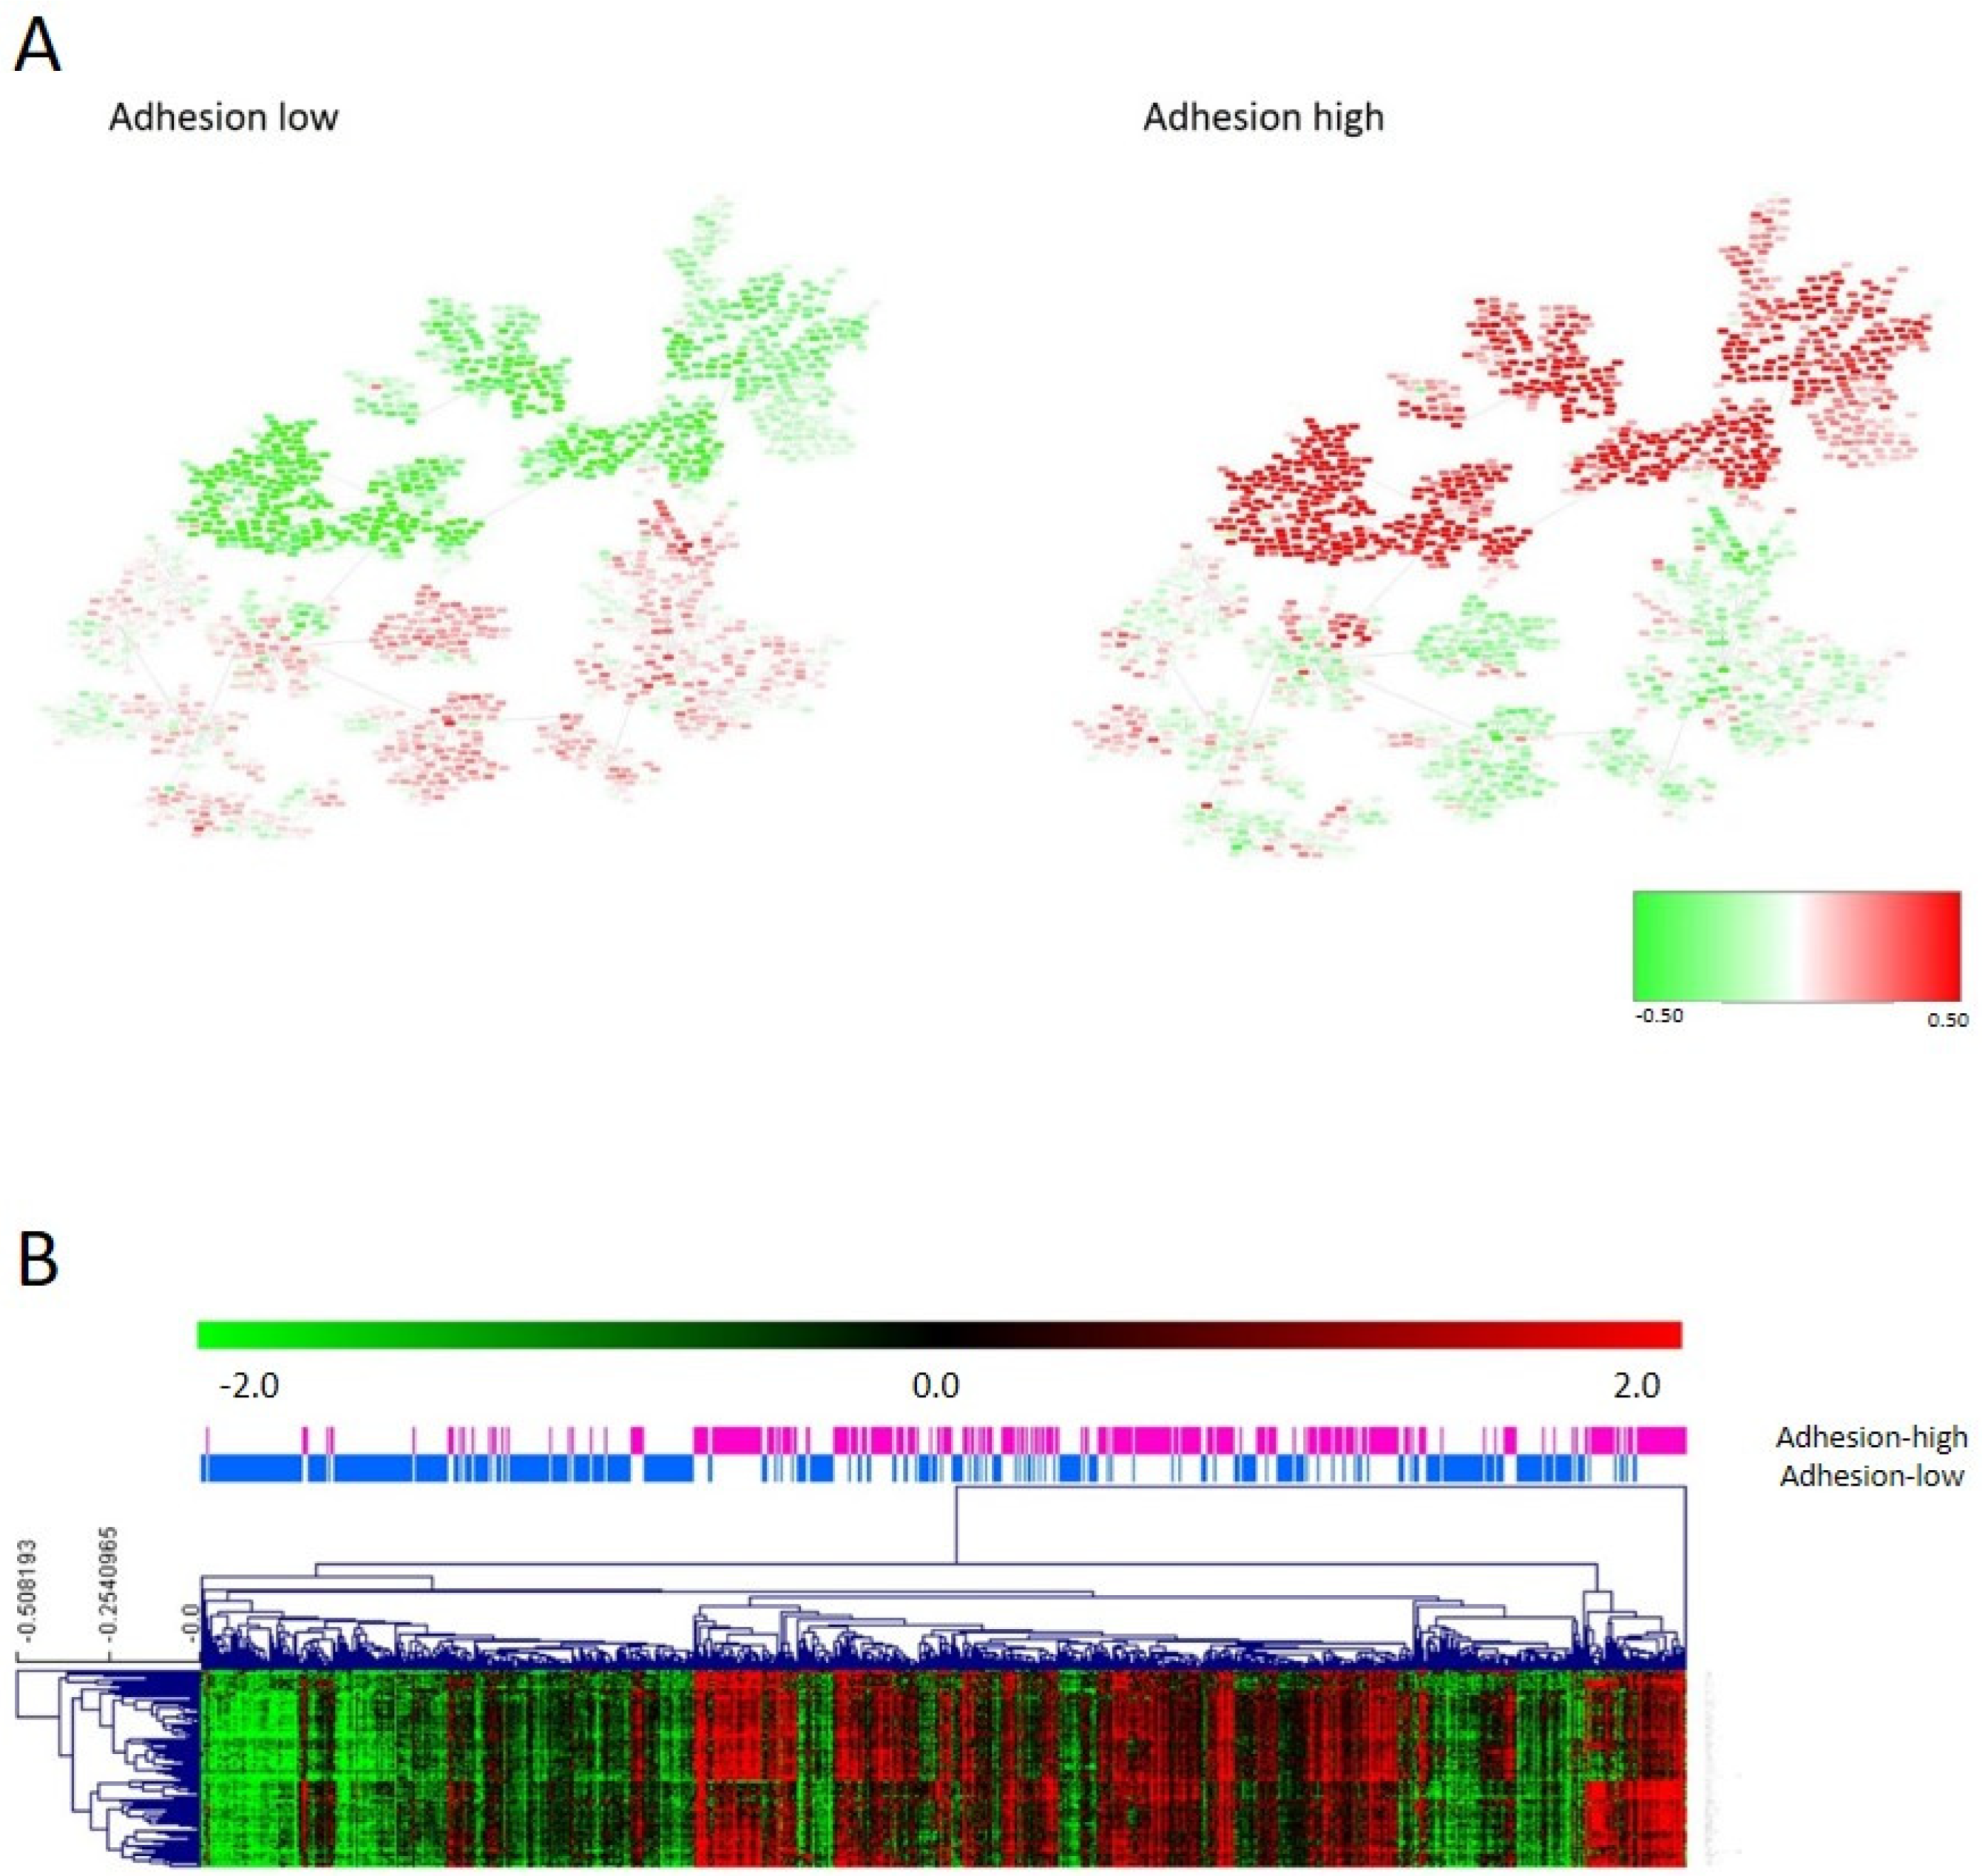
3.5. Adhesion Layer
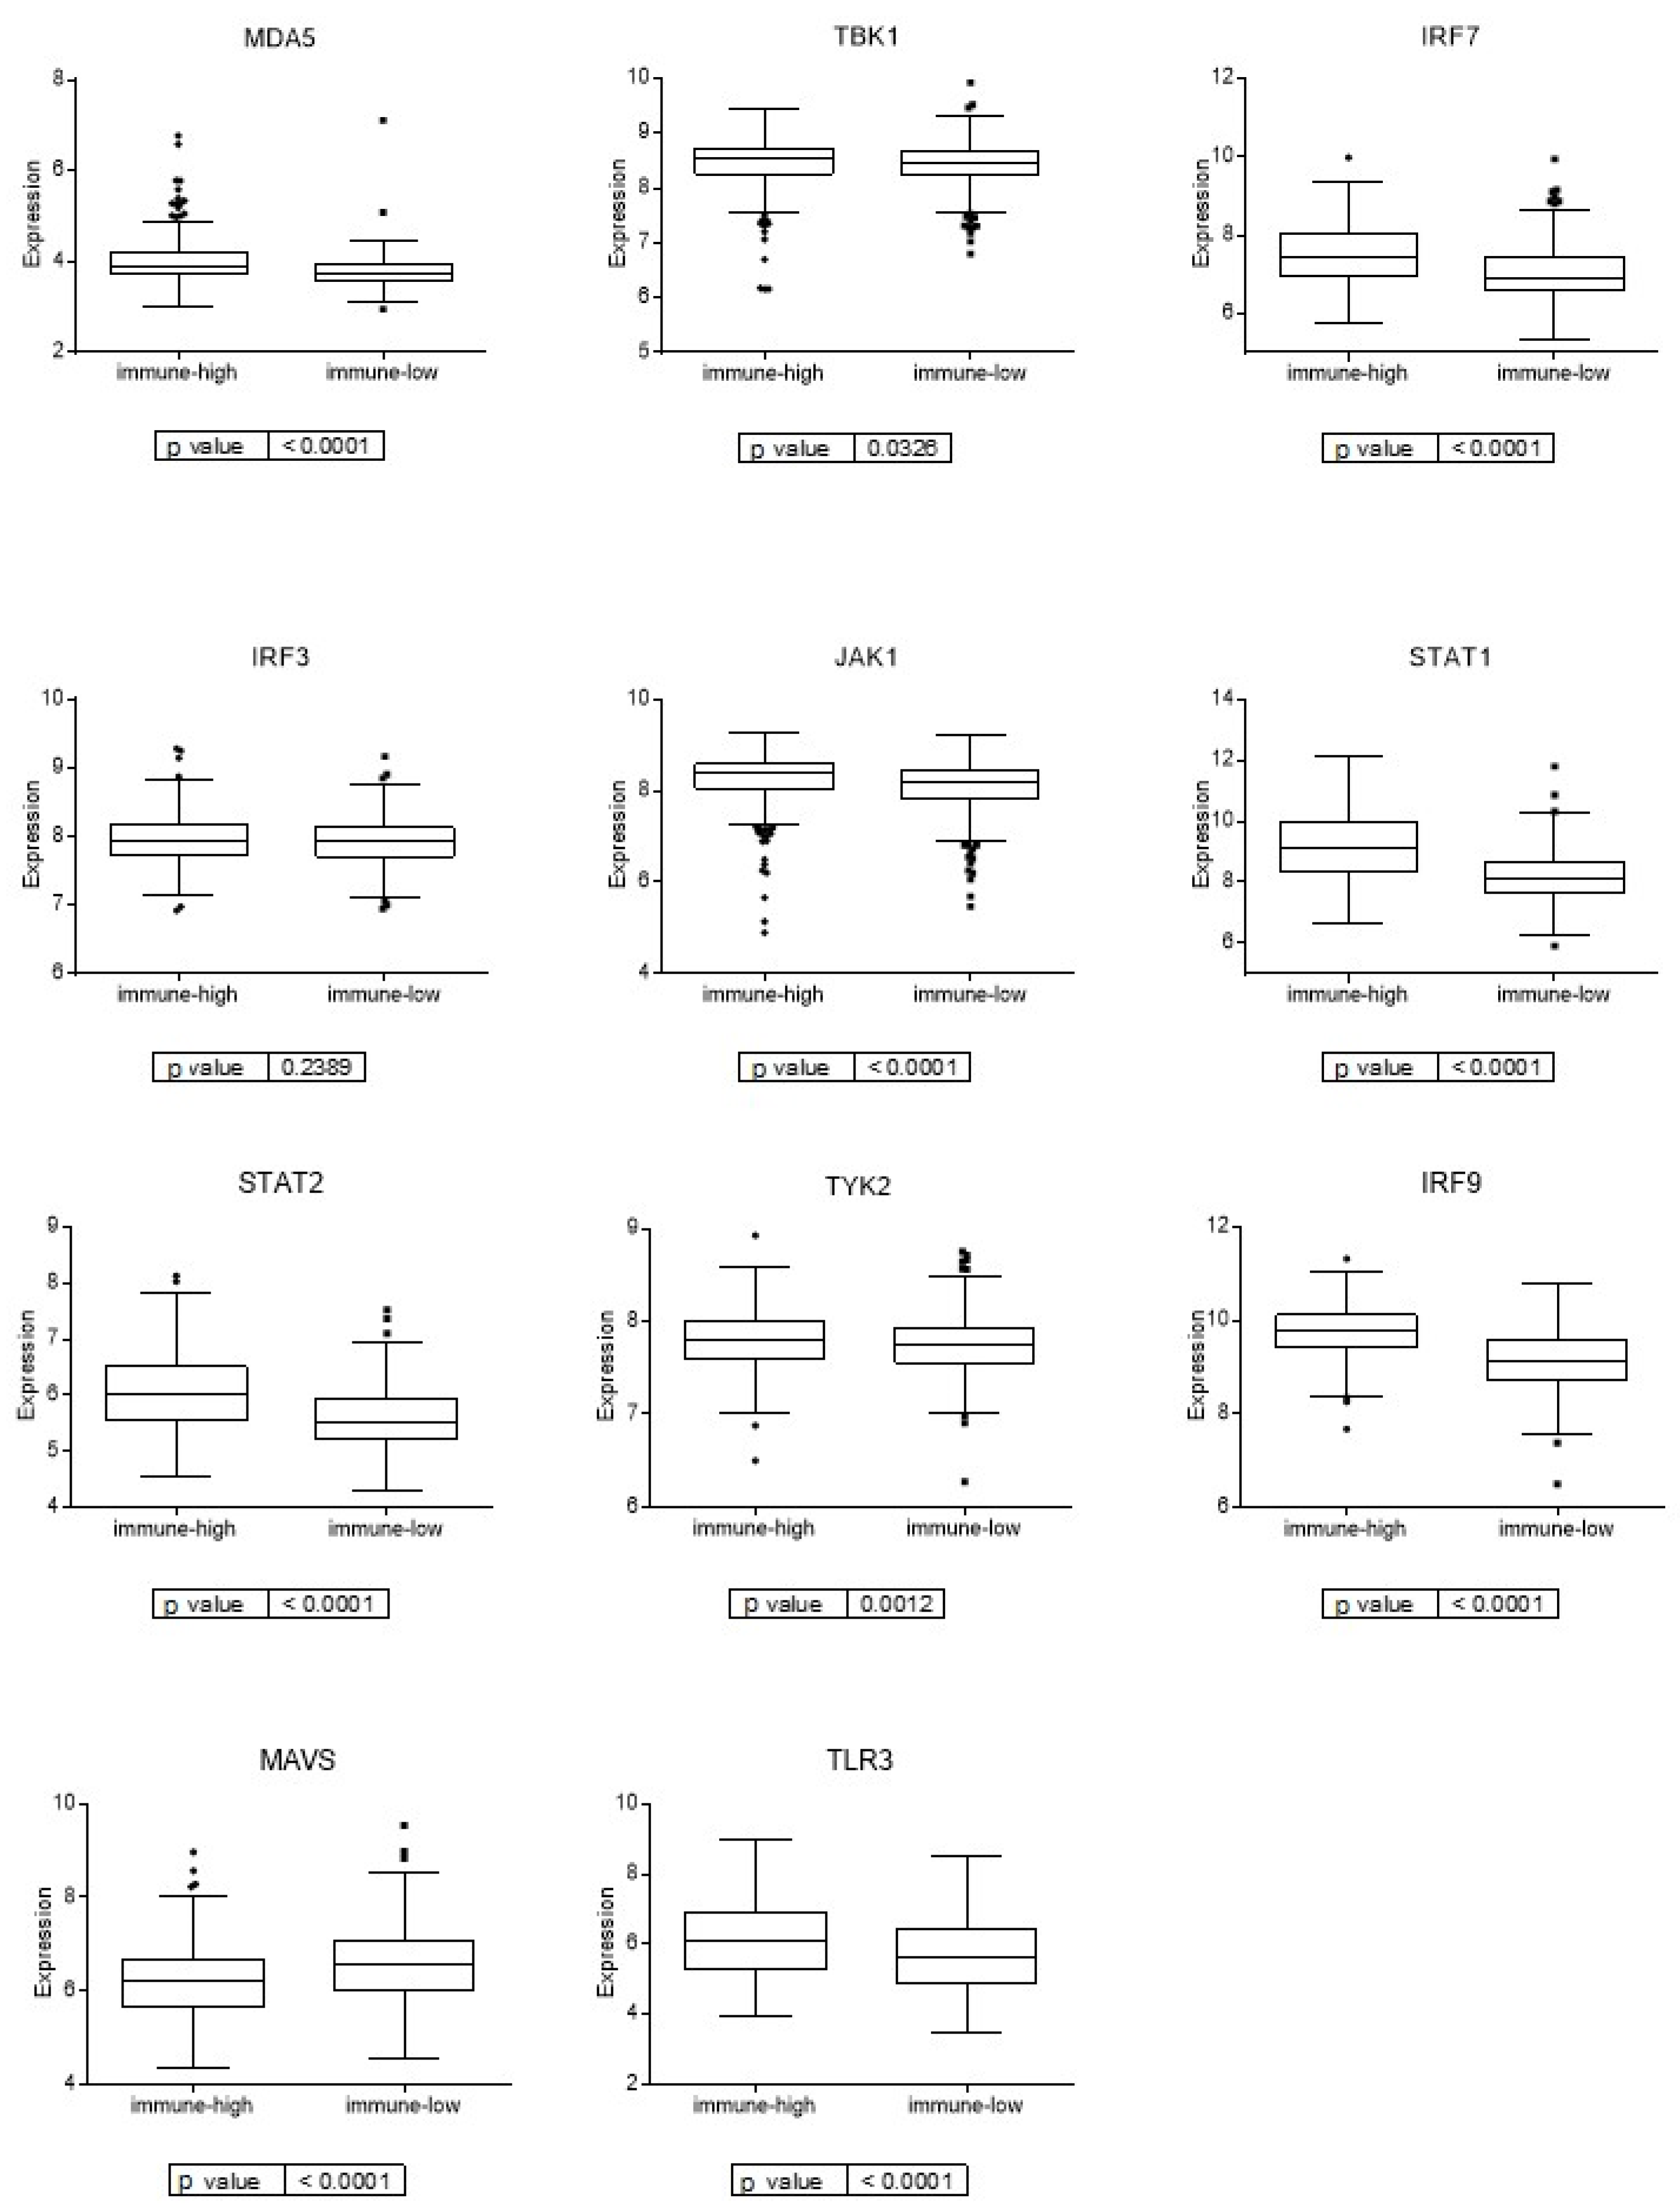
3.6. Immune Layer
3.7. Molecular Layer
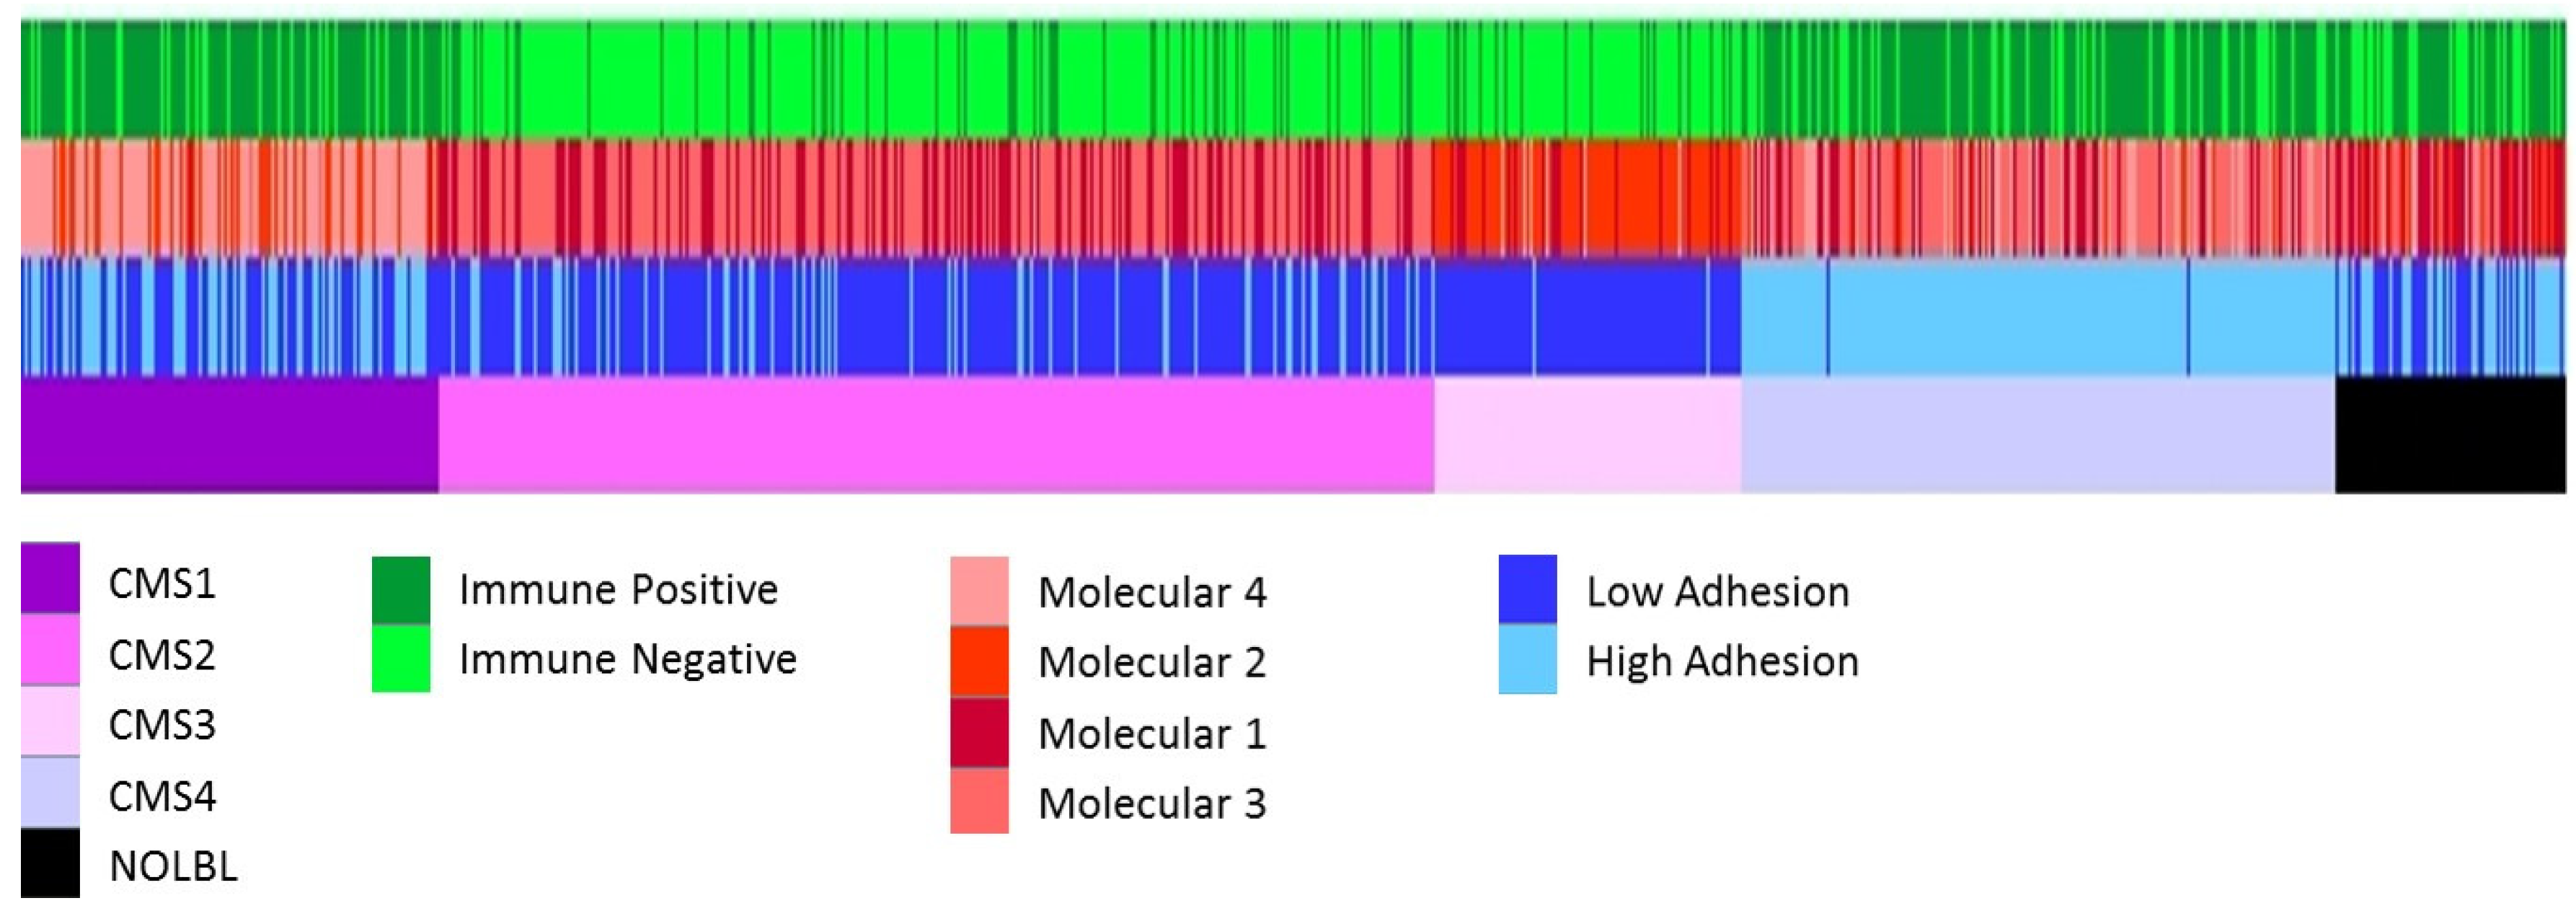
3.8. Comparison between Layer Classification and CMS
4. Discussion
5. Conclusions
Supplementary Materials
Author Contributions
Funding
Institutional Review Board Statement
Informed Consent Statement
Data Availability Statement
Conflicts of Interest
References
- Sung, H.; Ferlay, J.; Siegel, R.L.; Laversanne, M.; Soerjomataram, I.; Jemal, A.; Bray, F. Global Cancer Statistics 2020: GLOBOCAN Estimates of Incidence and Mortality Worldwide for 36 Cancers in 185 Countries. CA Cancer J. Clin. 2021, 71, 209–249. [Google Scholar] [CrossRef] [PubMed]
- Cancer Genome Atlas Network. Comprehensive molecular characterization of human colon and rectal cancer. Nature 2012, 487, 330–337. [Google Scholar] [CrossRef]
- Lee, G.H.; Malietzis, G.; Askari, A.; Bernardo, D.; Al-Hassi, H.O.; Clark, S.K. Is right-sided colon cancer different to left-sided colorectal cancer?—A systematic review. Eur. J. Surg. Oncol. 2015, 41, 300–308. [Google Scholar] [CrossRef] [PubMed]
- Bufill, J.A. Colorectal cancer: Evidence for distinct genetic categories based on proximal or distal tumor location. Ann. Intern. Med. 1990, 113, 779–788. [Google Scholar] [CrossRef]
- Gong, P.; Chen, C.; Wang, Z.; Zhang, X.; Hu, W.; Hu, Z.; Li, X. Prognostic significance for colorectal carcinoid tumors based on the 8th edition TNM staging system. Cancer Med. 2020, 9, 7979–7987. [Google Scholar] [CrossRef]
- Ten Hoorn, S.; de Back, T.R.; Sommeijer, D.W.; Vermeulen, L. Clinical Value of Consensus Molecular Subtypes in Colorectal Cancer: A Systematic Review and Meta-Analysis. J. Natl. Cancer Inst. 2022, 114, 503–516. [Google Scholar] [CrossRef]
- Guinney, J.; Dienstmann, R.; Wang, X.; de Reyniès, A.; Schlicker, A.; Soneson, C.; Marisa, L.; Roepman, P.; Nyamundanda, G.; Angelino, P.; et al. The consensus molecular subtypes of colorectal cancer. Nat. Med. 2015, 21, 1350–1356. [Google Scholar] [CrossRef]
- Mooi, J.K.; Wirapati, P.; Asher, R.; Lee, C.K.; Savas, P.; Price, T.J.; Townsend, A.; Hardingham, J.; Buchanan, D.; Williams, D.; et al. The prognostic impact of consensus molecular subtypes (CMS) and its predictive effects for bevacizumab benefit in metastatic colorectal cancer: Molecular analysis of the AGITG MAX clinical trial. Ann. Oncol. 2018, 29, 2240–2246. [Google Scholar] [CrossRef]
- Lenz, H.J.; Ou, F.S.; Venook, A.P.; Hochster, H.S.; Niedzwiecki, D.; Goldberg, R.M.; Mayer, R.J.; Bertagnolli, M.M.; Blanke, C.D.; Zemla, T.; et al. Impact of Consensus Molecular Subtype on Survival in Patients with Metastatic Colorectal Cancer: Results from CALGB/SWOG 80405 (Alliance). J. Clin. Oncol. 2019, 37, 1876–1885. [Google Scholar] [CrossRef]
- Okita, A.; Takahashi, S.; Ouchi, K.; Inoue, M.; Watanabe, M.; Endo, M.; Honda, H.; Yamada, Y.; Ishioka, C. Consensus molecular subtypes classification of colorectal cancer as a predictive factor for chemotherapeutic efficacy against metastatic colorectal cancer. Oncotarget 2018, 9, 18698–18711. [Google Scholar] [CrossRef]
- Rodriguez-Salas, N.; Dominguez, G.; Barderas, R.; Mendiola, M.; García-Albéniz, X.; Maurel, J.; Batlle, J.F. Clinical relevance of colorectal cancer molecular subtypes. Crit. Rev. Oncol. Hematol. 2017, 109, 9–19. [Google Scholar] [CrossRef] [PubMed]
- Ignatova, E.O.; Kozlov, E.; Ivanov, M.; Mileyko, V.; Menshikova, S.; Sun, H.; Fedyanin, M.; Tryakin, A.; Stilidi, I. Clinical significance of molecular subtypes of gastrointestinal tract adenocarcinoma. World J. Gastrointest. Oncol. 2022, 14, 628–645. [Google Scholar] [CrossRef] [PubMed]
- de Velasco, G.; Trilla-Fuertes, L.; Gamez-Pozo, A.; Urbanowicz, M.; Ruiz-Ares, G.; Sepúlveda, J.M.; Prado-Vazquez, G.; Arevalillo, J.M.; Zapater-Moros, A.; Navarro, H.; et al. Urothelial cancer proteomics provides both prognostic and functional information. Sci. Rep. 2017, 7, 15819. [Google Scholar] [CrossRef]
- Gámez-Pozo, A.; Berges-Soria, J.; Arevalillo, J.M.; Nanni, P.; López-Vacas, R.; Navarro, H.; Grossmann, J.; Castaneda, C.A.; Main, P.; Díaz-Almirón, M.; et al. Combined Label-Free Quantitative Proteomics and microRNA Expression Analysis of Breast Cancer Unravel Molecular Differences with Clinical Implications. Cancer Res. 2015, 75, 2243–2253. [Google Scholar] [CrossRef] [PubMed]
- Gámez-Pozo, A.; Trilla-Fuertes, L.; Berges-Soria, J.; Selevsek, N.; López-Vacas, R.; Díaz-Almirón, M.; Nanni, P.; Arevalillo, J.M.; Navarro, H.; Grossmann, J.; et al. Functional proteomics outlines the complexity of breast cancer molecular subtypes. Sci. Rep. 2017, 7, 10100. [Google Scholar] [CrossRef] [PubMed]
- Trilla-Fuertes, L.; Gámez-Pozo, A.; Arevalillo, J.M.; Díaz-Almirón, M.; Prado-Vázquez, G.; Zapater-Moros, A.; Navarro, H.; Aras-López, R.; Dapía, I.; López-Vacas, R.; et al. Molecular characterization of breast cancer cell response to metabolic drugs. Oncotarget 2018, 9, 9645–9660. [Google Scholar] [CrossRef]
- Zapater-Moros, A.; Gámez-Pozo, A.; Prado-Vázquez, G.; Trilla-Fuertes, L.; Arevalillo, J.M.; Díaz-Almirón, M.; Navarro, H.; Maín, P.; Feliú, J.; Zamora, P.; et al. Probabilistic graphical models relate immune status with response to neoadjuvant chemotherapy in breast cancer. Oncotarget 2018, 9, 27586–27594. [Google Scholar] [CrossRef]
- Prado-Vázquez, G.; Gámez-Pozo, A.; Trilla-Fuertes, L.; Arevalillo, J.M.; Zapater-Moros, A.; Ferrer-Gómez, M.; Díaz-Almirón, M.; López-Vacas, R.; Navarro, H.; Maín, P.; et al. A novel approach to triple-negative breast cancer molecular classification reveals a luminal immune-positive subgroup with good prognoses. Sci. Rep. 2019, 9, 1538. [Google Scholar] [CrossRef]
- Witten, D.M.; Tibshirani, R. A framework for feature selection in clustering. J. Am. Stat. Assoc. 2010, 105, 713–726. [Google Scholar] [CrossRef]
- Monti, S.; Tamayo, P.; Mesirov, J.; Golub, T. Consensus Clustering: A Resampling-Based Method for Class Discovery and Visualization of Gene Expression Microarray Data. Mach. Learn. 2003, 52, 91–118. [Google Scholar] [CrossRef]
- Ritchie, M.E.; Phipson, B.; Wu, D.; Hu, Y.; Law, C.W.; Shi, W.; Smyth, G.K. limma powers differential expression analyses for RNA-sequencing and microarray studies. Nucleic Acids Res. 2015, 43, e47. [Google Scholar] [CrossRef] [PubMed]
- Derry, J.M.; Mangravite, L.M.; Suver, C.; Furia, M.D.; Henderson, D.; Schildwachter, X.; Bot, B.; Izant, J.; Sieberts, S.K.; Kellen, M.R.; et al. Developing predictive molecular maps of human disease through community-based modeling. Nat. Genet. 2012, 44, 127–130. [Google Scholar] [CrossRef] [PubMed]
- Abreu, G.C.G.; Labouriau, R.; Edwards, D. High-Dimensional Graphical Model Search with the gRapHD R Package. J. Stat. Softw. 2010, 37, 1–18. [Google Scholar] [CrossRef]
- Computing, R. R: A Language and Environment for Statistical Computing; R Core Team: Vienna, Austria, 2013. [Google Scholar]
- Huang, D.W.; Sherman, B.T.; Lempicki, R.A. Systematic and integrative analysis of large gene lists using DAVID bioinformatics resources. Nat. Protoc. 2009, 4, 44–57. [Google Scholar] [CrossRef] [PubMed]
- Trilla-Fuertes, L.; Gámez-Pozo, A.; Prado-Vázquez, G.; Zapater-Moros, A.; Díaz-Almirón, M.; Arevalillo, J.M.; Ferrer-Gómez, M.; Navarro, H.; Maín, P.; Espinosa, E.; et al. Biological molecular layer classification of muscle-invasive bladder cancer opens new treatment opportunities. BMC Cancer 2019, 19, 636. [Google Scholar] [CrossRef]
- Tusher, V.G.; Tibshirani, R.; Chu, G. Significance analysis of microarrays applied to the ionizing radiation response. Proc. Natl. Acad. Sci. USA 2001, 98, 5116–5121. [Google Scholar] [CrossRef]
- Saeed, A.I.; Sharov, V.; White, J.; Li, J.; Liang, W.; Bhagabati, N.; Braisted, J.; Klapa, M.; Currier, T.; Thiagarajan, M.; et al. TM4: A free, open-source system for microarray data management and analysis. Biotechniques 2003, 34, 374–378. [Google Scholar] [CrossRef]
- Shannon, P.; Markiel, A.; Ozier, O.; Baliga, N.S.; Wang, J.T.; Ramage, D.; Amin, N.; Schwikowski, B.; Ideker, T. Cytoscape: A software environment for integrated models of biomolecular interaction networks. Genome Res. 2003, 13, 2498–2504. [Google Scholar] [CrossRef]
- Edgar, R.; Domrachev, M.; Lash, A.E. Gene Expression Omnibus: NCBI gene expression and hybridization array data repository. Nucleic Acids Res. 2002, 30, 207–210. [Google Scholar] [CrossRef]
- Chen, R.; Ishak, C.A.; De Carvalho, D.D. Endogenous Retroelements and the Viral Mimicry Response in Cancer Therapy and Cellular Homeostasis. Cancer Discov. 2021, 11, 2707–2725. [Google Scholar] [CrossRef]
- Xi, Y.; Xu, P. Global colorectal cancer burden in 2020 and projections to 2040. Transl. Oncol. 2021, 14, 101174. [Google Scholar] [CrossRef] [PubMed]
- Rebersek, M. Consensus molecular subtypes (CMS) in metastatic colorectal cancer—Personalized medicine decision. Radiol. Oncol. 2020, 54, 272–277. [Google Scholar] [CrossRef]
- Lenz, H.J.; Argiles, G.; Yoshino, T.; Tejpar, S.; Ciardiello, F.; Braunger, J.; Salnikov, A.V.; Gabrielyan, O.; Schmid, R.; Höfler, J.; et al. Association of Consensus Molecular Subtypes and Molecular Markers with Clinical Outcomes in Patients with Metastatic Colorectal Cancer: Biomarker Analyses from LUME-Colon 1. Clin. Color. Cancer 2021, 20, 84–95.e88. [Google Scholar] [CrossRef]
- Stintzing, S.; Wirapati, P.; Lenz, H.J.; Neureiter, D.; Fischer von Weikersthal, L.; Decker, T.; Kiani, A.; Kaiser, F.; Al-Batran, S.; Heintges, T.; et al. Consensus molecular subgroups (CMS) of colorectal cancer (CRC) and first-line efficacy of FOLFIRI plus cetuximab or bevacizumab in the FIRE3 (AIO KRK-0306) trial. Ann. Oncol. 2019, 30, 1796–1803. [Google Scholar] [CrossRef] [PubMed]
- Bramsen, J.B.; Rasmussen, M.H.; Ongen, H.; Mattesen, T.B.; Ørntoft, M.W.; Árnadóttir, S.S.; Sandoval, J.; Laguna, T.; Vang, S.; Øster, B.; et al. Molecular-Subtype-Specific Biomarkers Improve Prediction of Prognosis in Colorectal Cancer. Cell Rep. 2017, 19, 1268–1280. [Google Scholar] [CrossRef]
- Dienstmann, R.; Vermeulen, L.; Guinney, J.; Kopetz, S.; Tejpar, S.; Tabernero, J. Consensus molecular subtypes and the evolution of precision medicine in colorectal cancer. Nat. Rev. Cancer 2017, 17, 79–92. [Google Scholar] [CrossRef] [PubMed]
- Adam, R.S.; Poel, D.; Ferreira Moreno, L.; Spronck, J.; de Back, T.R.; Torang, A.; Barila Gomez, P.M.; Ten Hoorn, S.; Markowetz, F.; Wang, X.; et al. Development of a miRNA-based classifier for detection of colorectal cancer molecular subtypes. Mol. Oncol. 2022, 16, 2693–2709. [Google Scholar] [CrossRef]
- Hu, F.; Wang, J.; Zhang, M.; Wang, S.; Zhao, L.; Yang, H.; Wu, J.; Cui, B. Comprehensive Analysis of Subtype-Specific Molecular Characteristics of Colon Cancer: Specific Genes, Driver Genes, Signaling Pathways, and Immunotherapy Responses. Front. Cell Dev. Biol. 2021, 9, 758776. [Google Scholar] [CrossRef]
- Gámez-Pozo, A.; Trilla-Fuertes, L.; Prado-Vázquez, G.; Chiva, C.; López-Vacas, R.; Nanni, P.; Berges-Soria, J.; Grossmann, J.; Díaz-Almirón, M.; Ciruelos, E.; et al. Prediction of adjuvant chemotherapy response in triple negative breast cancer with discovery and targeted proteomics. PLoS ONE 2017, 12, e0178296. [Google Scholar] [CrossRef]
- Korb, T.; Schlüter, K.; Enns, A.; Spiegel, H.U.; Senninger, N.; Nicolson, G.L.; Haier, J. Integrity of actin fibers and microtubules influences metastatic tumor cell adhesion. Exp. Cell Res. 2004, 299, 236–247. [Google Scholar] [CrossRef]
- Seo, K.J.; Kim, M.; Kim, J. Prognostic implications of adhesion molecule expression in colorectal cancer. Int. J. Clin. Exp. Pathol. 2015, 8, 4148–4157. [Google Scholar] [PubMed]
- Ando, T.; Tai-Nagara, I.; Sugiura, Y.; Kusumoto, D.; Okabayashi, K.; Kido, Y.; Sato, K.; Saya, H.; Navankasattusas, S.; Li, D.Y.; et al. Tumor-specific interendothelial adhesion mediated by FLRT2 facilitates cancer aggressiveness. J. Clin. Investig. 2022, 132, e153626. [Google Scholar] [CrossRef] [PubMed]
- Goto, K.; Osaki, M.; Izutsu, R.; Tanaka, H.; Sasaki, R.; Tanio, A.; Satofuka, H.; Kazuki, Y.; Yamamoto, M.; Kugoh, H.; et al. Establishment of an antibody specific for AMIGO2 improves immunohistochemical evaluation of liver metastases and clinical outcomes in patients with colorectal cancer. Diagn. Pathol. 2022, 17, 16. [Google Scholar] [CrossRef] [PubMed]
- Meng, C.; Zhang, Y.; Jiang, D.; Wang, J. CTHRC1 is a prognosis-related biomarker correlated with immune infiltrates in colon adenocarcinoma. World J. Surg. Oncol. 2022, 20, 89. [Google Scholar] [CrossRef] [PubMed]
- Pang, C.; Wang, H.; Shen, C.; Liang, H. Application Potential of CTHRC1 as a Diagnostic and Prognostic Indicator for Colon Adenocarcinoma. Front. Mol. Biosci. 2022, 9, 849771. [Google Scholar] [CrossRef] [PubMed]
- Papaioannou, N.E.; Beniata, O.V.; Vitsos, P.; Tsitsilonis, O.; Samara, P. Harnessing the immune system to improve cancer therapy. Ann. Transl. Med. 2016, 4, 261. [Google Scholar] [CrossRef]
- Gorzo, A.; Galos, D.; Volovat, S.R.; Lungulescu, C.V.; Burz, C.; Sur, D. Landscape of Immunotherapy Options for Colorectal Cancer: Current Knowledge and Future Perspectives beyond Immune Checkpoint Blockade. Life 2022, 12, 229. [Google Scholar] [CrossRef] [PubMed]
- Morse, M.A.; Hochster, H.; Benson, A. Perspectives on Treatment of Metastatic Colorectal Cancer with Immune Checkpoint Inhibitor Therapy. Oncologist 2020, 25, 33–45. [Google Scholar] [CrossRef]
- Huyghe, N.; Baldin, P.; Van den Eynde, M. Immunotherapy with immune checkpoint inhibitors in colorectal cancer: What is the future beyond deficient mismatch-repair tumours? Gastroenterol. Rep. 2020, 8, 11–24. [Google Scholar] [CrossRef]
- Kawazu, M.; Ueno, T.; Saeki, K.; Sax, N.; Togashi, Y.; Kanaseki, T.; Chida, K.; Kishigami, F.; Sato, K.; Kojima, S.; et al. HLA Class I Analysis Provides Insight Into the Genetic and Epigenetic Background of Immune Evasion in Colorectal Cancer with High Microsatellite Instability. Gastroenterology 2022, 162, 799–812. [Google Scholar] [CrossRef]
- Jones, P.A.; Ohtani, H.; Chakravarthy, A.; De Carvalho, D.D. Epigenetic therapy in immune-oncology. Nat. Rev. Cancer 2019, 19, 151–161. [Google Scholar] [CrossRef] [PubMed]
- Roulois, D.; Loo Yau, H.; Singhania, R.; Wang, Y.; Danesh, A.; Shen, S.Y.; Han, H.; Liang, G.; Jones, P.A.; Pugh, T.J.; et al. DNA-Demethylating Agents Target Colorectal Cancer Cells by Inducing Viral Mimicry by Endogenous Transcripts. Cell 2015, 162, 961–973. [Google Scholar] [CrossRef] [PubMed]
- Loo Yau, H.; Ettayebi, I.; De Carvalho, D.D. The Cancer Epigenome: Exploiting Its Vulnerabilities for Immunotherapy. Trends Cell Biol. 2019, 29, 31–43. [Google Scholar] [CrossRef] [PubMed]
- Dalerba, P.; Clarke, M.F. Cancer stem cells and tumor metastasis: First steps into uncharted territory. Cell Stem Cell 2007, 1, 241–242. [Google Scholar] [CrossRef] [PubMed]
- Abetov, D.; Mustapova, Z.; Saliev, T.; Bulanin, D. Biomarkers and signaling pathways of colorectal cancer stem cells. Tumour Biol. 2015, 36, 1339–1353. [Google Scholar] [CrossRef]
- Zhao, H.; Ming, T.; Tang, S.; Ren, S.; Yang, H.; Liu, M.; Tao, Q.; Xu, H. Wnt signaling in colorectal cancer: Pathogenic role and therapeutic target. Mol. Cancer 2022, 21, 144. [Google Scholar] [CrossRef]
- Giannakis, M.; Hodis, E.; Jasmine Mu, X.; Yamauchi, M.; Rosenbluh, J.; Cibulskis, K.; Saksena, G.; Lawrence, M.S.; Qian, Z.R.; Nishihara, R.; et al. RNF43 is frequently mutated in colorectal and endometrial cancers. Nat. Genet. 2014, 46, 1264–1266. [Google Scholar] [CrossRef]
- Ho, S.Y.; Keller, T.H. The use of porcupine inhibitors to target Wnt-driven cancers. Bioorg. Med. Chem. Lett. 2015, 25, 5472–5476. [Google Scholar] [CrossRef]
- Poulsen, A.; Ho, S.Y.; Wang, W.; Alam, J.; Jeyaraj, D.A.; Ang, S.H.; Tan, E.S.; Lin, G.R.; Cheong, V.W.; Ke, Z.; et al. Pharmacophore Model for Wnt/Porcupine Inhibitors and Its Use in Drug Design. J. Chem. Inf. Model. 2015, 55, 1435–1448. [Google Scholar] [CrossRef]
- Shah, K.; Panchal, S.; Patel, B. Porcupine inhibitors: Novel and emerging anti-cancer therapeutics targeting the Wnt signaling pathway. Pharmacol. Res. 2021, 167, 105532. [Google Scholar] [CrossRef]
- Flanagan, D.J.; Woodcock, S.A.; Phillips, C.; Eagle, C.; Sansom, O.J. Targeting ligand-dependent wnt pathway dysregulation in gastrointestinal cancers through porcupine inhibition. Pharmacol. Ther. 2022, 238, 108179. [Google Scholar] [CrossRef]
- Rodon, J.; Argilés, G.; Connolly, R.M.; Vaishampayan, U.; de Jonge, M.; Garralda, E.; Giannakis, M.; Smith, D.C.; Dobson, J.R.; McLaughlin, M.E.; et al. Phase 1 study of single-agent WNT974, a first-in-class Porcupine inhibitor, in patients with advanced solid tumours. Br. J. Cancer 2021, 125, 28–37. [Google Scholar] [CrossRef]
- Janku, F.; de Vos, F.; de Miguel, M.; Forde, P.; Ribas, A.; Nagasaka, M.; Argiles, G.; Arance, A.M.; Calvo, A.; Giannakis, M.; et al. Abstract CT034: Phase I study of WNT974 + spartalizumab in patients (pts) with advanced solid tumors. Cancer Res. 2020, 80, CT034. [Google Scholar] [CrossRef]
- Jia, X.Q.; Zhang, S.; Zhu, H.J.; Wang, W.; Zhu, J.H.; Wang, X.D.; Qiang, J.F. Increased Expression of PHGDH and Prognostic Significance in Colorectal Cancer. Transl. Oncol. 2016, 9, 191–196. [Google Scholar] [CrossRef]
- Qian, C.; Xia, Y.; Ren, Y.; Yin, Y.; Deng, A. Identification and validation of PSAT1 as a potential prognostic factor for predicting clinical outcomes in patients with colorectal carcinoma. Oncol. Lett. 2017, 14, 8014–8020. [Google Scholar] [CrossRef]
- Zhang, J.; Zhu, Z.; Miao, Z.; Huang, X.; Sun, Z.; Xu, H.; Wang, Z. The Clinical Significance and Mechanisms of REG4 in Human Cancers. Front. Oncol. 2020, 10, 559230. [Google Scholar] [CrossRef]
- Zheng, H.C.; Xue, H.; Zhang, C.Y. REG4 promotes the proliferation and anti-apoptosis of cancer. Front. Cell Dev. Biol. 2022, 10, 1012193. [Google Scholar] [CrossRef] [PubMed]
- Chou, C.L.; Chen, T.J.; Tian, Y.F.; Chan, T.C.; Yeh, C.F.; Li, W.S.; Tsai, H.H.; Li, C.F.; Lai, H.Y. CTSE Overexpression Is an Adverse Prognostic Factor for Survival among Rectal Cancer Patients Receiving CCRT. Life 2021, 11, 646. [Google Scholar] [CrossRef]
- Kuester, D.; Lippert, H.; Roessner, A.; Krueger, S. The cathepsin family and their role in colorectal cancer. Pathol. Res. Pract. 2008, 204, 491–500. [Google Scholar] [CrossRef]
- Sninsky, J.A.; Bishnupuri, K.S.; González, I.; Trikalinos, N.A.; Chen, L.; Dieckgraefe, B.K. Reg4 and its downstream transcriptional activator CD44ICD in stage II and III colorectal cancer. Oncotarget 2021, 12, 278–291. [Google Scholar] [CrossRef]
- Papaccio, F.; García-Mico, B.; Gimeno-Valiente, F.; Cabeza-Segura, M.; Gambardella, V.; Gutiérrez-Bravo, M.F.; Alfaro-Cervelló, C.; Martinez-Ciarpaglini, C.; Rentero-Garrido, P.; Zúñiga-Trejos, S.; et al. Proteotranscriptomic analysis of advanced colorectal cancer patient derived organoids for drug sensitivity prediction. J. Exp. Clin. Cancer Res. 2023, 42, 8. [Google Scholar] [CrossRef] [PubMed]
- Le, C.C.; Bennasroune, A.; Langlois, B.; Salesse, S.; Boulagnon-Rombi, C.; Morjani, H.; Dedieu, S.; Appert-Collin, A. Functional Interplay between Collagen Network and Cell Behavior within Tumor Microenvironment in Colorectal Cancer. Front. Oncol. 2020, 10, 527. [Google Scholar] [CrossRef] [PubMed]
- Zhang, Z.; Wang, Y.; Zhang, J.; Zhong, J.; Yang, R. COL1A1 promotes metastasis in colorectal cancer by regulating the WNT/PCP pathway. Mol. Med. Rep. 2018, 17, 5037–5042. [Google Scholar] [CrossRef] [PubMed]
- Zou, X.; Feng, B.; Dong, T.; Yan, G.; Tan, B.; Shen, H.; Huang, A.; Zhang, X.; Zhang, M.; Yang, P.; et al. Up-regulation of type I collagen during tumorigenesis of colorectal cancer revealed by quantitative proteomic analysis. J. Proteom. 2013, 94, 473–485. [Google Scholar] [CrossRef] [PubMed]
- Xu, S.; Xu, H.; Wang, W.; Li, S.; Li, H.; Li, T.; Zhang, W.; Yu, X.; Liu, L. The role of collagen in cancer: From bench to bedside. J. Transl. Med. 2019, 17, 309. [Google Scholar] [CrossRef]
- Boland, P.M.; Ma, W.W. Immunotherapy for Colorectal Cancer. Cancers 2017, 9, 50. [Google Scholar] [CrossRef]
- Fridman, W.H.; Pagès, F.; Sautès-Fridman, C.; Galon, J. The immune contexture in human tumours: Impact on clinical outcome. Nat. Rev. Cancer 2012, 12, 298–306. [Google Scholar] [CrossRef]
- Becht, E.; de Reyniès, A.; Giraldo, N.A.; Pilati, C.; Buttard, B.; Lacroix, L.; Selves, J.; Sautès-Fridman, C.; Laurent-Puig, P.; Fridman, W.H. Immune and Stromal Classification of Colorectal Cancer Is Associated with Molecular Subtypes and Relevant for Precision Immunotherapy. Clin. Cancer Res. 2016, 22, 4057–4066. [Google Scholar] [CrossRef]


| Layer | Genes | Number of Groups | Main Gene Ontology |
|---|---|---|---|
| 1st | 98 | 2 | Cellular adhesion |
| 2nd | 53 | 3 | Metabolic pathways |
| 3rd | 131 | 2 | Immune response |
| 4th | 32 | 2 | Digestion |
| 5th | 148 | 2 | Cellular adhesion |
| 6th | 92 | 2 | Metabolic pathways |
| 7th | 78 | 2 | Extracellular response |
| 8th | 89 | 2 | Inflammatory response |
| 9th | 88 | 2 | Ion calcium and cellular transport |
Disclaimer/Publisher’s Note: The statements, opinions and data contained in all publications are solely those of the individual author(s) and contributor(s) and not of MDPI and/or the editor(s). MDPI and/or the editor(s) disclaim responsibility for any injury to people or property resulting from any ideas, methods, instructions or products referred to in the content. |
© 2023 by the authors. Licensee MDPI, Basel, Switzerland. This article is an open access article distributed under the terms and conditions of the Creative Commons Attribution (CC BY) license (https://creativecommons.org/licenses/by/4.0/).
Share and Cite
López-Camacho, E.; Prado-Vázquez, G.; Martínez-Pérez, D.; Ferrer-Gómez, M.; Llorente-Armijo, S.; López-Vacas, R.; Díaz-Almirón, M.; Gámez-Pozo, A.; Vara, J.Á.F.; Feliu, J.; et al. A Novel Molecular Analysis Approach in Colorectal Cancer Suggests New Treatment Opportunities. Cancers 2023, 15, 1104. https://doi.org/10.3390/cancers15041104
López-Camacho E, Prado-Vázquez G, Martínez-Pérez D, Ferrer-Gómez M, Llorente-Armijo S, López-Vacas R, Díaz-Almirón M, Gámez-Pozo A, Vara JÁF, Feliu J, et al. A Novel Molecular Analysis Approach in Colorectal Cancer Suggests New Treatment Opportunities. Cancers. 2023; 15(4):1104. https://doi.org/10.3390/cancers15041104
Chicago/Turabian StyleLópez-Camacho, Elena, Guillermo Prado-Vázquez, Daniel Martínez-Pérez, María Ferrer-Gómez, Sara Llorente-Armijo, Rocío López-Vacas, Mariana Díaz-Almirón, Angelo Gámez-Pozo, Juan Ángel Fresno Vara, Jaime Feliu, and et al. 2023. "A Novel Molecular Analysis Approach in Colorectal Cancer Suggests New Treatment Opportunities" Cancers 15, no. 4: 1104. https://doi.org/10.3390/cancers15041104
APA StyleLópez-Camacho, E., Prado-Vázquez, G., Martínez-Pérez, D., Ferrer-Gómez, M., Llorente-Armijo, S., López-Vacas, R., Díaz-Almirón, M., Gámez-Pozo, A., Vara, J. Á. F., Feliu, J., & Trilla-Fuertes, L. (2023). A Novel Molecular Analysis Approach in Colorectal Cancer Suggests New Treatment Opportunities. Cancers, 15(4), 1104. https://doi.org/10.3390/cancers15041104