Is the Social Gradient in Net Survival Observed in France the Result of Inequalities in Cancer-Specific Mortality or Inequalities in General Mortality?
Abstract
Simple Summary
Abstract
1. Introduction
2. Materials and Methods
2.1. Cancer Registries Data
2.2. Simulation of Deprivation-Specific French LT
2.3. Statistical Analyses
- (i)
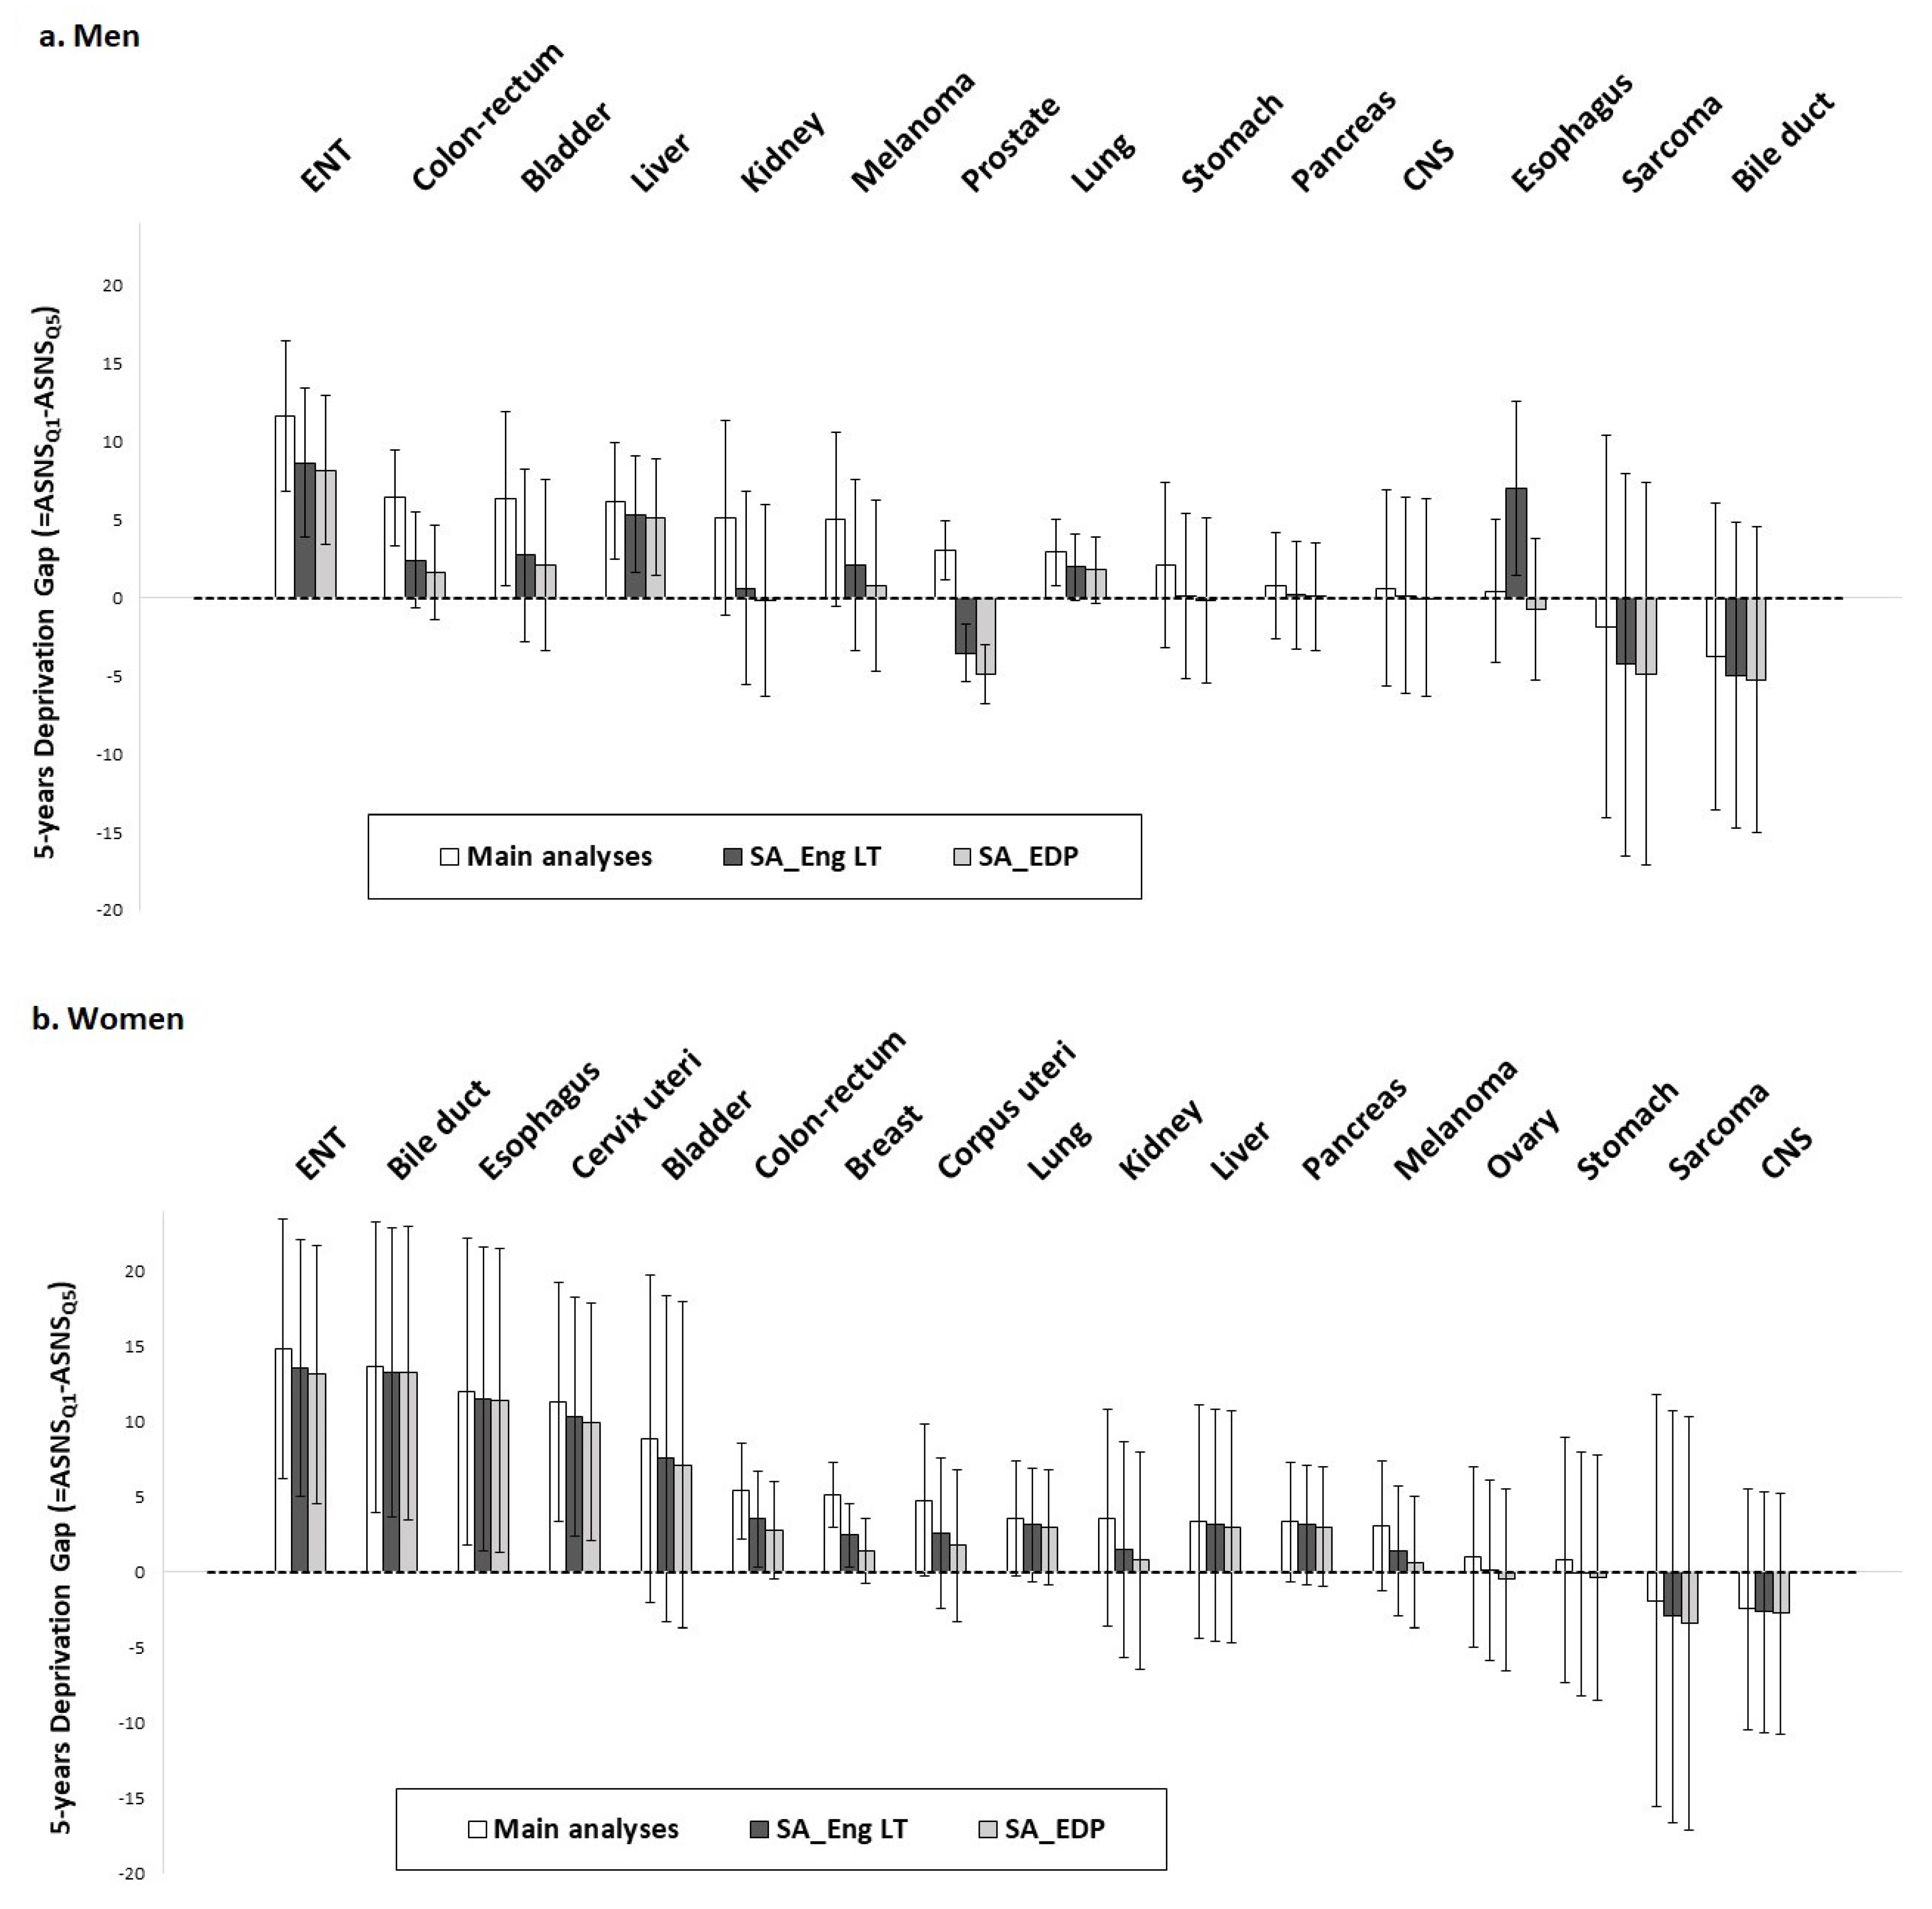
- The 5-year age-standardized net survival probabilities were estimated using the Pohar–Perme method [14]. For each cancer site and sex, we calculated the 5-year deprivation gaps (and their 95% confidence intervals [CI]), which are the difference in 5-year age-standardized net survival probabilities between patients from the least- and most-deprived environments defined by the 1st and 5th national quintile of EDI, respectively (see Tron et al., 2019 [11] method section for further calculation details).
- (ii)
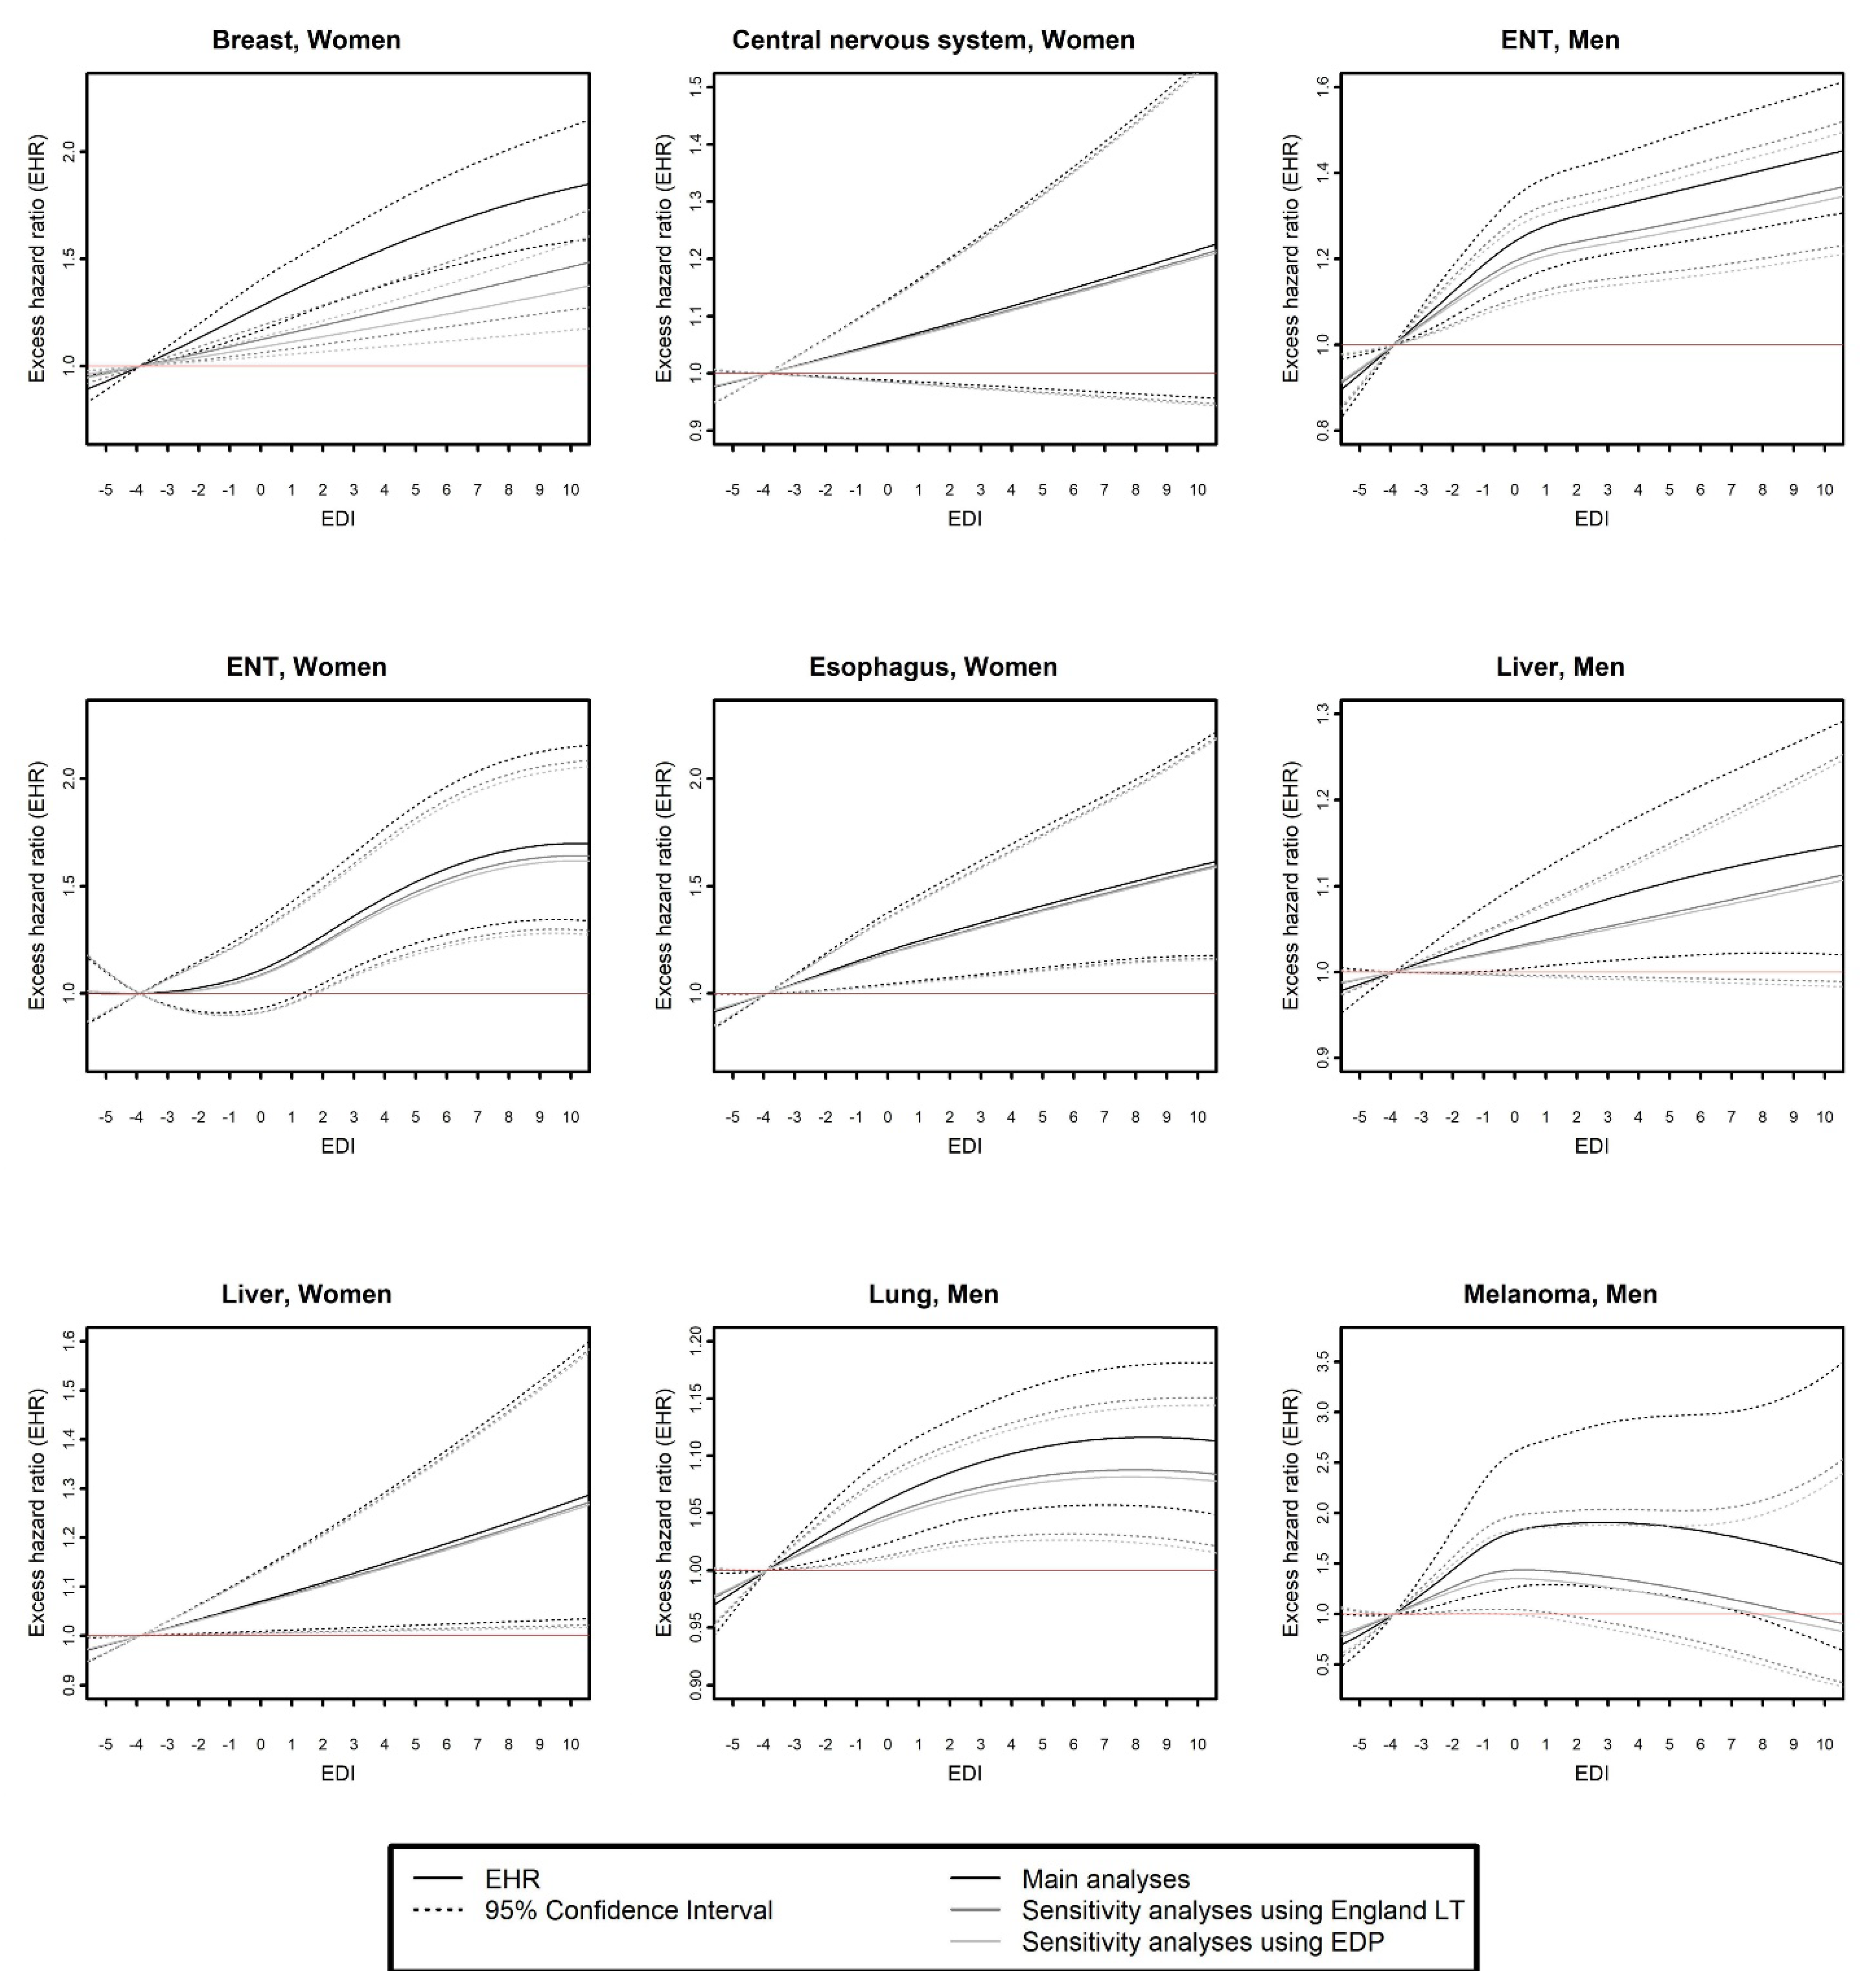
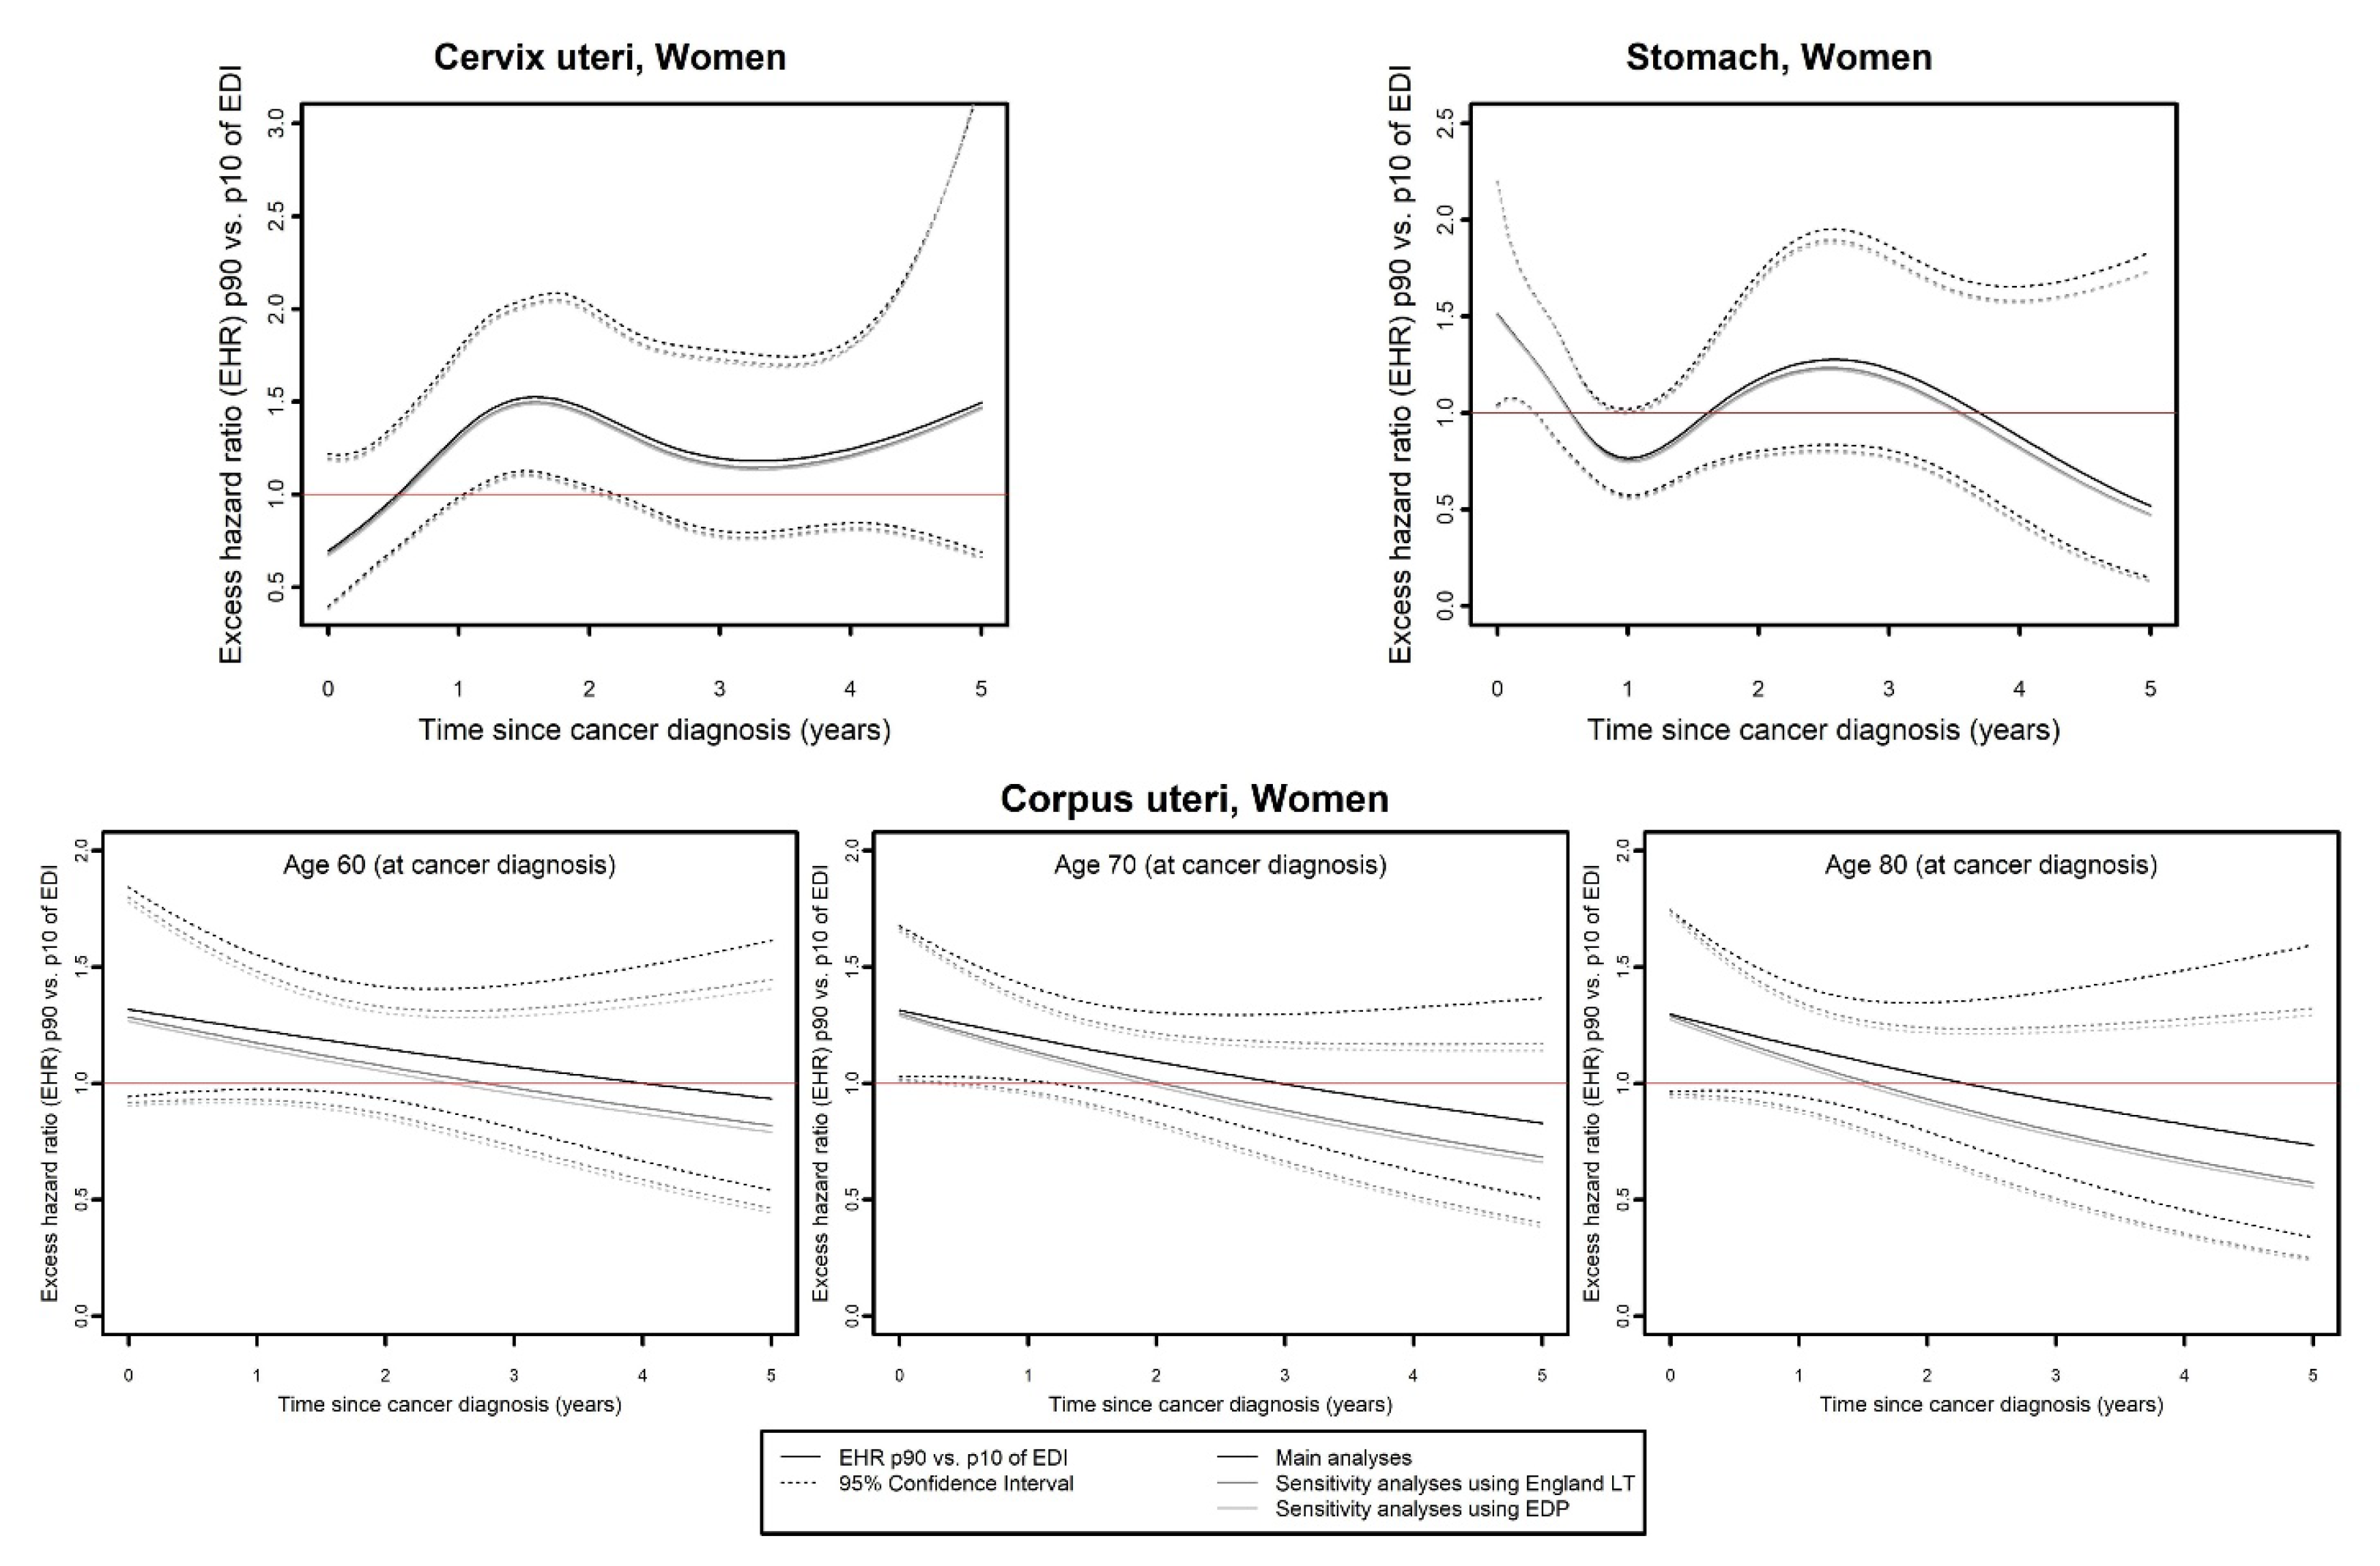
- In flexible modelling, at given values of time (t), age at diagnosis, and EDI, the observed mortality hazard λ of a given patient is decomposed as follows: λ(t,age,EDI,z) = λE(t,age,EDI) + λP(age + t,year + t,z), where λE is its excess mortality hazard (EMH), which is the mortality directly or indirectly due to cancer, and λP is its expected mortality, i.e., the all-cause mortality hazard of the general French population at age at diagnosis + t, and year of diagnosis + t, given demographic characteristics z of that individual. Here z is composed of the variables sex, year of death, residence French Département, and deprivation in the simulated LT. The EMH was modeled using (multidimensional) penalized splines, which allows for the modelling of flexible baseline hazard, the non-linear and non-proportional (i.e., time-dependent) effects of covariates, as well as interactions [29,30]. More precisely, four models based on penalized splines were adjusted, and the best one was selected according to the corrected Akaike Information Criterion (AIC) [33] indicating the overall effect of EDI on cancer net survival and its form, either 1—no effect; 2—proportional (i.e., not time-dependent) effect; 3—time-dependent effect; or 4—time- and/or age-dependent effect (i.e., interaction EDI*t and/or EDI*age). Then, excess mortality hazard ratios (EHR) by EDI were calculated based on the selected model. See the methods section of Poiseuil et al., 2022 [31] and Tron et al., 2021 [32] for further details about the modelling strategy.
- -
- value of the 5-year deprivation gaps (and 95% CI)
- -
- the selected flexible model (indicating the effect of EDI on survival and its form)
- -
- the curves of EHR as a function of EDI (using the 10th percentile of EDI as a reference, i.e., EDI score = −3.9)
- -
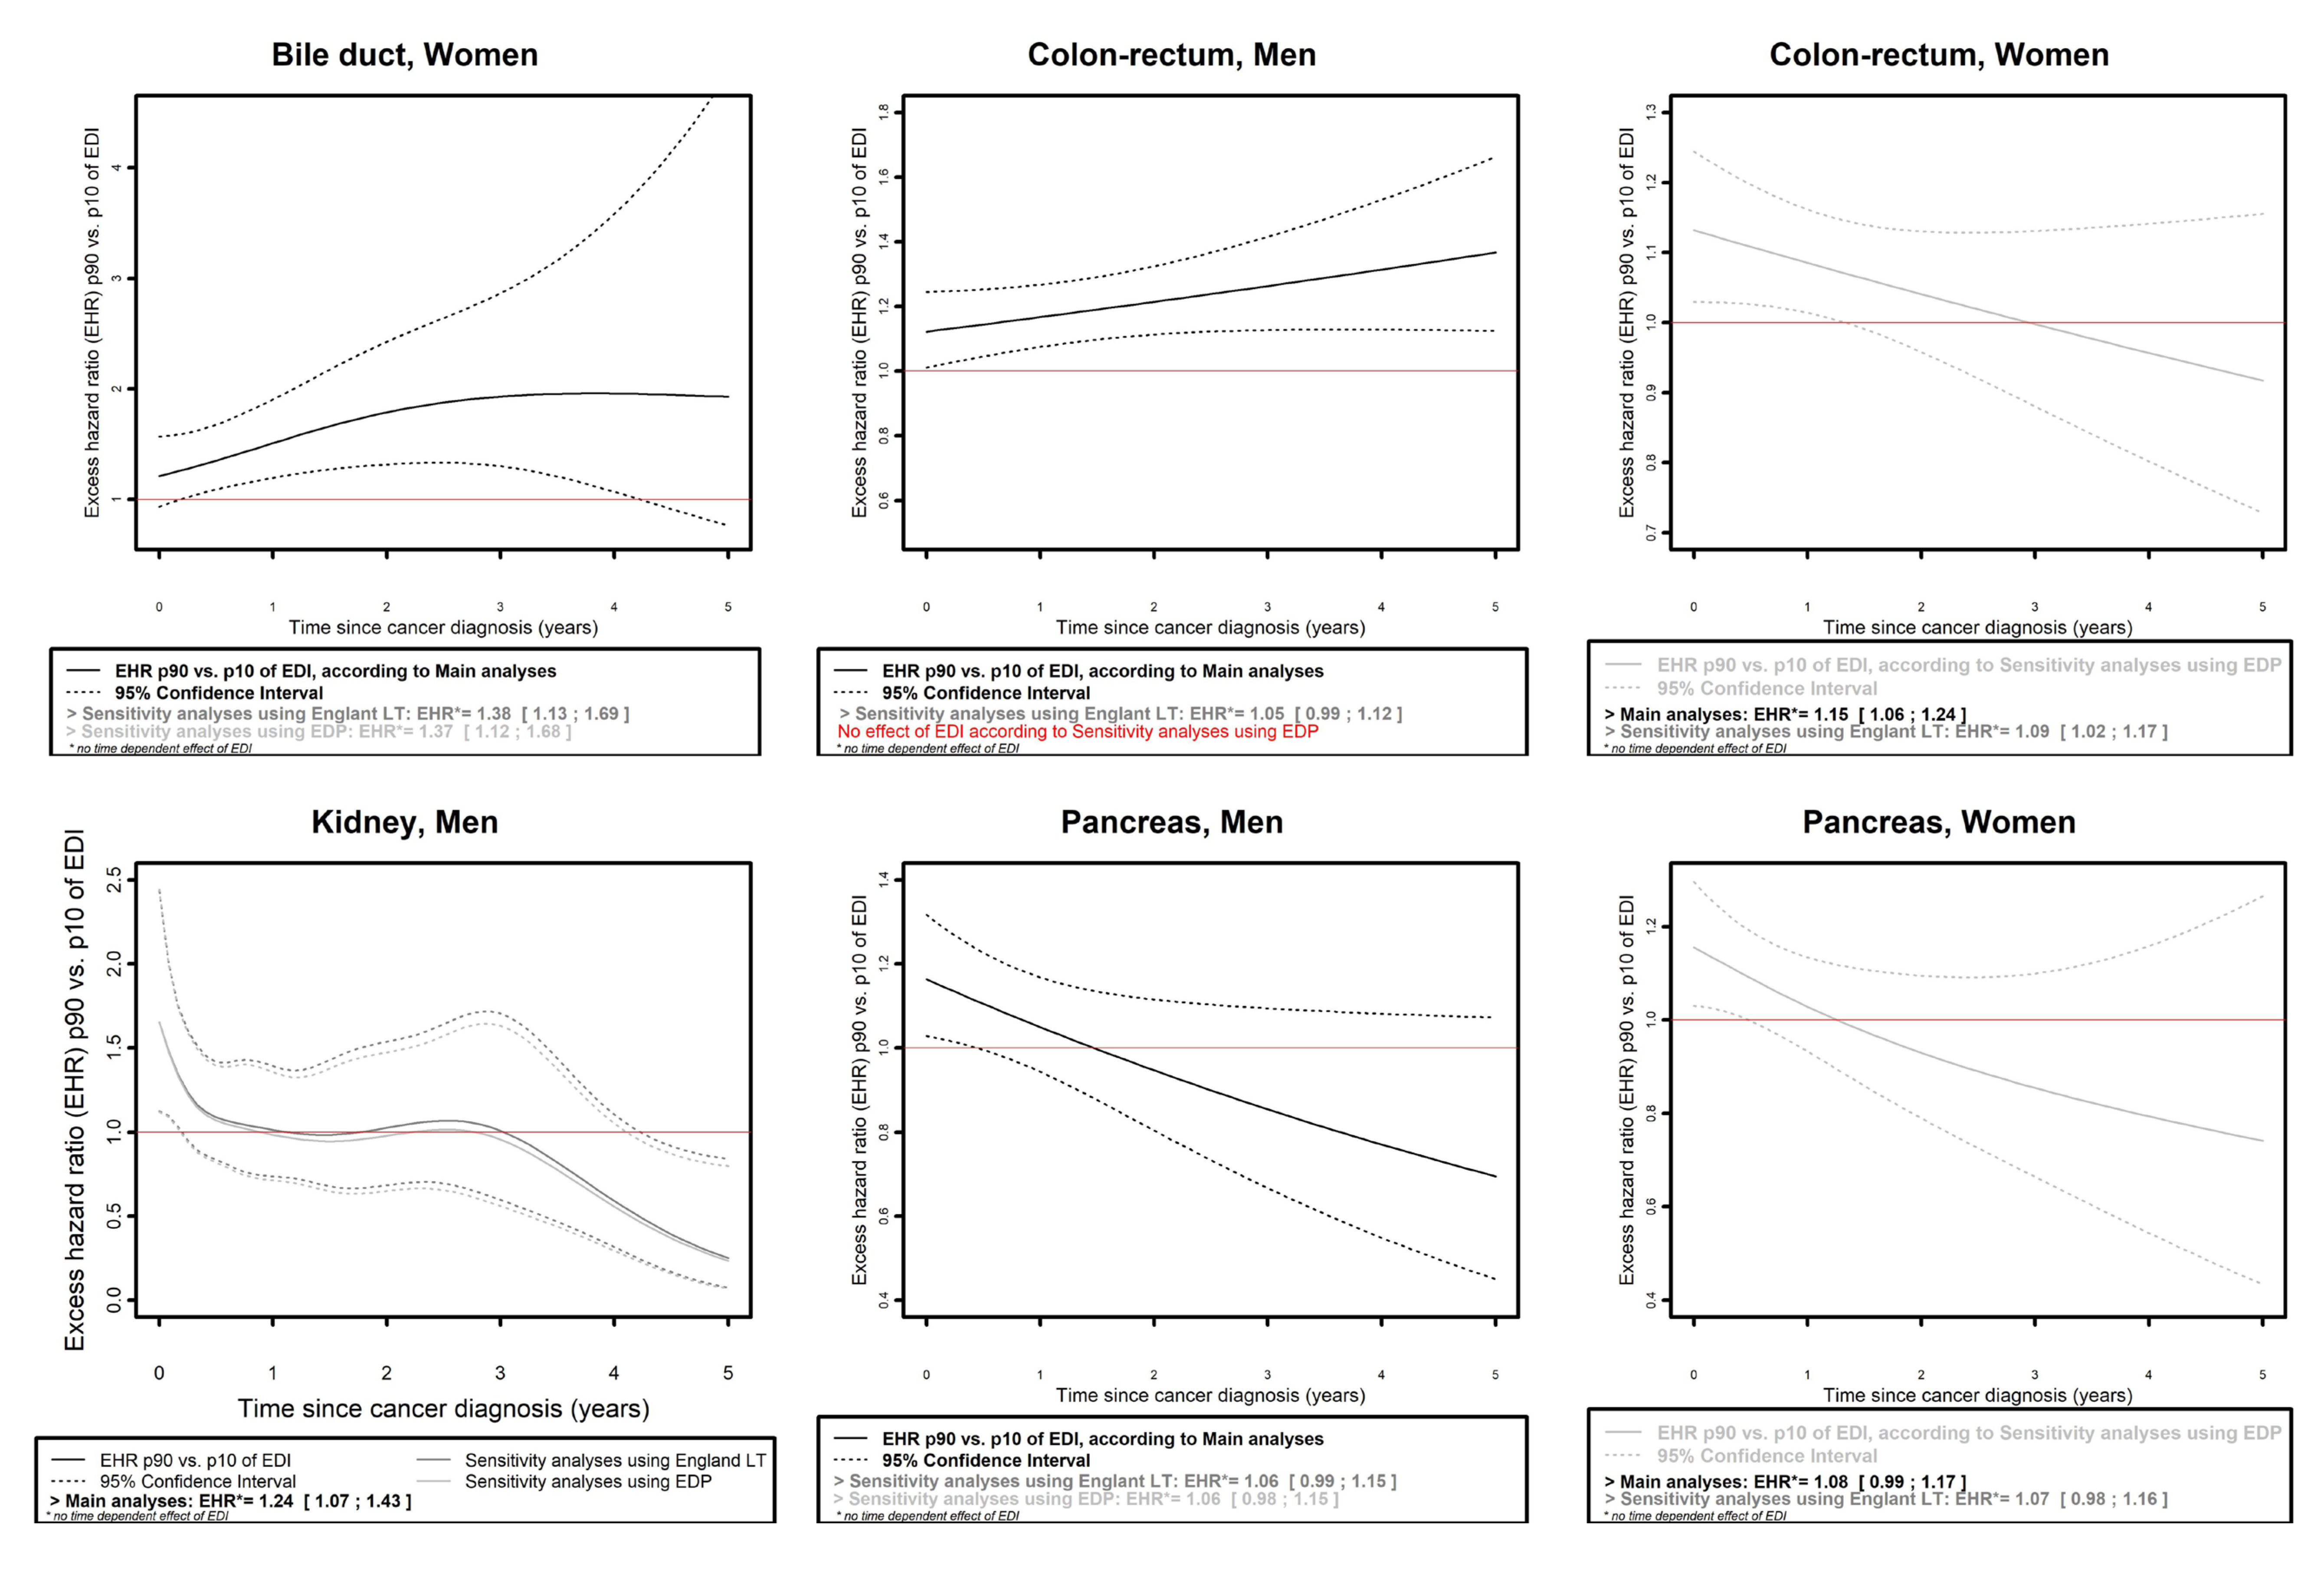
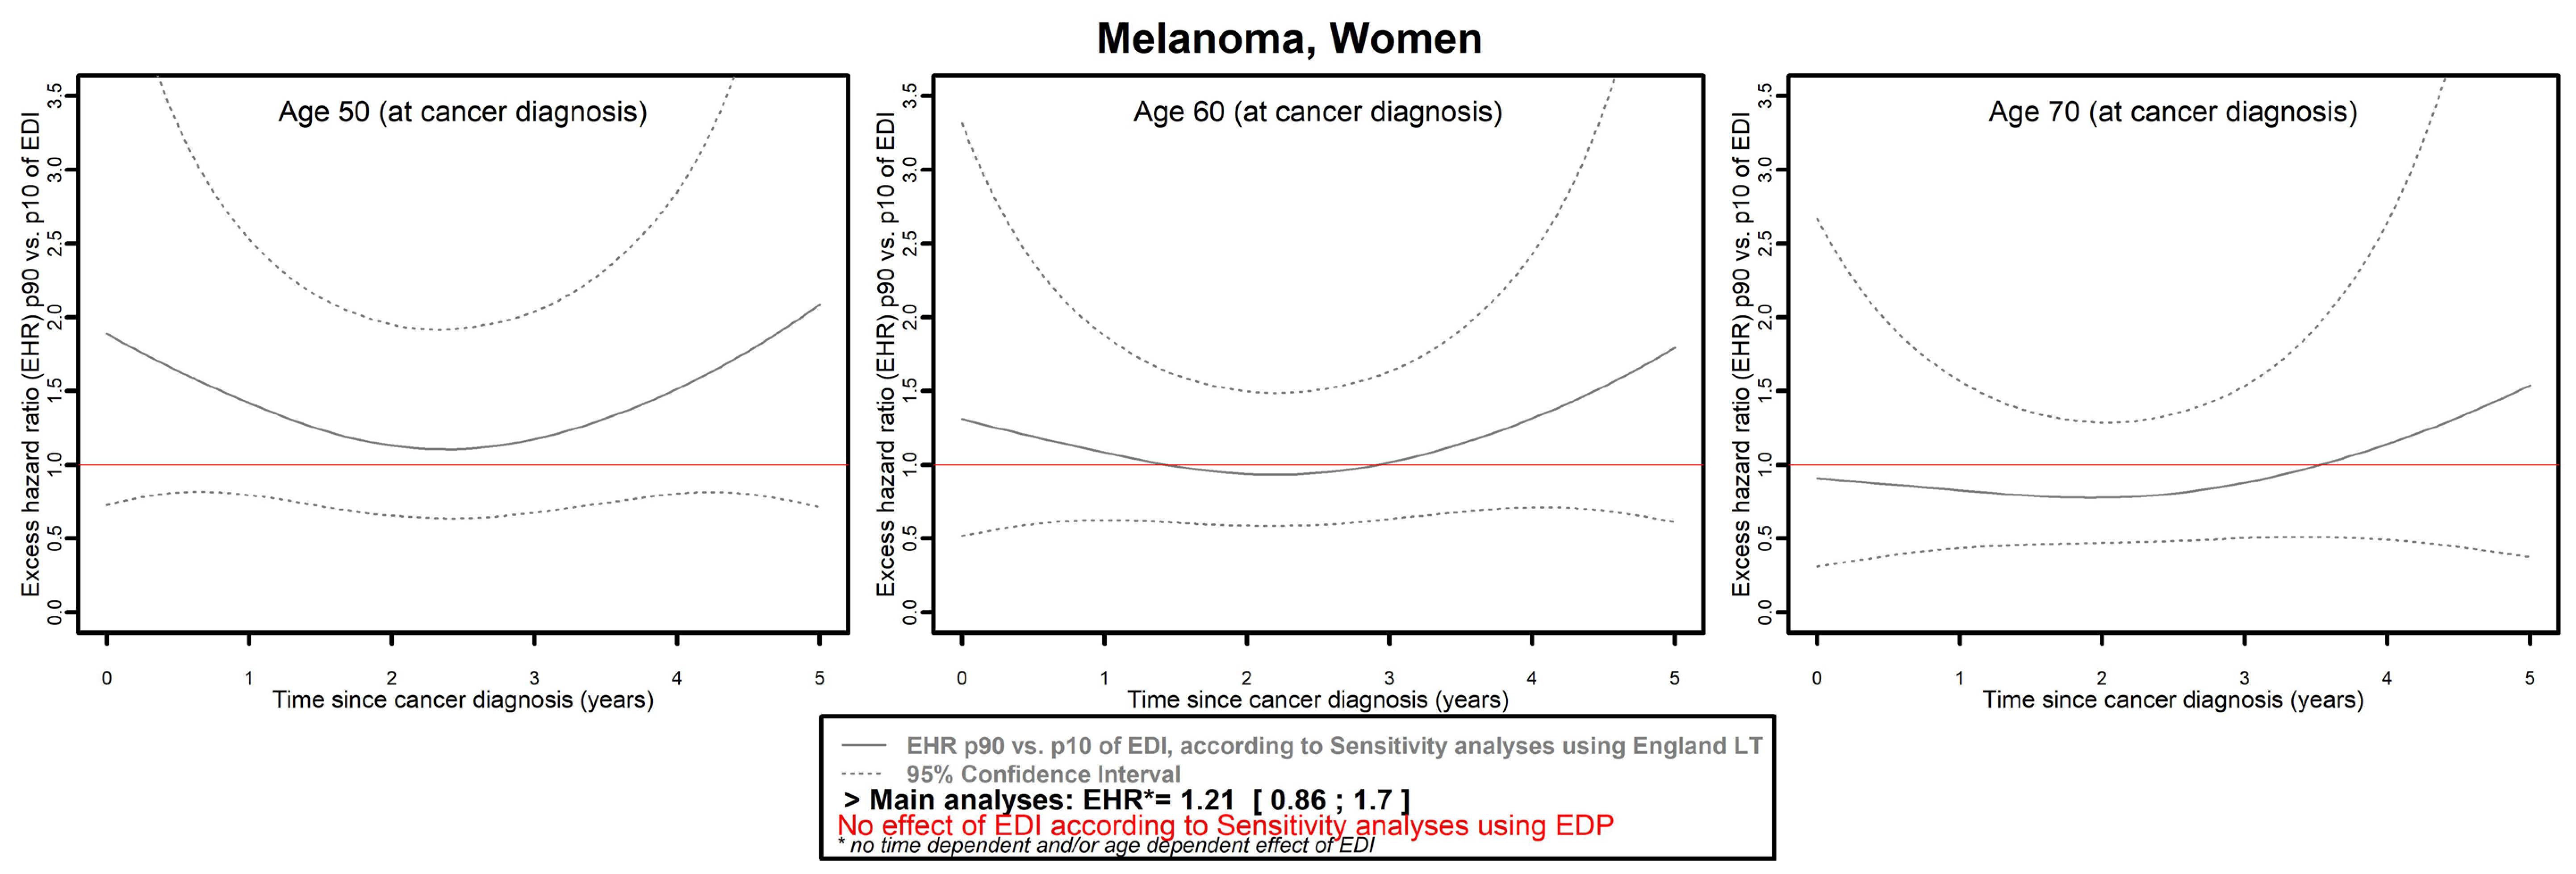
- and the curves of the EHR of the 90th percentile (p90 = 4.4) as compared to the 10th percentile (p10 = −3.9) of EDI as a function of time since cancer diagnosis.
2.4. Data Availability Statement
3. Results
3.1. Comparison of Main and Sensitivity Analyses Based on Non-Parametric Method
3.2. Comparison of Main and Sensitivity Analyses Based on Flexible Modeling
- (a)
- Same model selected in the three analyses.
- (b)
- Different models selected in the three analyses.
- (i)
- For cancer of the bile ducts in women (Figure 4), an effect of EDI on EMH was found in all three analyses, which was time-dependent in main analyses (with EHRp90/p10 reaching a maximum of 1.96, 95% CI: 1.12;3.43 at 3.8 years of follow-up) and proportional in sensitivity analyses (EHRp90/p10 (SA_Eng LT): 1.38, 95% CI: 1.13;1.69; EHRp90/p10 (SA_EDP): 1.37, 95% CI:1.12;1.68).
- (ii)
- Mitigated results were observed for three cancers in men (colon–rectum, kidney, and pancreas) and four in women (colon–rectum, pancreas, melanoma, and ovarian).
- (iii)
- Regarding bladder (both in men and women) and esophagus cancers in men, an overall proportional effect of EDI on EMH was found in the main analyses according to model selection (with EHRp90/p10 (bladder, men): 1.24, 95% CI: 1.09;1.4; EHRp90/p10 (bladder, women): 1.14, 95% CI: 0.97;1.35; EHRp90/p10 (esophagus, men): 1.13, 95% CI: 1.01;1.26), but no effect was found in any sensitivity analysis for these cancer sites.
- (iv)
- Finally, regarding prostate cancer (Figure 5), a time- and/or age-dependent effect of EDI on EMH was found in the main analysis, with an EHR of p90 versus p10 of EDI around 2 for 60- and 70-year-olds, and around 1.5 for 90-year-olds, and no effect at the end of follow-up. In both sensitivity analyses, a time-dependent effect of EDI on EMH was found, with an inverse social gradient reaching a maximum at 5 years of follow-up (EHRp90/p10 (SA_Eng LT): 0.37, 95% CI: 0.19;0.72; EHRp90/p10 (SA_EDP): 0.27, 95% CI: 0.13;0.55).
4. Discussion
Supplementary Materials
Author Contributions
Funding
Institutional Review Board Statement
Informed Consent Statement
Data Availability Statement
Acknowledgments
Conflicts of Interest
References
- Dalton, S.O.; Olsen, M.H.; Johansen, C.; Olsen, J.H.; Andersen, K.K. Socioeconomic inequality in cancer survival—Changes over time. A population-based study, Denmark, 1987–2013. Acta Oncol. 2019, 58, 737–744. [Google Scholar] [CrossRef] [PubMed]
- Exarchakou, A.; Rachet, B.; Belot, A.; Maringe, C.; Coleman, M.P. Impact of national cancer policies on cancer survival trends and socioeconomic inequalities in England, 1996–2013: Population based study. BMJ 2018, 360, k764. [Google Scholar] [CrossRef] [PubMed]
- Arias-Ortiz, N.E.; de Vries, E. Health inequities and cancer survival in Manizales, Colombia: A population-based study. Colomb. Med. 2018, 49, 63–72. [Google Scholar] [CrossRef] [PubMed]
- Hagedoorn, P.; Vandenheede, H.; Vanthomme, K.; Gadeyne, S. Socioeconomic position, population density and site-specific cancer mortality: A multilevel analysis of Belgian adults, 2001–2011. Int. J. Cancer 2018, 142, 23–35. [Google Scholar] [CrossRef] [PubMed]
- Ito, Y.; Nakaya, T.; Nakayama, T.; Miyashiro, I.; Ioka, A.; Tsukuma, H.; Rachet, B. Socioeconomic inequalities in cancer survival: A population-based study of adult patients diagnosed in Osaka, Japan, during the period 1993–2004. Acta Oncol. 2014, 53, 1423–1433. [Google Scholar] [CrossRef]
- Jansen, L.; Eberle, A.; Emrich, K.; Gondos, A.; Holleczek, B.; Kajüter, H.; Maier, W.; Nennecke, A.; Pritzkuleit, R.; Brenner, H. Socioeconomic deprivation and cancer survival in Germany: An ecological analysis in 200 districts in Germany. Int. J. Cancer 2014, 134, 2951–2960. [Google Scholar] [CrossRef]
- Kwak, M.; Kim, C. Disparities by Age, Sex, Tumor Stage, Diagnosis Path, and Area-level Socioeconomic Status in Survival Time for Major Cancers: Results from the Busan Cancer Registry. J. Korean Med. Sci. 2017, 32, 1974–1983. [Google Scholar] [CrossRef]
- Fleisch Marcus, A.; Illescas, A.H.; Hohl, B.C.; Llanos, A.A. Relationships between social isolation, neighborhood poverty, and cancer mortality in a population-based study of US adults. PLoS ONE 2017, 12, e0173370. [Google Scholar] [CrossRef]
- Skyrud, K.D.; Bray, F.; Eriksen, M.T.; Nilssen, Y.; Møller, B. Regional variations in cancer survival: Impact of tumour stage, socioeconomic status, comorbidity and type of treatment in Norway. Int. J. Cancer 2016, 138, 2190–2200. [Google Scholar] [CrossRef]
- Tervonen, H.E.; Aranda, S.; Roder, D.; You, H.; Walton, R.; Morrell, S.; Baker, D.; Currow, D.C. Cancer survival disparities worsening by socio-economic disadvantage over the last 3 decades in new South Wales, Australia. BMC Public Health 2017, 17, 691. [Google Scholar] [CrossRef]
- Tron, L.; Belot, A.; Fauvernier, M.; Remontet, L.; Bossard, N.; Launay, L.; Bryere, J.; Monnereau, A.; Dejardin, O.; Launoy, G.; et al. Socioeconomic environment and disparities in cancer survival for 19 solid tumor sites: An analysis of the French Network of Cancer Registries (FRANCIM) data. Int. J. Cancer 2019, 144, 1262–1274. [Google Scholar] [CrossRef] [PubMed]
- Schaffar, R.; Rachet, B.; Belot, A.; Woods, L.M. Estimation of net survival for cancer patients: Relative survival setting more robust to some assumption violations than cause-specific setting, a sensitivity analysis on empirical data. Eur. J. Cancer 2017, 72, 78–83. [Google Scholar] [CrossRef] [PubMed]
- Estève, J.; Benhamou, E.; Croasdale, M.; Raymond, L. Relative survival and the estimation of net survival: Elements for further discussion. Stat. Med. 1990, 9, 529–538. [Google Scholar] [CrossRef]
- Perme, M.P.; Stare, J.; Esteve, J. On estimation in relative survival. Biometrics 2012, 68, 113–120. [Google Scholar] [CrossRef]
- Antunes, L.; Mendonça, D.; Bento, M.J.; Rachet, B. No inequalities in survival from colorectal cancer by education and socioeconomic deprivation—A population-based study in the North Region of Portugal, 2000–2002. BMC Cancer 2016, 16, 608. [Google Scholar] [CrossRef] [PubMed]
- Mackenbach, J.P.; Bopp, M.; Deboosere, P.; Kovacs, K.; Leinsalu, M.; Martikainen, P.; Menvielle, G.; Regidor, E.; Geldera, R. Determinants of the magnitude of socioeconomic inequalities in mortality: A study of 17 European countries. Health Place 2017, 47, 44–53. [Google Scholar] [CrossRef]
- Ingleby, F.C.; Woods, L.M.; Atherton, I.M.; Baker, M.; Elliss-Brookes, L.; Belot, A. Describing socio-economic variation in life expectancy according to an individual’s education, occupation and wage in England and Wales: An analysis of the ONS Longitudinal Study. SSM Popul. Health 2021, 14, 100815. [Google Scholar] [CrossRef]
- Grafféo, N.; Jooste, V.; Giorgi, R. The impact of additional life-table variables on excess mortality estimates. Stat. Med. 2012, 31, 4219–4230. [Google Scholar] [CrossRef]
- Rubio, F.J.; Rachet, B.; Giorgi, R.; Maringe, C.; Belot, A. On models for the estimation of the excess mortality hazard in case of insufficiently stratified life tables. Biostatistics 2019, 22, 51–67. [Google Scholar] [CrossRef]
- Goungounga, J.A.; Touraine, C.; Grafféo, N.; Giorgi, R. Correcting for misclassification and selection effects in estimating net survival in clinical trials. BMC Med. Res. Methodol. 2019, 19, 104. [Google Scholar] [CrossRef]
- Touraine, C.; Grafféo, N.; Giorgi, R.; Group CWS. More accurate cancer-related excess mortality through correcting background mortality for extra variables. Stat. Methods Med. Res. 2020, 29, 122–136. [Google Scholar] [CrossRef]
- Guillaume, E.; Pornet, C.; Dejardin, O.; Launay, L.; Lillini, R.; Vercelli, M.; Marí-Dell, M.; Fontelo, A.F.; Borrell, C.; Ribeiro, A.I.; et al. Development of a cross-cultural deprivation index in five European countries. J. Epidemiol. Community Health 2016, 70, 493–499. [Google Scholar] [CrossRef]
- Pornet, C.; Delpierre, C.; Dejardin, O.; Grosclaude, P.; Launay, L.; Guittet, L.; Lang, T.; Launoy, G. Construction of an adaptable European transnational ecological deprivation index: The French version. J. Epidemiol. Community Health 2012, 66, 982–989. [Google Scholar] [CrossRef]
- Blakely, T.; Soeberg, M.; Carter, K.; Costilla, R.; Atkinson, J.; Sarfati, D. Bias in relative survival methods when using incorrect life-tables: Lung and bladder cancer by smoking status and ethnicity in New Zealand. Int. J. Cancer 2012, 131, E974–E982. [Google Scholar] [CrossRef]
- Wang, Y.C.; Graubard, B.I.; Rosenberg, M.A.; Kuntz, K.M.; Zauber, A.G.; Kahle, L.; Schechter, C.B.; Feuer, E.J. Derivation of background mortality by smoking and obesity in cancer simulation models. Med. Decis. Making 2013, 33, 176–197. [Google Scholar] [CrossRef]
- Di Carlo, V.R.B.; Bannon, F.; Woods, L.M.; Maringe, C.; Bonaventure, A.; Coleman, M.P.; Allemani, C. Life Tables for the CONCORD Programme. Available online: http://csg.lshtm.ac.uk/life-tables (accessed on 19 January 2023).
- Jordan, H.; Roderick, P.; Martin, D. The Index of Multiple Deprivation 2000 and accessibility effects on health. J. Epidemiol. Community Health 2004, 58, 250–257. [Google Scholar] [CrossRef]
- Blanpain, N. “L’espérance de Vie par Niveau de Vie-Méthode et Principaux Résultats” Documents de Travail, n° F1801. INSEE, Paris. 2018. Available online: https://www.insee.fr/fr/statistiques/3322051 (accessed on 19 January 2023).
- Fauvernier, M.; Roche, L.; Uhry, Z.; Tron, L.; Bossard, N.; Remontet, L. Multi-dimensional penalized hazard model with continuous covariates: Applications for studying trends and social inequalities in cancer survival. J. R. Stat. Soc. Ser. C Appl. Stat. 2019, 68, 1233–1257. [Google Scholar] [CrossRef]
- Remontet, L.; Uhry, Z.; Bossard, N.; Iwaz, J.; Belot, A.; Danieli, C.; Charvat, H.; Roche, L.; The CENSUR Working Survival Group. Flexible and structured survival model for a simultaneous estimation of non-linear and non-proportional effects and complex interactions between continuous variables: Performance of this multidimensional penalized spline approach in net survival trend analysis. Stat. Methods Med. Res. 2019, 28, 2368–2384. [Google Scholar] [CrossRef]
- Poiseuil, M.; Tron, L.; Woronoff, A.S.; Trétarre, B.; Dabakuyo-Yonli, T.S.; Fauvernier, M.; Roche, L.; Dejardin, O.; Molinié, F.; Launoy, G.; et al. How do age and social environment affect the dynamics of death hazard and survival in patients with breast or gynecological cancer in France? Int. J. Cancer 2022, 150, 253–262. [Google Scholar] [CrossRef]
- Tron, L.; Fauvernier, M.; Bouvier, A.M.; Robaszkiewicz, M.; Bouvier, V.; Cariou, M.; Jooste, V.; Dejardin, O.; Remontet, L.; Alves, A.; et al. Socioeconomic Environment and Survival in Patients with Digestive Cancers: A French Population-Based Study. Cancers 2021, 13, 5156. [Google Scholar] [CrossRef]
- Wood, S. Generalized Additive Models: An Introduction with R, 2nd ed.; Chapman & Hall/CRC: London, UK, 2017. [Google Scholar]
- Fauvernier, M.; Remontet, L.; Uhry, Z.; Bossard, N.; Roche, L. SurvPen: An R package for hazard and excess hazard modelling with multidimensional penalized splines. J. Open Source Softw. 2019, 4, 1434. [Google Scholar] [CrossRef]
- Stroup, A.M.; Cho, H.; Scoppa, S.M.; Weir, H.K.; Mariotto, A.B. The impact of state-specific life tables on relative survival. J Natl Cancer Inst. Monogr. 2014, 49, 218–227. [Google Scholar] [CrossRef] [PubMed]
- Rachet, B.; Ellis, L.; Maringe, C.; Chu, T.; Nur, U.; Quaresma, M.; Shah, A.; Walters, S.; Woods, L.; Forman, D.; et al. Socioeconomic inequalities in cancer survival in England after the NHS cancer plan. Br. J. Cancer 2010, 103, 446–453. [Google Scholar] [CrossRef] [PubMed]
- Shafique, K.; Morrison, D.S. Socio-economic inequalities in survival of patients with prostate cancer: Role of age and Gleason grade at diagnosis. PLoS ONE 2013, 8, e56184. [Google Scholar] [CrossRef]
- Stanbury, J.F.; Baade, P.D.; Yu, Y.; Yu, X.Q. Cancer survival in New South Wales, Australia: Socioeconomic disparities remain despite overall improvements. BMC Cancer 2016, 16, 48. [Google Scholar] [CrossRef]
- Shack, L.G.; Rachet, B.; Brewster, D.H.; Coleman, M.P. Socioeconomic inequalities in cancer survival in Scotland 1986–2000. Br. J. Cancer 2007, 97, 999–1004. [Google Scholar] [CrossRef]
- Saurel-Cubizolles, M.J.; Chastang, J.F.; Menvielle, G.; Leclerc, A.; Luce, D. Social inequalities in mortality by cause among men and women in France. J. Epidemiol. Community Health 2009, 63, 197–202. [Google Scholar] [CrossRef]
- Layte, R.; Banks, J.; Walsh, C.; McKnight, G. Trends in socio-economic inequalities in mortality by sex in Ireland from the 1980s to the 2000s. Ir. J. Med. Sci. 2015, 184, 613–621. [Google Scholar] [CrossRef]
- Mustard, C.A.; Etches, J. Gender differences in socioeconomic inequality in mortality. J. Epidemiol. Community Health 2003, 57, 974–980. [Google Scholar] [CrossRef]
- Antunes, L.; Mendonça, D.; Ribeiro, A.I.; Maringe, C.; Rachet, B. Deprivation-specific life tables using multivariable flexible modelling—Trends from 2000–2002 to 2010–2012, Portugal. BMC Public Health 2019, 19, 276. [Google Scholar] [CrossRef]

| Men | Women | |||||
|---|---|---|---|---|---|---|
| Main Analyses | SA_Eng LT | SA_EDP | Main Analyses | SA_Eng LT | SA_EDP | |
| Bile duct | No effect | No effect | No effect | Time-dependent | Proportional | Proportional |
| Bladder | Proportional | No effect | No effect | Proportional | No effect | No effect |
| Breast | - | - | - | Proportional | Proportional | Proportional |
| Cervix uteri | - | - | - | Time-dependent | Time-dependent | Time-dependent |
| CNS | No effect | No effect | No effect | Proportional | Proportional | Proportional |
| Colon-rectum | S and time-dependent | Proportional | No effect | Proportional | Proportional | Time-dependent |
| Corpus uteri | - | - | - | Time- and/or age-dependent | Time- and/or age-dependent | Time- and/or age-dependent |
| ENT | Proportional | Proportional | Proportional | Proportional | Proportional | Proportional |
| Esophagus | Proportional | No effect | No effect | Proportional | Proportional | Proportional |
| Kidney | Proportional | Time-dependent | Time-dependent | No effect | No effect | No effect |
| Liver | Proportional | Proportional | Proportional | Proportional | Proportional | Proportional |
| Lung | Proportional | Proportional | Proportional | No effect | No effect | No effect |
| Melanoma | Proportional | Proportional | Proportional | Proportional | Time- and/or age-dependent | No effect |
| Ovary | - | - | - | Proportional | Proportional | No effect |
| Pancreas | Time-dependent | Proportional | Proportional | Proportional | Proportional | Time-dependent |
| Prostate | Time- and/or age-dependent | Time-dependent | Time-dependent | - | - | - |
| Sarcoma | No effect | No effect | No effect | No effect | No effect | No effect |
| Stomach | No effect | No effect | No effect | Time-dependent | Time-dependent | Time-dependent |
Disclaimer/Publisher’s Note: The statements, opinions and data contained in all publications are solely those of the individual author(s) and contributor(s) and not of MDPI and/or the editor(s). MDPI and/or the editor(s) disclaim responsibility for any injury to people or property resulting from any ideas, methods, instructions or products referred to in the content. |
© 2023 by the authors. Licensee MDPI, Basel, Switzerland. This article is an open access article distributed under the terms and conditions of the Creative Commons Attribution (CC BY) license (https://creativecommons.org/licenses/by/4.0/).
Share and Cite
Tron, L.; Remontet, L.; Fauvernier, M.; Rachet, B.; Belot, A.; Launay, L.; Merville, O.; Molinié, F.; Dejardin, O.; Francim Group; et al. Is the Social Gradient in Net Survival Observed in France the Result of Inequalities in Cancer-Specific Mortality or Inequalities in General Mortality? Cancers 2023, 15, 659. https://doi.org/10.3390/cancers15030659
Tron L, Remontet L, Fauvernier M, Rachet B, Belot A, Launay L, Merville O, Molinié F, Dejardin O, Francim Group, et al. Is the Social Gradient in Net Survival Observed in France the Result of Inequalities in Cancer-Specific Mortality or Inequalities in General Mortality? Cancers. 2023; 15(3):659. https://doi.org/10.3390/cancers15030659
Chicago/Turabian StyleTron, Laure, Laurent Remontet, Mathieu Fauvernier, Bernard Rachet, Aurélien Belot, Ludivine Launay, Ophélie Merville, Florence Molinié, Olivier Dejardin, Francim Group, and et al. 2023. "Is the Social Gradient in Net Survival Observed in France the Result of Inequalities in Cancer-Specific Mortality or Inequalities in General Mortality?" Cancers 15, no. 3: 659. https://doi.org/10.3390/cancers15030659
APA StyleTron, L., Remontet, L., Fauvernier, M., Rachet, B., Belot, A., Launay, L., Merville, O., Molinié, F., Dejardin, O., Francim Group, & Launoy, G. (2023). Is the Social Gradient in Net Survival Observed in France the Result of Inequalities in Cancer-Specific Mortality or Inequalities in General Mortality? Cancers, 15(3), 659. https://doi.org/10.3390/cancers15030659


