
Quantitative Evaluation of Apparent Diffusion Coefficient Values, ISUP Grades and Prostate-Specific Antigen Density Values of Potentially Malignant PI-RADS Lesions
Abstract
:Simple Summary
Abstract
1. Introduction
2. Materials and Methods
- At least one prostate lesion, assessed according to the current PI-RADS classification at the time of diagnosis, which was histopathologically confirmed in a subsequent MR-TRUS-fused biopsy.
- In total, 46 patients (50 prostate lesions) were excluded from the study after reviewing the data. Of these, 7 patients (8 prostate lesions) were excluded due to a non-standardized protocol. This was due to technical problems with the administration of contrast medium, the ADC evaluation or a lack of required sequences, partly because the examination was terminated at the patient’s request. A further 8 patients (9 prostate lesions) were excluded due to the lack of use of an endo-rectal coil and 31 patients (33 prostate lesions) were excluded due to retrospectively not-clearly traceable lesions.
3. Results
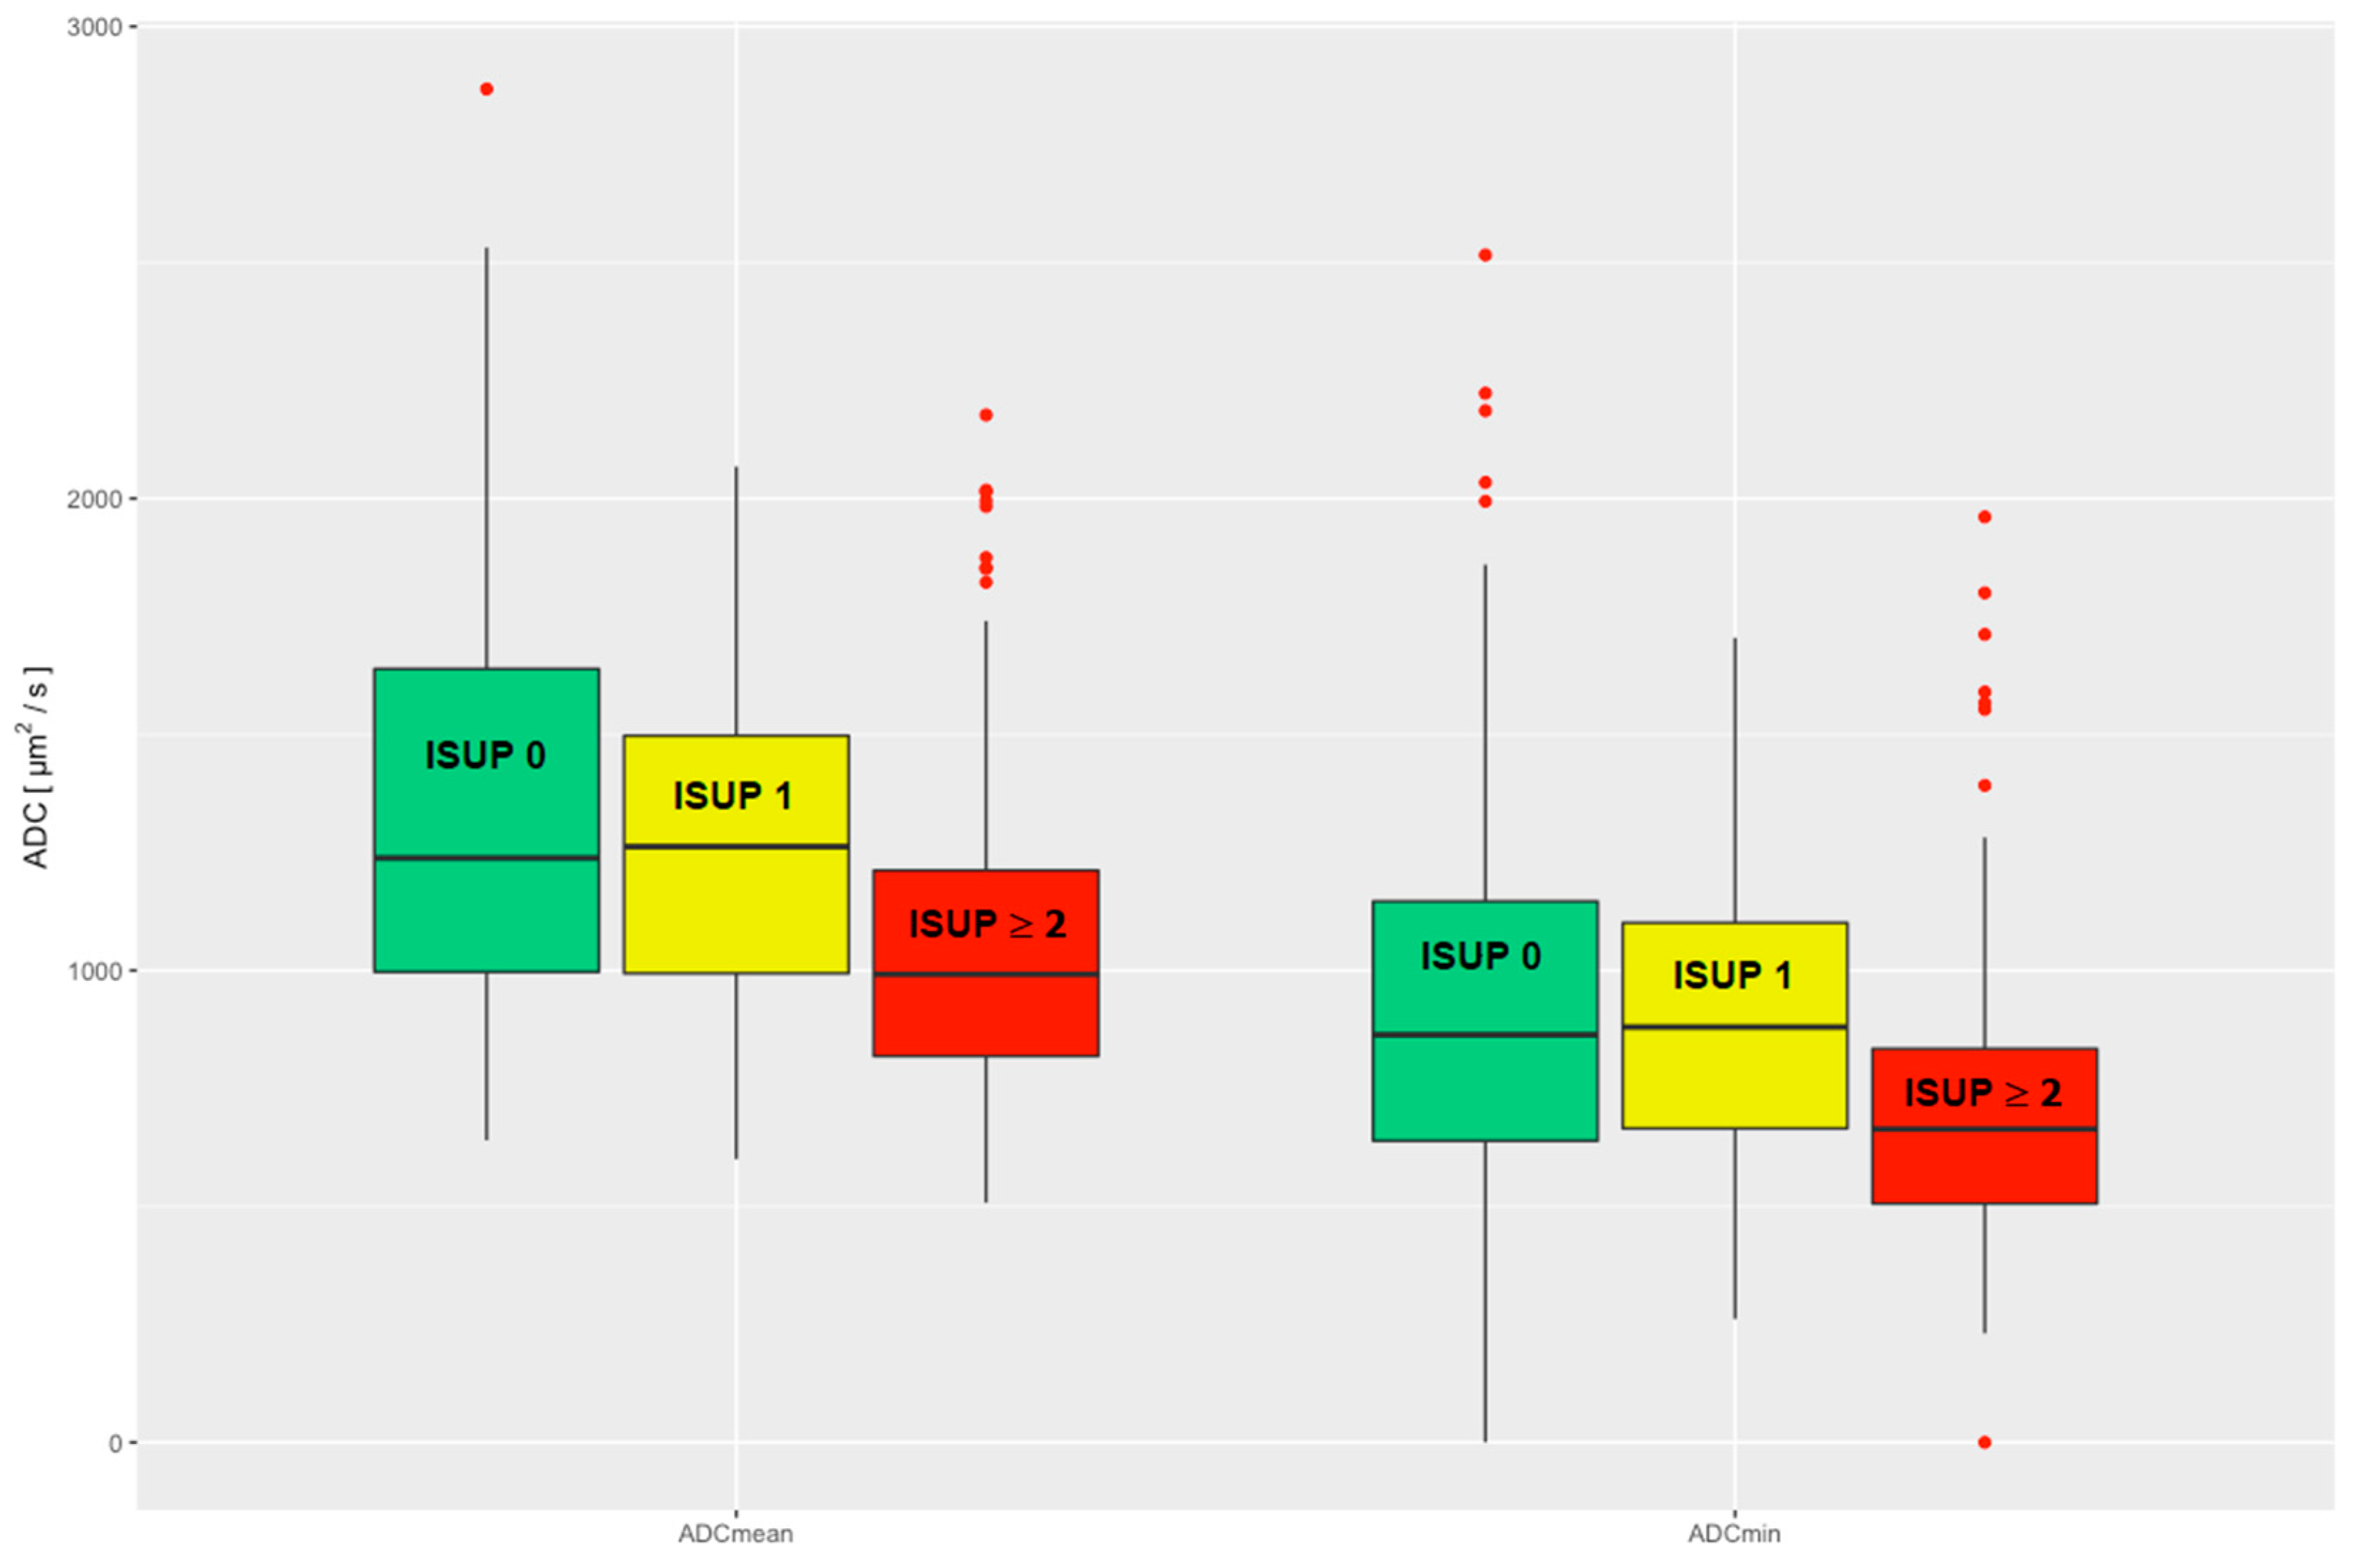
3.1. ADC Values
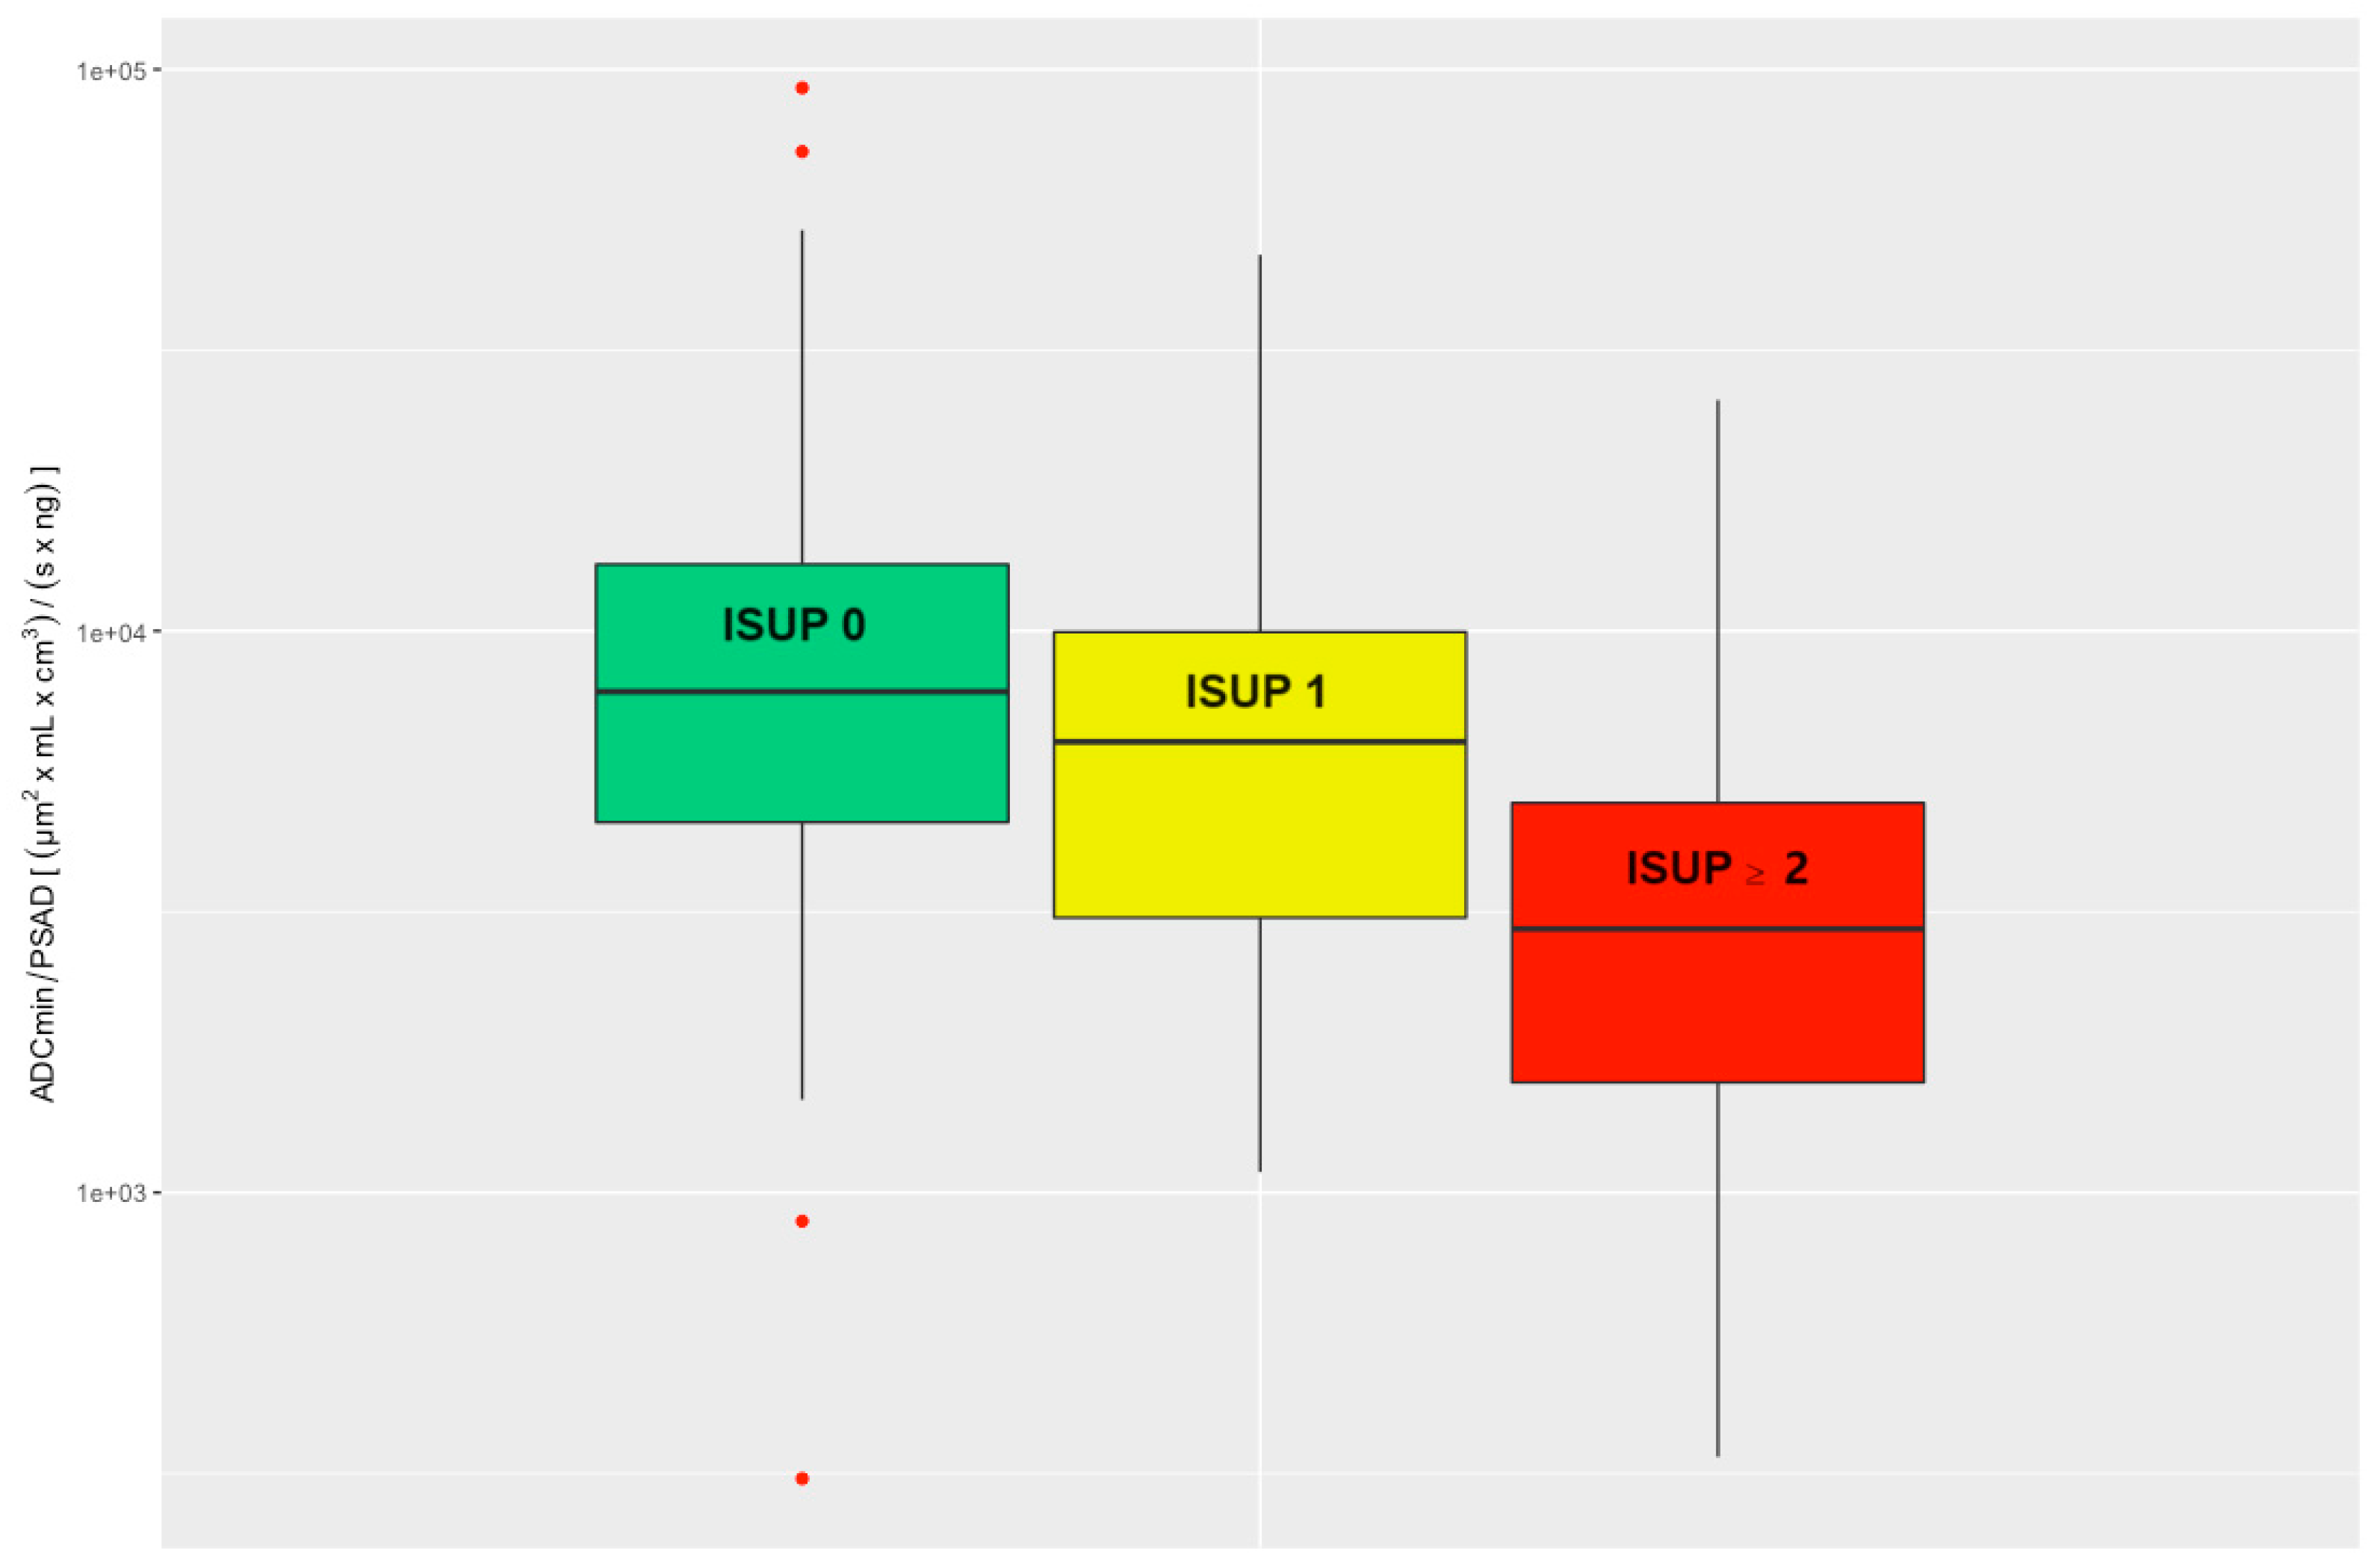
3.2. ADC/PSAD Ratio
4. Discussion
5. Conclusions
Author Contributions
Funding
Institutional Review Board Statement
Informed Consent Statement
Data Availability Statement
Conflicts of Interest
References
- Kasivisvanathan, V.; Rannikko, A.S.; Borghi, M.; Panebianco, V.; Mynderse, L.A.; Vaarala, M.H.; Briganti, A.; Budaus, L.; Hellawell, G.; Hindley, R.G.; et al. MRI-Targeted or Standard Biopsy for Prostate-Cancer Diagnosis. N. Engl. J. Med. 2018, 378, 1767–1777. [Google Scholar] [CrossRef] [PubMed]
- Ahmed, H.U.; El-Shater Bosaily, A.; Brown, L.C.; Gabe, R.; Kaplan, R.; Parmar, M.K.; Collaco-Moraes, Y.; Ward, K.; Hindley, R.G.; Freeman, A.; et al. Diagnostic accuracy of multi-parametric MRI and TRUS biopsy in prostate cancer (PROMIS): A paired validating confirmatory study. Lancet 2017, 389, 815–822. [Google Scholar] [CrossRef] [PubMed]
- Chaloupka, M.; Pyrgidis, N.; Ebner, B.; Pfitzinger, P.; Volz, Y.; Berg, E.; Abrarova, B.; Atzler, M.; Ivanova, T.; Pfitzinger, P.; et al. mpMRI-targeted biopsy of the prostate in men >/= 75 years. 7-year report from a high-volume referral center. Clin. Hemorheol. Microcirc. 2023. online ahead of print. [Google Scholar] [CrossRef]
- Scheenen, T.W.; Rosenkrantz, A.B.; Haider, M.A.; Futterer, J.J. Multiparametric Magnetic Resonance Imaging in Prostate Cancer Management: Current Status and Future Perspectives. Investig. Radiol. 2015, 50, 594–600. [Google Scholar] [CrossRef] [PubMed]
- de Rooij, M.; Hamoen, E.H.; Futterer, J.J.; Barentsz, J.O.; Rovers, M.M. Accuracy of multiparametric MRI for prostate cancer detection: A meta-analysis. AJR Am. J. Roentgenol. 2014, 202, 343–351. [Google Scholar] [CrossRef]
- De Visschere, P.J.; Briganti, A.; Futterer, J.J.; Ghadjar, P.; Isbarn, H.; Massard, C.; Ost, P.; Sooriakumaran, P.; Surcel, C.I.; Valerio, M.; et al. Role of multiparametric magnetic resonance imaging in early detection of prostate cancer. Insights Imaging 2016, 7, 205–214. [Google Scholar] [CrossRef]
- Goldman, H.; Singh, N.; Harding, C.; McGirr, J.; Seal, A.; Duncan, I.; Sowter, S. Accuracy of multiparametric magnetic resonance imaging to detect significant prostate cancer and index lesion location. ANZ J. Surg. 2019, 89, 106–110. [Google Scholar] [CrossRef]
- Egbers, N.; Schwenke, C.; Maxeiner, A.; Teichgraber, U.; Franiel, T. MRI-guided core needle biopsy of the prostate: Acceptance and side effects. Diagn. Interv. Radiol. 2015, 21, 215–221. [Google Scholar] [CrossRef] [PubMed]
- Polanec, S.H.; Helbich, T.H.; Bickel, H.; Wengert, G.J.; Pinker, K.; Spick, C.; Clauser, P.; Susani, M.; Shariat, S.; Baltzer, P.A.T. Quantitative Apparent Diffusion Coefficient Derived From Diffusion-Weighted Imaging Has the Potential to Avoid Unnecessary MRI-Guided Biopsies of mpMRI-Detected PI-RADS 4 and 5 Lesions. Investig. Radiol. 2018, 53, 736–741. [Google Scholar] [CrossRef]
- Mehralivand, S.; Bednarova, S.; Shih, J.H.; Mertan, F.V.; Gaur, S.; Merino, M.J.; Wood, B.J.; Pinto, P.A.; Choyke, P.L.; Turkbey, B. Prospective Evaluation of PI-RADS Version 2 Using the International Society of Urological Pathology Prostate Cancer Grade Group System. J. Urol. 2017, 198, 583–590. [Google Scholar] [CrossRef]
- Turkbey, B.; Shah, V.P.; Pang, Y.; Bernardo, M.; Xu, S.; Kruecker, J.; Locklin, J.; Baccala, A.A., Jr.; Rastinehad, A.R.; Merino, M.J.; et al. Is apparent diffusion coefficient associated with clinical risk scores for prostate cancers that are visible on 3-T MR images? Radiology 2011, 258, 488–495. [Google Scholar] [CrossRef]
- Weinreb, J.C.; Barentsz, J.O.; Choyke, P.L.; Cornud, F.; Haider, M.A.; Macura, K.J.; Margolis, D.; Schnall, M.D.; Shtern, F.; Tempany, C.M.; et al. PI-RADS Prostate Imaging—Reporting and Data System: 2015, Version 2. Eur. Urol. 2016, 69, 16–40. [Google Scholar] [CrossRef]
- Vargas, H.A.; Akin, O.; Franiel, T.; Mazaheri, Y.; Zheng, J.; Moskowitz, C.; Udo, K.; Eastham, J.; Hricak, H. Diffusion-weighted endorectal MR imaging at 3 T for prostate cancer: Tumor detection and assessment of aggressiveness. Radiology 2011, 259, 775–784. [Google Scholar] [CrossRef]
- Moraes, M.O.; Roman, D.H.H.; Copetti, J.; de Santos, F.; Agra, A.; Noronha, J.A.P.; Carvalhal, G.; Neto, E.J.D.; Zanon, M.; Baldisserotto, M.; et al. Effects of the addition of quantitative apparent diffusion coefficient data on the diagnostic performance of the PI-RADS v2 scoring system to detect clinically significant prostate cancer. World J. Urol. 2020, 38, 981–991. [Google Scholar] [CrossRef] [PubMed]
- Manetta, R.; Palumbo, P.; Gianneramo, C.; Bruno, F.; Arrigoni, F.; Natella, R.; Maggialetti, N.; Agostini, A.; Giovagnoni, A.; Di Cesare, E.; et al. Correlation between ADC values and Gleason score in evaluation of prostate cancer: Multicentre experience and review of the literature. Gland. Surg. 2019, 8, S216–S222. [Google Scholar] [CrossRef]
- Gaur, S.; Harmon, S.; Rosenblum, L.; Greer, M.D.; Mehralivand, S.; Coskun, M.; Merino, M.J.; Wood, B.J.; Shih, J.H.; Pinto, P.A.; et al. Can Apparent Diffusion Coefficient Values Assist PI-RADS Version 2 DWI Scoring? A Correlation Study Using the PI-RADSv2 and International Society of Urological Pathology Systems. AJR Am. J. Roentgenol. 2018, 211, W33–W41. [Google Scholar] [CrossRef]
- Epstein, J.I.; Egevad, L.; Amin, M.B.; Delahunt, B.; Srigley, J.R.; Humphrey, P.A.; Grading, C. The 2014 International Society of Urological Pathology (ISUP) Consensus Conference on Gleason Grading of Prostatic Carcinoma: Definition of Grading Patterns and Proposal for a New Grading System. Am. J. Surg. Pathol. 2016, 40, 244–252. [Google Scholar] [CrossRef] [PubMed]
- Kristiansen, G.; Egevad, L.; Amin, M.; Delahunt, B.; Srigley, J.R.; Humphrey, P.A.; Epstein, J.I.; Graduierungskommittee. The 2014 consensus conference of the ISUP on Gleason grading of prostatic carcinoma. Pathologe 2016, 37, 17–26. [Google Scholar] [CrossRef] [PubMed]
- Epstein, J.I.; Amin, M.B.; Reuter, V.E.; Humphrey, P.A. Contemporary Gleason Grading of Prostatic Carcinoma: An Update With Discussion on Practical Issues to Implement the 2014 International Society of Urological Pathology (ISUP) Consensus Conference on Gleason Grading of Prostatic Carcinoma. Am. J. Surg. Pathol. 2017, 41, e1–e7. [Google Scholar] [CrossRef]
- Sfoungaristos, S.; Katafigiotis, I.; Perimenis, P. The role of PSA density to predict a pathological tumour upgrade between needle biopsy and radical prostatectomy for low risk clinical prostate cancer in the modified Gleason system era. Can. Urol. Assoc. J. 2013, 7, E722–E727. [Google Scholar] [CrossRef]
- Sfoungaristos, S.; Perimenis, P. PSA density is superior than PSA and Gleason score for adverse pathologic features prediction in patients with clinically localized prostate cancer. Can. Urol. Assoc. J. 2012, 6, 46–50. [Google Scholar] [CrossRef]
- Westphalen, A.C.; Fazel, F.; Nguyen, H.; Cabarrus, M.; Hanley-Knutson, K.; Shinohara, K.; Carroll, P.R. Detection of clinically signifi cant prostate cancer with PIRADS v2 scores, PSA density, and ADC values in regions with and without mpMRI visible lesions. Int. Braz. J. Urol. 2019, 45, 713–723. [Google Scholar] [CrossRef]
- Yusim, A.; Grigaitis, J. Efficacy of Binaural Beat Meditation Technology for Treating Anxiety Symptoms: A Pilot Study. J. Nerv. Ment. Dis. 2020, 208, 155–160. [Google Scholar] [CrossRef]
- Schneider, A.F.; Stocker, D.; Hotker, A.M.; Eberli, D.; Rupp, N.J.; Donati, O.F.; Becker, A.S. Comparison of PSA-density of the transition zone and whole gland for risk stratification of men with suspected prostate cancer: A retrospective MRI-cohort study. Eur. J. Radiol. 2019, 120, 108660. [Google Scholar] [CrossRef] [PubMed]
- Nordstrom, T.; Akre, O.; Aly, M.; Gronberg, H.; Eklund, M. Prostate-specific antigen (PSA) density in the diagnostic algorithm of prostate cancer. Prostate Cancer Prostatic Dis. 2018, 21, 57–63. [Google Scholar] [CrossRef] [PubMed]
- Heidenreich, A.; Bastian, P.J.; Bellmunt, J.; Bolla, M.; Joniau, S.; van der Kwast, T.; Mason, M.; Matveev, V.; Wiegel, T.; Zattoni, F.; et al. EAU guidelines on prostate cancer. part 1: Screening, diagnosis, and local treatment with curative intent-update 2013. Eur. Urol. 2014, 65, 124–137. [Google Scholar] [CrossRef]
- Falagario, U.; Jambor, I.; Taimen, P.; Syvanen, K.T.; Kahkonen, E.; Merisaari, H.; Montoya Perez, I.; Knaapila, J.; Steiner, A.; Verho, J.; et al. Added value of systematic biopsy in men with a clinical suspicion of prostate cancer undergoing biparametric MRI-targeted biopsy: Multi-institutional external validation study. World J. Urol. 2021, 39, 1879–1887. [Google Scholar] [CrossRef] [PubMed]
- Franiel, T.; Asbach, P.; Beyersdorff, D.; Blondin, D.; Kaufmann, S.; Mueller-Lisse, U.G.; Quentin, M.; Rodel, S.; Rothke, M.; Schlemmer, H.P.; et al. mpMRI of the Prostate (MR-Prostatography): Updated Recommendations of the DRG and BDR on Patient Preparation and Scanning Protocol. Rofo 2021, 193, 763–777. [Google Scholar] [CrossRef] [PubMed]
- Donati, O.F.; Mazaheri, Y.; Afaq, A.; Vargas, H.A.; Zheng, J.; Moskowitz, C.S.; Hricak, H.; Akin, O. Prostate cancer aggressiveness: Assessment with whole-lesion histogram analysis of the apparent diffusion coefficient. Radiology 2014, 271, 143–152. [Google Scholar] [CrossRef]
- Barsouk, A.; Padala, S.A.; Vakiti, A.; Mohammed, A.; Saginala, K.; Thandra, K.C.; Rawla, P.; Barsouk, A. Epidemiology, Staging and Management of Prostate Cancer. Med. Sci. 2020, 8, 28. [Google Scholar] [CrossRef]
- Berry, B.; Parry, M.G.; Sujenthiran, A.; Nossiter, J.; Cowling, T.E.; Aggarwal, A.; Cathcart, P.; Payne, H.; van der Meulen, J.; Clarke, N. Comparison of complications after transrectal and transperineal prostate biopsy: A national population-based study. BJU Int. 2020, 126, 97–103. [Google Scholar] [CrossRef]
- Lee, S.J.; Oh, Y.T.; Jung, D.C.; Cho, N.H.; Choi, Y.D.; Park, S.Y. Combined Analysis of Biparametric MRI and Prostate-Specific Antigen Density: Role in the Prebiopsy Diagnosis of Gleason Score 7 or Greater Prostate Cancer. AJR Am. J. Roentgenol. 2018, 211, W166–W172. [Google Scholar] [CrossRef] [PubMed]
- Moller, J.M.; Boesen, L.; Hansen, A.E.; Kettles, K.; Logager, V. Quantification of cross-vendor variation in ADC measurements in vendor-specific prostate MRI-protocols. Eur. J. Radiol. 2023, 165, 110942. [Google Scholar] [CrossRef] [PubMed]
- Crop, F.; Robert, C.; Viard, R.; Dumont, J.; Kawalko, M.; Makala, P.; Liem, X.; El Aoud, I.; Ben Miled, A.; Chaton, V.; et al. Efficiency and Accuracy Evaluation of Multiple Diffusion-Weighted MRI Techniques Across Different Scanners. J. Magn. Reson. Imaging 2023. online ahead of print. [Google Scholar] [CrossRef]


| Sequence Weighting | T2 | T2 | T2 | DWI | T1 | T1 | T1 |
|---|---|---|---|---|---|---|---|
| sequence type | SE | SE | SE | EPI | SE | THRIVE | Dixon |
| orientation | sag | tra | cor | tra | tra | tra | tra |
| TR [ms] | 3200 | 4300 | 4200 | 4200 | 650 | 3.1 | 4600 |
| TE [ms] | 130 | 130 | 120 | 70 | 7.8 | 1.5 | 0 |
| matrix [pixel2] | 8802 | 5602 | 7202 | 1922 | 5602 | 4482 | 2242 |
| resolution [mm2] | 0.252 | 0.28572 | 0.252 | 0.93752 | 0.28572 | 1.19312 | 0.93752 |
| FOV [mm2] | 2202 | 1602 | 1802 | 1802 | 1602 | 2672 | 4202 |
| thickness [mm] | 3 | 3 | 3 | 3 | 3 | 3 | 3 |
| flip angle [°] | 90 | 90 | 90 | 90 | 90 | 10 | 10 |
| b-value [s/mm2] | 100, 950, 1500 | ||||||
| temporal resolution [s] | 5 | ||||||
| spacing [mm] | 3 | 3 | 3 | 3 | 3 | 1.4 | 1.51 |
| acceleration factor | 1.5 | 1.3 | 1.7 | 1.5 | |||
| average | 1 | 1 | 1 | 1 | 2 | 1 | 1 |
| Method | Threshold [*] | Sensitivity [%] | Specificity [%] | TP | FN | FP | TN | |
|---|---|---|---|---|---|---|---|---|
| ADCmean | Youden | 1239 | 79.0 | 50.6 | 113 | 30 | 136 | 139 |
| Exclusion | 1853 | 95.1 | 12.4 | 136 | 7 | 241 | 34 | |
| ADCmin | Youden | 846 | 76.9 | 53.8 | 110 | 33 | 127 | 148 |
| Exclusion | 1282 | 95.1 | 16.0 | 136 | 7 | 231 | 44 | |
| ADC/PSAD | Youden | 4904 | 74.8 | 68.4 | 107 | 36 | 87 | 188 |
| Exclusion | 10680 | 95.1 | 31.6 | 136 | 7 | 188 | 87 |
Disclaimer/Publisher’s Note: The statements, opinions and data contained in all publications are solely those of the individual author(s) and contributor(s) and not of MDPI and/or the editor(s). MDPI and/or the editor(s) disclaim responsibility for any injury to people or property resulting from any ideas, methods, instructions or products referred to in the content. |
© 2023 by the authors. Licensee MDPI, Basel, Switzerland. This article is an open access article distributed under the terms and conditions of the Creative Commons Attribution (CC BY) license (https://creativecommons.org/licenses/by/4.0/).
Share and Cite
Spadarotto, N.; Sauck, A.; Hainc, N.; Keller, I.; John, H.; Hohmann, J. Quantitative Evaluation of Apparent Diffusion Coefficient Values, ISUP Grades and Prostate-Specific Antigen Density Values of Potentially Malignant PI-RADS Lesions. Cancers 2023, 15, 5183. https://doi.org/10.3390/cancers15215183
Spadarotto N, Sauck A, Hainc N, Keller I, John H, Hohmann J. Quantitative Evaluation of Apparent Diffusion Coefficient Values, ISUP Grades and Prostate-Specific Antigen Density Values of Potentially Malignant PI-RADS Lesions. Cancers. 2023; 15(21):5183. https://doi.org/10.3390/cancers15215183
Chicago/Turabian StyleSpadarotto, Nadine, Anja Sauck, Nicolin Hainc, Isabelle Keller, Hubert John, and Joachim Hohmann. 2023. "Quantitative Evaluation of Apparent Diffusion Coefficient Values, ISUP Grades and Prostate-Specific Antigen Density Values of Potentially Malignant PI-RADS Lesions" Cancers 15, no. 21: 5183. https://doi.org/10.3390/cancers15215183
APA StyleSpadarotto, N., Sauck, A., Hainc, N., Keller, I., John, H., & Hohmann, J. (2023). Quantitative Evaluation of Apparent Diffusion Coefficient Values, ISUP Grades and Prostate-Specific Antigen Density Values of Potentially Malignant PI-RADS Lesions. Cancers, 15(21), 5183. https://doi.org/10.3390/cancers15215183