
Immunogenic Biomarkers HMGB1 and sRAGE Are Potential Diagnostic Tools for Ovarian Malignancies

 , ,
, , 
Abstract
Simple Summary
Abstract
1. Introduction
2. Materials and Methods
2.1. Study Samples
2.2. Laboratory Assays
2.3. Statistics
3. Results
4. Discussion
5. Conclusions
Author Contributions
Funding
Institutional Review Board Statement
Informed Consent Statement
Data Availability Statement
Conflicts of Interest
References
- Stoetzer, O.J.; Wittwer, C.; Lehner, J.; Fahmueller, Y.N.; Kohles, N.; Fersching, D.M.I.; Leszinski, G.; Roessner, J.; Holdenrieder, S. Circulating nucleosomes and biomarkers of immunogenic cell death as predictive and prognostic markers in cancer patients undergoing cytotoxic therapy. Expert Opin. Biol. Ther. 2012, 12 (Suppl. S1), S217–S224. [Google Scholar] [CrossRef]
- Fahmueller, Y.N.; Nagel, D.; Hoffmann, R.-T.; Tatsch, K.; Jakobs, T.; Stieber, P.; Holdenrieder, S. Immunogenic cell death biomarkers HMGB1, RAGE, and DNAse indicate response to radioembolization therapy and prognosis in colorectal cancer patients. Int. J. Cancer 2013, 132, 2349–2358. [Google Scholar] [CrossRef] [PubMed]
- Garg, A.D.; de Ruysscher, D.; Agostinis, P. Immunological metagene signatures derived from immunogenic cancer cell death associate with improved survival of patients with lung, breast or ovarian malignancies: A large-scale meta-analysis. Oncoimmunology 2016, 5, e1069938. [Google Scholar] [CrossRef] [PubMed]
- Vaughan, S.; Coward, J.I.; Bast, R.C.; Berchuck, A.; Berek, J.S.; Brenton, J.D.; Coukos, G.; Crum, C.C.; Drapkin, R.; Etemadmoghadam, D.; et al. Rethinking ovarian cancer: Recommendations for improving outcomes. Nat. Rev. Cancer 2011, 11, 719–725. [Google Scholar] [CrossRef]
- Handke, N.A.; Rupp, A.B.A.; Trimpop, N.; von Pawel, J.; Holdenrieder, S. Soluble High Mobility Group Box 1 (HMGB1) Is a Promising Biomarker for Prediction of Therapy Response and Prognosis in Advanced Lung Cancer Patients. Diagnostics 2021, 11, 356. [Google Scholar] [CrossRef] [PubMed]
- Pilzweger, C.; Holdenrieder, S. Circulating HMGB1 and RAGE as Clinical Biomarkers in Malignant and Autoimmune Diseases. Diagnostics 2015, 5, 219–253. [Google Scholar] [CrossRef]
- Muller, S.; Ronfani, L.; Bianchi, M.E. Regulated expression and subcellular localization of HMGB1, a chromatin protein with a cytokine function. J. Intern. Med. 2004, 255, 332–343. [Google Scholar] [CrossRef]
- Srinivasan, M.; Banerjee, S.; Palmer, A.; Zheng, G.; Chen, A.; Bosland, M.C.; Kajdacsy-Balla, A.; Kalyanasundaram, R.; Munirathinam, G. HMGB1 in hormone-related cancer: A potential therapeutic target. Horm. Cancer 2014, 5, 127–139. [Google Scholar] [CrossRef]
- Li, S.; Wei, Y. Association of HMGB1, BRCA1 and P62 expression in ovarian cancer and chemotherapy sensitivity. Oncol. Lett. 2018, 15, 9572–9576. [Google Scholar] [CrossRef]
- Li, Y.; Gong, X.; Hu, T.; Chen, Y. Two novel prognostic models for ovarian cancer respectively based on ferroptosis and necroptosis. BMC Cancer 2022, 22, 74. [Google Scholar] [CrossRef]
- Waki, K.; Kawano, K.; Tsuda, N.; Ushijima, K.; Itoh, K.; Yamada, A. Plasma Levels of High-Mobility Group Box 1 during Peptide Vaccination in Patients with Recurrent Ovarian Cancer. J. Immunol. Res. 2017, 2017, 1423683. [Google Scholar] [CrossRef] [PubMed]
- Paek, J.; Lee, M.; Nam, E.J.; Kim, S.W.; Kim, Y.T. Clinical impact of high mobility group box 1 protein in epithelial ovarian cancer. Arch. Gynecol. Obstet. 2016, 293, 645–650. [Google Scholar] [CrossRef] [PubMed]
- Ju, L.-L.; Zhao, C.Y.; Ye, K.-F.; Yang, H.; Zhang, J. Expression and clinical implication of Beclin1, HMGB1, p62, survivin, BRCA1 and ERCC1 in epithelial ovarian tumor tissues. Eur. Rev. Med. Pharmacol. Sci. 2016, 20, 1993–2003. [Google Scholar]
- Chen, L.; Han, X. Anti-PD-1/PD-L1 therapy of human cancer: Past, present, and future. J. Clin. Investig. 2015, 125, 3384–3391. [Google Scholar] [CrossRef] [PubMed]
- Gatalica, Z.; Snyder, C.; Maney, T.; Ghazalpour, A.; Holterman, D.A.; Xiao, N.; Overberg, P.; Rose, I.; Basu, G.D.; Vranic, S.; et al. Programmed cell death 1 (PD-1) and its ligand (PD-L1) in common cancers and their correlation with molecular cancer type. Cancer Epidemiol. Biomark. Prev. 2014, 23, 2965–2970. [Google Scholar] [CrossRef] [PubMed]
- Teng, F.; Meng, X.; Kong, L.; Yu, J. Progress and challenges of predictive biomarkers of anti PD-1/PD-L1 immunotherapy: A systematic review. Cancer Lett. 2018, 414, 166–173. [Google Scholar] [CrossRef] [PubMed]
- Wittwer, C.; Lehner, J.; Fersching, D.; Siegele, B.; Stoetzer, O.J.; Holdenrieder, S. Methodological and preanalytical evaluation of a RAGE immunoassay. Anticancer Res. 2012, 32, 2075–2078. [Google Scholar]
- Lehner, J.; Wittwer, C.; Fersching, D.; Siegele, B.; Holdenrieder, S.; Stoetzer, O.J. Methodological and preanalytical evaluation of an HMGB1 immunoassay. Anticancer Res. 2012, 32, 2059–2062. [Google Scholar]
- Kruger, S.; Legenstein, M.-L.; Rösgen, V.; Haas, M.; Modest, D.P.; Westphalen, C.B.; Ormanns, S.; Kirchner, T.; Heinemann, V.; Holdenrieder, S.; et al. Serum levels of soluble programmed death protein 1 (sPD-1) and soluble programmed death ligand 1 (sPD-L1) in advanced pancreatic cancer. Oncoimmunology 2017, 6, e1310358. [Google Scholar] [CrossRef]
- Wild, C.; Weiderpass, E.; Stewart, B.W. (Eds.) World Cancer Report: Cancer Research for Cancer Prevention; International Agency for Research on Cancer: Lyon, France, 2020. [Google Scholar]
- Reid, B.M.; Permuth, J.B.; Sellers, T.A. Epidemiology of ovarian cancer: A review. Cancer Biol. Med. 2017, 14, 9–32. [Google Scholar] [CrossRef]
- Győrffy, B. Discovery and ranking of the most robust prognostic biomarkers in serous ovarian cancer. Geroscience 2023, 45, 1889–1898. [Google Scholar] [CrossRef]
- Zheng, M.; Hu, Y.; Liu, O.; Li, S.; Wang, Y.; Li, X.; Liu, J.; Yang, Q.; Li, X.; Lin, B. Oxidative Stress Response Biomarkers of Ovarian Cancer Based on Single-Cell and Bulk RNA Sequencing. Oxid. Med. Cell. Longev. 2023, 2023, 1261039. [Google Scholar] [CrossRef]
- Mukama, T.; Fortner, R.T.; Katzke, V.; Hynes, L.C.; Petrera, A.; Hauck, S.M.; Johnson, T.; Schulze, M.; Schiborn, C.; Rostgaard-Hansen, A.L.; et al. Prospective evaluation of 92 serum protein biomarkers for early detection of ovarian cancer. Br. J. Cancer 2022, 126, 1301–1309. [Google Scholar] [CrossRef]
- Zhang, R.; Siu, M.K.Y.; Ngan, H.Y.S.; Chan, K.K.L. Molecular Biomarkers for the Early Detection of Ovarian Cancer. Int. J. Mol. Sci. 2022, 23, 12041. [Google Scholar] [CrossRef]
- Staicu, C.E.; Predescu, D.-V.; Rusu, C.M.; Radu, B.M.; Cretoiu, D.; Suciu, N.; Crețoiu, S.M.; Voinea, S.-C. Role of microRNAs as Clinical Cancer Biomarkers for Ovarian Cancer: A Short Overview. Cells 2020, 9, 169. [Google Scholar] [CrossRef] [PubMed]
- Sölétormos, G.; Duffy, M.J.; Othman Abu Hassan, S.; Verheijen, R.H.M.; Tholander, B.; Bast, R.C.; Gaarenstroom, K.N.; Sturgeon, C.M.; Bonfrer, J.M.; Petersen, P.H.; et al. Clinical Use of Cancer Biomarkers in Epithelial Ovarian Cancer: Updated Guidelines from the European Group on Tumor Markers. Int. J. Gynecol. Cancer 2016, 26, 43–51. [Google Scholar] [CrossRef] [PubMed]
- Morgan, R.J.; Armstrong, D.K.; Alvarez, R.D.; Bakkum-Gamez, J.N.; Behbakht, K.; Chen, L.; Copeland, L.; Crispens, M.A.; DeRosa, M.; Dorigo, O.; et al. Ovarian Cancer, Version 1.2016, NCCN Clinical Practice Guidelines in Oncology. J. Natl. Compr. Canc. Netw. 2016, 14, 1134–1163. [Google Scholar] [CrossRef] [PubMed]
- Lu, K.H.; Skates, S.; Hernandez, M.A.; Bedi, D.; Bevers, T.; Leeds, L.; Moore, R.; Granai, C.; Harris, S.; Newland, W.; et al. A 2-stage ovarian cancer screening strategy using the Risk of Ovarian Cancer Algorithm (ROCA) identifies early-stage incident cancers and demonstrates high positive predictive value. Cancer 2013, 119, 3454–3461. [Google Scholar] [CrossRef] [PubMed]
- Romagnolo, C.; Leon, A.E.; Fabricio, A.S.C.; Taborelli, M.; Polesel, J.; Del Pup, L.; Steffan, A.; Cervo, S.; Ravaggi, A.; Zanotti, L.; et al. HE4, CA125 and risk of ovarian malignancy algorithm (ROMA) as diagnostic tools for ovarian cancer in patients with a pelvic mass: An Italian multicenter study. Gynecol. Oncol. 2016, 141, 303–311. [Google Scholar] [CrossRef] [PubMed]
- Logsdon, C.D.; Fuentes, M.K.; Huang, E.H.; Arumugam, T. RAGE and RAGE ligands in cancer. Curr. Mol. Med. 2007, 7, 777–789. [Google Scholar] [CrossRef]
- Rojas, A.; Figueroa, H.; Morales, E. Fueling inflammation at tumor microenvironment: The role of multiligand/RAGE axis. Carcinogenesis 2010, 31, 334–341. [Google Scholar] [CrossRef] [PubMed]
- Jin, S.; Yang, Z.; Hao, X.; Tang, W.; Ma, W.; Zong, H. Roles of HMGB1 in regulating myeloid-derived suppressor cells in the tumor microenvironment. Biomark. Res. 2020, 8, 21. [Google Scholar] [CrossRef] [PubMed]
- Rahimi, F.; Karimi, J.; Goodarzi, M.T.; Saidijam, M.; Khodadadi, I.; Razavi, A.N.E.; Nankali, M. Overexpression of receptor for advanced glycation end products (RAGE) in ovarian cancer. Cancer Biomark. 2017, 18, 61–68. [Google Scholar] [CrossRef] [PubMed]
- Machado, L.R.; Moseley, P.M.; Moss, R.; Deen, S.; Nolan, C.; Spendlove, I.; Ramage, J.M.; Chan, S.Y.; Durrant, L.G. High mobility group protein B1 is a predictor of poor survival in ovarian cancer. Oncotarget 2017, 8, 101215–101223. [Google Scholar] [CrossRef][Green Version]
- Li, Y.; Tian, J.; Fu, X.; Chen, Y.; Zhang, W.; Yao, H.; Hao, Q. Serum high mobility group box protein 1 as a clinical marker for ovarian cancer. Neoplasma 2014, 61, 579–584. [Google Scholar] [CrossRef][Green Version]
- Schröder, L.; Domroese, C.M.; Rupp, A.B.A.; Gihr, K.M.; Niederau, C.; Mallmann, M.R.; Holdenrieder, S. Clinical applicability of tissue polypeptide antigen and CA-125 in gynaecological malignancies. Biomedicines 2023. submitted. [Google Scholar]
- Le, Y.; Wang, Y.; Zhou, L.; Xiong, J.; Tian, J.; Yang, X.; Gai, X.; Sun, Y. Cigarette smoke-induced HMGB1 translocation and release contribute to migration and NF-κB activation through inducing autophagy in lung macrophages. J. Cell. Mol. Med. 2020, 24, 1319–1331. [Google Scholar] [CrossRef]
- Enokido, Y.; Yoshitake, A.; Ito, H.; Okazawa, H. Age-dependent change of HMGB1 and DNA double-strand break accumulation in mouse brain. Biochem. Biophys. Res. Commun. 2008, 376, 128–133. [Google Scholar] [CrossRef]
- Peek, V.; Neumann, E.; Inoue, T.; Koenig, S.; Pflieger, F.J.; Gerstberger, R.; Roth, J.; Matsumura, K.; Rummel, C. Age-Dependent Changes of Adipokine and Cytokine Secretion from Rat Adipose Tissue by Endogenous and Exogenous Toll-like Receptor Agonists. Front. Immunol. 2020, 11, 1800. [Google Scholar] [CrossRef]
- Jiang, C.; Qu, X.; Ke, H.; Gong, W.; Chen, R.; Yang, W.; Cheng, Z. Association between the HMGB1/TLR4 signaling pathway and the clinicopathological features of ovarian cancer. Mol. Med. Rep. 2018, 18, 3093–3098. [Google Scholar] [CrossRef]


| Parameter | Age 1 | HMGB1 2 | sRAGE 3 | HMGB1/sRAGE 4 | PD-1 5 | PD-L1 6 |
|---|---|---|---|---|---|---|
| Healthy | 43 (21) | 2.90 (5.25) | 1.02 (0.56) | 2.59 (4.57) | 0.011 (0.068) | 0.1 (7.7) |
| N | 68 | 67 | 67 | 67 | 66 | 67 |
| Cysts | 49 (17) | 3.43 (4.16) | 1.02 (0.52) | 3.56 (4.71) | 0.006 (0.041) | 0.1 (9.0) |
| N | 25 | 26 | 26 | 26 | 26 | 26 |
| Inflammation | 50 (−) | 11.56 (−) | 0.55 (−) | 22.47 (−) | 0.027 (−) | 0.1 (−) |
| N | 3 | 3 | 3 | 3 | 3 | 3 |
| Ovarian benign | 51 (27) | 4.69 (4.29) | 0.88 (0.48) | 4.57 (5.31) | 0.016 (0.058) | 0.1 (7.4) |
| N | 58 | 58 | 58 | 58 | 58 | 58 |
| Ovarian cancer | 62 (18) | 8.33 (8.26) | 0.77 (0.50) | 10.35 (11.71) | 0.023 (0.039) | 0.1 (5.7) |
| N | 76 | 75 | 74 | 74 | 76 | 75 |
| p-value * | <0.001 | <0.001 | 0.006 | <0.001 | 0.152 | 0.824 |
| Malignancy | Age 1 | HMGB1 2 | sRAGE 3 | HMGB1/sRAGE 4 | PD1 5 | PD-L1 6 |
|---|---|---|---|---|---|---|
| Primary | 62 (20) | 10.92 (9.67) | 0.69 (0.39) | 12.97 (16.80) | 0.019 (0.039) | 0.1 (2.2) |
| N | 51 | 51 | 50 | 50 | 51 | 50 |
| Recurrent | 63 (18) | 5.48 (5.21) | 1.03 (0.59) | 4.93 (9.43) | 0.030 (0.040) | 0.1 (9.0) |
| N | 25 | 24 | 24 | 24 | 25 | 25 |
| p-value * | 0.462 | <0.001 | 0.017 | <0.001 | 0.436 | 0.484 |
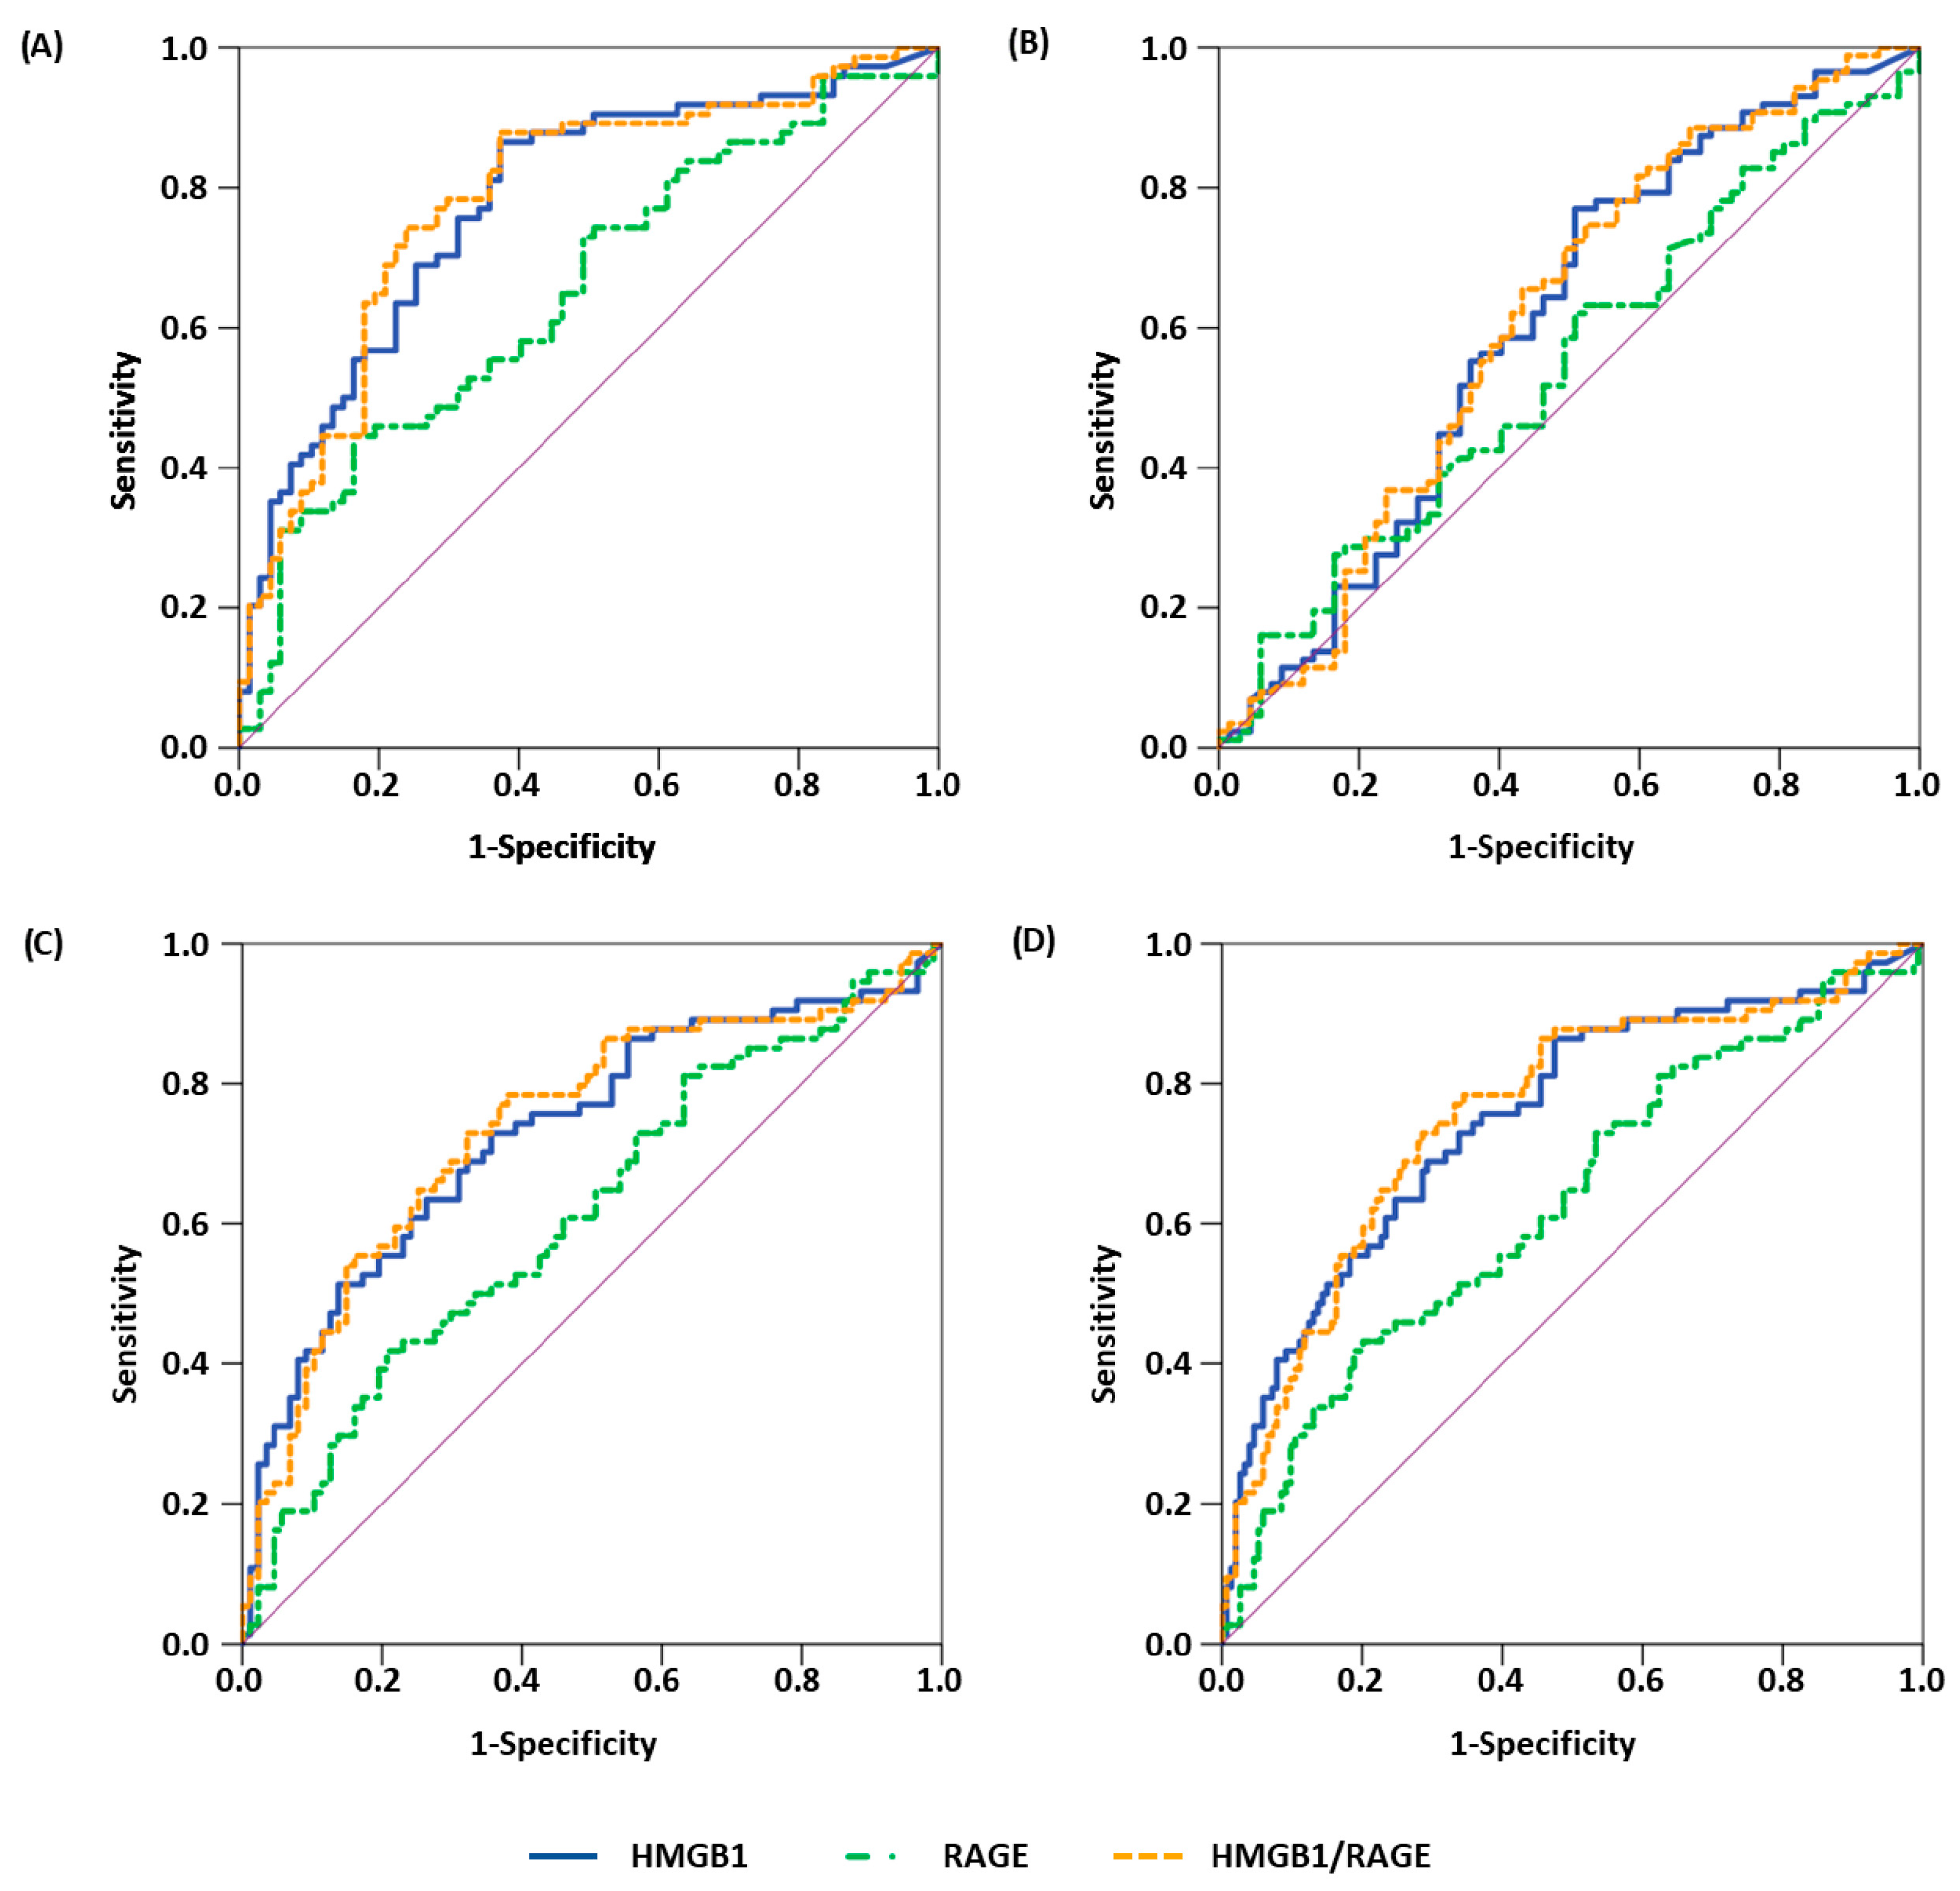
| Comparison | Parameter | AUC | 95% CI | p-Value | Sens90 | Sens95 |
|---|---|---|---|---|---|---|
| healthy vs. malignant | HMGB1 | 0.771 | 0.693–0.849 | <0.001 | 41.3 | 34.7 |
| sRAGE a | 0.650 | 0.559–0.740 | 0.002 | 33.8 | 12.2 | |
| HMGB1/sRAGE | 0.782 | 0.705–0.859 | <0.001 | 36.5 | 27.0 | |
| PD1 | 0.588 | 0.490–0.686 | 0.070 | 6.6 | 5.3 | |
| PD-L1 | 0.503 | 0.407–0.599 | 0.954 | 9.3 | 4.0 | |
| healthy vs. all benign | HMGB1 | 0.605 | 0.512–0.697 | 0.026 | 11.5 | 6.9 |
| sRAGE a | 0.544 | 0.452–0.636 | 0.353 | 16.1 | 4.6 | |
| HMGB1/sRAGE | 0.611 | 0.519–0.703 | 0.018 | 9.2 | 6.9 | |
| PD1 | 0.506 | 0.411–0.600 | 0.905 | 5.7 | 2.3 | |
| PD-L1 | 0.492 | 0.399–0.585 | 0.860 | 3.4 | 1.1 | |
| all benign vs. malignant | HMGB1 | 0.722 | 0.641–0.802 | <0.001 | 41.3 | 30.7 |
| sRAGE a | 0.612 | 0.525–0.699 | 0.014 | 18.9 | 16.2 | |
| HMGB1/sRAGE | 0.737 | 0.658–0.817 | <0.001 | 39.2 | 23.0 | |
| PD1 | 0.599 | 0.511–0.687 | 0.029 | 11.8 | 6.6 | |
| PD-L1 | 0.510 | 0.421–0.600 | 0.819 | 10.7 | 9.3 | |
| all non-malignant vs. malignant | HMGB1 | 0.743 | 0.672–0.814 | <0.001 | 41.3 | 30.7 |
| sRAGE a | 0.628 | 0.550–0.707 | 0.002 | 28.4 | 12.2 | |
| HMGB1/sRAGE | 0.757 | 0.687–0.826 | <0.001 | 37.8 | 23.0 | |
| PD1 | 0.594 | 0.521–0.668 | 0.020 | 9.2 | 6.6 | |
| PD-L1 | 0.507 | 0.428–0.587 | 0.862 | 10.7 | 8.0 |
Disclaimer/Publisher’s Note: The statements, opinions and data contained in all publications are solely those of the individual author(s) and contributor(s) and not of MDPI and/or the editor(s). MDPI and/or the editor(s) disclaim responsibility for any injury to people or property resulting from any ideas, methods, instructions or products referred to in the content. |
© 2023 by the authors. Licensee MDPI, Basel, Switzerland. This article is an open access article distributed under the terms and conditions of the Creative Commons Attribution (CC BY) license (https://creativecommons.org/licenses/by/4.0/).
Share and Cite
Schröder, L.; Rupp, A.B.A.; Gihr, K.M.E.; Kobilay, M.; Domroese, C.M.; Mallmann, M.R.; Holdenrieder, S. Immunogenic Biomarkers HMGB1 and sRAGE Are Potential Diagnostic Tools for Ovarian Malignancies. Cancers 2023, 15, 5081. https://doi.org/10.3390/cancers15205081
Schröder L, Rupp ABA, Gihr KME, Kobilay M, Domroese CM, Mallmann MR, Holdenrieder S. Immunogenic Biomarkers HMGB1 and sRAGE Are Potential Diagnostic Tools for Ovarian Malignancies. Cancers. 2023; 15(20):5081. https://doi.org/10.3390/cancers15205081
Chicago/Turabian StyleSchröder, Lars, Alexander B. A. Rupp, Kathrin M. E. Gihr, Makbule Kobilay, Christian M. Domroese, Michael R. Mallmann, and Stefan Holdenrieder. 2023. "Immunogenic Biomarkers HMGB1 and sRAGE Are Potential Diagnostic Tools for Ovarian Malignancies" Cancers 15, no. 20: 5081. https://doi.org/10.3390/cancers15205081
APA StyleSchröder, L., Rupp, A. B. A., Gihr, K. M. E., Kobilay, M., Domroese, C. M., Mallmann, M. R., & Holdenrieder, S. (2023). Immunogenic Biomarkers HMGB1 and sRAGE Are Potential Diagnostic Tools for Ovarian Malignancies. Cancers, 15(20), 5081. https://doi.org/10.3390/cancers15205081