Article

Deletion of PGAM5 Downregulates FABP1 and Attenuates Long-Chain Fatty Acid Uptake in Hepatocellular Carcinoma

Louisiana State University School of Veterinary Medicine, Baton Rouge, LA 70803, USA
*
Author to whom correspondence should be addressed.
Cancers 2023, 15(19), 4796; https://doi.org/10.3390/cancers15194796
Submission received: 30 July 2023 / Revised: 14 September 2023 / Accepted: 22 September 2023 / Published: 29 September 2023
(This article belongs to the Special Issue Cancer Metabolic Landscapes and Interactions)

Abstract

:

Simple Summary

Hepatocellular carcinoma is the most common liver cancer. Metabolic dysfunction-associated steatotic liver disease is emerging as a primary cause of hepatocellular carcinoma. Lipid metabolism is altered in hepatocellular carcinoma to promote tumor growth. The mitochondrial membrane protein phosphoglycerate mutase 5 (PGAM5) is overexpressed in hepatocellular carcinoma and may play a role in lipid metabolism. The aim of our research study was to determine whether the expression of PGAM5 modified fatty acid uptake and lipid droplet accumulation in hepatocellular carcinoma cells. We learned that by eliminating PGAM5 expression, lipid droplet accumulation was reduced in hepatocellular carcinoma and that this may be due to reduced fatty acid uptake. Enhanced understanding of fatty acid regulation in cancer supports the rationale design of therapeutics targeting metabolic pathways.

Abstract

Phosphoglycerate mutase 5 (PGAM5) is a Ser/His/Thr phosphatase responsible for regulating mitochondrial homeostasis. Overexpression of PGAM5 is correlated with a poor prognosis in hepatocellular carcinoma, colon cancer, and melanoma. In hepatocellular carcinoma, silencing of PGAM5 reduces growth, which has been attributed to decreased mitophagy and enhanced apoptosis. Yet in colon cancer, PGAM5’s pro-tumor survival effect is correlated to lipid metabolism. We sought to identify whether deletion of PGAM5 modulated lipid droplet accrual in hepatocellular carcinoma. HepG2 and Huh7 PGAM5 knockout cell lines generated using CRISPR/Cas9 technology were used to measure cell growth, cellular ATP, and long-chain fatty acid uptake. Expression of hepatocellular fatty acid transporters, cluster of differentiation 36 (CD36), solute carrier family 27 member 2 (SLC27A2), solute carrier family 27 member 5 (SLC27A5), and fatty acid binding protein 1 (FABP1) was measured by quantitative PCR and Western blot. We found that deletion of PGAM5 attenuates hepatocellular carcinoma cell growth and ATP production. Further, PGAM5 knockout ameliorates palmitate-induced steatosis and reduces expression of FABP1 in HepG2 and Huh7 cell lines. PGAM5’s role in hepatocellular carcinoma includes regulation of fatty acid metabolism, which may be related to expression of the fatty acid transporter, FABP1.

1. Introduction

Hepatocellular carcinoma (HCC) is the fourth leading cause of cancer death worldwide [1]. Epidemiological estimates indicate that greater than 1 million people will be diagnosed with HCC by 2025 [1,2]. Overexpression of tumoral phosphoglycerate mutase 5 (PGAM5) is correlated with reduced survival in hepatocellular carcinoma, as well as other cancers [3,4,5,6,7,8]. The mitochondrial membrane protein PGAM5 is a serine/threonine/histidine phosphatase with a diverse set of substrates [6,7,8,9,10,11]. Among these are mediators of mitophagy and multiple regulated cell death pathways [12,13,14,15,16,17]. PGAM5 can inhibit and potentiate apoptosis dependent on the phosphorylation state of the anti- apoptotic protein, B-cell lymphoma-extra large (BclXL) [18]. Aside from its phosphatase activity, PGAM5 also promotes the stabilization of proteins at the mitochondrial membrane. PGAM5 plays a role in oxeiptosis through its interaction with the oxidant sensor KEAP1 [19]. PGAM5 tethers KEAP1 to the mitochondrial membrane. When moderate oxidative damage occurs, the KEAP1–NRF2 complex dissociates, allowing translocation of the antioxidant transcription factor NRF2 to the nucleus. In cases of extreme oxidant injury, PGAM5 dissociates from KEAP1 and interacts with and dephosphorylates the mediator of caspase independent cell death apoptosis inducing factor-1 (AIFM1), resulting in caspase-independent, immunologically silent cell death. PGAM5 also enhances mitochondrial fission of damaged mitochondria through dynamin-related protein 1 (Drp1) dephosphorylation [20]. PGAM5’s inhibitory role in apoptosis through BclXL dephosphorylation and enhancement of Drp1-mediated mitophagy have been correlated to its pro-cancer survival effect, wherein PGAM5 knockdown has been shown to attenuate hepatocellular tumor growth in vitro and in xenograft models of HCC [6,7,21].
In colon cancer, PGAM5 has been linked to tumor lipid metabolism, which has not been explored in HCC [5]. Metabolic reprogramming is a hallmark of oncogenesis [22,23]. Dysregulated growth imparts unique nutrient requirements. When glucose and protein stores are depleted, lipids provide an energetically dense fuel source. Further, lipid droplets serve as depots for membrane repair components and metabolites needed for cell signaling. In cancer, the intracellular lipid pool is replenished by upregulation of de novo lipogenesis and altered fatty acid uptake [23]. Long-chain fatty acid (LCFA) uptake in hepatocytes is enabled by cluster of differentiation 36 (CD36) fatty acid translocase, the fatty acid transport proteins of the solute transporter family (solute carrier family 27 member 2 (SLC27A2), solute carrier family 27 member 5 (SLC27A5)), and the fatty acid binding proteins, predominantly fatty acid binding protein 1 (FABP1). Fatty acid transporters are overexpressed in many cancers and are known to promote tumor growth [24,25,26].
The purpose of this study was to determine if loss of PGAM5 reduced HCC viability and disrupted fatty acid uptake. We found that deletion of PGAM5 mitigates hepatocellular growth and ATP production in HCC cells. Treatment with the long-chain fatty acid palmitate upregulates PGAM5 mRNA expression and knockout of PGAM5 attenuates palmitate-induced steatosis. Finally, we identified downregulated expression of FABP1 in HCC cells. PGAM5 knockout alters the lipid metabolic phenotype in HCC cells.

2. Materials and Methods

2.1. Cell Lines and Culture Conditions

The HepG2 cell line (HB-8065) was purchased from ATCC®. The Huh-7D 12 (Huh7, 01042712) cell line was purchased from Millipore Sigma. The HepG2 PGAM5 knockout cell line was generated and validated by Synthego Corporation (Redwood City, CA, USA). The Huh-7D PGAM5 knockout line was generated in our laboratory using PGAM5 CRISPR/Cas9 KO Plasmid (sc-401300, Santa Cruz Biotechnology, Inc., Dallas, TX, USA). Following transfection, cell cultures were diluted to enable single cell per well plating. Single cells expressing green fluorescent protein indicative of plasmid transfection were clonally expanded and screened for loss of PGAM5 protein expression by Western blot. A single clone with loss of PGAM5 protein expression was utilized for all experiments. The HepG2 and Huh7 cell lines were maintained in DMEM, high glucose media (25 mmol/L glucose, Gibco, Grand Island, NY, USA) supplemented with 10% fetal bovine serum (Avantor, Radnor, PA, USA), and 1% Penicillin–Streptomycin (Gibco). Nutrient depleted media were composed of DMEM (glucose 12.5 mol/L), FBS 1%, and L-Carnitine 0.5 mM. Bovine serum albumin 80 µM (BSA; 28556, Cayman Chemical, Ann Arbor, MI, USA) and BSA–Palmitate Saturated Fatty Acid Complex 500 µM (29558, Cayman Chemical) were applied as indicated.

2.2. Cell Growth and ATP Quantification Assays

Live cell imaging was used for label-free, cell growth quantification of bright field area Incucyte® S3 Live Cell Analysis Instrument (Sartorius, Goettingen, Germany). ATP was quantified using the CellTiter-Glo assay (Promega, Madison, WI, USA), which was performed according to the manufacturer’s instructions. Luminescence was recorded with a Synergy LX multimode reader (Bio-Tek, Winooski, VT, USA). Three experiments with eight replicates per experiment were completed for cell growth and ATP quantification assays.

2.3. Quantification of Fatty Acid Uptake

Cell culture wells were washed twice with PBS and fixed in 10% formalin for 30 min at room temperature. Formalin was removed and cells were washed twice with deionized water and treated with 60% isopropanol for 5 min. Oil Red O solution was applied to each well for 20 min rotating at room temperature and wells were subsequently washed 3 times with deionized water. Total cell area was evaluated using the Incucyte® S3 Live Cell Analysis Instrument (Sartorius) to confirm equal cell density prior to fatty acid extraction. Plates were washed 3 times with 60% isopropanol for 5 min rotating at room temperature. Oil Red O was extracted with 100% isopropanol for 5 min and absorbance was measured at 492 nm on the Synergy LX multimode reader (Bio-Tek, Winooski, VT, USA). Quantification of fatty acids was performed in 3 experiments with a minimum of 2 replicates.

2.4. Quantitative PCR

Total RNA from cultured cells was extracted using the RNeasy kit (Qiagen, Germantown, MD, USA) according to manufacturer’s instructions and quantified using a Nanodrop™ (Thermo Fisher, Waltham, MA, USA). Reverse transcription and qPCR were performed per manufacturer’s protocols (qScript™ cDNA SuperMix and PerfeCTaSYBR® Green FastMix® Reaction Mix, QuantaBio, Beverly, MA, USA). The housekeeping genes 18s and ß-Actin were used for standardization of sample mRNA content. Analysis was performed on 7900 HT Applied BioSystems™ Real-Time PCR Detection System (BioRad Bedford, MA, USA). Each quantitative RT-PCR was performed in duplicate with 12.5 ng cDNA. The relative expression levels of the target genes were calculated and expressed as -ddCt relative to 18S RNA expression in wild type cells. All primer sequences are listed in Supplementary Table S1. Quantitative PCR was run in duplicate in each of the 3 experiments.

2.5. Western Blotting

Cell pellets were lysed with five volumes of lysis buffer (50 mM Tris (pH 7.4), 137 mM NaCl, 1 mM EDTA, 1% Triton X-100, and 10% glycerol, supplemented with 1× halt protease inhibitor cocktail (ThermoFisher, Waltham, MA, USA)) and incubated on ice for 30 min. Cell lysates were centrifuged at 20,000× g for 15 min, and the supernatant was collected. The protein content was measured and normalized using a BCA Protein Assay Kit (ThermoFisher, Waltham, MA, USA). Total proteins (20–40 μg) were separated by SDS-PAGE and transferred onto PVDF membranes. After blocking with 5% non-fat milk, the membranes were incubated with primary antibodies at 4 °C overnight and subsequently incubated with their corresponding HRP-labeled secondary antibodies. Bands were detected using ECL (RPN2106, Cytvia, Marlborough, MA, USA) on myECL Imager (G2236X, Thermo Fisher, Waltham, MA, USA). The protein relative intensity was analyzed using ImageJ software (National Institutes of Health, Bethesda, MD, USA). Primary antibodies: Actin (Invitrogen, Waltham, MA, USA; AB_2223496), CD36 (Invitrogen, Waltham, MA, USA; AB_2807046), SLC27A2 (Invitrogen, AB_2851750), SLC27A5 (Invitrogen, AB_2786966), FABP1 (LSBio, Shirley, MA, USA; LS-C369600), PGAM5 (Invitrogen, Waltham, MA, USA; AB_2900380). Secondary antibodies: Goat anti-Rabbit HRP (Invitrogen, Waltham, MA, USA; AB_228341), Anti-mouse (Invitrogen, Waltham, MA, USA; AB_228295). Western blot was performed on cell lysates from 3 non-replicated experiments per cell line.

2.6. Statistical Analyses

Statistical analyses were performed using JMP Pro 16.2.0 (SAS Institute, Cary, NC, USA) and figures were made using GraphPad Prism, version 9.4 (GraphPad Prism Software, Inc., La Jolla, CA, USA). Data are expressed as mean ± standard deviation (SD), standard error of the mean (SEM), or confidence interval (CI) as indicated. Logarithmic transformation was performed for data that did not meet the normality criteria. Normality of residuals from the models were accessed and confirmed via Shapiro–Wilk tests. A mixed analysis of variance (ANOVA) model was used to analyze -ddCT data (qPCR) with wild type and PGAM5 knockout as the fixed effect and each plate as the random effect. Cellular growth, ATP production, and fatty acid uptake were measured by a 2-way mixed ANOVA with cell type, time, and their interaction as the fixed effect; where appropriate, a post hoc Tukey test was used for comparisons between groups. Paired t-tests were used for comparisons of protein expression. Differences were considered significant at p < 0.05.

3. Results

3.1. Deletion of PGAM5 Attenuates Hepatocellular Carcinoma Cell Growth

To evaluate the effects of PGAM5 deletion on HCC cell growth and viability, Huh7 and HepG2 were cultured under standard conditions for 72 h. ATP production was measured concurrently (Figure 1A,B). Although the PGAM5 knockout cells remained viable, ATP production was significantly reduced. Consistent with previous reports, cell growth was attenuated in Huh7 and HepG2 PGAM5 knockdown cell lines (Figure 1C,D) [7].

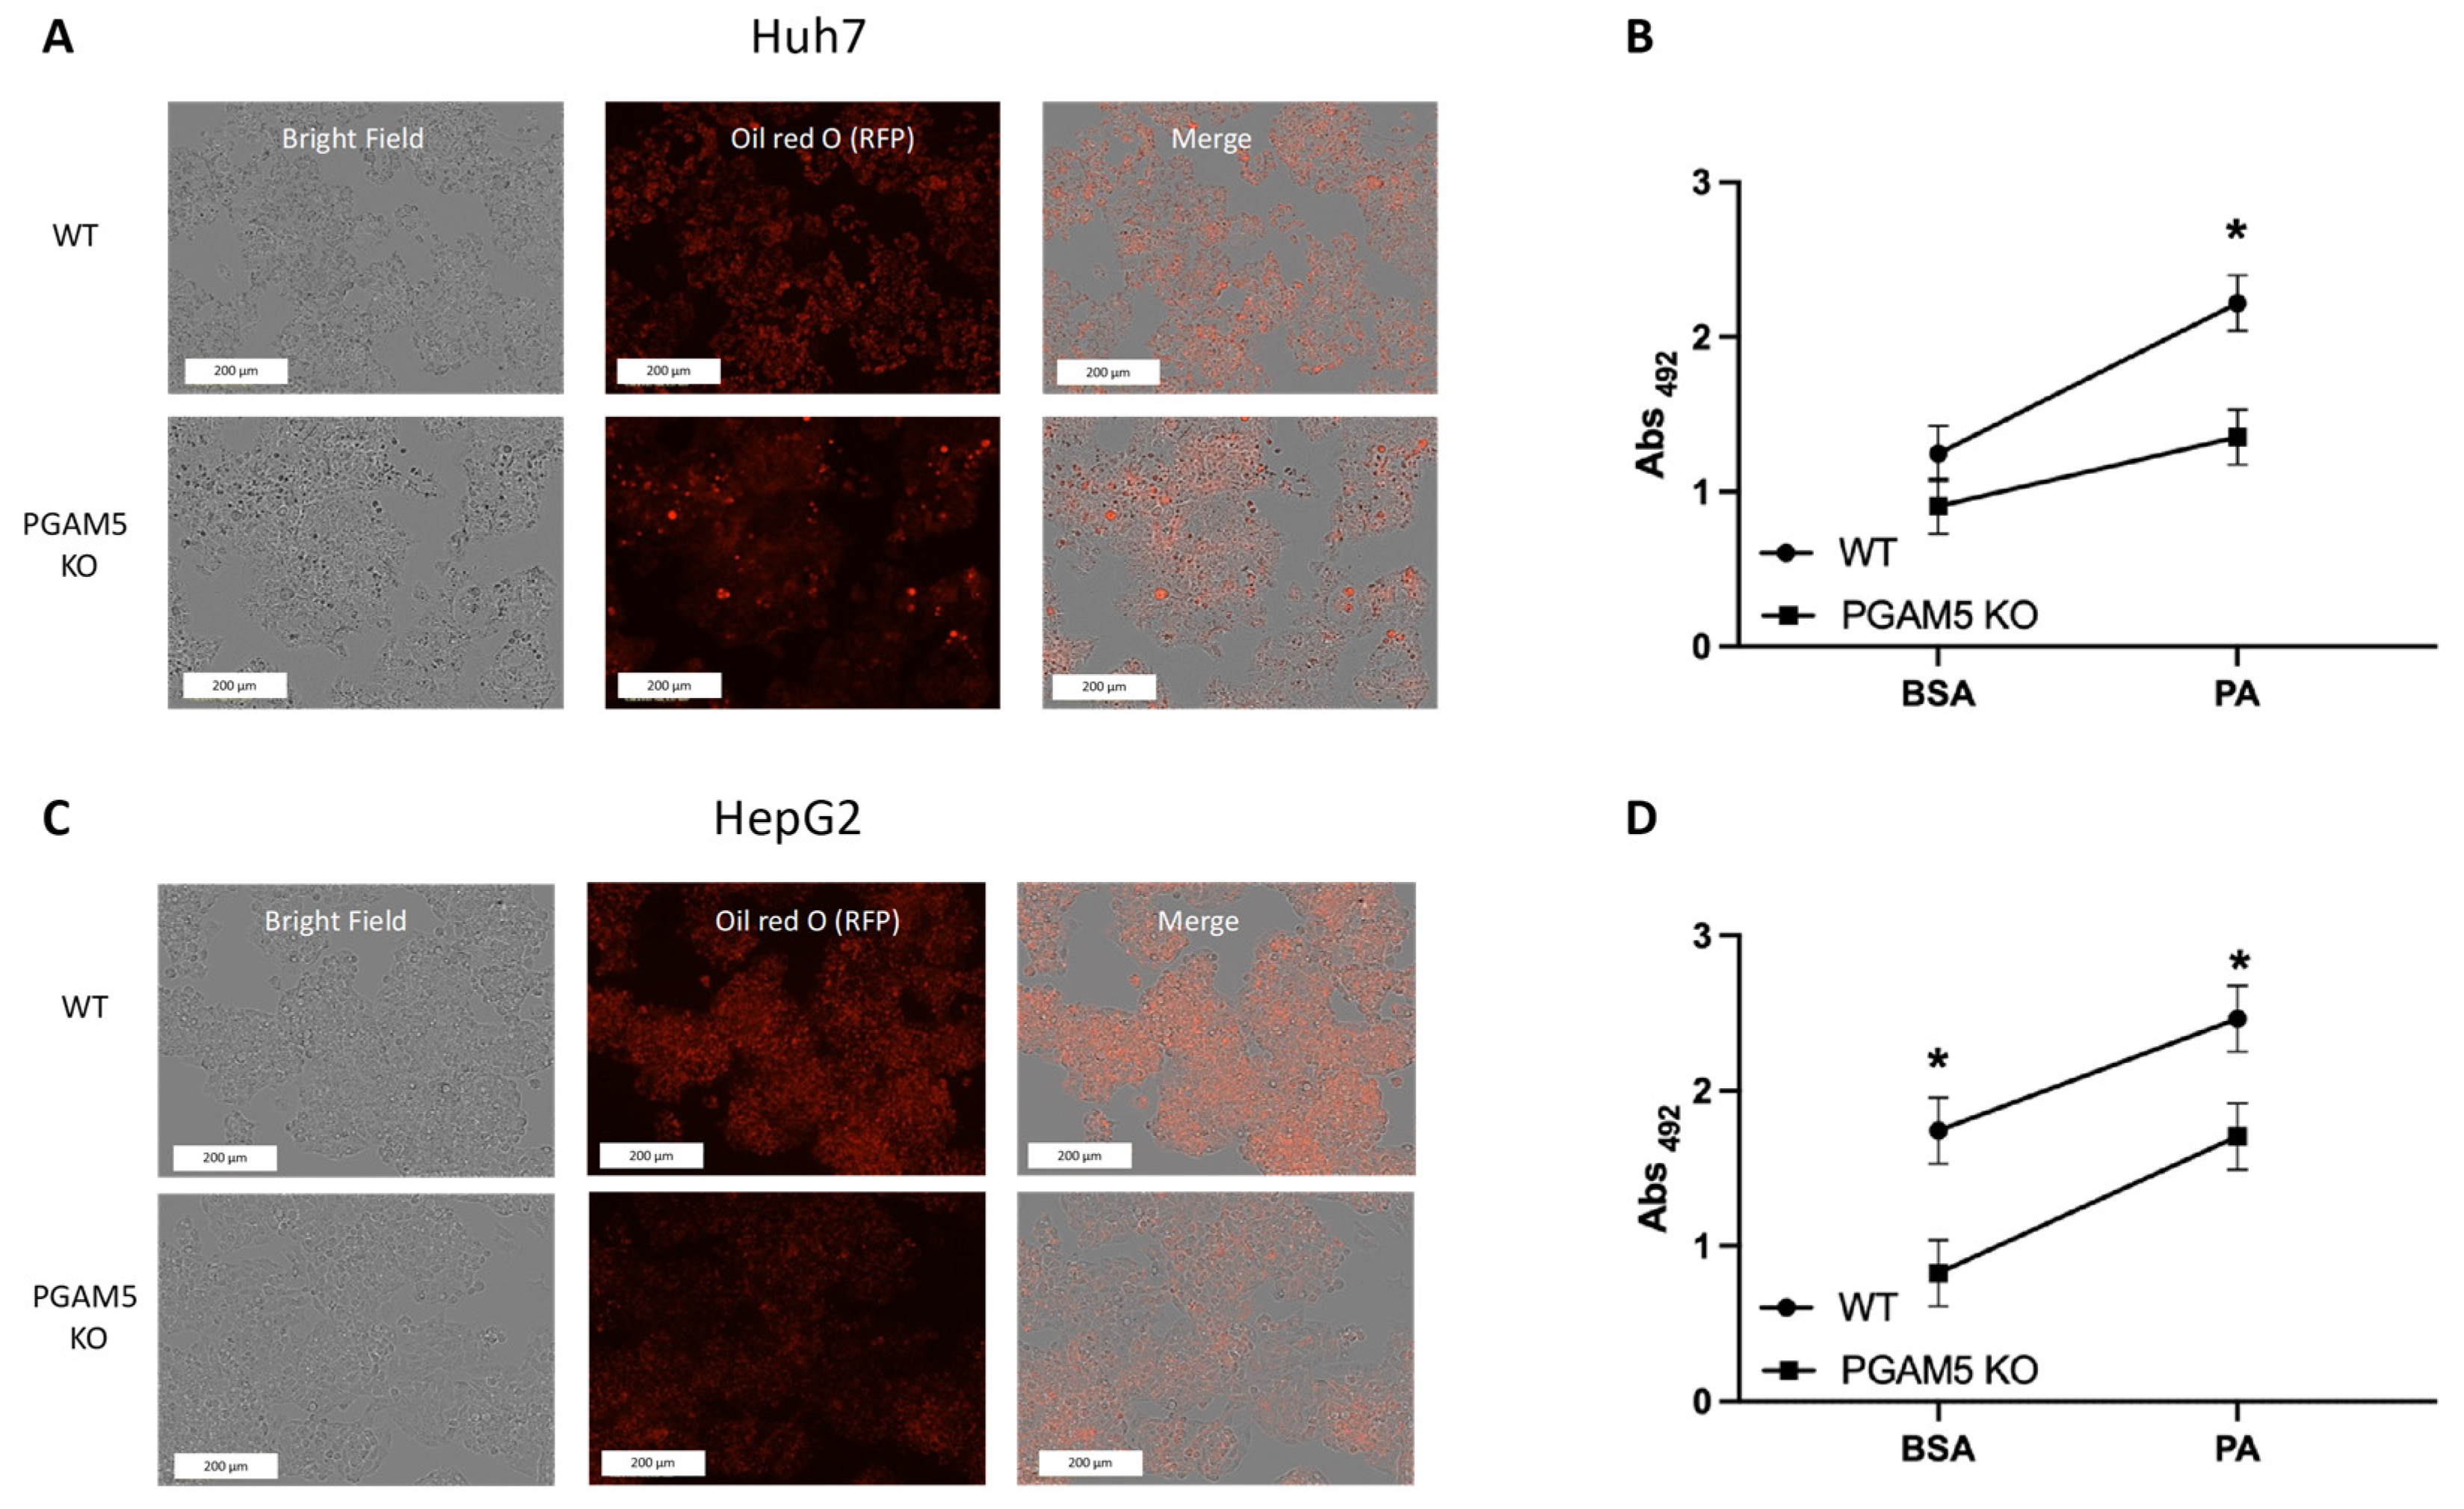
3.2. Long-Chain Fatty Acid-Induced Steatosis Is Ameliorated with PGAM5 Knockout

To determine if PGAM5 deletion impacts lipid droplet accumulation, WT and PGAM5 knockout HCC cell lines were treated overnight with palmitate. Lipid droplet accrual was assessed by Oil Red O spectrophotometric quantitation and cell density was assessed by image analysis (Figure 2). Palmitate-induced steatosis was significantly reduced in PGAM5 KO compared to WT cell lines (Figure 2B,D).

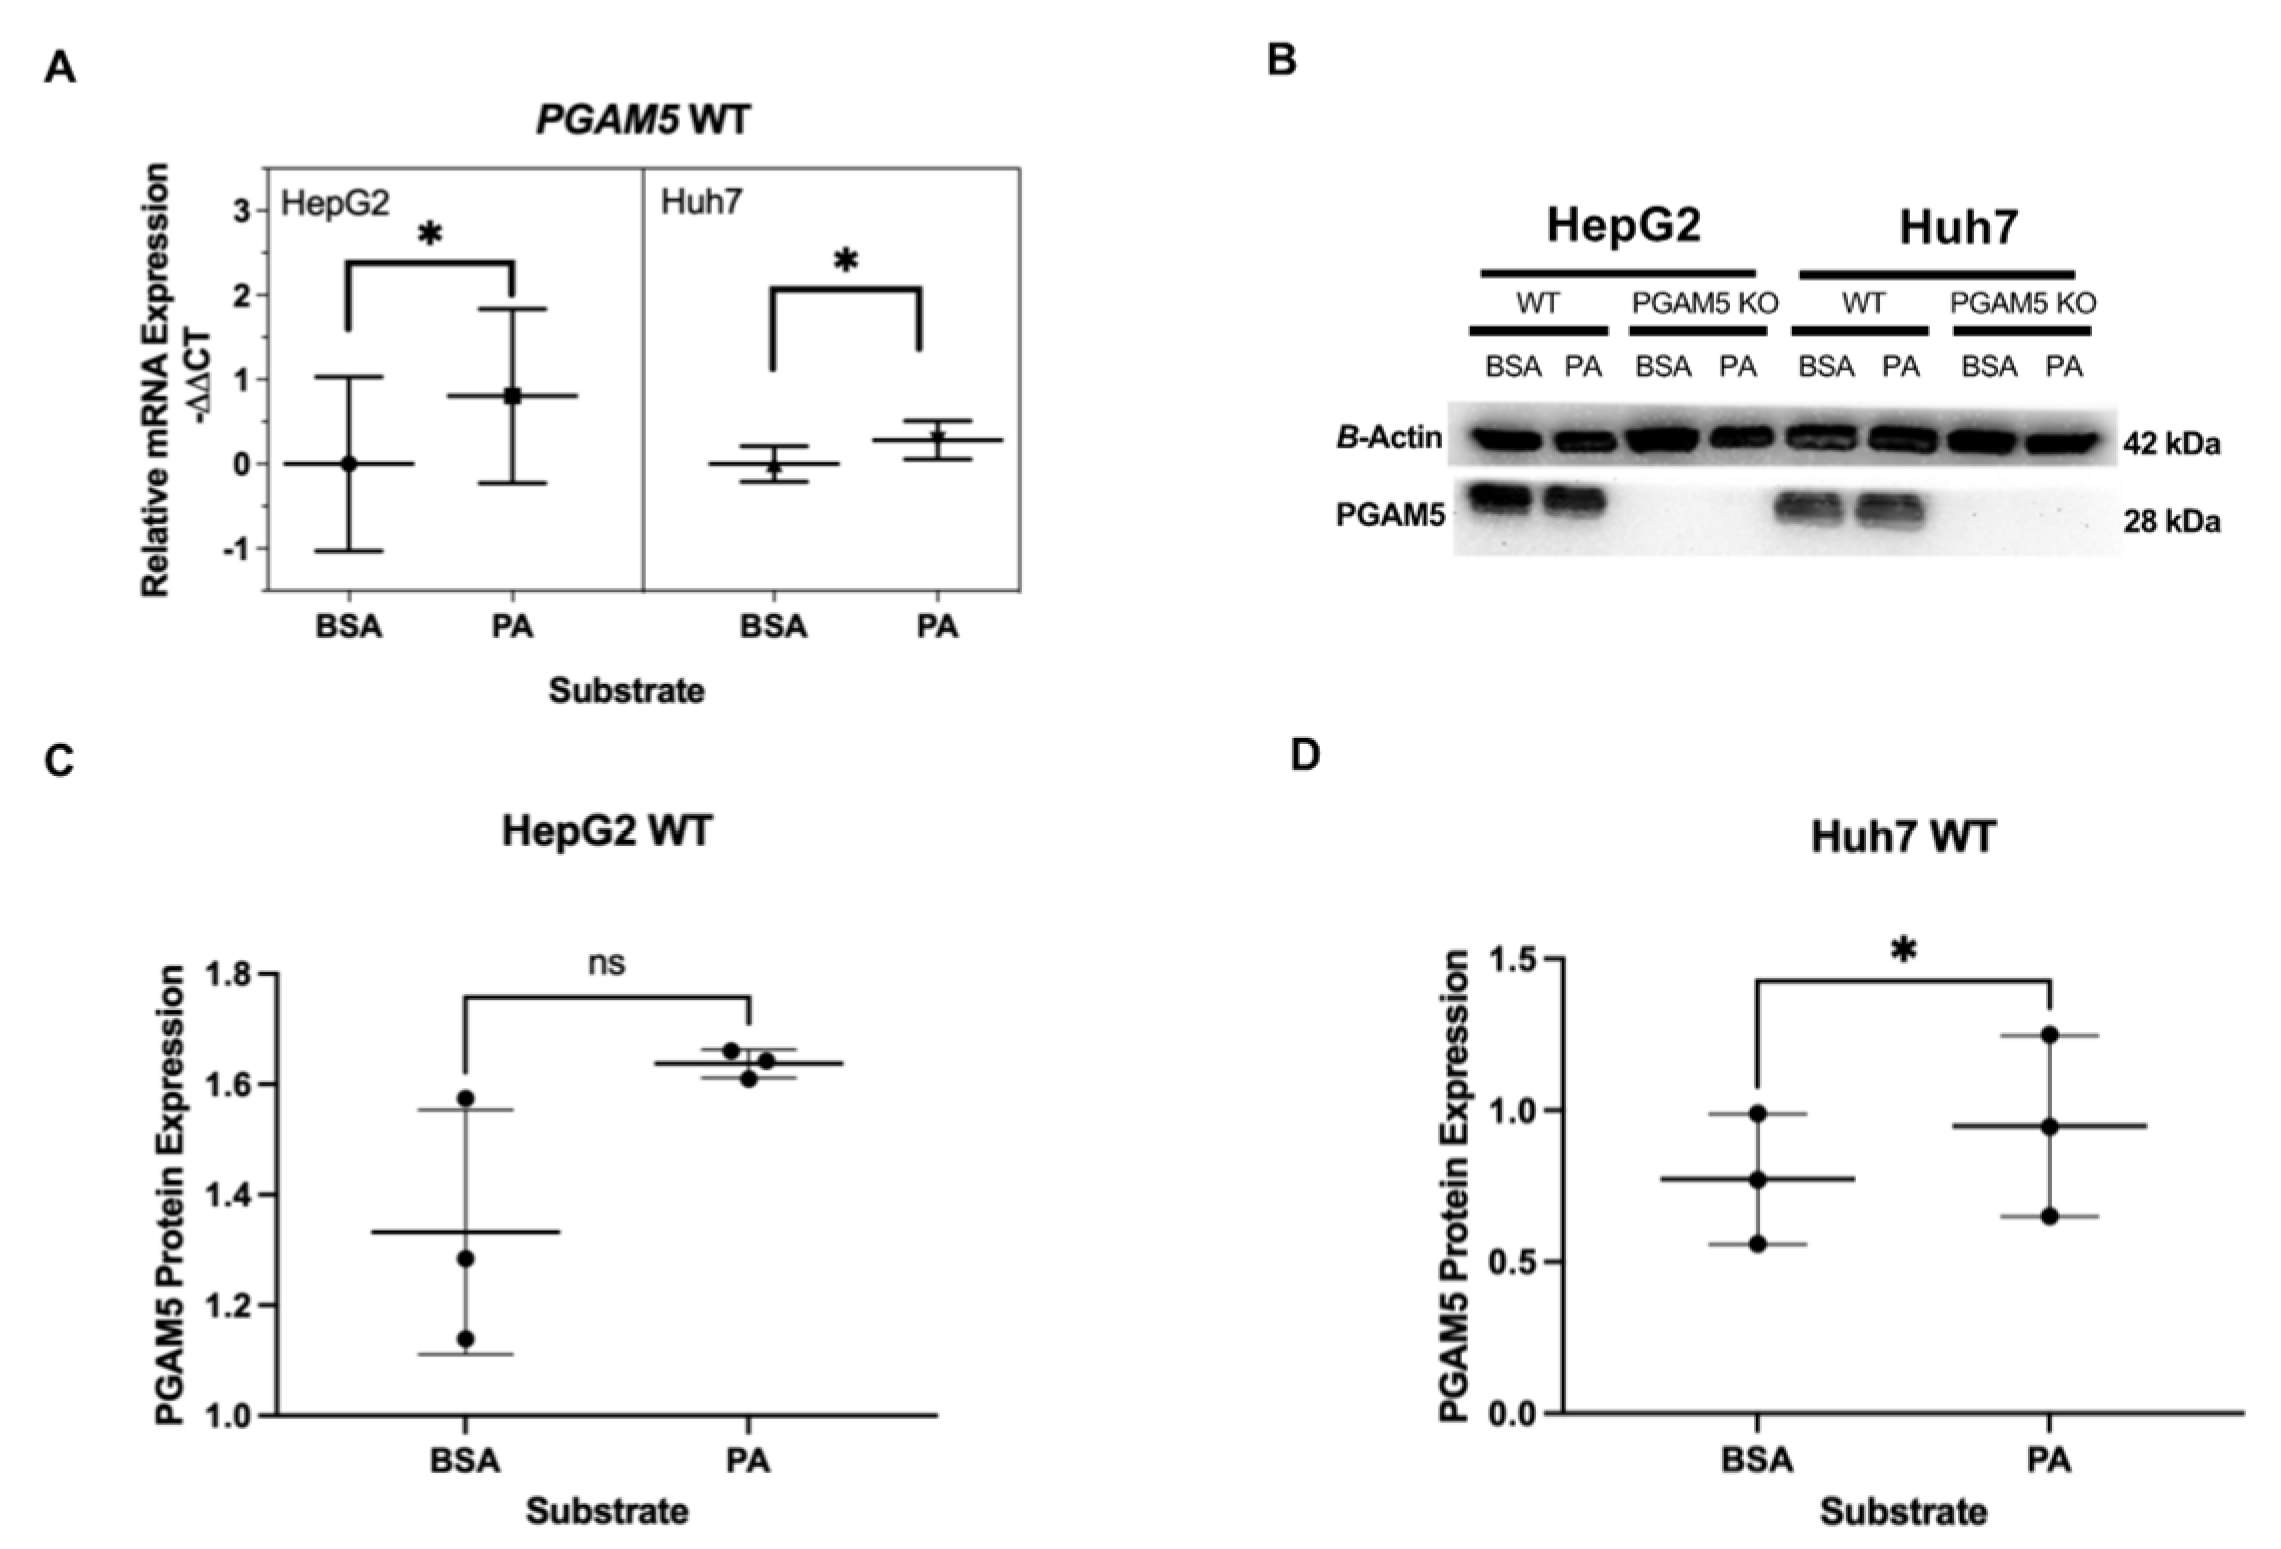
3.3. Long-Chain Fatty Acid Treatment Upregulates PGAM5 mRNA Expression

To determine if long-chain fatty acids influence PGAM5 expression, HepG2 and Huh7 cells cultured under standard conditions were treated overnight with palmitate or bovine serum albumin (BSA) as a control. Cells were harvested and mRNA and protein were extracted. Messenger RNA and protein expression were quantified with qPCR and Western blot, respectively. PGAM5 mRNA expression was upregulated in WT HepG2 and WT Huh7 cell lines following palmitate treatment (Figure 3A). A minimal but statistically significant upregulation in PGAM5 protein expression was identified in Huh7 cells but the difference in expression was not statitically significant in HepG2 cells following palmitate treatment (Figure 3B–D, Supplementary Figures S1–S3).

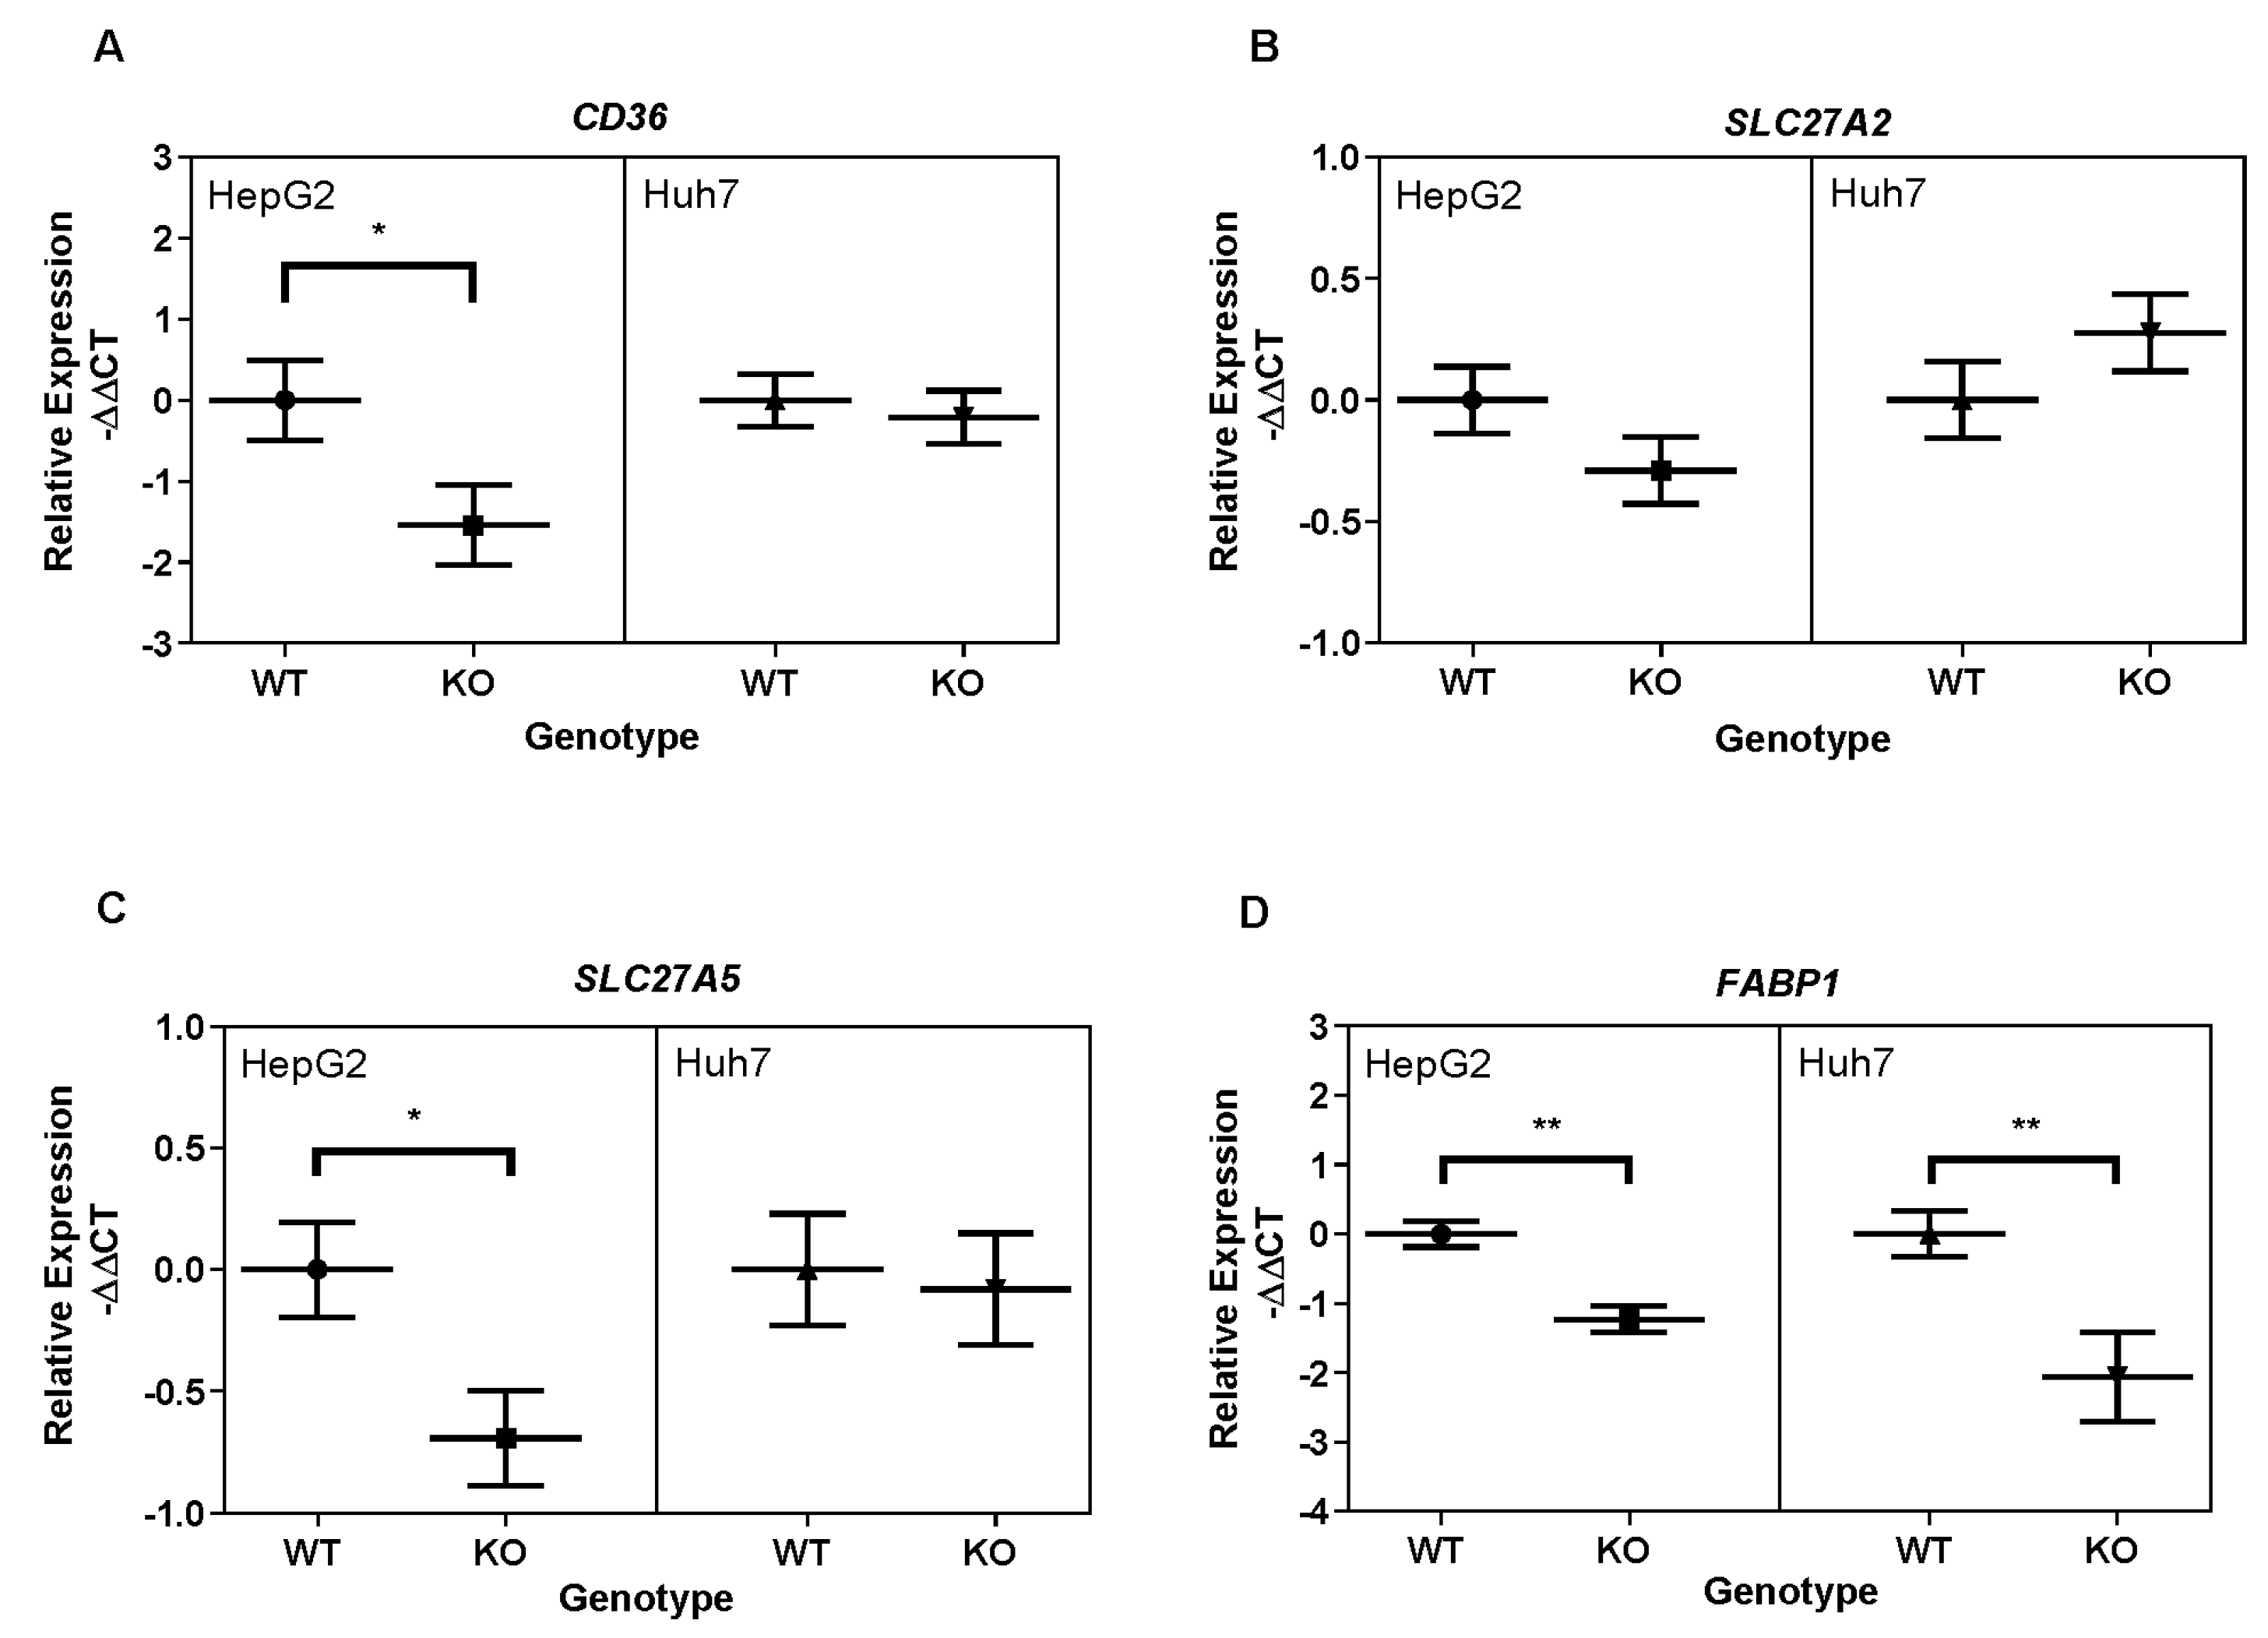
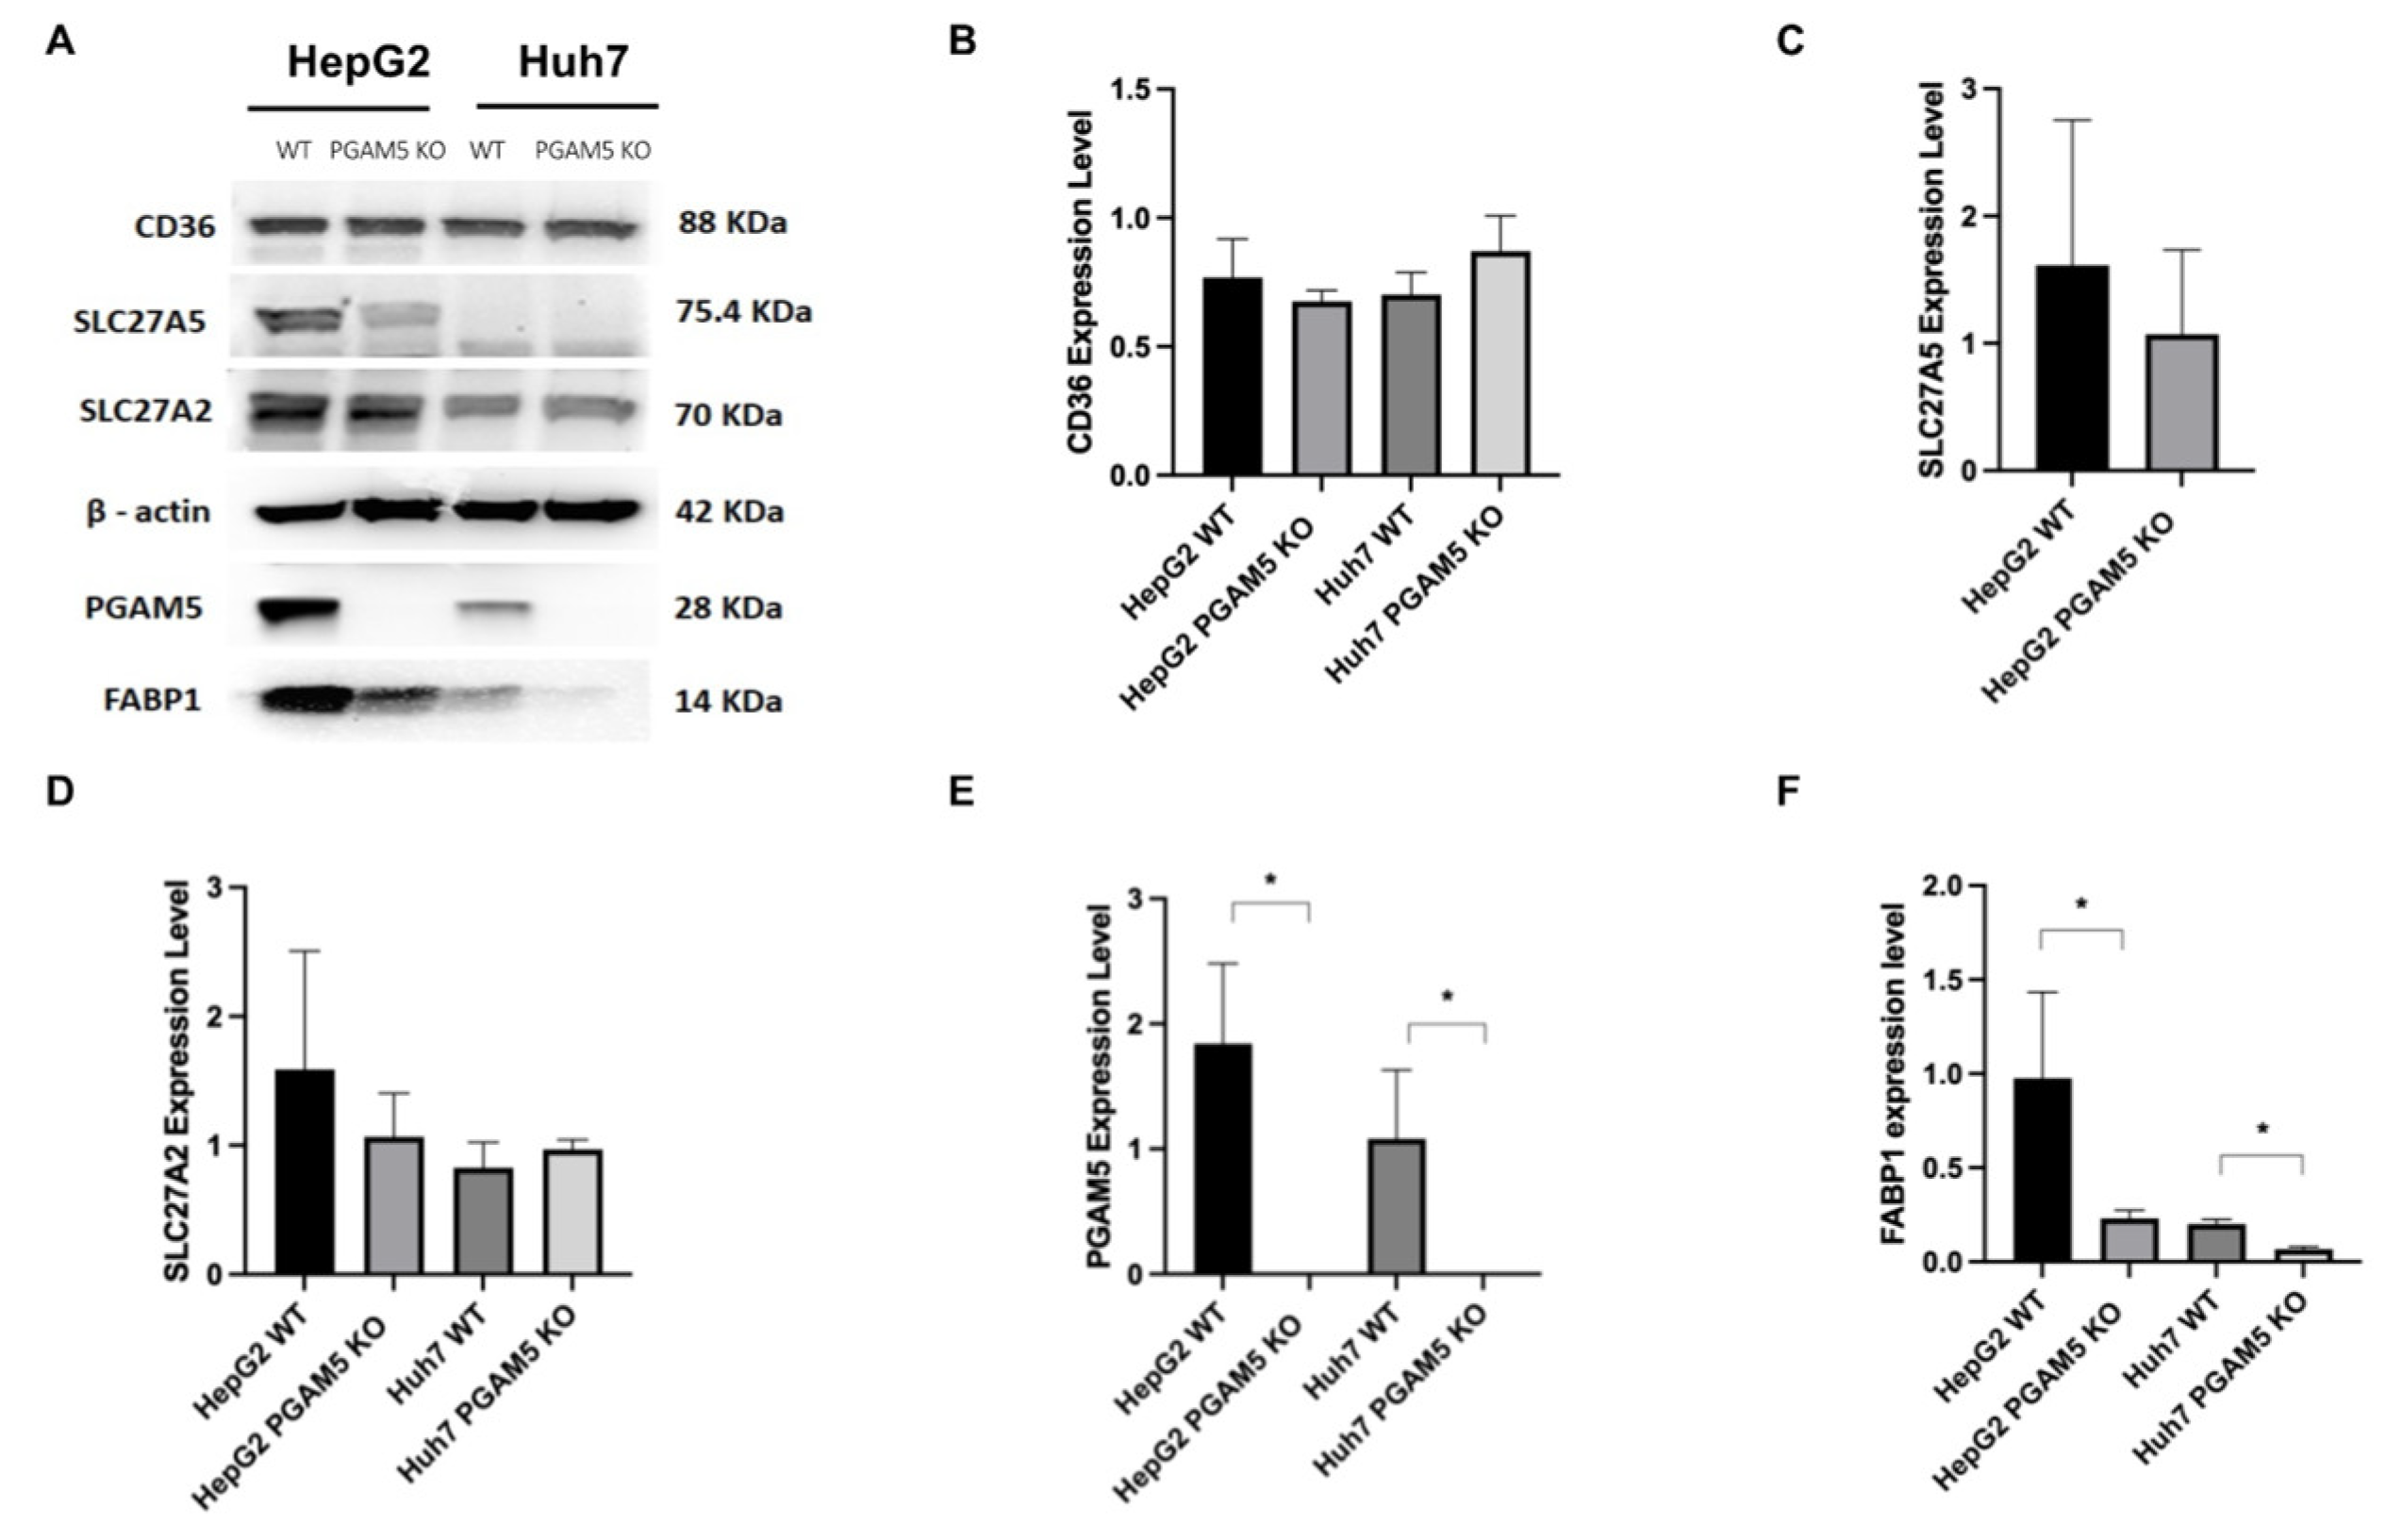
3.4. Hepatocellular Fatty Acid Transporter Expression Is Downregulated with PGAM5 Knockout

Next, we investigated the effects of PGAM5 knockout on mRNA expression of the liver fatty acid transporter proteins FABP1 in the fatty acid transport family, and SLC27A2, SLC27A5, and CD36 in the solute carrier family (Figure 4A–D). Messenger RNA and protein expression were quantified with qPCR and Western blot, respectively. In HepG2 PGAM5 knockout cells, gene expression of CD36, SLC27A5, and FABP1 was significantly downregulated compared to wildtype cells, whereas in Huh7 cells, only FABP1 gene expression was significantly downregulated (Figure 4A,C,D; Supplementary Tables S2 and S3).
CD36, SLC27A5, and SLC27A2 protein expression were not significantly different between groups (Figure 5A–D; Supplementary Figures S4–S10). FABP1 protein expression was significantly reduced in both HepG2 and Huh7 PGAM5 knockout cells (Figure 5A,F; Supplementary Figures S4–S6).

4. Discussion

Manipulation of lipid metabolism is a cancer survival mechanism. Enhanced systemic fatty acid accumulation imparts a protective effect, insulating the cancer cell from oxidant damage to lipid bilayers and providing an alternate source of ATP under nutrient-depleted conditions [22,23,25,26]. In this study, we revealed that PGAM5 knockout ameliorates lipid droplet accumulation in the HepG2 and Huh7 cell lines. PGAM5 is a member of the phosphoglycerate mutase (PGAM) superfamily. PGAM family members share a conserved PGAM domain, which catalyzes transfer of phospho groups on phosphoglycerates [27]. Phosphoglycerate mutase 1, 2, and 4 (PGAM1, PGAM2, PGAM4) catalyze conversion of 3-phosphoglycerate to 2-phosphoglcerate in the glycolytic pathway [28]. Additional PGAM family members, the 6-phosphofructo-2-kinase/fructose-2,6-biphosphatases (PFKFB), also play roles in the regulation of glucose metabolism [29]. Although PGAM5 shares the RHGE catalytic motif, PGAM5 does not have phosphotransferase or hydrolase activity [30].
We have identified that the fatty acid transporter FABP1 is downregulated secondary to PGAM5 knockout. This is the first time that PGAM5 expression has been correlated to exogenous fatty acid import in hepatocellular carcinoma. FABP1, also known as Liver-FABP (L-FABP), mediates uptake, intracellular mobilization, and metabolism of long-chain fatty acids [31,32]. FABP1 deletion inhibits fatty acid uptake and alters its distribution in cultured primary hepatocytes and murine models [33,34,35,36]. FABP1 is located predominantly in the cytosol but to a lesser extent is present in the nucleus and on the mitochondrial outer membrane [37]. Aside from long-chain fatty acids, FABP1 binds a host of other ligands including acyl-CoAs, bile acids, bilirubin, endocannabinoids, and heme [32,38,39]. As a mediator of intracellular trafficking of free fatty acids, FABP1 limits the detergent effects of these moieties [40]. Fatty acid binding proteins can also directly scavenge free radicals and limit lipotoxicity [41,42]. PGAM5′s influence of fatty acid transport complements its regulation of mitophagy, which is critical to maintaining mitochondrial homeostasis in the oxidative intracellular environment [4,7,12,21].
Overexpression of FABP1 is identified in colorectal adenocarcinomas, cholangiocarcinomas, and HCC [43]. In HCC, FABP1 promotes angiogenesis and migration mediated by vascular endothelial growth factor A (VEGF-A) [44]. VEGF-A is induced through the Akt/mTOR/P70S6K pathway in a hypoxia inducible factor 1 α (HIF-1α)-dependent manner. Further, in WT HepG2 and Huh7 cells, PGAM5 mRNA expression is upregulated following treatment with the long-chain fatty acid, palmitate; however, only Huh7 cells demonstrate a significant increase in PGAM5 protein levels. Additional experiments are needed to determine if PGAM5 expression level or phosphatase activity is relevant to PGAM5’s role in tumoral fatty acid metabolism specifically in metabolic disease associated HCC. Based on the results presented herein, the mechanism by which PGAM5 influences FABP1 expression may involve transcriptional regulation. Transcriptional regulation of FABP1 is complex, involving CCAAT enhancer binding protein α (C/EBPα) repression and forkhead box protein A1 (FOXA1)/peroxisome proliferator-activated α (PPARα) activation [45]. It is tempting to consider whether genetic manipulation of PGAM5 could be used therapeutically in HCC [6,46]. Yet, many questions need to be answered before undertaking this endeavor in the clinical setting [47]. First, it remains to be determined how loss of PGAM5 interferes with FABP1 expression and how the PGAM5 and FABP1 pathways converge to impart a pro-cancer survival benefit in HCC. This work did not specifically assess whether PGAM5 knockout represses transcription of FABP1. Future experiments using chemical inhibition of transcription are required to test this hypothesis. Additionally, animal modeling is required to determine if the metabolic changes associated with PGAM5 knockout observed in cell culture persist in vivo.

5. Conclusions

Our data suggest that PGAM5’s role in hepatocellular carcinoma includes regulation of fatty acid metabolism, which may be implemented through expression of the fatty acid transporter, FABP1.

Supplementary Materials

The following supporting information can be downloaded at: https://www.mdpi.com/article/10.3390/cancers15194796/s1, Figure S1: PGAM5 and actin expression in HepG2 and Huh7 cells. Figure S2: PGAM5 and actin expression in HepG2 and Huh7 cells. Figure S3: PGAM5 and actin expression in HepG2 and Huh7 cells. Figure S4: CD36, PGAM5, actin, and FABP1 expression in HepG2 and Huh7 cells; Figure S5: CD36, SLC27A2, PGAM5, actin, and FABP1 expression in HepG2 and Huh7 cells; Figure S6: Actin, SLC27A2, and FABP1 expression in HepG2 and Huh7 cells; Figure S7: SLC27A5 and actin expression in HepG2 and Huh7 cells; Figure S8: SLC27A5 and actin expression in HepG2 and Huh7 cells; Figure S9: SLC27A5 and actin expression in HepG2 and Huh7 cells; Figure S10: CD36 and actin expression in HepG2 and Huh7 cells; Table S1: Quantitative PCR primers; Table S2: Individual qPCR data points corresponding to Figure 3; Table S3: Individual qPCR data points corresponding to Figure 3.

Author Contributions

Conceptualization: A.N.J.; Data curation: A.N.J. and G.M.; Formal analysis: C.-C.L.; Investigation: A.N.J. and G.M.; Methodology: A.N.J. and G.M.; Project administration: A.N.J.; Software: C.-C.L.; Supervision: A.N.J.; Validation: C.-C.L. and A.N.J.; Visualization: C.-C.L., A.N.J. and G.M.; Writing—original draft: A.N.J.; Writing—review and editing: C.-C.L., A.N.J. and G.M. All authors have read and agreed to the published version of the manuscript.

Funding

Research reported in this publication was supported by the National Institutes of Health under Award Number 1P20GM135000-01A1. The content is solely the responsibility of the authors and does not necessarily represent the official views of the National Institutes of Health.

Institutional Review Board Statement

Not applicable.

Informed Consent Statement

Not applicable.

Data Availability Statement

All data generated or analyzed during this study are included within the article.

Conflicts of Interest

The authors declare no conflict of interest.

References

  1. Bray, F.; Ferlay, J.; Soerjomataram, I.; Siegel, R.L.; Torre, L.A.; Jemal, A. Global cancer statistics 2018: GLOBOCAN estimates of incidence and mortality worldwide for 36 cancers in 185 countries. CA Cancer J. Clin. 2018, 68, 394–424. [Google Scholar] [CrossRef] [PubMed]
  2. Ferlay, J.; Colombet, M.; Soerjomataram, I.; Mathers, C.; Parkin, D.M.; Piñeros, M.; Znaor, A.; Bray, F. Estimating the global cancer incidence and mortality in 2018: GLOBOCAN sources and methods. Int. J. Cancer 2019, 144, 1941–1953. [Google Scholar] [CrossRef] [PubMed]
  3. Peng, J.; Wang, T.; Yue, C.; Luo, X.; Xiao, P. PGAM5: A necroptosis gene associated with poor tumor prognosis that promotes cutaneous melanoma progression. Front. Oncol. 2022, 12, 1004511. [Google Scholar] [CrossRef] [PubMed]
  4. Liu, C.; Wu, Z.; Wang, L.; Yang, Q.; Huang, J.; Huang, J. A Mitophagy-Related Gene Signature for Subtype Identification and Prognosis Prediction of Hepatocellular Carcinoma. Int. J. Mol. Sci. 2022, 23, 12123. [Google Scholar] [CrossRef] [PubMed]
  5. Zhu, Y.; Gu, L.; Lin, X.; Liu, C.; Lu, B.; Cui, K.; Zhou, F.; Zhao, Q.; Prochownik, E.V.; Fan, C.; et al. Dynamic Regulation of ME1 Phosphorylation and Acetylation Affects Lipid Metabolism and Colorectal Tumorigenesis. Mol. Cell 2020, 77, 138–149. [Google Scholar] [CrossRef]
  6. Cheng, J.; Qian, D.; Ding, X.; Song, T.; Cai, M.; Xie, D.; Wang, Y.; Zhao, J.; Liu, Z.; Wu, Z.; et al. High PGAM5 expression induces chemoresistance by enhancing Bcl-xL-mediated anti-apoptotic signaling and predicts poor prognosis in hepatocellular carcinoma patients. Cell Death Dis. 2018, 9, 991. [Google Scholar] [CrossRef]
  7. Liang, S.; Zhu, C.; Suo, C.; Wei, H.; Yu, Y.; Gu, X.; Chen, L.; Yuan, M.; Shen, S.; Li, S.; et al. Mitochondrion-Localized SND1 Promotes Mitophagy and Liver Cancer Progression through PGAM5. Front. Oncol. 2022, 12, 857968. [Google Scholar] [CrossRef]
  8. Meng, L.; Hu, P.; Xu, A. PGAM5 promotes tumorigenesis of gastric cancer cells through PI3K/AKT pathway. Pathol. Res. Pract. 2023, 244, 154405. [Google Scholar] [CrossRef]
  9. Okuno, H.; Okuzono, H.; Hayase, A.; Kumagai, F.; Tanii, S.; Hino, N.; Okada, Y.; Tachibana, K.; Doi, T.; Ishimoto, K. Lipin-1 is a novel substrate of protein phosphatase PGAM5. Biochem. Biophys. Res. Commun. 2019, 509, 886–891. [Google Scholar] [CrossRef]
  10. Zhang, S.L.; Tang, H.B.; Hu, J.T.; Zang, Z.L.; Ding, X.; Li, S.; Yang, H. PGAM5-CypD pathway is involved in bromocriptine-induced RIP3/MLKL-dependent necroptosis of prolactinoma cells. Biomed. Pharmacother. 2019, 111, 638–648. [Google Scholar] [CrossRef]
  11. Wang, Y.-S.; Yu, P.; Wang, Y.; Zhang, J.; Hang, W.; Yin, Z.-X.; Liu, G.; Chen, J.; Werle, K.D.; Quan, C.-S.; et al. AMP-activated protein kinase protects against necroptosis via regulation of Keap1-PGAM5 complex. Int. J. Cardiol. 2018, 259, 153–162. [Google Scholar] [CrossRef] [PubMed]
  12. Cheng, M.; Lin, N.; Dong, D.; Ma, J.; Su, J.; Sun, L. PGAM5: A crucial role in mitochondrial dynamics and programmed cell death. Eur. J. Cell Biol. 2020, 100, 151144. [Google Scholar] [CrossRef] [PubMed]
  13. Ma, K.; Chen, G.; Li, W.; Kepp, O.; Zhu, Y.; Chen, Q. Mitophagy, Mitochondrial Homeostasis, and Cell Fate. Front. Cell Dev. Biol. 2020, 8, 467. [Google Scholar] [CrossRef] [PubMed]
  14. Xue, C.; Gu, X.; Li, G.; Bao, Z.; Li, L. Mitochondrial Mechanisms of Necroptosis in Liver Diseases. Int. J. Mol. Sci. 2020, 22, 66. [Google Scholar] [CrossRef]
  15. Yao, R.-Q.; Ren, C.; Xia, Z.-F.; Yao, Y.-M. Organelle-specific autophagy in inflammatory diseases: A potential therapeutic target underlying the quality control of multiple organelles. Autophagy 2020, 17, 385–401. [Google Scholar] [CrossRef]
  16. Zhang, J.; Chen, M.; Liu, X.; Ren, Y.; Liu, G.; Qin, S. Research progress of phosphoglycerate mutase 5-mediated mitophagy and necroptosis. Zhonghua Wei Zhong Bing Ji Jiu Yi Xue 2022, 34, 890–896. [Google Scholar] [CrossRef]
  17. Scaturro, P.; Pichlmair, A. Oxeiptosis: A discreet way to respond to radicals. Curr. Opin. Immunol. 2018, 56, 37–43. [Google Scholar] [CrossRef]
  18. Tang, D.; Kang, R.; Berghe, T.V.; Vandenabeele, P.; Kroemer, G. The molecular machinery of regulated cell death. Cell Res. 2019, 29, 347–364. [Google Scholar] [CrossRef]
  19. Holze, C.; Michaudel, C.; Mackowiak, C.; Haas, D.A.; Benda, C.; Hubel, P.; Pennemann, F.L.; Schnepf, D.; Wettmarshausen, J.; Braun, M.; et al. Oxeiptosis, a ROS-induced caspase-independent apoptosis-like cell-death pathway. Nat. Immunol. 2017, 19, 130–140. [Google Scholar] [CrossRef]
  20. Kang, Y.J.; Bang, B.-R.; Han, K.H.; Hong, L.; Shim, E.-J.; Ma, J.; Lerner, R.A.; Otsuka, M. Regulation of NKT cell-mediated immune responses to tumours and liver inflammation by mitochondrial PGAM5-Drp1 signalling. Nat. Commun. 2015, 6, 8371. [Google Scholar] [CrossRef]
  21. Ma, K.; Zhang, Z.; Chang, R.; Cheng, H.; Mu, C.; Zhao, T.; Chen, L.; Zhang, C.; Luo, Q.; Lin, J.; et al. Dynamic PGAM5 multimers dephosphorylate BCL-xL or FUNDC1 to regulate mitochondrial and cellular fate. Cell Death Differ. 2020, 27, 1036–1051. [Google Scholar] [CrossRef] [PubMed]
  22. Augustine, D.; Khan, W.; Rao, R.S.; Patil, S.; Awan, K.H.; Sowmya, S.V.; Haragannavar, V.C.; Prasad, K. Lipid metabolism in cancer: A systematic review. J. Carcinog. 2021, 20, 4. [Google Scholar] [CrossRef]
  23. Snaebjornsson, M.T.; Janaki-Raman, S.; Schulze, A. Greasing the Wheels of the Cancer Machine: The Role of Lipid Metabolism in Cancer. Cell Metab. 2020, 31, 62–76. [Google Scholar] [CrossRef]
  24. Su, X.; Abumrad, N.A. Cellular fatty acid uptake: A pathway under construction. Trends Endocrinol. Metab. 2009, 20, 72–77. [Google Scholar] [CrossRef] [PubMed]
  25. Koundouros, N.; Poulogiannis, G. Reprogramming of fatty acid metabolism in cancer. Br. J. Cancer 2019, 122, 4–22. [Google Scholar] [CrossRef] [PubMed]
  26. Lengyel, E.; Makowski, L.; DiGiovanni, J.; Kolonin, M.G. Cancer as a Matter of Fat: The Crosstalk between Adipose Tissue and Tumors. Trends Cancer 2018, 4, 374–384. [Google Scholar] [CrossRef] [PubMed]
  27. Sadatomi, D.; Tanimura, S.; Ozaki, K.-I.; Takeda, K. Atypical Protein Phosphatases: Emerging Players in Cellular Signaling. Int. J. Mol. Sci. 2013, 14, 4596–4612. [Google Scholar] [CrossRef] [PubMed]
  28. Hitosugi, T.; Zhou, L.; Elf, S.; Fan, J.; Kang, H.-B.; Seo, J.H.; Shan, C.; Dai, Q.; Zhang, L.; Xie, J.; et al. Phosphoglycerate Mutase 1 Coordinates Glycolysis and Biosynthesis to Promote Tumor Growth. Cancer Cell 2012, 22, 585–600. [Google Scholar] [CrossRef] [PubMed]
  29. Yi, M.; Ban, Y.; Tan, Y.; Xiong, W.; Li, G.; Xiang, B. 6-Phosphofructo-2-kinase/fructose-2,6-biphosphatase 3 and 4: A pair of valves for fine-tuning of glucose metabolism in human cancer. Mol. Metab. 2018, 20, 1–13. [Google Scholar] [CrossRef]
  30. Chaikuad, A.; Filippakopoulos, P.; Marcsisin, S.R.; Picaud, S.; Schröder, M.; Sekine, S.; Ichijo, H.; Engen, J.R.; Takeda, K.; Knapp, S. Structures of PGAM5 Provide Insight into Active Site Plasticity and Multimeric Assembly. Structure 2017, 25, 1089–1099.e3. [Google Scholar] [CrossRef]
  31. Storch, J.; Corsico, B. The Emerging Functions and Mechanisms of Mammalian Fatty Acid–Binding Proteins. Annu. Rev. Nutr. 2008, 28, 73–95. [Google Scholar] [CrossRef] [PubMed]
  32. Coe, N.R.; Bernlohr, D.A. Physiological properties and functions of intracellular fatty acid-binding proteins. Biochim. Biophys. Acta (BBA) Lipids Lipid Metab. 1998, 1391, 287–306. [Google Scholar] [CrossRef]
  33. Martin, G.G.; Danneberg, H.; Kumar, L.S.; Atshaves, B.P.; Erol, E.; Bader, M.; Schroeder, F.; Binas, B. Decreased Liver Fatty Acid Binding Capacity and Altered Liver Lipid Distribution in Mice Lacking the Liver Fatty Acid-binding Protein Gene. J. Biol. Chem. 2003, 278, 21429–21438. [Google Scholar] [CrossRef] [PubMed]
  34. Weisiger, R.A. Cytosolic fatty acid binding proteins catalyze two distinct steps in intracellular transport of their ligands. Mol. Cell Biochem. 2002, 239, 35–43. [Google Scholar] [CrossRef]
  35. Atshaves, B.P.; Storey, S.M.; Huang, H.; Schroeder, F. Liver fatty acid binding protein expression enhances branched-chain fatty acid metabolism. Mol. Cell Biochem. 2004, 259, 115–129. [Google Scholar] [CrossRef]
  36. Mukai, T.; Egawa, M.; Takeuchi, T.; Yamashita, H.; Kusudo, T. Silencing of FABP1 ameliorates hepatic steatosis, inflammation, and oxidative stress in mice with nonalcoholic fatty liver disease. FEBS Open Bio 2017, 7, 1009–1016. [Google Scholar] [CrossRef]
  37. Bordewick, U.; Heese, M.; Börchers, T.; Robenek, H.; Spener, F. Compartmentation of Hepatic Fatty-Acid-Binding Protein in Liver Cells and Its Effect on Microsomal Phosphatidic Acid Biosynthesis. Biol. Chem. Hoppe-Seyler 1989, 370, 229–238. [Google Scholar] [CrossRef]
  38. Wang, G.; Bonkovsky, H.L.; de Lemos, A.; Burczynski, F.J. Recent insights into the biological functions of liver fatty acid binding protein 1. J. Lipid Res. 2015, 56, 2238–2247. [Google Scholar] [CrossRef]
  39. Storch, J.; McDermott, L. Structural and functional analysis of fatty acid-binding proteins. J. Lipid Res. 2009, 50, S126–S131. [Google Scholar] [CrossRef]
  40. Atshaves, B.P.; Storey, S.M.; Petrescu, A.; Greenberg, C.C.; Lyuksyutova, O.I.; Smith, R., 3rd; Schroeder, F. Expression of fatty acid binding proteins inhibits lipid accumulation and alters toxicity in L cell fibroblasts. Am. J. Physiol. Cell Physiol. 2002, 283, C688–C703. [Google Scholar] [CrossRef]
  41. Ek, B.A.; Cistola, D.P.; Hamilton, J.A.; Kaduce, T.L.; Spector, A.A. Fatty acid binding proteins reduce 15-lipoxygenase-induced oxygenation of linoleic acid and arachidonic acid. Biochim. Biophys. Acta (BBA) Lipids Lipid Metab. 1997, 1346, 75–85. [Google Scholar] [CrossRef]
  42. Raza, H.; Pongubala, J.R.; Sorof, S. Specific high affinity binding of lipoxygenase metabolites of arachidonic acid by liver fatty acid binding protein. Biochem. Biophys. Res. Commun. 1989, 161, 448–455. [Google Scholar] [CrossRef] [PubMed]
  43. Dum, D.; Ocokoljic, A.; Lennartz, M.; Hube-Magg, C.; Reiswich, V.; Höflmayer, D.; Jacobsen, F.; Bernreuther, C.; Lebok, P.; Sauter, G.; et al. FABP1 expression in human tumors: A tissue microarray study on 17,071 tumors. Virchows Arch. 2022, 481, 945–961. [Google Scholar] [CrossRef] [PubMed]
  44. Ku, C.-Y.; Liu, Y.-H.; Lin, H.-Y.; Lu, S.-C.; Lin, J.-Y. Liver fatty acid-binding protein (L-FABP) promotes cellular angiogenesis and migration in hepatocellular carcinoma. Oncotarget 2016, 7, 18229–18246. [Google Scholar] [CrossRef] [PubMed]
  45. Guzmán, C.; Benet, M.; Pisonero-Vaquero, S.; Moya, M.; García-Mediavilla, M.V.; Martínez-Chantar, M.L.; González-Gallego, J.; Castell, J.V.; Sánchez-Campos, S.; Jover, R. The human liver fatty acid binding protein (FABP1) gene is activated by FOXA1 and PPARalpha; and repressed by C/EBPalpha: Implications in FABP1 down-regulation in nonalcoholic fatty liver disease. Biochim. Biophys. Acta 2013, 1831, 803–818. [Google Scholar] [CrossRef] [PubMed]
  46. Martinez-Lage, M.; Torres-Ruiz, R.; Puig-Serra, P.; Moreno-Gaona, P.; Martin, M.C.; Moya, F.J.; Quintana-Bustamante, O.; Garcia-Silva, S.; Carcaboso, A.M.; Petazzi, P.; et al. In vivo CRISPR/Cas9 targeting of fusion oncogenes for selective elimination of cancer cells. Nat. Commun. 2020, 11, 5060. [Google Scholar] [CrossRef]
  47. Tang, W.; Liu, J.; Ding, B. Nucleic acid nanostructure for delivery of CRISPR/Cas9-based gene editing system. Interdiscip. Med. 2023, 1, e20220014. [Google Scholar] [CrossRef]
Figure 1. ATP production and cell growth are attenuated with ablation of PGAM5. (A) Huh7 wild type (WT) and PGAM5 knockout cells (KO) cells (1 × 10⁵) were cultured under standard conditions. ATP concentration was measured at 24 h, 48 h, and 72 h. Values were normalized to the 24 h measurement. The mean values and SEMs (n = 3 experiments, 8 replicates per experiment) are indicated. (B) HepG2 WT and PGAM5 KO cells (1 × 10⁵) were cultured under standard conditions. ATP concentration was measured at 24 h, 48 h, and 72 h. Values were normalized to the 24 h measurement. The mean values and SEMs (n = 3 experiments, 8 replicates per experiment) are displayed. (C) Huh7 WT and PGAM5 KO cells (1 × 10⁵) were cultured under standard conditions. Bright field cell area was quantified at 24 h, 48 h, and 72 h. Values were normalized to the 24 h measurement. The mean values and SEMs (n = 3 experiments, 8 replicates per experiment) are indicated. (D) HepG2 WT and PGAM5 KO cells (1 × 10⁵) were cultured under standard conditions. Bright field cell area was quantified at 24 h, 48 h, and 72 h. Values were normalized to the 24 h measurement. The mean values and SEMs (n = 3 experiments, 8 replicates per experiment) are indicated, * p < 0.05.
Cancers 15 04796 g001
Figure 2. Effect of PGAM5 deletion on long-chain fatty acid uptake. (A) Huh7 wild type (WT) and PGAM5 knockout cells (KO) cells (5 × 10⁵) were cultured under standard conditions for 24 h. Cells were treated with bovine serum albumin (BSA) or palmitate (PA) for 16 h under nutrient-depleted conditions. Representative images of ORO-stained (red) cells validating equal cell density. Bars in the images represent 200 μm. (B) Fatty acid uptake was quantified spectrophotometrically by Oil Red O (ORO) Absorbance (Abs) at 492 nm in Huh7 cells. The mean values and SEMs (n = 3 experiments with a minimum of 2 replicates) are indicated. (C) HepG2 WT and PGAM5 KO cells (5 × 10⁵) were cultured under standard conditions for 24 h. Cells were treated with BSA or PA for 16 h under nutrient depleted conditions. Representative images of ORO-stained (red) cells validating equal cell density. (D) Fatty acid uptake was quantified spectrophotometrically following ORO staining in HepG2 cells. The mean values and SEMs (n = 3 experiments with a minimum of 2 replicates) are indicated, * p < 0.05.
Cancers 15 04796 g002
Figure 3. Effect of long-chain fatty acid treatment on PGAM5 expression. (A) Messenger RNA expression in HepG2 wild type (WT) and Huh7 WT cells treated with bovine serum albumin (BSA) or palmitate (PA) was determined by real-time qPCR. The mean normalized −ΔΔCt values and CI (n = 3 experiments with 2 replicates per experiment) are displayed for PGAM5. (B) Protein expression in HepG2 WT, HepG2 PGAM5 KO, Huh7 WT, and Huh7 PGAM5 KO cells treated with BSA or PA was determined by Western blot (n = 3 experiments). Representative immunoblots of PGAM5 and ß-actin are displayed. Protein expression was quantified by densitometry for (C) HepG2 and (D) Huh7 cells. The mean protein expression and SDs are displayed (bars) with individual experimental values as dots, * p < 0.05.
Cancers 15 04796 g003
Figure 4. Effect of PGAM5 deletion on hepatocellular fatty acid transporter gene expression. Messenger RNA expression in HepG2 wild type (WT, dots), HepG2 PGAM5 knockout (KO, squares), Huh7 WT (triangle), and Huh7 PGAM5 KO (inverted triangle) cells was determined by real-time PCR. The mean normalized −ΔΔCt values and CIs (n = 3 experiments with 2 replicates per experiment) are displayed for (A) CD36, (B) SLC27A2, (C) SLC27A5, and (D) FABP1. * p < 0.05, ** p < 0.01.
Cancers 15 04796 g004
Figure 5. Effect of PGAM5 deletion on hepatocellular fatty acid transporter protein expression. (A) Fatty acid transporter protein expression in HepG2 WT, HepG2 PGAM5 KO, Huh7 WT, and Huh7 PGAM5 KO cells was determined by Western blot (n = 3 experiments). Representative immunoblots of CD36, SLC27A5, SLC27A2, ß-actin, PGAM5, and FABP1 are displayed. (B) Protein expression was quantified by densitometry (ImageJ). Mean relative values ± SDs normalized to ß-actin are indicated for CD36, (C) SLC27A5, (D) SLC27A2, (E) PGAM5, and (F) FABP1, * p < 0.05.
Cancers 15 04796 g005
Disclaimer/Publisher’s Note: The statements, opinions and data contained in all publications are solely those of the individual author(s) and contributor(s) and not of MDPI and/or the editor(s). MDPI and/or the editor(s) disclaim responsibility for any injury to people or property resulting from any ideas, methods, instructions or products referred to in the content.

