


MRI Radiomics-Based Machine Learning Models for Ki67 Expression and Gleason Grade Group Prediction in Prostate Cancer

 ,
,
Abstract
:Simple Summary
Abstract
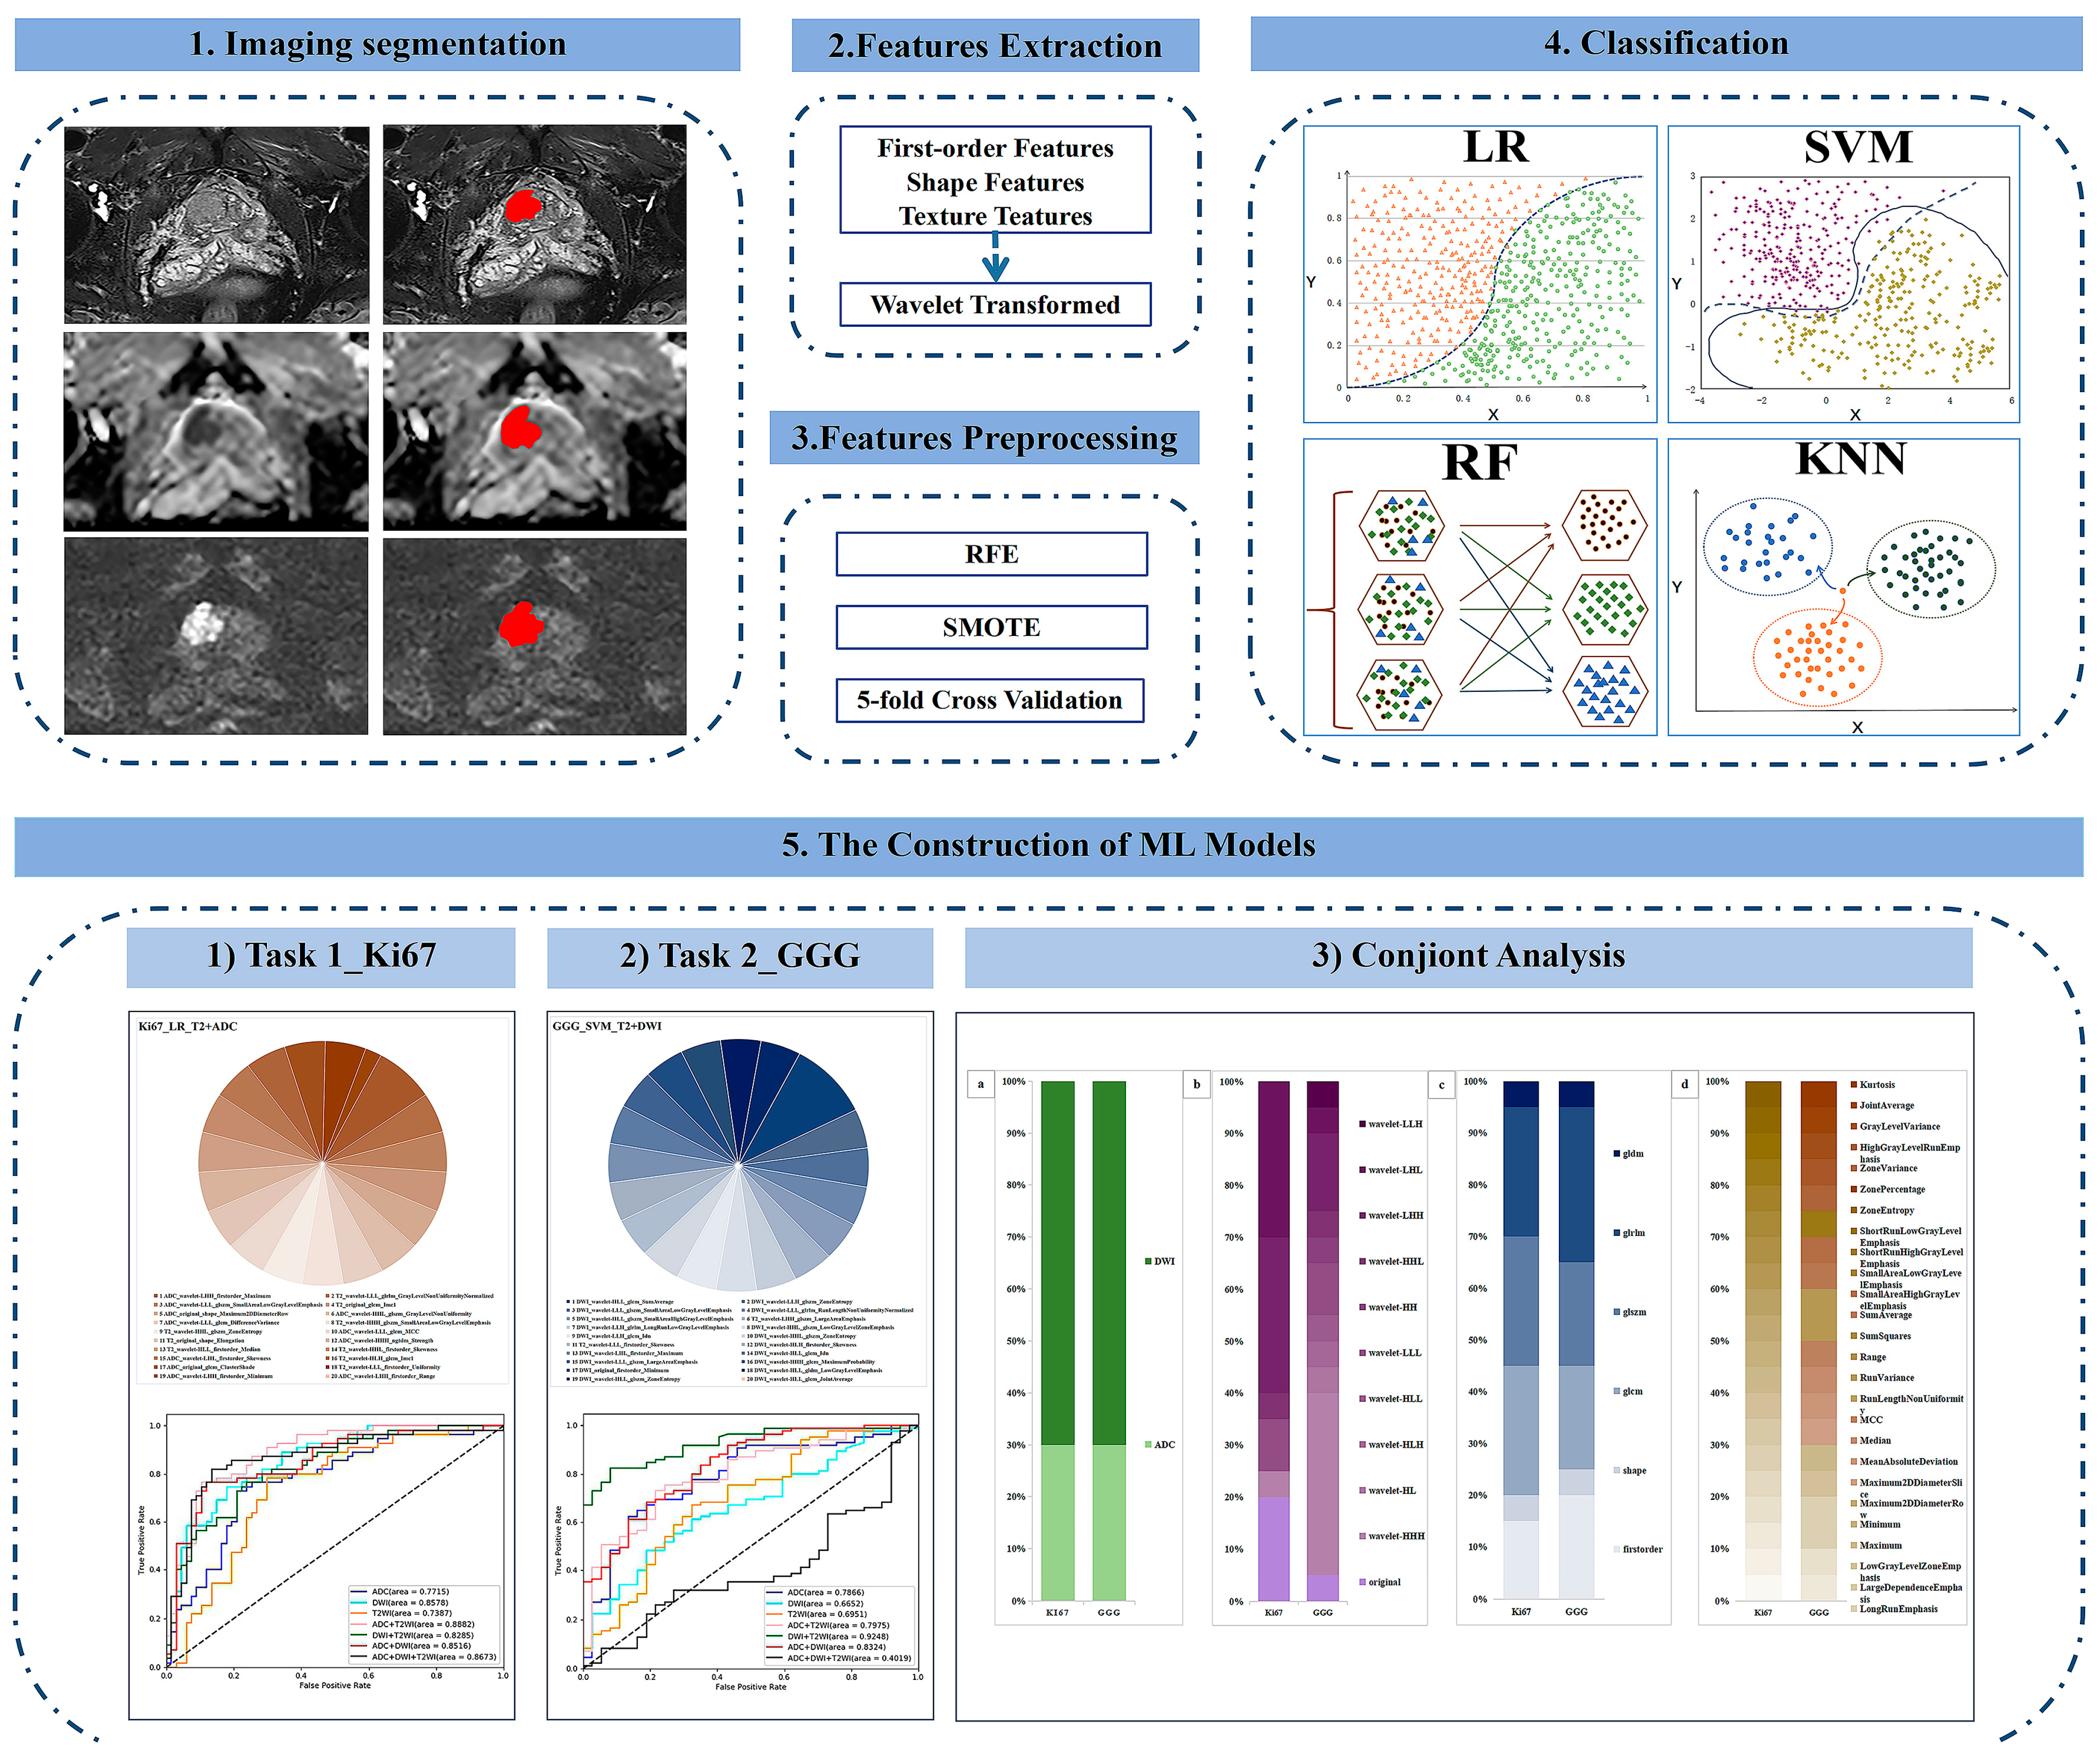
1. Introduction
2. Materials and Methods
2.1. Patients
2.2. MRI Protocol
2.3. Pathology
2.4. Radiomics Feature Extraction
2.5. Preprocessing of Radiomic Features
2.6. Construction of ML Models
2.7. Statistical Analysis
3. Results
3.1. Baseline Characteristics
3.2. Task 1: ML Models for Predicting Ki67 Expression
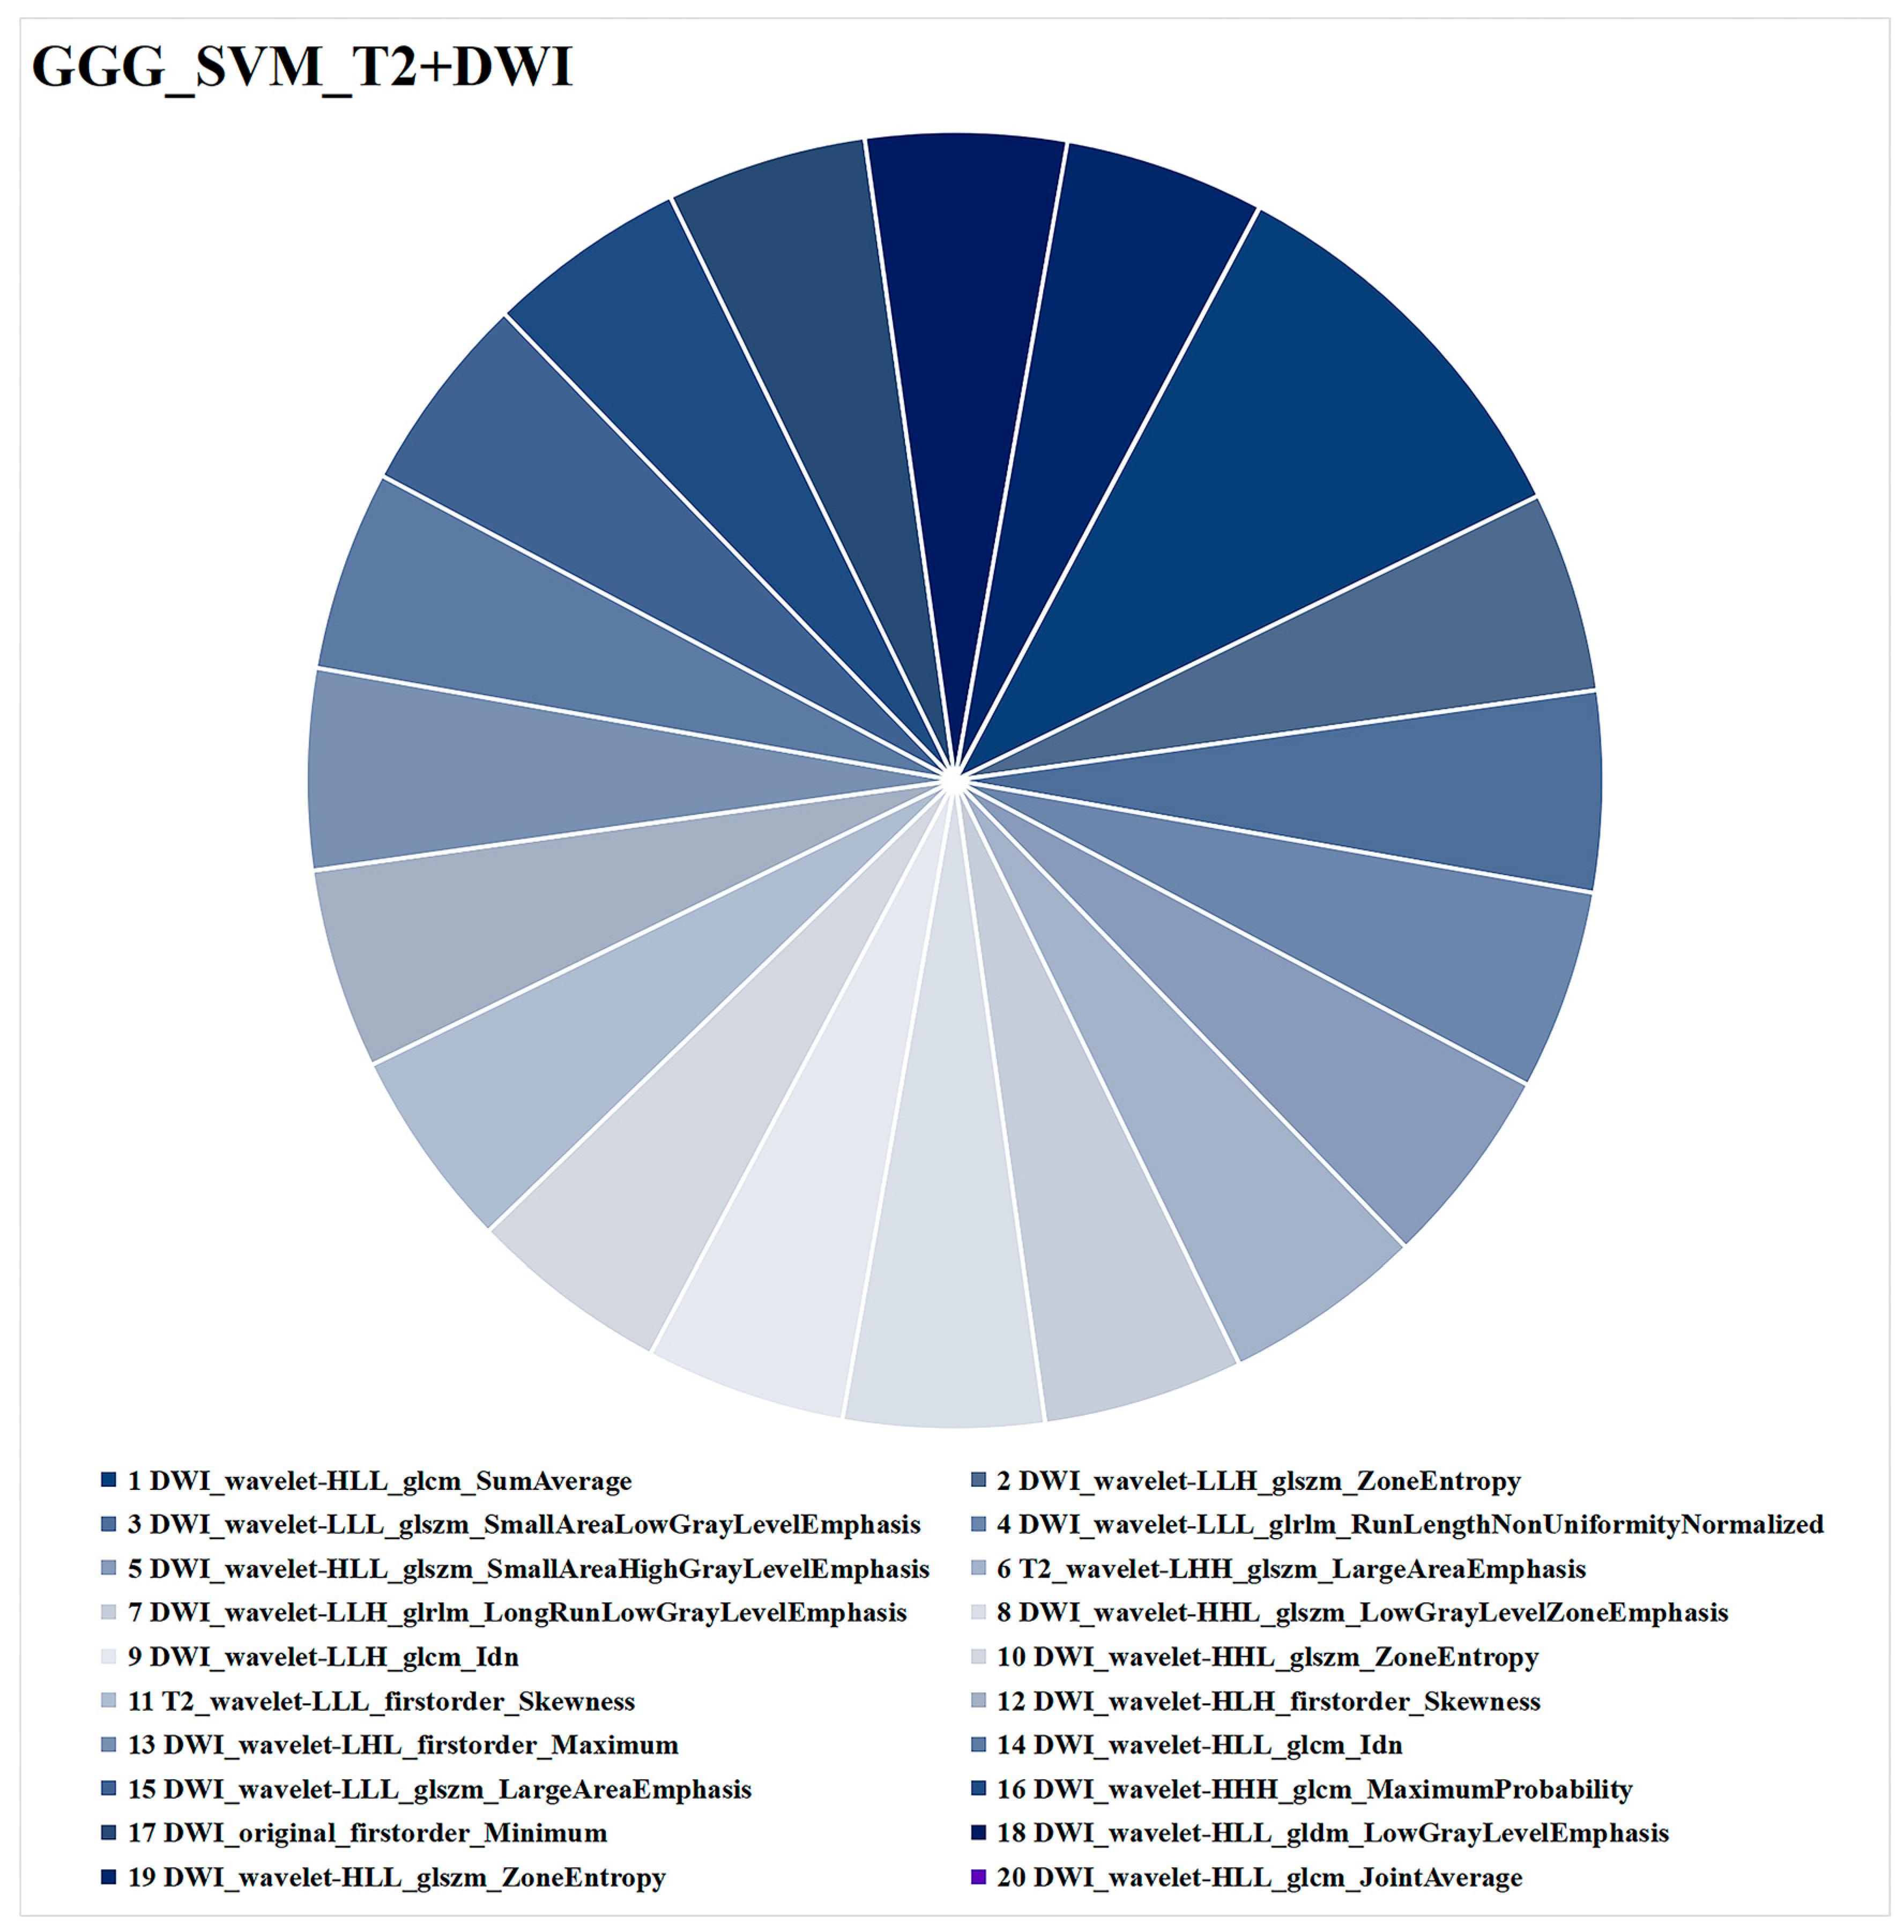
3.3. Task 2: ML Models for Predicting GGG
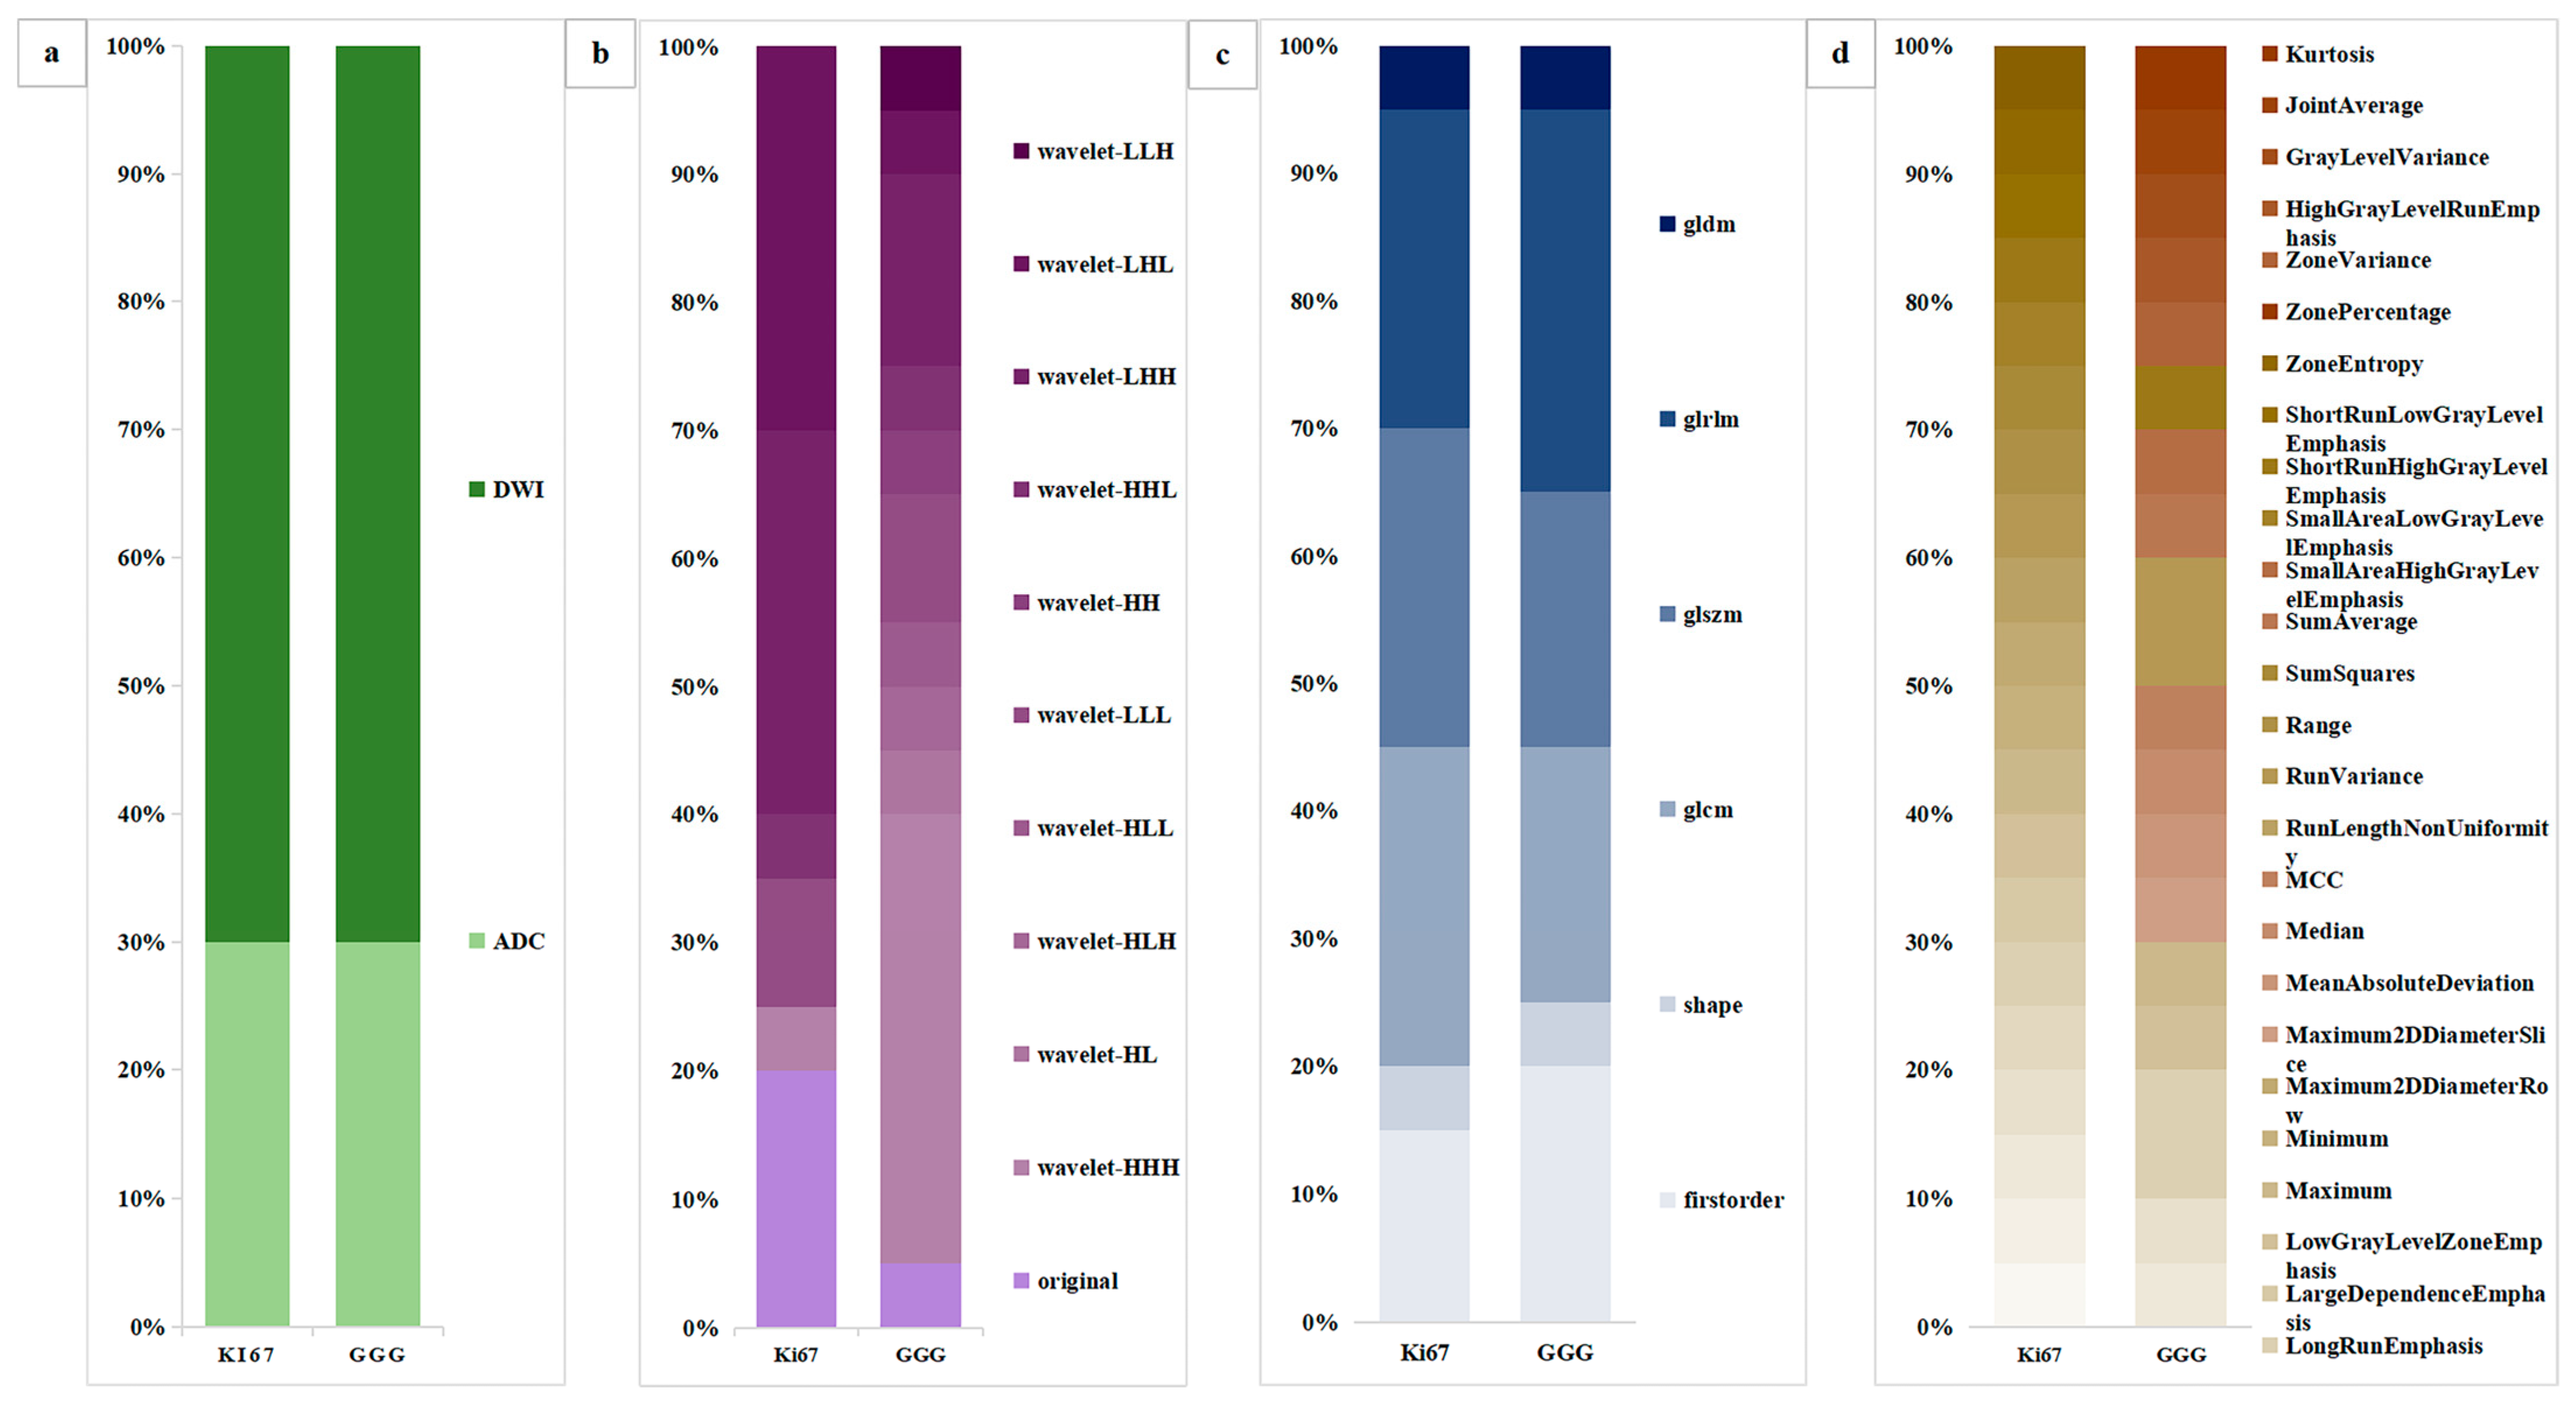
3.4. Conjoint Analysis of the Ki67 and GGG Tasks
4. Discussion
5. Conclusions
Author Contributions
Funding
Institutional Review Board Statement
Informed Consent Statement
Data Availability Statement
Conflicts of Interest
References
- Siegel, R.; Miller, K.; Wagle, N.; Jemal, A. Cancer statistics, 2023. CA Cancer J. Clin. 2023, 73, 17–48. [Google Scholar] [CrossRef] [PubMed]
- Schaeffer, E.; Srinivas, S.; Antonarakis, E.; Armstrong, A.; Bekelman, J.; Cheng, H.; D’Amico, A.; Davis, B.; Desai, N.; Dorff, T.; et al. NCCN Guidelines Insights: Prostate Cancer, Version 1.2021. J. Natl. Compr. Cancer Netw. 2021, 19, 134–143. [Google Scholar] [CrossRef]
- Mottet, N.; van den Bergh, R.C.; Briers, E.; Van den Broeck, T.; Cumberbatch, M.G.; De Santis, M.; Fanti, S.; Fossati, N.; Gandaglia, G.; Gillessen, S.; et al. EAU-EANM-ESTRO-ESUR-SIOG Guidelines on Prostate Cancer-2020 Update. Part 1: Screening, Diagnosis, and Local Treatment with Curative Intent. Eur. Radiol. 2021, 79, 243–262. [Google Scholar] [CrossRef]
- Loeb, S.; Folkvaljon, Y.; Curnyn, C.; Robinson, D.; Bratt, O.; Stattin, P. Uptake of Active Surveillance for Very-Low-Risk Prostate Cancer in Sweden. JAMA Oncol. 2017, 3, 1393–1398. [Google Scholar] [CrossRef]
- Hurwitz, L.; Agalliu, I.; Albanes, D.; Barry, K.; Berndt, S.; Cai, Q.; Chen, C.; Cheng, I.; Genkinger, J.; Giles, G.; et al. Recommended Definitions of Aggressive Prostate Cancer for Etiologic Epidemiologic Research. J. Natl. Cancer Inst. 2021, 113, 727–734. [Google Scholar] [CrossRef] [PubMed]
- Epstein, J.; Egevad, L.; Amin, M.; Delahunt, B.; Srigley, J.; Humphrey, P. The 2014 International Society of Urological Pathology (ISUP) Consensus Conference on Gleason Grading of Prostatic Carcinoma: Definition of Grading Patterns and Proposal for a New Grading System. Am. J. Surg. Pathol. 2016, 40, 244–252. [Google Scholar] [CrossRef]
- Iczkowski, K.; van Leenders, G.; van der Kwast, T. The 2019 International Society of Urological Pathology (ISUP) Consensus Conference on Grading of Prostatic Carcinoma. Am. J. Surg. Pathol 2021, 45, 1007. [Google Scholar] [CrossRef] [PubMed]
- Scholzen, T.; Endl, E.; Wohlenberg, C.; van der Sar, S.; Cowell, I.; Gerdes, J.; Singh, P. The Ki-67 protein interacts with members of the heterochromatin protein 1 (HP1) family: A potential role in the regulation of higher-order chromatin structure. J. Pathol. 2002, 196, 135–144. [Google Scholar] [CrossRef]
- Zhang, A.; Chiam, K.; Haupt, Y.; Fox, S.; Birch, S.; Tilley, W.; Butler, L.; Knudsen, K.; Comstock, C.; Rasiah, K.; et al. An analysis of a multiple biomarker panel to better predict prostate cancer metastasis after radical prostatectomy. Int. J. Cancer 2019, 144, 1151–1159. [Google Scholar] [CrossRef]
- Goltz, D.; Montani, M.; Braun, M.; Perner, S.; Wernert, N.; Jung, K.; Dietel, M.; Stephan, C.; Kristiansen, G. Prognostic relevance of proliferation markers (Ki-67, PHH3) within the cross-relation of ERG translocation and androgen receptor expression in prostate cancer. Pathology 2015, 47, 629–636. [Google Scholar] [CrossRef]
- Hammarsten, P.; Josefsson, A.; Thysell, E.; Lundholm, M.; Hägglöf, C.; Iglesias-Gato, D.; Flores-Morales, A.; Stattin, P.; Egevad, L.; Granfors, T.; et al. Immunoreactivity for prostate specific antigen and Ki67 differentiates subgroups of prostate cancer related to outcome. Mod. Pathol. 2019, 32, 1310–1319. [Google Scholar] [CrossRef]
- Zellweger, T.; Günther, S.; Zlobec, I.; Savic, S.; Sauter, G.; Moch, H.; Mattarelli, G.; Eichenberger, T.; Curschellas, E.; Rüfenacht, H.; et al. Tumour growth fraction measured by immunohistochemical staining of Ki67 is an independent prognostic factor in preoperative prostate biopsies with small-volume or low-grade prostate cancer. Int. J. Cancer 2009, 124, 2116–2123. [Google Scholar] [CrossRef] [PubMed]
- Epstein, J.; Amin, M.; Fine, S.; Algaba, F.; Aron, M.; Baydar, D.; Beltran, A.; Brimo, F.; Cheville, J.; Colecchia, M.; et al. The 2019 Genitourinary Pathology Society (GUPS) White Paper on Contemporary Grading of Prostate Cancer. Arch. Pathol. Lab. Med. 2021, 145, 461–493. [Google Scholar] [CrossRef] [PubMed]
- Green, W.; Ball, G.; Hulman, G.; Johnson, C.; Van Schalwyk, G.; Ratan, H.; Soria, D.; Garibaldi, J.; Parkinson, R.; Hulman, J.; et al. KI67 and DLX2 predict increased risk of metastasis formation in prostate cancer-a targeted molecular approach. Br. J. Cancer 2016, 115, 236–242. [Google Scholar] [CrossRef]
- Berney, D.; Gopalan, A.; Kudahetti, S.; Fisher, G.; Ambroisine, L.; Foster, C.; Reuter, V.; Eastham, J.; Moller, H.; Kattan, M.; et al. Ki-67 and outcome in clinically localised prostate cancer: Analysis of conservatively treated prostate cancer patients from the Trans-Atlantic Prostate Group study. Br. J. Cancer 2009, 100, 888–893. [Google Scholar] [CrossRef] [PubMed]
- Fisher, G.; Yang, Z.; Kudahetti, S.; Møller, H.; Scardino, P.; Cuzick, J.; Berney, D. Prognostic value of Ki-67 for prostate cancer death in a conservatively managed cohort. Br. J. Cancer 2013, 108, 271–277. [Google Scholar] [CrossRef]
- Tretiakova, M.; Wei, W.; Boyer, H.; Newcomb, L.; Hawley, S.; Auman, H.; Vakar-Lopez, F.; McKenney, J.; Fazli, L.; Simko, J.; et al. Prognostic value of Ki67 in localized prostate carcinoma: A multi-institutional study of >1000 prostatectomies. Prostate Cancer Prostatic Dis. 2016, 19, 264–270. [Google Scholar] [CrossRef]
- Tollefson, M.; Karnes, R.; Kwon, E.; Lohse, C.; Rangel, L.; Mynderse, L.; Cheville, J.; Sebo, T. Prostate cancer Ki-67 (MIB-1) expression, perineural invasion, and gleason score as biopsy-based predictors of prostate cancer mortality: The Mayo model. Mayo Clin. Proc. 2014, 89, 308–318. [Google Scholar] [CrossRef]
- Carroll, P.; Mohler, J. NCCN Guidelines Updates: Prostate Cancer and Prostate Cancer Early Detection. J. Natl. Compr. Cancer Netw. 2018, 16, 620–623. [Google Scholar] [CrossRef] [PubMed]
- Brembilla, G.; Dell’Oglio, P.; Stabile, A.; Damascelli, A.; Brunetti, L.; Ravelli, S.; Cristel, G.; Schiani, E.; Venturini, E.; Grippaldi, D.; et al. Interreader variability in prostate MRI reporting using Prostate Imaging Reporting and Data System version 2.1. Eur. Radiol. 2020, 30, 3383–3392. [Google Scholar] [CrossRef]
- Fan, M.; Yuan, W.; Zhao, W.; Xu, M.; Wang, S.; Gao, X.; Li, L. Joint Prediction of Breast Cancer Histological Grade and Ki-67 Expression Level Based on DCE-MRI and DWI Radiomics. IEEE J. Biomed. Health Inform. 2020, 24, 1632–1642. [Google Scholar] [CrossRef]
- Fanizzi, A.; Pomarico, D.; Paradiso, A.; Bove, S.; Diotaiuti, S.; Didonna, V.; Giotta, F.; La Forgia, D.; Latorre, A.; Pastena, M.; et al. Predicting of Sentinel Lymph Node Status in Breast Cancer Patients with Clinically Negative Nodes: A Validation Study. Cancers 2021, 13, 352. [Google Scholar] [CrossRef]
- Saha, A.; Harowicz, M.; Grimm, L.; Kim, C.; Ghate, S.; Walsh, R.; Mazurowski, M. A machine learning approach to radiogenomics of breast cancer: A study of 922 subjects and 529 DCE-MRI features. Br. J. Cancer 2018, 119, 508–516. [Google Scholar] [CrossRef]
- Gates, E.; Lin, J.; Weinberg, J.; Hamilton, J.; Prabhu, S.; Hazle, J.; Fuller, G.; Baladandayuthapani, V.; Fuentes, D.; Schellingerhout, D. Guiding the first biopsy in glioma patients using estimated Ki-67 maps derived from MRI: Conventional versus advanced imaging. Neuro Oncol. 2019, 21, 527–536. [Google Scholar] [CrossRef]
- Pasquini, L.; Napolitano, A.; Lucignani, M.; Tagliente, E.; Dellepiane, F.; Rossi-Espagnet, M.; Ritrovato, M.; Vidiri, A.; Villani, V.; Ranazzi, G.; et al. AI and High-Grade Glioma for Diagnosis and Outcome Prediction: Do All Machine Learning Models Perform Equally Well? Front. Oncol. 2021, 11, 601425. [Google Scholar] [CrossRef]
- Zaccaria, G.; Ferrero, S.; Hoster, E.; Passera, R.; Evangelista, A.; Genuardi, E.; Drandi, D.; Ghislieri, M.; Barbero, D.; Del Giudice, I.; et al. A Clinical Prognostic Model Based on Machine Learning from the Fondazione Italiana Linfomi (FIL) MCL0208 Phase III Trial. Cancers 2021, 14, 188. [Google Scholar] [CrossRef] [PubMed]
- Bulloni, M.; Sandrini, G.; Stacchiotti, I.; Barberis, M.; Calabrese, F.; Carvalho, L.; Fontanini, G.; Alì, G.; Fortarezza, F.; Hofman, P.; et al. Automated Analysis of Proliferating Cells Spatial Organisation Predicts Prognosis in Lung Neuroendocrine Neoplasms. Cancers 2021, 13, 4875. [Google Scholar] [CrossRef]
- Fehr, D.; Veeraraghavan, H.; Wibmer, A.; Gondo, T.; Matsumoto, K.; Vargas, H.; Sala, E.; Hricak, H.; Deasy, J. Automatic classification of prostate cancer Gleason scores from multiparametric magnetic resonance images. Proc. Natl. Acad. Sci. USA 2015, 112, E6265–E6273. [Google Scholar] [CrossRef] [PubMed]
- Fan, X.; Xie, N.; Chen, J.; Li, T.; Cao, R.; Yu, H.; He, M.; Wang, Z.; Wang, Y.; Liu, H.; et al. Multiparametric MRI and Machine Learning Based Radiomic Models for Preoperative Prediction of Multiple Biological Characteristics in Prostate Cancer. Front. Oncol. 2022, 12, 839621. [Google Scholar] [CrossRef] [PubMed]
- Zhou, L.; Peng, H.; Ji, Q.; Li, B.; Pan, L.; Chen, F.; Jiao, Z.; Wang, Y.; Huang, M.; Liu, G.; et al. Radiomic signatures based on multiparametric MR images for predicting Ki-67 index expression in medulloblastoma. Ann. Transl. Med. 2021, 9, 1665. [Google Scholar] [CrossRef]
- Michaely, H.; Aringhieri, G.; Cioni, D.; Neri, E.J.D. Current Value of Biparametric Prostate MRI with Machine-Learning or Deep-Learning in the Detection, Grading, and Characterization of Prostate Cancer: A Systematic Review. Diagnostics 2022, 12, 799. [Google Scholar] [CrossRef] [PubMed]
- Chen, T.; Zhang, Z.; Tan, S.; Zhang, Y.; Wei, C.; Wang, S.; Zhao, W.; Qian, X.; Zhou, Z.; Shen, J.; et al. MRI Based Radiomics Compared with the PI-RADS V2.1 in the Prediction of Clinically Significant Prostate Cancer: Biparametric vs Multiparametric MRI. Front. Oncol. 2021, 11, 792456. [Google Scholar] [CrossRef]
- Xie, J.; Li, B.; Min, X.; Zhang, P.; Fan, C.; Li, Q.; Wang, L. Prediction of Pathological Upgrading at Radical Prostatectomy in Prostate Cancer Eligible for Active Surveillance: A Texture Features and Machine Learning-Based Analysis of Apparent Diffusion Coefficient Maps. Front. Oncol. 2020, 10, 604266. [Google Scholar] [CrossRef] [PubMed]
- Chaddad, A.; Kucharczyk, M.; Niazi, T. Multimodal Radiomic Features for the Predicting Gleason Score of Prostate Cancer. Cancers 2018, 10, 249. [Google Scholar] [CrossRef] [PubMed]
- Rodrigues, A.; Santinha, J.; Galvão, B.; Matos, C.; Couto, F.; Papanikolaou, N. Prediction of Prostate Cancer Disease Aggressiveness Using Bi-Parametric Mri Radiomics. Cancers 2021, 13, 6065. [Google Scholar] [CrossRef]
- Zhang, G.; Han, Y.; Wei, J.; Qi, Y.; Gu, D.; Lei, J.; Yan, W.; Xiao, Y.; Xue, H.; Feng, F.; et al. Radiomics Based on MRI as a Biomarker to Guide Therapy by Predicting Upgrading of Prostate Cancer From Biopsy to Radical Prostatectomy. J. Magn. Reson. Imaging 2020, 52, 1239–1248. [Google Scholar] [CrossRef]
- Meng, X.; Xia, W.; Xie, P.; Zhang, R.; Li, W.; Wang, M.; Xiong, F.; Liu, Y.; Fan, X.; Xie, Y.; et al. Preoperative radiomic signature based on multiparametric magnetic resonance imaging for noninvasive evaluation of biological characteristics in rectal cancer. Eur. Radiol. 2019, 29, 3200–3209. [Google Scholar] [CrossRef]
- Lambin, P.; Leijenaar, R.; Deist, T.; Peerlings, J.; de Jong, E.; van Timmeren, J.; Sanduleanu, S.; Larue, R.; Even, A.; Jochems, A.; et al. Radiomics: The bridge between medical imaging and personalized medicine. Nat. Rev. Clin. Oncol. 2017, 14, 749–762. [Google Scholar] [CrossRef]
- Stanzione, A.; Gambardella, M.; Cuocolo, R.; Ponsiglione, A.; Romeo, V.; Imbriaco, M. Prostate MRI radiomics: A systematic review and radiomic quality score assessment. Eur. J. Radiol. 2020, 129, 109095. [Google Scholar] [CrossRef]
- Spadarella, G.; Stanzione, A.; Akinci D’Antonoli, T.; Andreychenko, A.; Fanni, S.; Ugga, L.; Kotter, E.; Cuocolo, R. Systematic review of the radiomics quality score applications: An EuSoMII Radiomics Auditing Group Initiative. Eur. Radiol. 2023, 33, 1884–1894. [Google Scholar] [CrossRef]


| Images | LR | SVM | RF | KNN | ||||||||
|---|---|---|---|---|---|---|---|---|---|---|---|---|
| AUC | Sens. | Spec. | AUC | Sens. | Spec. | AUC | Sens. | Spec. | AUC | Sens. | Spec. | |
| T2 | 0.7383 | 0.6364 | 0.7463 | 0.7913 | 0.7091 | 0.7463 | 0.6946 | 0.5455 | 0.6567 | 0.6425 | 0.6000 | 0.6119 |
| DWI | 0.8578 | 0.7091 | 0.8209 | 0.8152 | 0.7455 | 0.7612 | 0.6408 | 0.5273 | 0.7910 | 0.6832 | 0.6182 | 0.7164 |
| ADC | 0.7715 | 0.7273 | 0.7612 | 0.7449 | 0.7273 | 0.6716 | 0.6689 | 0.5455 | 0.6866 | 0.5986 | 0.4364 | 0.6716 |
| T2 + DWI | 0.8285 | 0.7273 | 0.7761 | 0.7984 | 0.7455 | 0.7015 | 0.6634 | 0.5455 | 0.7015 | 0.6408 | 0.5455 | 0.6716 |
| T2 + ADC | 0.8882 | 0.7636 | 0.8657 | 0.8475 | 0.7091 | 0.7910 | 0.6965 | 0.5818 | 0.7164 | 0.6650 | 0.5818 | 0.7612 |
| ADC + DWI | 0.8516 | 0.7636 | 0.8209 | 0.7874 | 0.7091 | 0.7164 | 0.7115 | 0.5636 | 0.7015 | 0.6837 | 0.6000 | 0.7164 |
| ADC + DWI + T2 | 0.8673 | 0.8182 | 0.8358 | 0.8336 | 0.8727 | 0.7463 | 0.6925 | 0.5636 | 0.7015 | 0.6794 | 0.5818 | 0.7015 |
| Images | LR | SVM | RF | KNN | ||||||||
|---|---|---|---|---|---|---|---|---|---|---|---|---|
| AUC | Sens. | Spec. | AUC | Sens. | Spec. | AUC | Sens. | Spec. | AUC | Sens. | Spec. | |
| T2 | 0.7994 | 0.8706 | 0.5946 | 0.6951 | 0.7765 | 0.5946 | 0.7690 | 0.8824 | 0.4595 | 0.7041 | 0.8471 | 0.4054 |
| DWI | 0.7736 | 0.8824 | 0.4595 | 0.6652 | 0.7294 | 0.4324 | 0.6060 | 0.9059 | 0.2973 | 0.6068 | 0.7765 | 0.3243 |
| ADC | 0.8016 | 0.8706 | 0.5135 | 0.7866 | 0.8000 | 0.6216 | 0.6835 | 0.8824 | 0.6835 | 0.6490 | 0.8941 | 0.3784 |
| T2 + DWI | 0.9072 | 0.8706 | 0.6216 | 0.9248 | 0.8588 | 0.7838 | 0.7232 | 0.8000 | 0.3514 | 0.7065 | 0.8353 | 0.4054 |
| T2 + ADC | 0.8006 | 0.8471 | 0.4865 | 0.7975 | 0.7529 | 0.6757 | 0.7078 | 0.9059 | 0.4595 | 0.6701 | 0.9059 | 0.2703 |
| ADC + DWI | 0.8658 | 0.8824 | 0.5946 | 0.8324 | 0.7765 | 0.6757 | 0.6466 | 0.8235 | 0.2432 | 0.6677 | 0.8471 | 0.3243 |
| ADC + DWI + T2 | 0.6162 | 0.7765 | 0.1892 | 0.4019 | 0.6353 | 0.3514 | 0.6013 | 0.8118 | 0.2973 | 0.6073 | 0.7647 | 0.3514 |
| Images | LR | SVM | RF | KNN |
|---|---|---|---|---|
| T2 | 0.5080 | 0.4670 | 0.4340 | 0.4340 |
| DWI | 0.5820 | 0.4840 | 0.4920 | 0.4670 |
| ADC | 0.5660 | 0.5570 | 0.4590 | 0.4260 |
| T2+DWI | 0.5900 | 0.6230 | 0.4260 | 0.4430 |
| T2+ADC | 0.6070 | 0.5820 | 0.5250 | 0.4670 |
| ADC+DWI | 0.6230 | 0.5490 | 0.4020 | 0.4670 |
| ADC+DWI+T2 | 0.5000 | 0.4340 | 0.3850 | 0.4020 |
Disclaimer/Publisher’s Note: The statements, opinions and data contained in all publications are solely those of the individual author(s) and contributor(s) and not of MDPI and/or the editor(s). MDPI and/or the editor(s) disclaim responsibility for any injury to people or property resulting from any ideas, methods, instructions or products referred to in the content. |
© 2023 by the authors. Licensee MDPI, Basel, Switzerland. This article is an open access article distributed under the terms and conditions of the Creative Commons Attribution (CC BY) license (https://creativecommons.org/licenses/by/4.0/).
Share and Cite
Qiao, X.; Gu, X.; Liu, Y.; Shu, X.; Ai, G.; Qian, S.; Liu, L.; He, X.; Zhang, J. MRI Radiomics-Based Machine Learning Models for Ki67 Expression and Gleason Grade Group Prediction in Prostate Cancer. Cancers 2023, 15, 4536. https://doi.org/10.3390/cancers15184536
Qiao X, Gu X, Liu Y, Shu X, Ai G, Qian S, Liu L, He X, Zhang J. MRI Radiomics-Based Machine Learning Models for Ki67 Expression and Gleason Grade Group Prediction in Prostate Cancer. Cancers. 2023; 15(18):4536. https://doi.org/10.3390/cancers15184536
Chicago/Turabian StyleQiao, Xiaofeng, Xiling Gu, Yunfan Liu, Xin Shu, Guangyong Ai, Shuang Qian, Li Liu, Xiaojing He, and Jingjing Zhang. 2023. "MRI Radiomics-Based Machine Learning Models for Ki67 Expression and Gleason Grade Group Prediction in Prostate Cancer" Cancers 15, no. 18: 4536. https://doi.org/10.3390/cancers15184536
APA StyleQiao, X., Gu, X., Liu, Y., Shu, X., Ai, G., Qian, S., Liu, L., He, X., & Zhang, J. (2023). MRI Radiomics-Based Machine Learning Models for Ki67 Expression and Gleason Grade Group Prediction in Prostate Cancer. Cancers, 15(18), 4536. https://doi.org/10.3390/cancers15184536