Article

Predictive Value of Modified Glasgow Prognostic Score and Persistent Inflammation among Patients with Non-Small Cell Lung Cancer Treated with Durvalumab Consolidation after Chemoradiotherapy: A Multicenter Retrospective Study

1
Department of Respiratory Medicine, Japanese Red Cross Kyoto Daini Hospital, Kyoto 602-8026, Japan
2
Department of Respiratory Medicine, Asahi General Hospital, Asahi 289-2511, Japan
3
Department of Respiratory Medicine, Japanese Red Cross Kyoto Daiichi Hospital, Kyoto 605-0981, Japan
4
Department of Respiratory Medicine, Uji-Tokushukai Medical Center, Uji 611-0041, Japan
5
Department of Respiratory Medicine, Yao Tokushukai General Hospital, Yao 581-0011, Japan
6
Department of Pulmonary Medicine, Graduate School of Medical Science, Kyoto Prefectural University of Medicine, Kyoto 602-8566, Japan
7
Department of Respiratory Medicine, Shonan Fujisawa Tokushukai Hospital, Fujisawa 251-0041, Japan
*
Author to whom correspondence should be addressed.
Cancers 2023, 15(17), 4358; https://doi.org/10.3390/cancers15174358
Submission received: 1 July 2023 / Revised: 23 August 2023 / Accepted: 28 August 2023 / Published: 1 September 2023
(This article belongs to the Section Cancer Immunology and Immunotherapy)

Abstract

:

Simple Summary

Durvalumab consolidation after chemoradiotherapy (CRT) is a standard treatment for locally advanced non-small cell lung cancer, which sometimes encounters early recurrence. This retrospective study aimed to identify the predictors of durvalumab consolidation after CRT. A prognostic risk classification was created combining modified Glasgow Prognostic Score (mGPS) before CRT and C-reactive protein (CRP) level after CRT. When patients with pre-CRT mGPS of 0 or mGPS of 1 with post-CRT CRP ≤1 mg/dL were classified as the “low-risk” group, and patients with pre-CRT mGPS of 2 or mGPS of 1 with post-CRT CRP >1 mg/dL were classified as the “high-risk” group, the high-risk group had a significantly shorter median progression-free survival (PFS, hazard ratio [HR]: 2.47, p < 0.001) and overall survival (OS, HR: 3.62, p < 0.001) compared with those in the low-risk group. The prognostic risk classification helps to predict the PFS and OS of durvalumab consolidation after CRT.

Abstract

Background: Durvalumab consolidation after chemoradiotherapy (CRT) is a standard treatment for locally advanced non-small cell lung cancer (NSCLC). However, studies on immunological and nutritional markers to predict progression-free survival (PFS) and overall survival (OS) are inadequate. Systemic inflammation causes cancer cachexia and negatively affects immunotherapy efficacy, which also reflects survival outcomes. Patients and Methods: We retrospectively investigated 126 patients from seven institutes in Japan. Results: The modified Glasgow Prognostic Score (mGPS) values, before and after CRT, were the essential predictors among the evaluated indices. A systemic inflammation-based prognostic risk classification was created by combining mGPS values before CRT, and C-reactive protein (CRP) levels after CRT, to distinguish tumor-derived inflammation from CRT-induced inflammation. Patients were classified into high-risk (n = 31) and low-risk (n = 95) groups, and the high-risk group had a significantly shorter median PFS of 7.2 months and an OS of 19.6 months compared with the low-risk group. The hazard ratios for PFS and OS were 2.47 (95% confidence interval [CI]: 1.46–4.19, p < 0.001) and 3.62 (95% CI: 1.79–7.33, p < 0.001), respectively. This association was also observed in the subgroup with programmed cell death ligand 1 expression of ≥50%, but not in the <50% subgroup. Furthermore, durvalumab discontinuation was observed more frequently in the high-risk group than in the low-risk group. Conclusion: Combining pre-CRT mGPS values with post-CRT CRP levels in patients with locally advanced NSCLC helps to predict the PFS and OS of durvalumab consolidation after CRT.

1. Introduction

Consolidation therapy with durvalumab, an anti-programmed cell death ligand 1 (PD-L1) antibody, has become the standard treatment after chemoradiotherapy (CRT) in patients with unresectable locally advanced non-small cell lung cancer (NSCLC) [1]. However, some patients experience early recurrence despite receiving durvalumab consolidation after CRT. Therefore, a predictive marker for early recurrence after durvalumab consolidation is essential for detecting recurrence without delay, enabling subsequent treatment.
PD-L1 expression on tumor cells and the tumor mutational burden are crucial factors determining the therapeutic efficacy of immune checkpoint inhibitors (ICIs) for advanced malignancies [2,3]. They are essential among patients who undergo durvalumab consolidation after CRT in locally advanced stages [4].
In addition, the tumor microenvironment, with its substantial cytokine functions, is a factor that defines tumor cell behavior in the cancer-immunity cycle. Pro-inflammatory cytokines such as interleukin (IL)-6 and IL-1β promote tumor proliferation and suppress immune responses to tumor cells, contributing to tumor progression [5,6,7]. These inflammatory cytokines are also involved in cancer cachexia development—defined as “a multifactorial syndrome defined by an ongoing loss of skeletal muscle mass (with or without loss of fat mass) that cannot be fully reversed by conventional nutritional support and leads to progressive functional impairment [8]”. Cancer cachexia is reported in over half of the patients with advanced cancer [8]. In addition, pre-cachexia or cachexia phases are even observed in patients with early or locally advanced stages. Studies have reported that systemic inflammation precedes typical cachexia criteria, such as muscle wasting and body weight loss [9,10]. Cancer cachexia is associated with poor prognosis in immunotherapy through the desensitization of programmed cell death-1 (PD-1)/PD-L1 inhibition [11,12]. Therefore, systemic inflammation, which is closely associated with cachexia, could have a prognostic value in durvalumab consolidation after CRT.
Overall survival (OS) in several malignancies can be predicted using immunological and nutritional markers. Potential markers for predicting the prognosis of patients with advanced NSCLC, which are easily calculated from clinical laboratory data and physical measurement, include the neutrophil-to-lymphocyte ratio (NLR) [13,14], platelet-to-lymphocyte ratio (PLR) [15,16], C-reactive protein-to-albumin ratio (CAR) [17,18], advanced lung cancer inflammation index (ALI) [19], systemic immune inflammation index (SII) [20,21], lung immune prognostic index (LIPI) [22], and modified Glasgow prognostic score (mGPS) [23,24]. NLR [25] and CAR [26] predict progression-free survival (PFS) in patients with locally advanced NSCLC who undergo durvalumab consolidation after CRT. In contrast, mGPS can predict the prognosis and evaluate the progression of cachexia based on CRP and albumin levels, which can classify cachexia stages [27]. The influence of CRT-induced inflammation, especially radiation pneumonitis, should be considered when using mGPS to determine the prognosis of patients with advanced NSCLC who undergo durvalumab consolidation after CRT. This application is challenging because it is difficult to differentiate CRT-induced inflammation from tumor inflammation, which is the original significance in calculating the mGPS [23,24]. Therefore, cautious evaluation is required to establish predictive markers for durvalumab consolidation after CRT.
Thus, this multicenter retrospective study aimed to identify the predictors of durvalumab consolidation after CRT, especially focusing on systemic inflammation and cachexia, to detect recurrence without delay.

2. Materials and Methods

2.1. Patients

We conducted a multicenter retrospective study in Japan to investigate markers for predicting the prognosis of patients with NSCLC who underwent durvalumab consolidation after CRT. We analyzed the medical records of patients with NSCLC who underwent durvalumab consolidation after concurrent CRT between 1 July 2018, and 31 March 2021, at seven institutes in Japan. Inclusion criteria were as follows: (a) aged ≥20 years at the administration of durvalumab; (b) histologically diagnosed NSCLC; (b) durvalumab consolidation after concurrent CRT; (d) evaluable lesion(s) based on the Response Evaluation Criteria in Solid Tumors (RECIST) guidelines (version 1.1). Exclusion criteria were as follows: (a) had been treated with ICIs; (b) judged ineligible to participate in this study by the investigator. The deadline for collecting survival analysis data was 30 September 2021. The study protocol was conducted in accordance with the Declaration of Helsinki and approved by the Ethics Committees of the Japanese Red Cross Kyoto Daini Hospital (8 July 2021; S2021-12) and each participating hospital. The requirement for informed consent was waived because of the retrospective nature of the study. However, patients were allowed to withdraw their data, and the relevant information concerning the study was available on each hospital’s website.

2.2. Immunological and Nutritional Markers

Immunological and nutritional markers were calculated at 2 timepoints: at baseline, before CRT, and before durvalumab consolidation, after CRT. The cutoff values were used based on previous reports [13,16,17,19,21,22,24]. CRP values were also investigated after CRT in order to evaluate the persistent inflammation after CRT.
mGPS score: 0 (CRP ≤1 mg/dL and albumin ≥3.5 g/dL), 1 (CRP >1 mg/dL or albumin <3.5 g/dL), or score 2 (CRP >1 mg/dL and serum albumin <3.5 g/dL]); CAR = CRP (mg/dL)/serum albumin (g/dL): grouped based on CAR <0.32 or ≥0.32; NLR = neutrophil count (/µL)/lymphocyte count (/µL): grouped using NLR <5 or ≥5; PLR = platelet count (/µL)/lymphocyte count (/µL): grouped using PLR <180 or ≥180; ALI = Body mass index (kg/m2) × serum albumin (g/dL)/NLR: grouped based on ALI ≥18 or <18; SII = platelet count (103/µL) × neutrophil count (/µL)/lymphocyte count (/µL): grouped using SII <750 or ≥750; LIPI: good (derived NLR [dNLR] ≤3 and lactate dehydrogenase [LDH] ≤ upper limit of normal [ULN]), intermediate (dNLR >3 or LDH > ULN), poor (dNLR >3 and LDH > ULN).

2.3. Response Evaluation and Outcome Assessment

OS was the interval between the first day of durvalumab consolidation and death from any cause. PFS was the interval from the first day of durvalumab consolidation to disease progression or death, whichever occurred first. Objective response and disease control rates were defined as “the percentage of patients in the study or treatment group who achieved complete response (CR) or partial response (PR) to the treatment” and “the percentage of patients in the study or treatment group who have achieved CR, PR and stable disease (SD)”, respectively [28]. When no imaging/measurement was done after CRT, the patient was not evaluable (NE) [28]. The response was evaluated according to the best overall treatment response based on the RECIST guidelines (version 1.1). Adverse events were assessed in accordance with the common terminology criteria for adverse events (version 5.0).

2.4. Statistical Analysis

OS and PFS curves are illustrated using the Kaplan–Meier method. The log-rank test was used to evaluate PFS and OS. Categorical variables were compared using Fisher’s exact test. Cox proportional hazards models were used for univariate or multivariate analyses of PFS and OS. The concordance index (C-index) was used to evaluate the predictive value of markers. Patients with missing data were excluded from the analysis. For all analyses, a p-value of <0.05 indicated significance.

2.5. Software Tools

Statistical analyses were performed using GraphPad Prism8 (GraphPad Software, San Diego, CA, USA) and EZR statistical software version 1.55 (Saitama Medical Center, Jichi Medical University, Saitama, Japan), which is a graphical user interface for R version 1.61 (R Foundation for Statistical Computing, Vienna, Austria). EZR statistical software is a modified version of the R commander designed to add statistical functions frequently used in biostatistics.

3. Results

3.1. Characteristics of Patients

In total, 133 patients were enrolled in this study and 7 patients were excluded due to data unavailability (Supplementary Figure S1). The median duration of follow-up for surviving participants was 16.3 months (95% confidence interval [CI]: 14.7–20.8 months). The baseline characteristics of the 126 patients at the time of durvalumab initiation are summarized in Table 1. The median age was 71 (interquartile range [IQR]: 64.3, 76.0) years, and 98 patients (77.8%) were males. One hundred and ten (87.3%) patients had a smoking history. The numbers of patients with Eastern Cooperative Oncology Group performance statuses (ECOG-PS) of 0–1 and 2 were 118 (93.7%) and 8 (6.3%), respectively. Sixty-five (51.6%) patients had squamous cell carcinoma. The oncogenic driver gene was detected in 8 (6.4%) patients, and ≥50% PD-L1 expression was detected on tumor cells in 41 (32.5%). Fifty-nine (46.8%) patients were in stage IIIA or earlier. The best overall response to CRT was PR in 93 patients (73.8%), SD in 32 (25.4%), and NE in 1 (0.8%). The median interval between CRT and durvalumab consolidation was 15.5 days (IQR, 13–29.75).

3.2. Identification of the Most Significant Immunological and Nutritional Marker among Candidate Markers

The immunological and nutritional markers: CAR, NLR, PLR, ALI, SII, LIPI, and mGPS were calculated before and after CRT, and their associations with PFS and OS after durvalumab consolidation were analyzed. Among these markers, mGPS before CRT (pre-CRT mGPS) had the highest C-index for both PFS (0.572) and OS (0.653) with statistical significance, suggesting a high predictive value for survival outcomes (Table 2). Furthermore, mGPS after CRT (post-CRT mGPS) had the highest C-index for PFS (0.549) and OS (0.615) among the variables investigated after CRT (Table 2). Therefore, mGPS was an essential marker in this study.
Unlike pre-CRT mGPS, post-CRT mGPS was not significantly associated with PFS or OS. The influence of persistent inflammation and body weight changes induced by CRT on post-CRT mGPS values was investigated because the mGPS consists of CRP and serum albumin levels. The numbers of patients with mGPS of 0, 1, and 2 at the initiation of CRT were 78 (61.9%), 26 (20.6%), and 22 (17.5%) patients, respectively. The mGPS was maintained at the same score after CRT in 76.9%, 11.5%, and 30.4% of patients with mGPS of 0, 1, and 2, respectively (Figure 1A). A negative correlation was observed (r = −0.301, p = 0.035) between CRP levels after CRT (post-CRT CRP levels) and body weight loss during CRT among patients with pre-CRT mGPS values of 1 or 2. However, no correlation existed between post-CRT CRP levels and body weight change during CRT in patients with pre-CRT mGPS values of 0 (Figure 1B). Thus, the extent of inflammation induced by CRT could affect post-CRT mGPS and body weight changes during CRT in patients with a pre-CRT mGPS of 1 or 2. This was not observed in patients whose pre-CRT mGPS values were 0. These results suggest the possibility of prognostic stratification based on the pre-CRT mGPS and persistent inflammation levels after CRT.

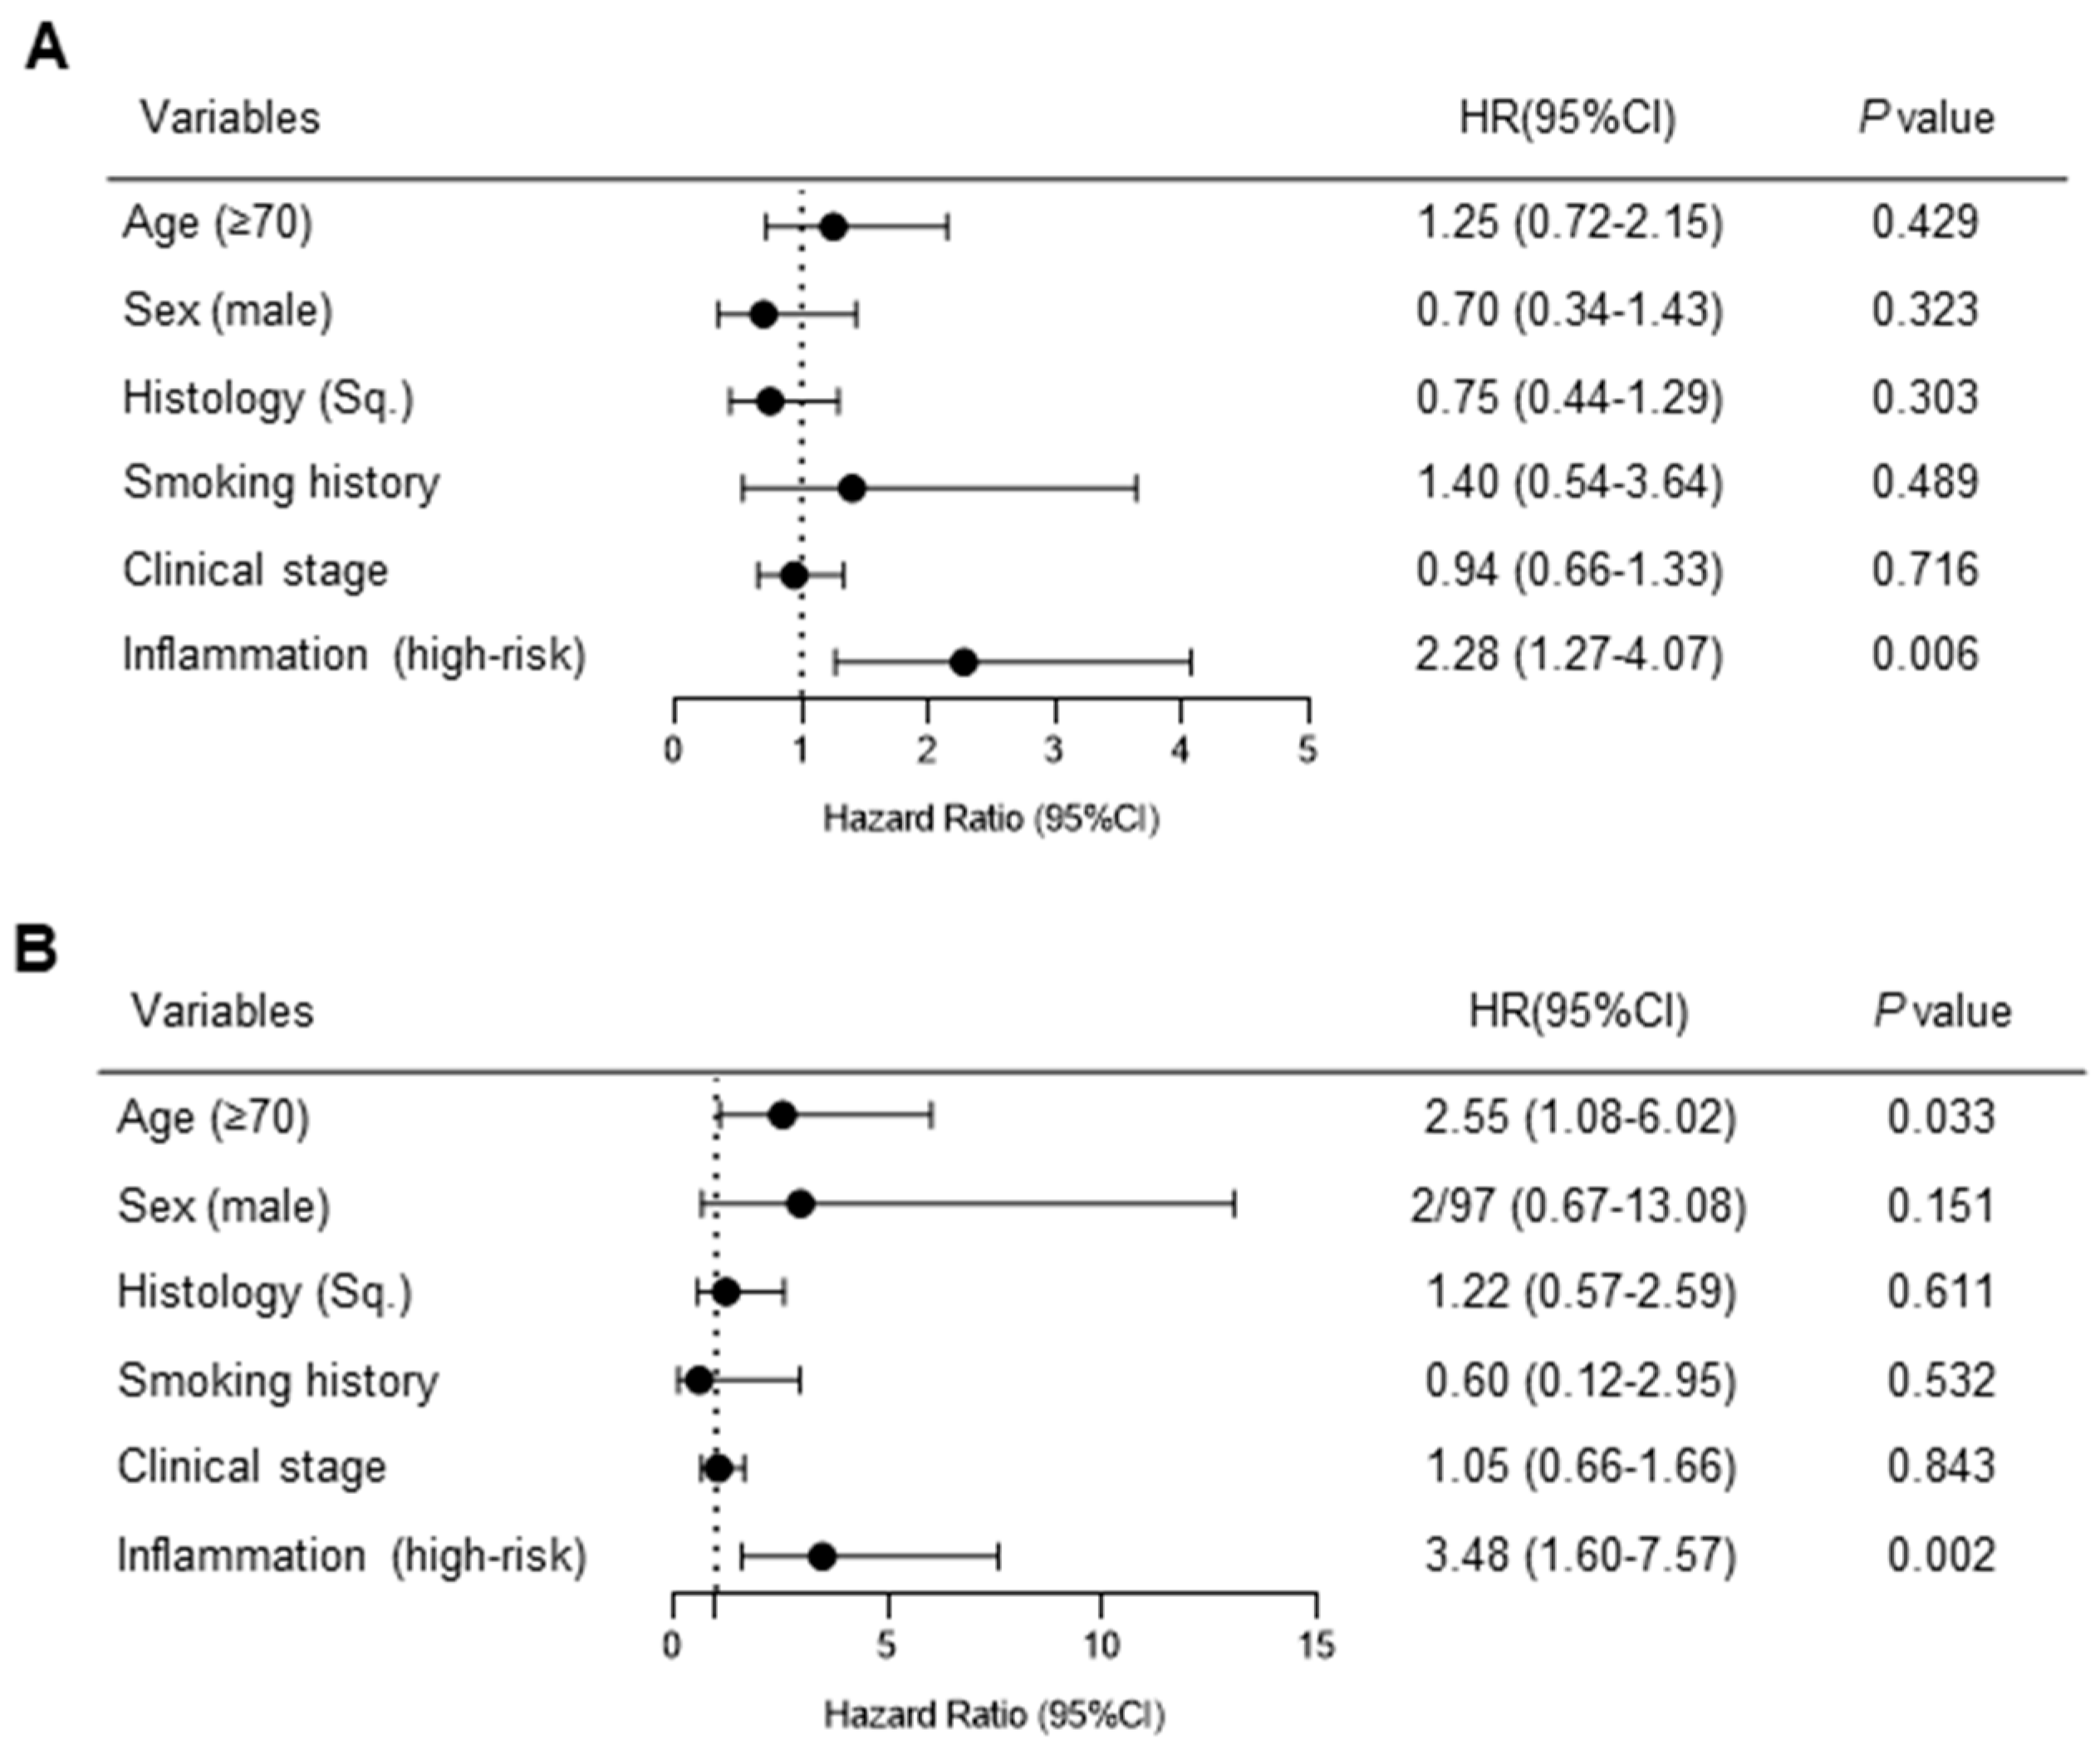
3.3. Systemic Inflammation-Based Prognostic Risk Classification in Patients Treated with Chemoradiotherapy Followed by Durvalumab Consolidation

We investigated the association between persistent inflammation based on post-CRT CRP levels and prognosis after durvalumab consolidation in each subgroup according to the pre-CRT mGPS. The inflammatory status after CRT was defined as low when CRP ≤1 mg/dL, and high when CRP >1 mg/dL, which is used as the CRP cutoff value in the mGPS [23,24]. Among the patients with mGPS of 0, no significant difference was observed in PFS and OS between 17 and 60 patients with high and low CRP levels, respectively, after CRT (hazard ratio [HR] for PFS: 1.07 [95% CI: 0.48–2.38], HR for OS: 1.51 [95% CI: 0.52–4.43]) (Figure 2A,B). In contrast, among the patients with mGPS of 1, 8 patients with high CRP levels after CRT had significantly poor PFS and relatively poor OS compared with 18 patients with low CRP levels (HR for PFS: 4.60 [95% CI: 1.44–14.7], HR for OS: 3.65 [95% CI: 0.79–16.84]) (Figure 2C,D). Among patients with mGPS of 2, 8 patients with high CRP levels after CRT had relatively shorter PFS and OS compared with 15 patients with low CRP levels without significance (HR for PFS: 1.12 [95% CI: 0.38–3.28], HR for OS 1.82 [95% CI: 0.51–6.52]) (Figure 2E,F).
These results suggest that the cohort with a pre-CRT mGPS of 1 consisted of patients with heterogeneous backgrounds, who could be divided into groups with good or poor outcomes based on the inflammation status after CRT. However, the cohorts with pre-CRT mGPS of 0 and 2 were considered relatively homogeneous and had good or poor outcomes irrespective of post-CRT inflammation status.
A prognostic risk classification reflecting systemic inflammation was created based on pre-CRT mGPS values and post-CRT CRP levels: patients with pre-CRT mGPS of 0 or mGPS of 1 with post-CRT CRP ≤1 mg/dL were classified as the “low-risk” group, and patients with pre-CRT mGPS of 2 or mGPS of 1 with post-CRT CRP >1 mg/dL were classified as the “high-risk” group. The high-risk group consisted of patients with more advanced stages than the low-risk group (p = 0.031) and experienced a significant weight loss during CRT compared with the low-risk group (low-risk vs. high-risk; −1.72% [IQR, −5.10, 0.76] vs. −4.86% [IQR, −8.24, −2.19], p = 0.037). The best overall response to CRT was not significantly different between the high- and low-risk groups (p = 0.859) (Table 3).

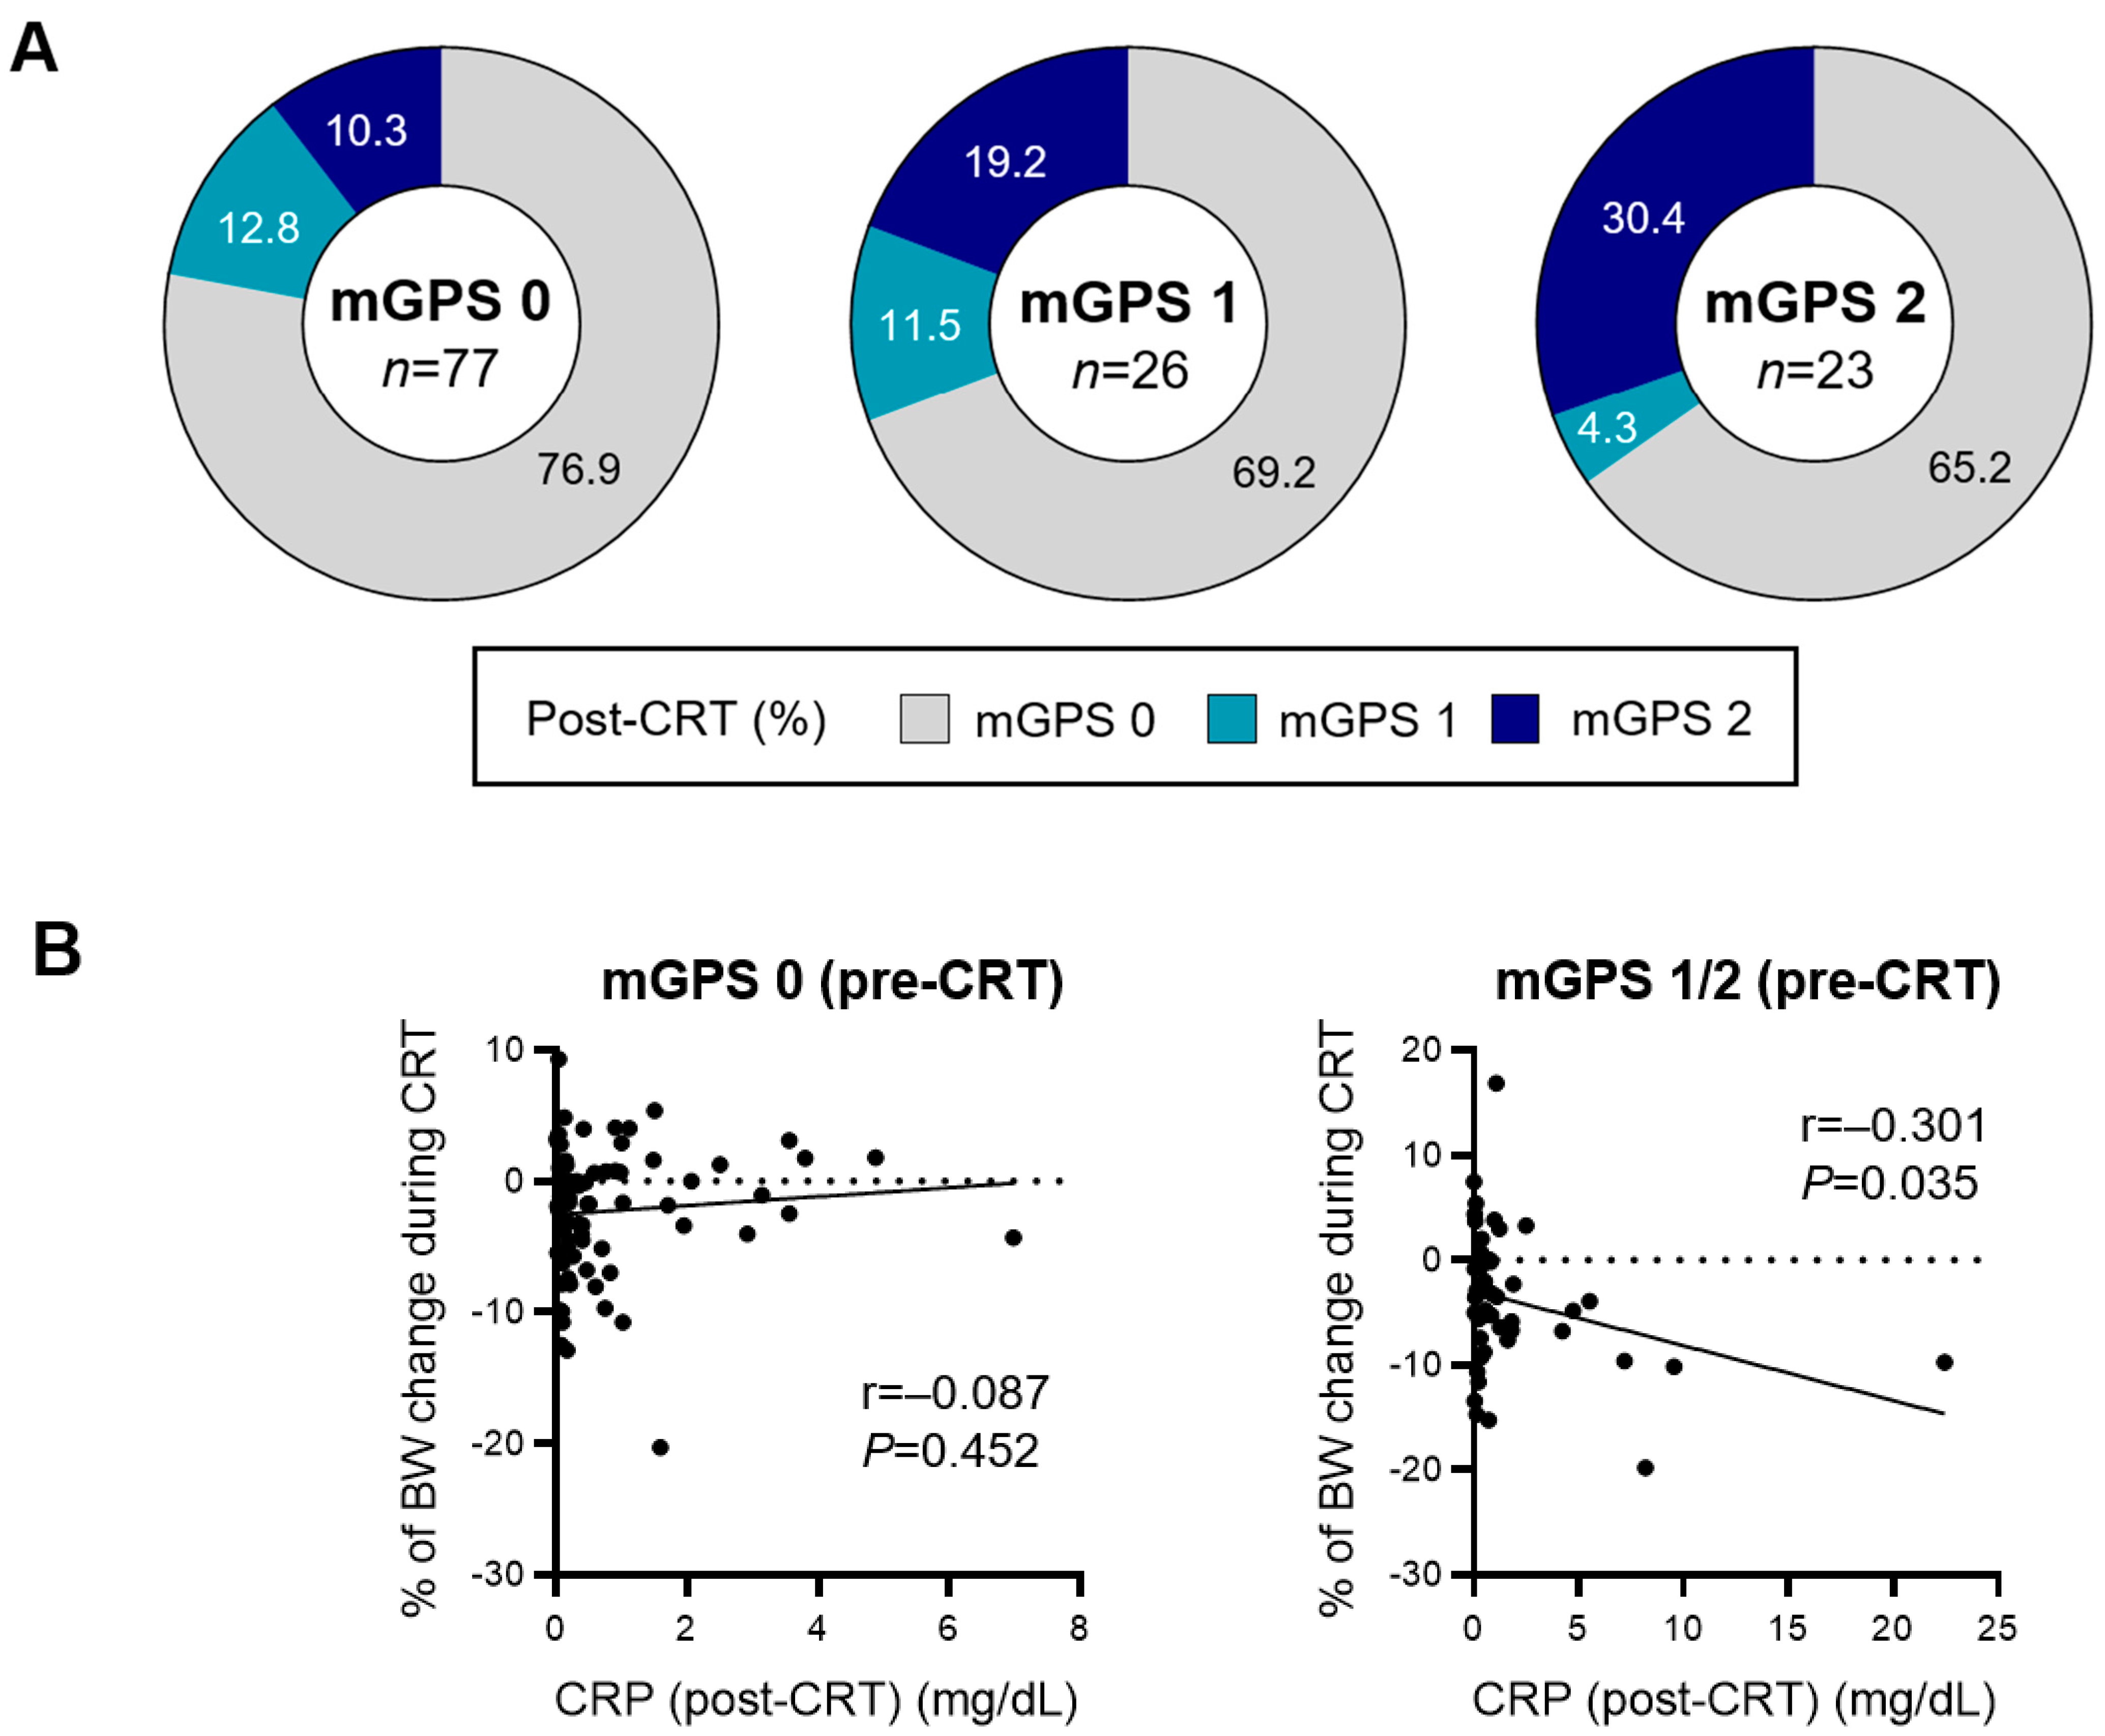
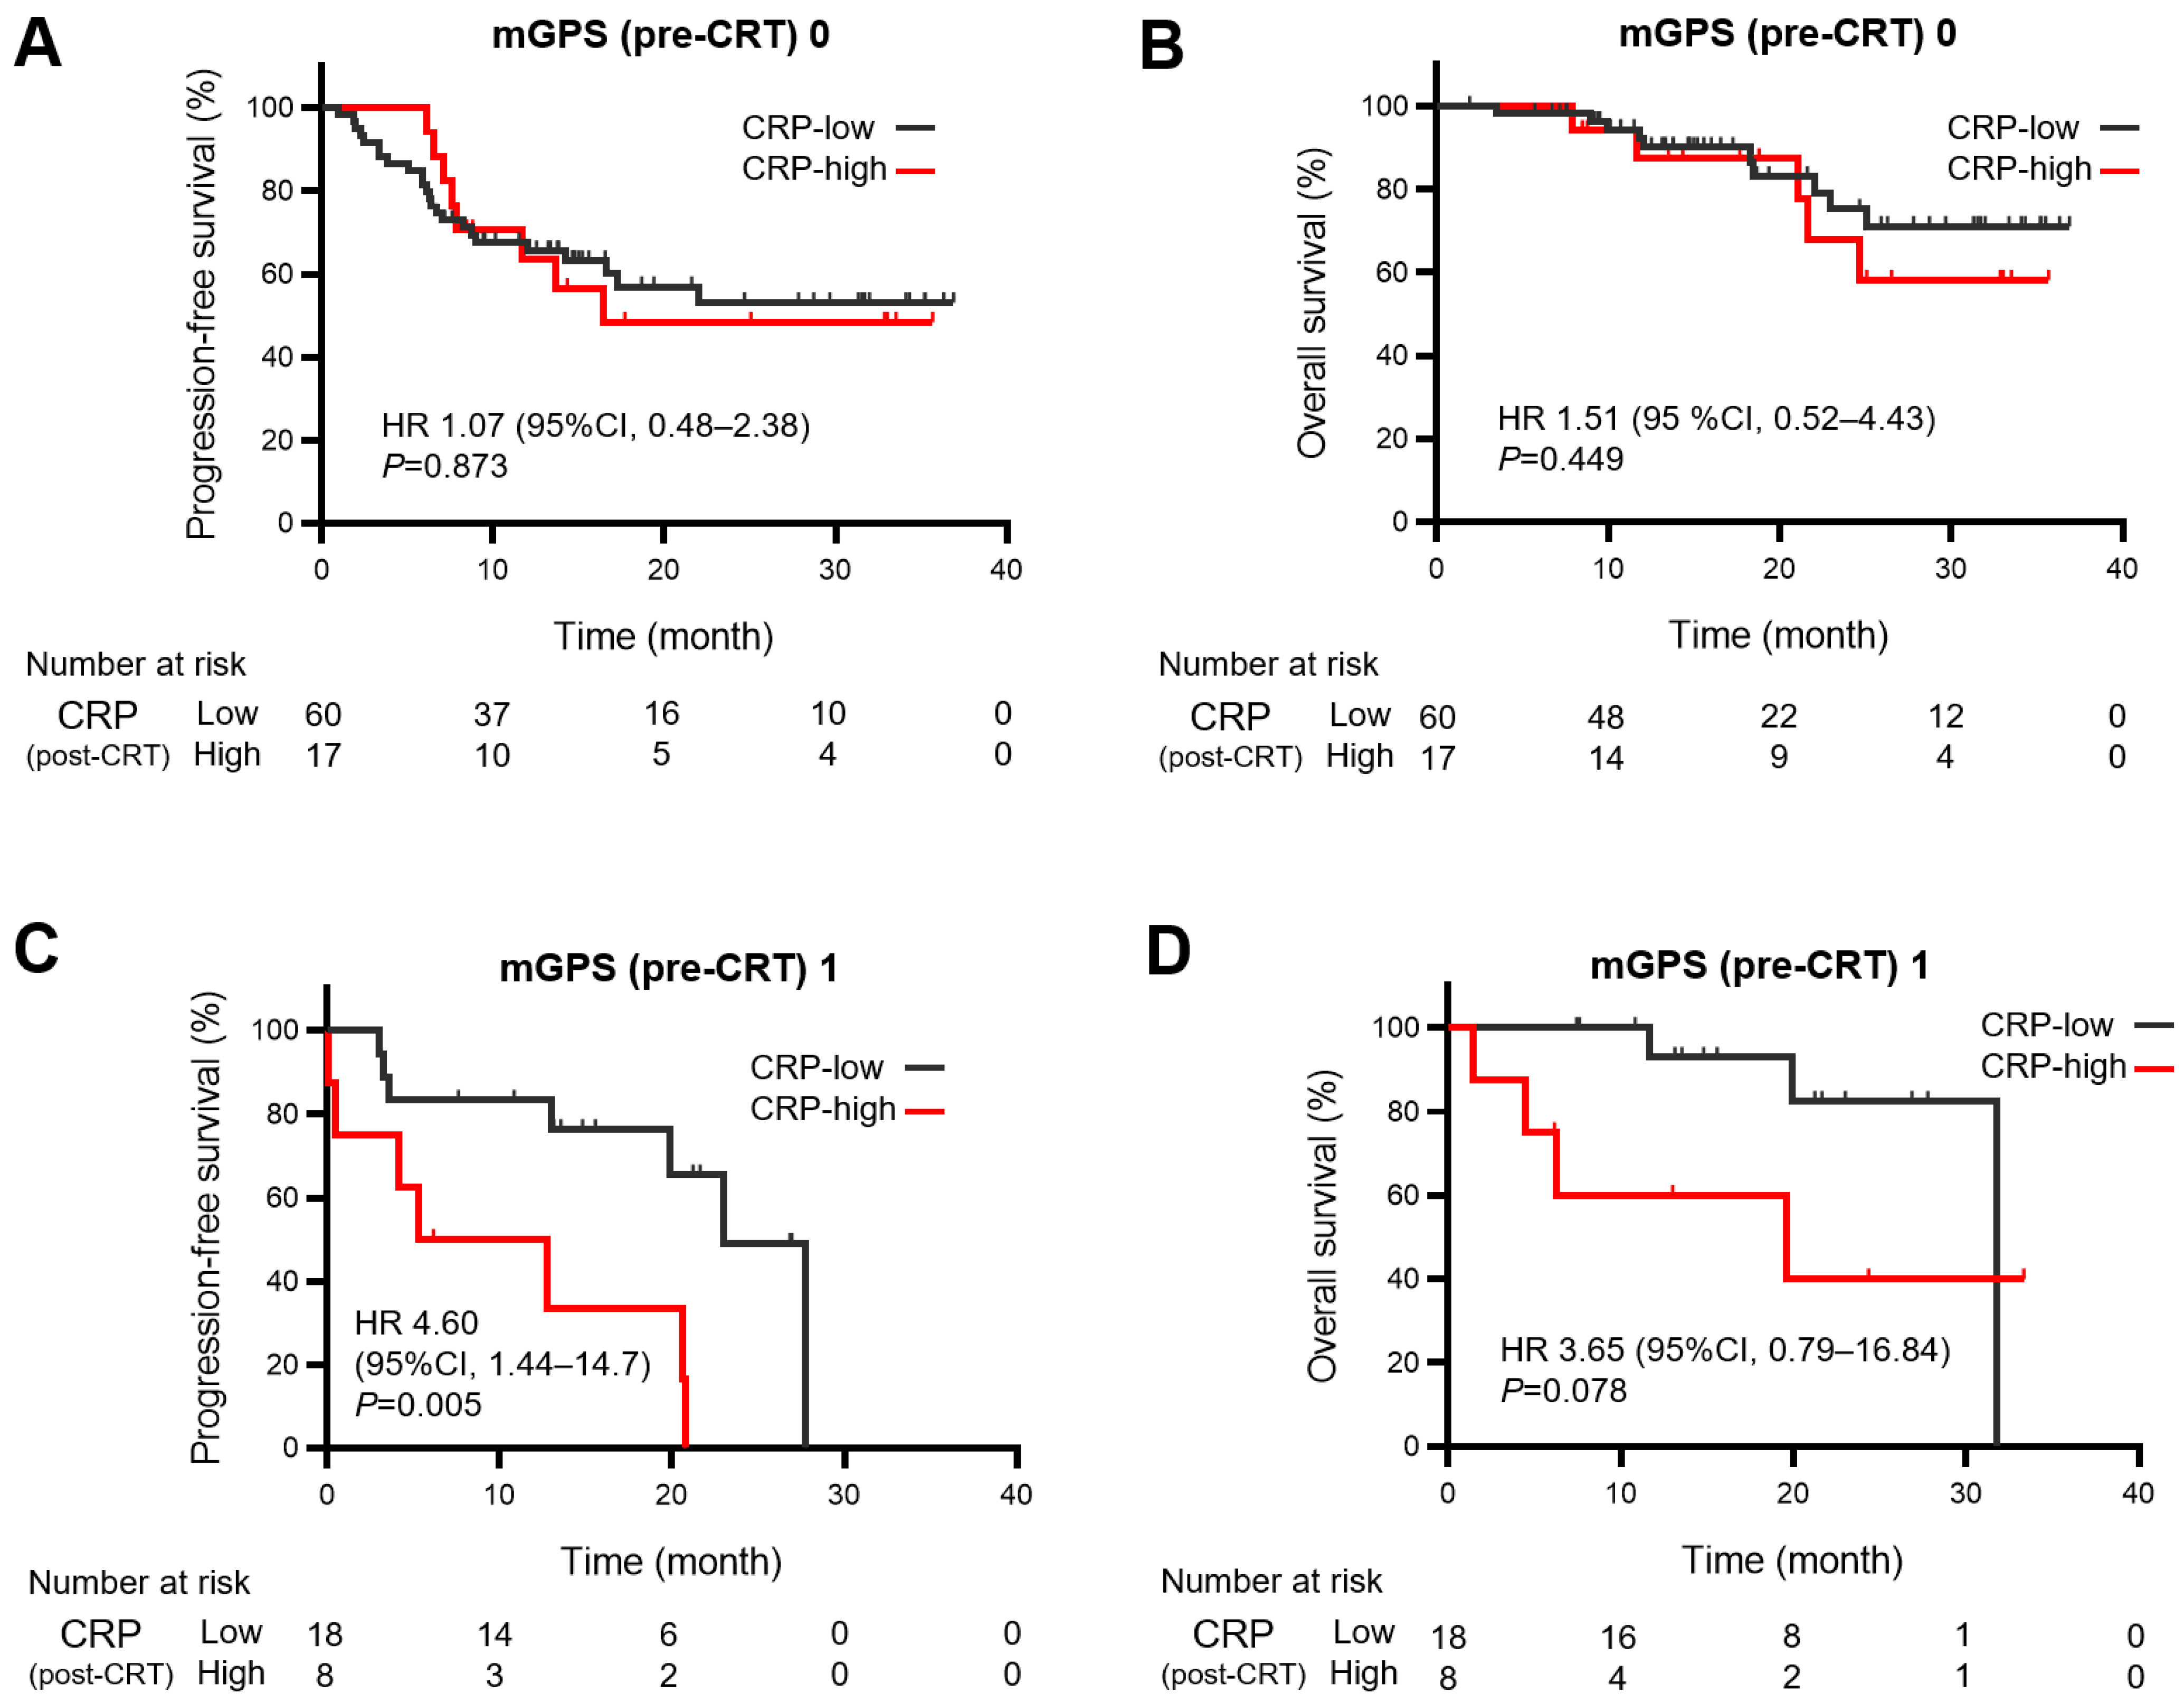
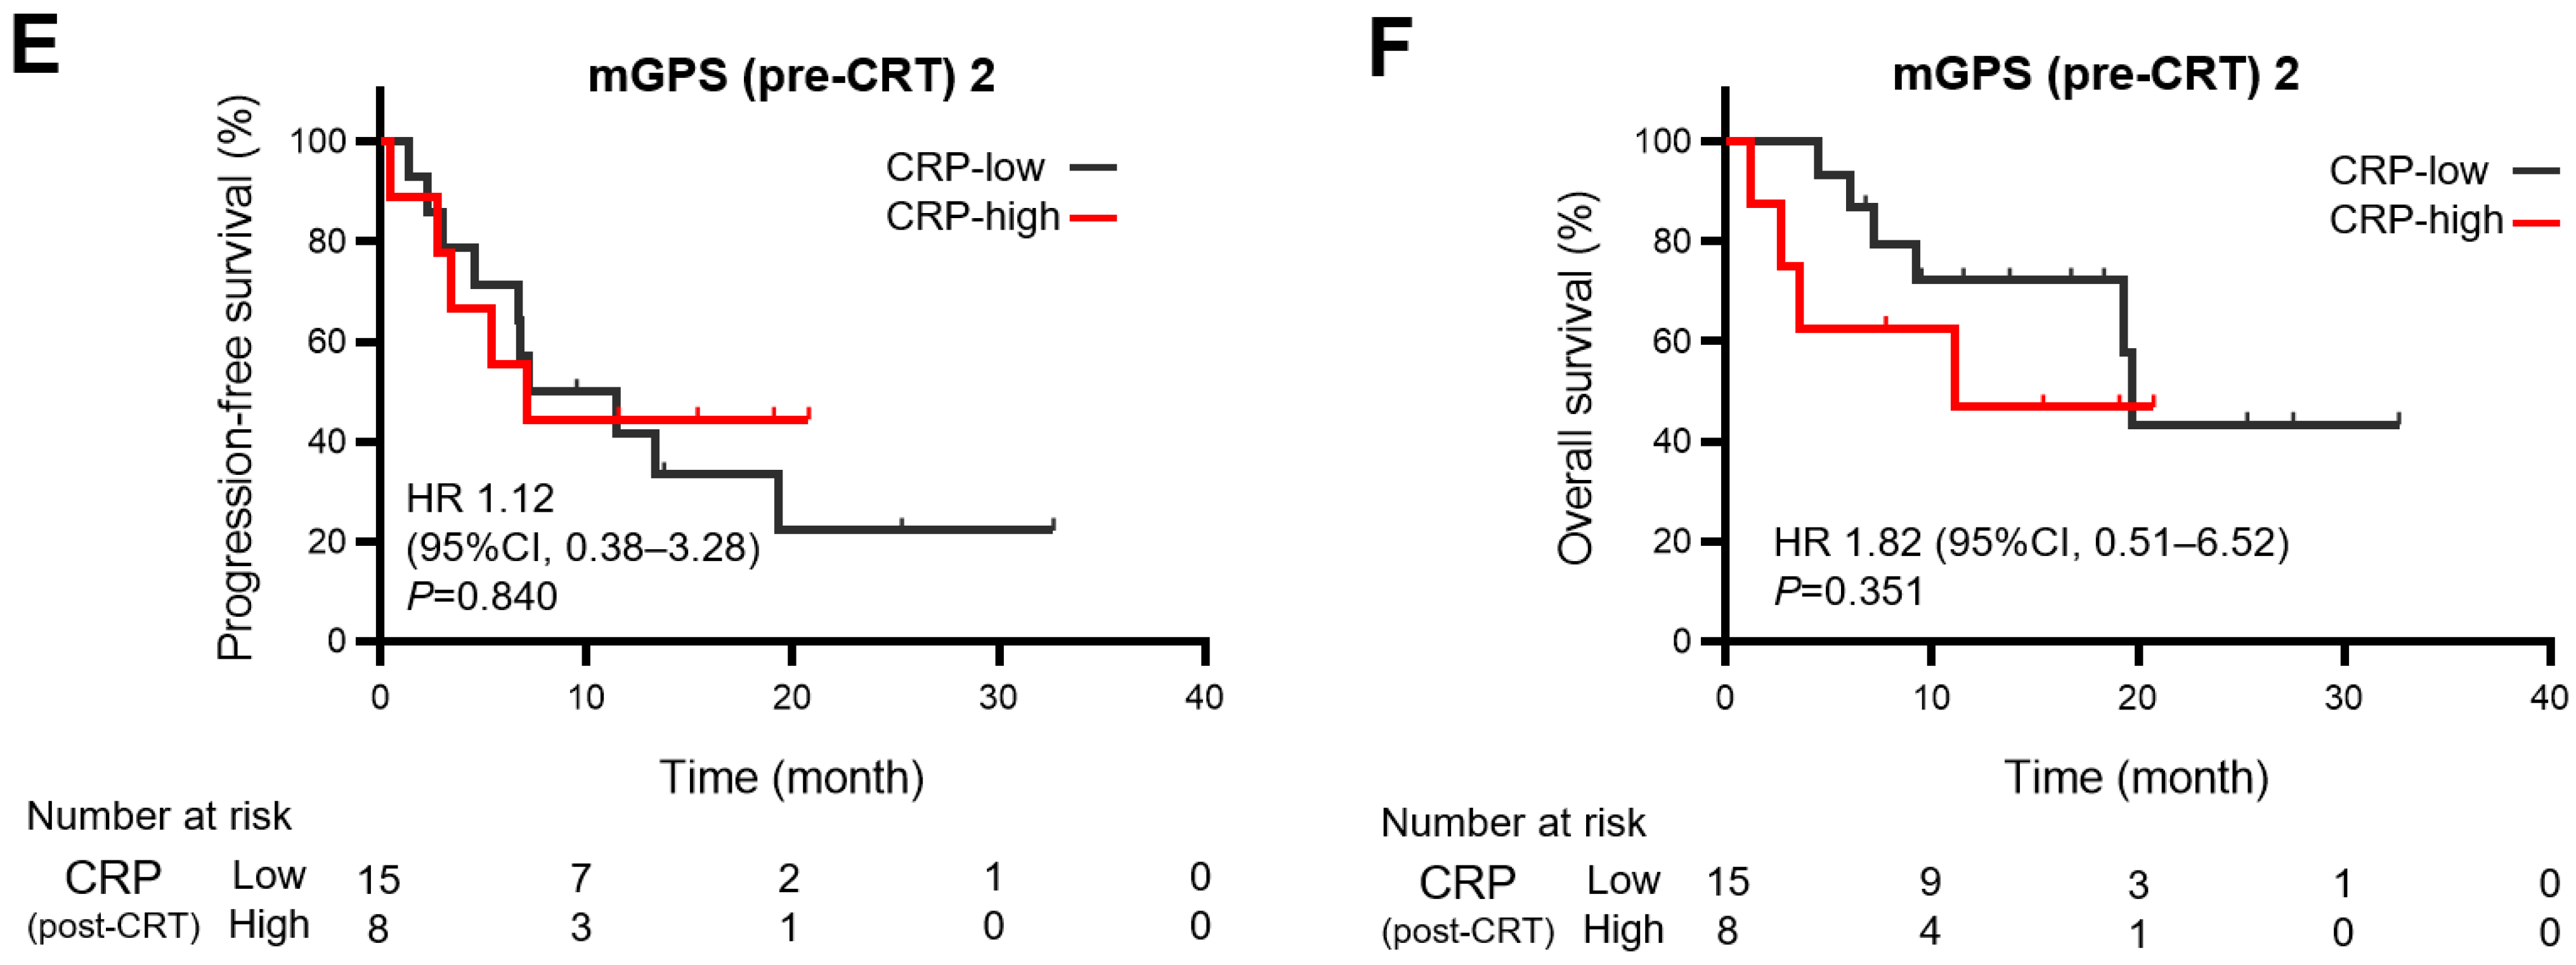
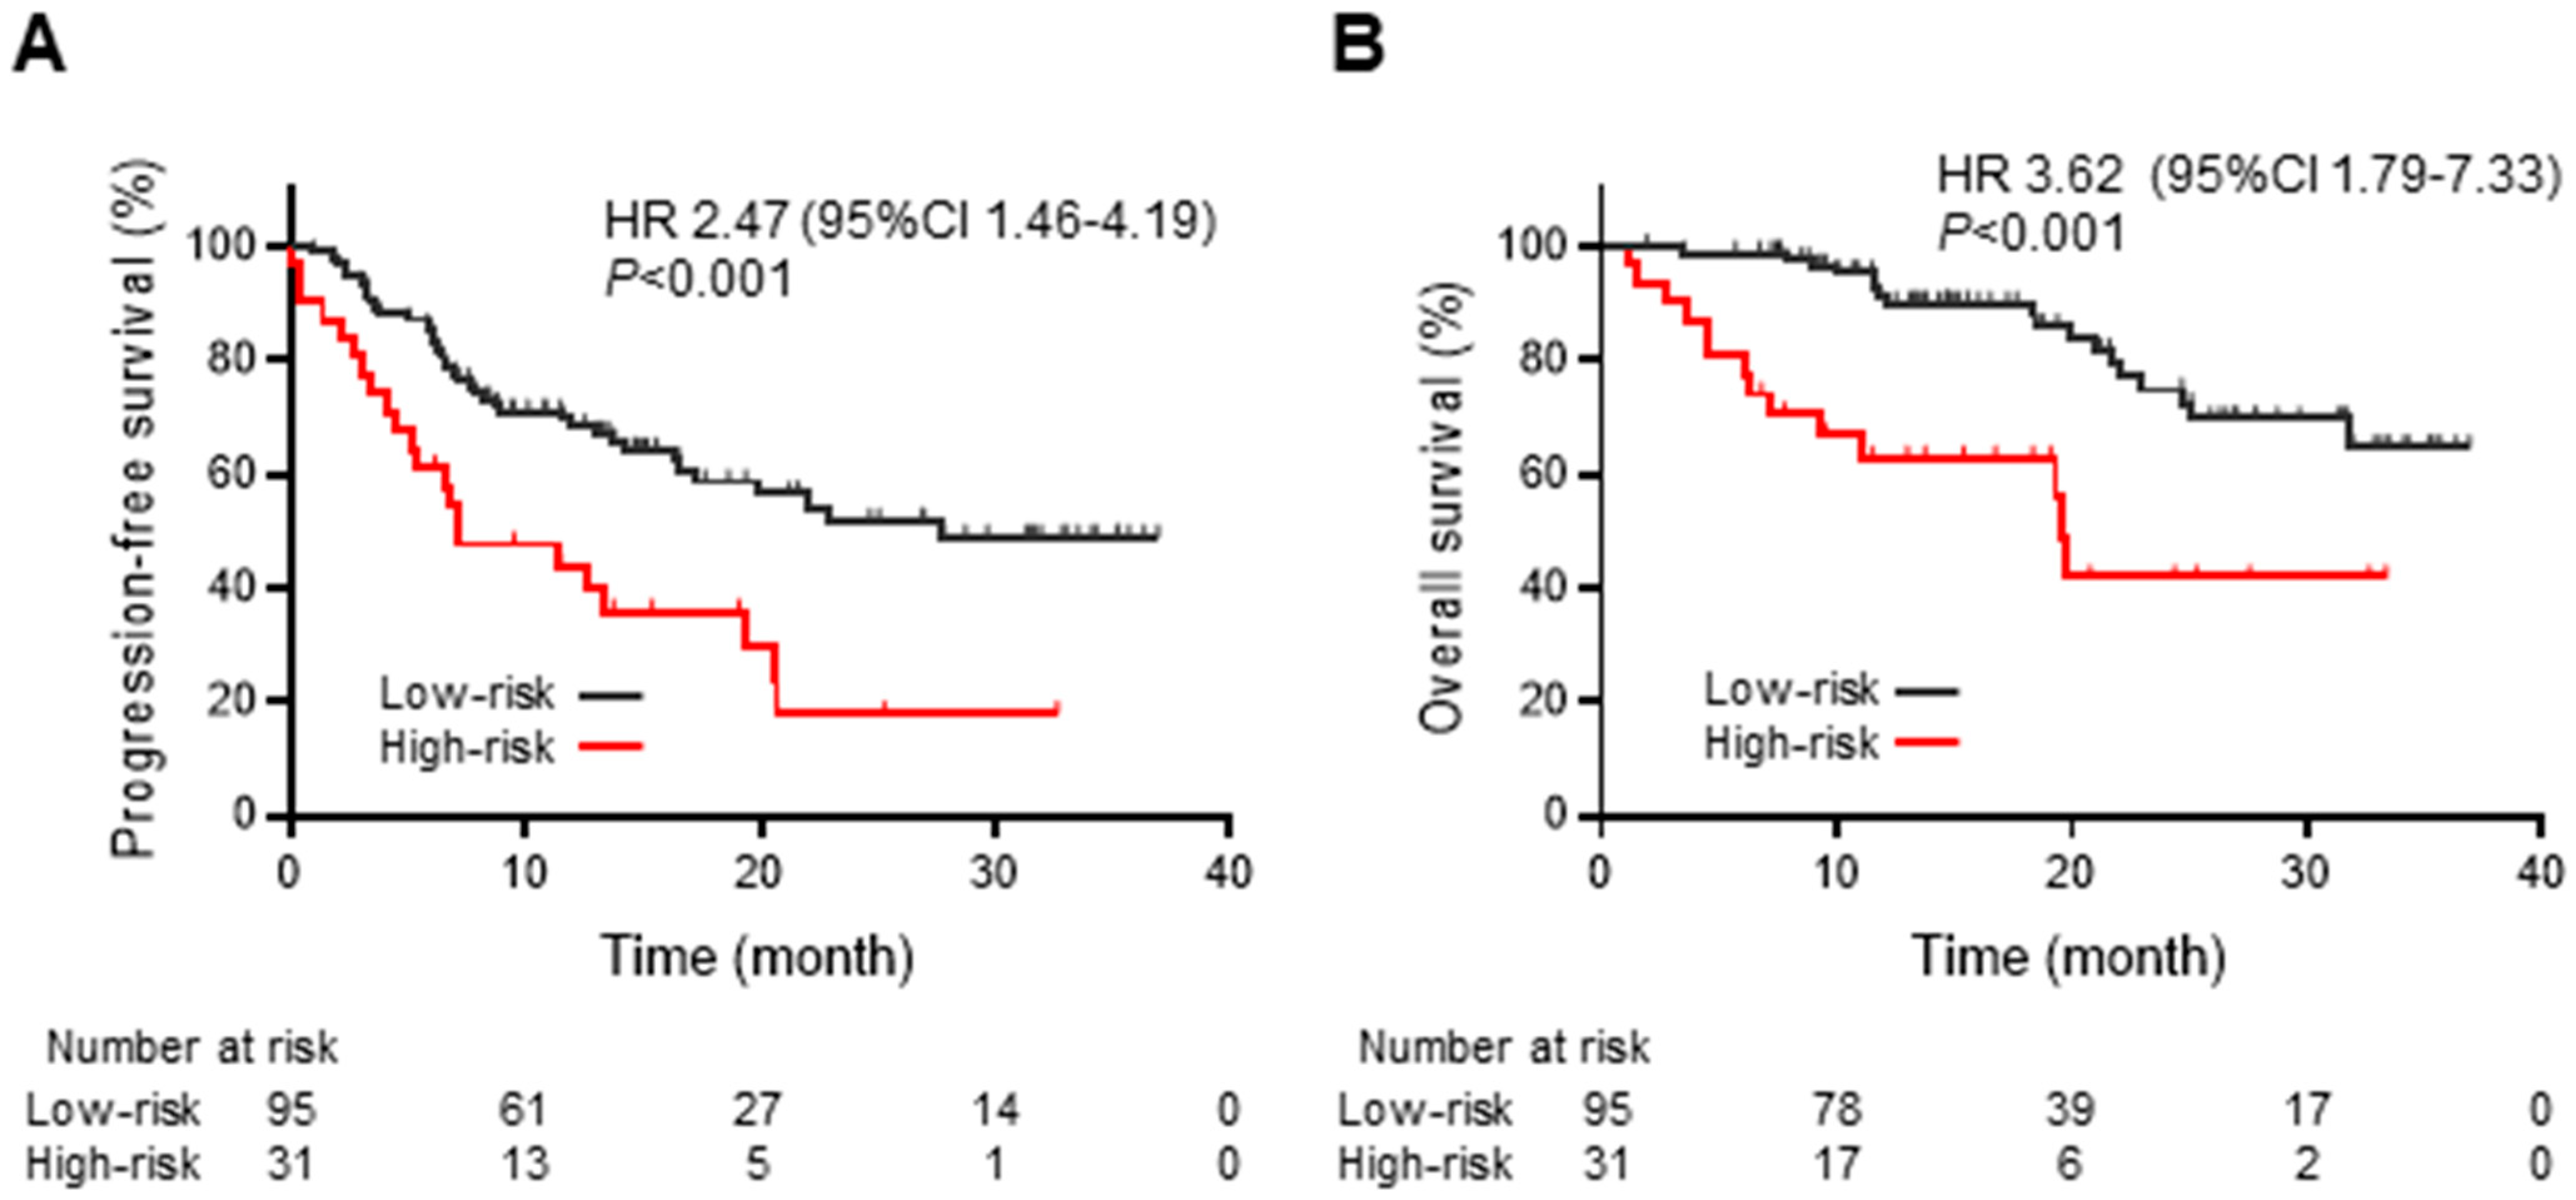
3.4. Relationship between Persistent Inflammation after Chemoradiotherapy and Survival Outcomes of Durvalumab Consolidation

The high-risk group had a significantly shorter median PFS of 7.2 months (95% CI: 4.5–19.3) compared with that of the low-risk group, which was 27.8 months (95% CI: 16.6-not reached [NR]) (HR: 2.47 [95% CI: 1.46–4.19], p < 0.001) (Figure 3A). Similarly, the median OS in the high-risk group was significantly shorter compared with that in the low-risk group (19.6 months [95% CI: 9.3–NR] vs. NR [95% CI: 31.7–NR], HR: 3.62 [95% CI: 1.79–7.33], p < 0.001) (Figure 3B).
In the multivariate analysis adjusted for age, sex, histology, and smoking history, the high-risk group with persistent inflammation had shorter PFS and OS (HR for PFS: 2.28 [95% CI: 1.27–4.07, p = 0.006], HR for OS: 3.48 [95% CI: 1.60–7.57], p = 0.002) (Figure 4A,B).

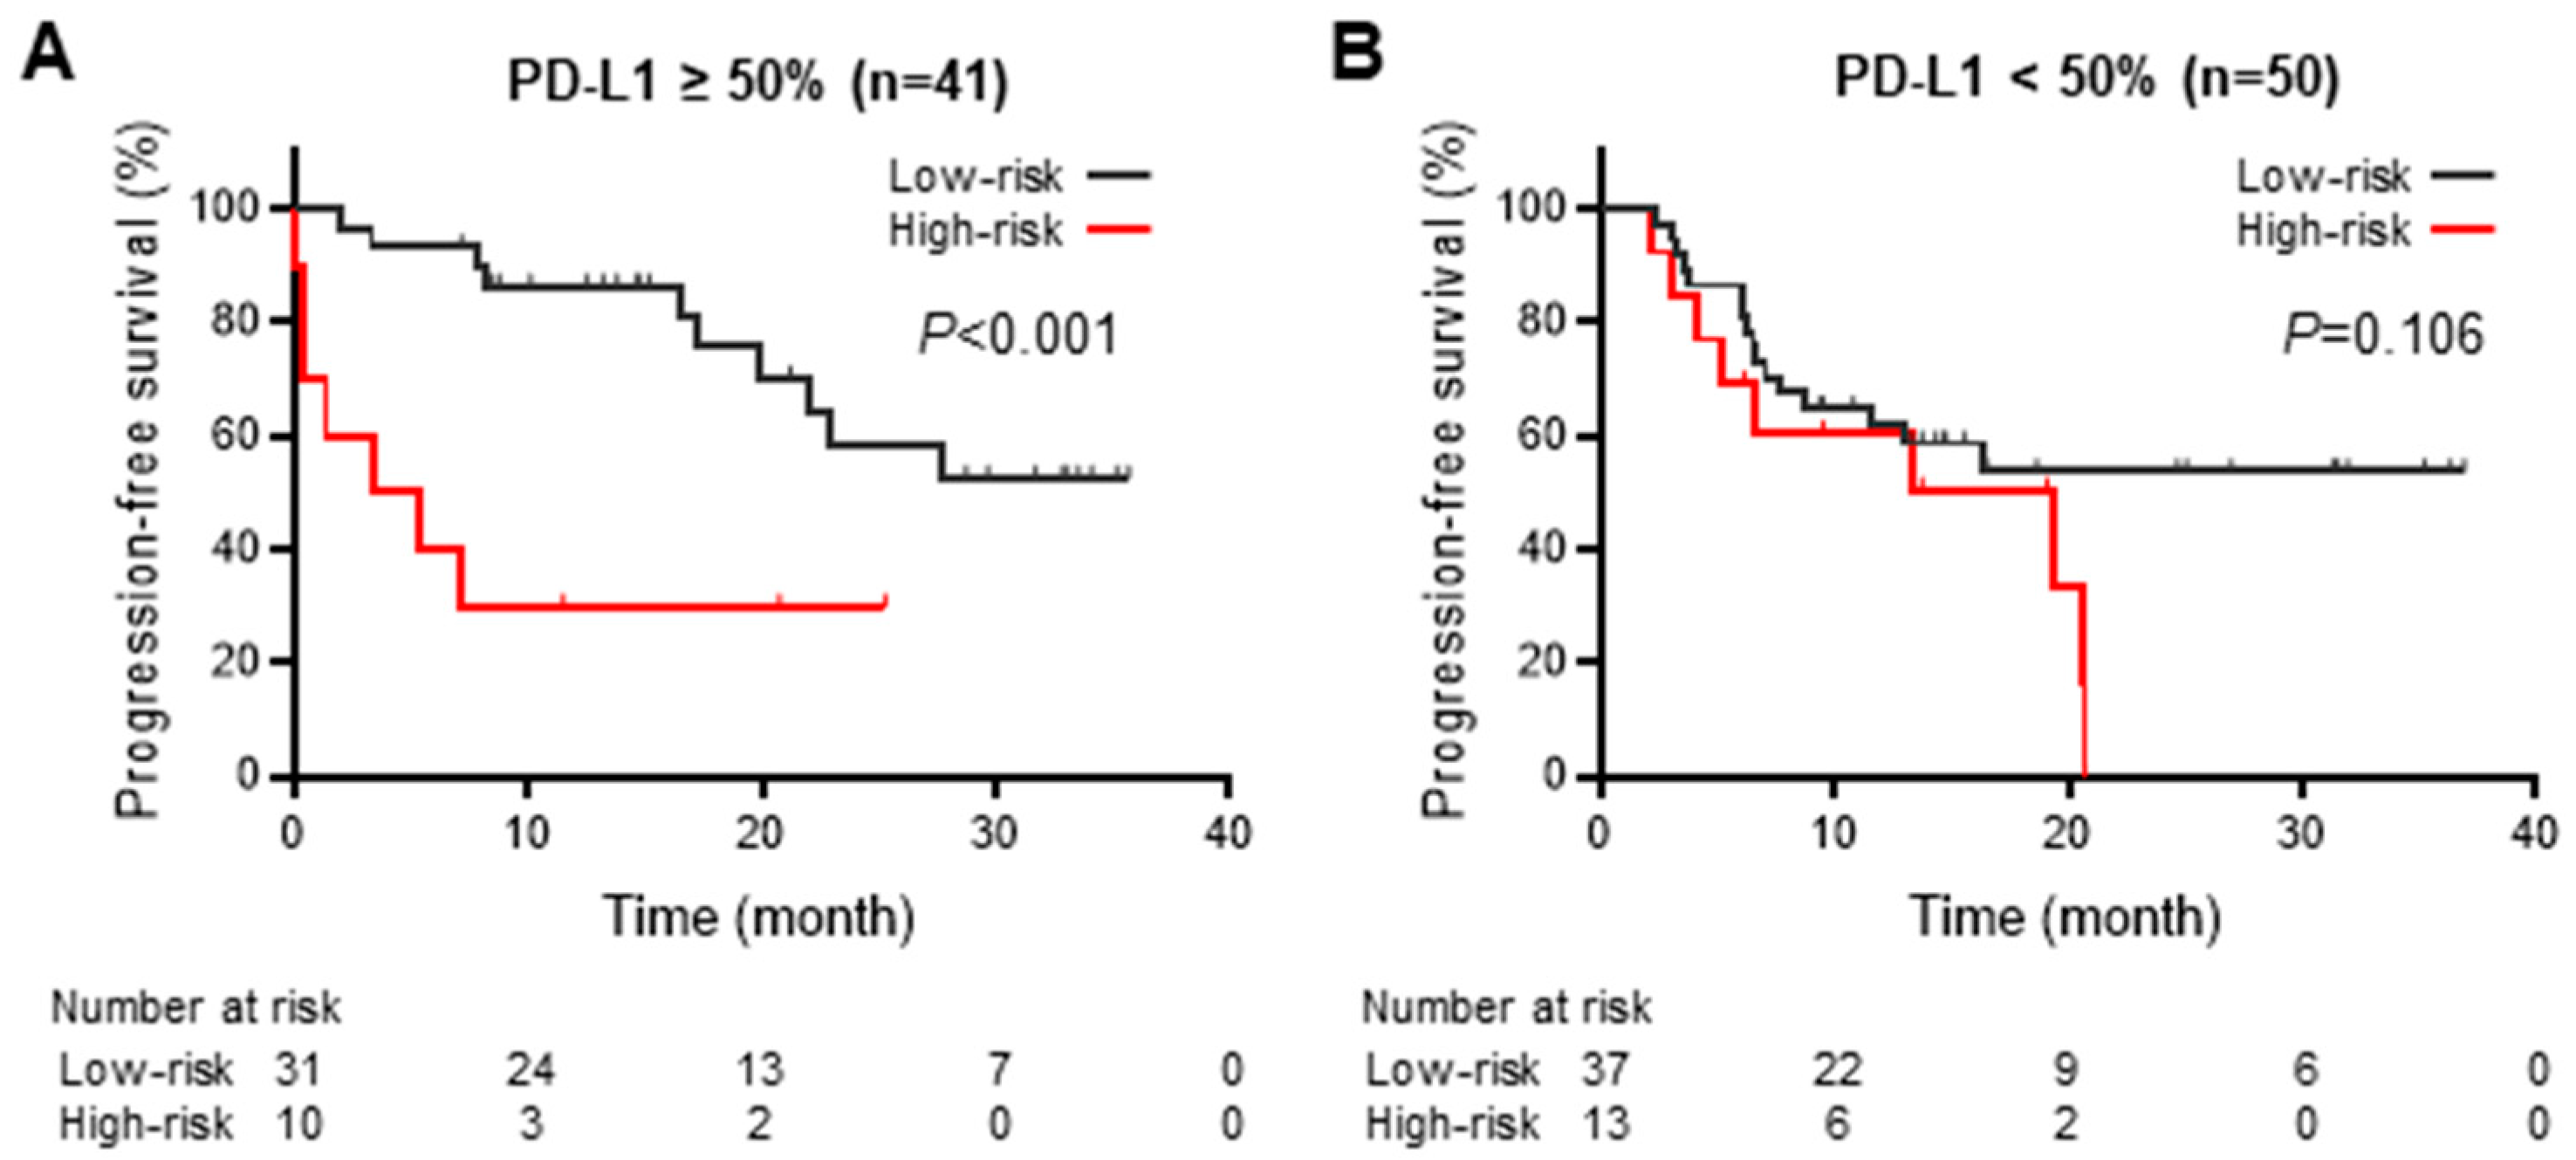
3.5. Impact of PD-L1 Expression on Progression-Free Survival during Durvalumab Consolidation

A subgroup analysis was performed on 91 (72.2%) patients with available PD-L1 expression status to evaluate the correlation between the impact of persistent inflammation and PD-L1 expression on tumor cells at baseline. In the subgroup with ≥50% PD-L1 expression on tumor cells, the high-risk group had significantly shorter PFS than the low-risk group (Figure 5A). Contrastingly, no significant difference existed between the high- and low-risk groups in the subgroup with <50% PD-L1 expression (Figure 5B).

3.6. Treatment-Related Adverse Events during Durvalumab Consolidation after Chemoradiotherapy

Treatment-related adverse events observed in ≥5% of the total population are presented in Table 4. Grade 3 or higher adverse events were more common in the high- than in the low-risk group (22.6% vs. 10.5%; p = 0.127). Additionally, toxicity-related treatment discontinuation was more frequent in the high- than in the low-risk group (35.7% vs. 20.5% of patients with terminated durvalumab administration).

4. Discussion

Preclinical studies have revealed that radiotherapy induces a potent antitumor immune response by inducing antigen presentation and the expression of class I major histocompatibility complexes, accompanied by the release of damage-associated molecular patterns [29]. The tumor microenvironment is easily altered by chemotherapy and radiotherapy. Tumors with increased levels of tumor-infiltrating lymphocytes (TILs) are associated with a better prognosis, whereas those with upregulated PD-L1 expression have a poorer prognosis [30]. Other chemoradiation-induced changes in the tumor microenvironment suggest that inflammatory cytokines are essential [31,32].
We evaluated immunological and nutritional markers to predict the PFS and OS of durvalumab consolidation after CRT and observed that pre- and post-CRT mGPS values were the essential predictors among the evaluated indices (Table 2). Furthermore, heterogeneity was observed among patients with a pre-CRT mGPS of 1 in terms of PFS and OS of durvalumab consolidation, differing among subgroups with post-CRT CRP levels of ≤1 mg/dL and >1 mg/dL (Figure 2C,D). Thus, a systemic inflammation-based prognostic risk classification was created by combining pre-CRT mGPS values and post-CRT CRP levels; the high-risk group had significantly shorter PFS and OS than the low-risk group (Figure 3A,B). This is the first report of an mGPS-based assessment of PFS and OS in durvalumab consolidation after CRT. While immunological and inflammatory markers, such as NLR [25] and CAR, [26] are potential predictive markers for durvalumab consolidation after CRT, this study revealed that mGPS, a combined marker of inflammation and nutrition, was strongly associated with survival outcomes than other markers.
The mechanism underlying the observed usefulness of combining pre-CRT mGPS and post-CRT CRP levels can be attributed to cancer cachexia, cancer-derived inflammation, and CRT-induced inflammation. The relationship between body weight change during CRT and post-CRT CRP levels was employed in determining the importance of elevated post-CRT CRP levels among patients with a pre-CRT mGPS of 1. mGPS, defined by serum CRP and albumin levels, is a simple and objective parameter for assessing cancer cachexia, focusing on nutrition and systemic inflammation. mGPS of 0, 1, and 2 correspond to non-cachexia, pre-cachexia, and cachexia, respectively [27]. CRT did not completely suppress tumor viability and tumor-derived inflammation in patients with persistent inflammation (i.e., elevated CRP levels) after CRT, because they relapsed earlier after durvalumab consolidation than those with improved inflammation (Figure 3A,B). However, evaluation of tumor viability at the time of CRT completion is challenging because of radiation-induced inflammation around the tumor and the time needed for tumor shrinkage after CRT. This retrospective study revealed that persistent inflammation after CRT was associated with shorter PFS and OS among patients with a pre-CRT mGPS of 1, but not patients with a pre-CRT mGPS of 0 or 2. This suggests that the inflammation induced by CRT would not lead to shorter PFS and OS in patients without inflammation prior to CRT (i.e., pre-CRT mGPS of 0) or cause further survival deterioration among patients with pre-existing cachexia (i.e., pre-CRT mGPS of 2). Therefore, tumor-derived inflammation, which partially reflects tumor viability, may be associated with poor therapeutic response to durvalumab consolidation after CRT and the development of cancer cachexia.
Cachexia is a poor prognostic factor for immunotherapy. The elevation of inflammatory cytokines, which is essential in cachexia development via the induction of skeletal muscle wasting and metabolic abnormalities, attenuates tumor immune responses, both directly and indirectly. IL-1β and tumor necrosis factor (TNF)-β reportedly contribute to forming the cold tumor immune microenvironment by suppressing TILs [33,34]. In contrast, elevated IL-6 levels suppress immune response activation by inhibiting glycogenesis in the liver and promoting glucocorticoid secretion [35]. Furthermore, inflammatory cytokines, including IL-6, IL-17, or TNF-α, upregulate PD-L1 expression [36,37]. Thus, inflammation might significantly impact the tumor response to PD-1/PD-L1 inhibition. Therefore, high PD-L1 expression on tumor cells—a good prognostic marker during anti-PD-1/PD-L1 therapy—does not invariably indicate a favorable antitumor response via PD-1/PD-L1 inhibition. This suggests that persistent inflammation that develops into cachexia or inappropriately increases PD-L1 expression may attenuate the immune response by PD-1/PD-L1 inhibition, even when PD-L1 is highly expressed on tumor cells. This could explain the shorter PFS of the high-risk group compared with that of the low-risk group in the subgroup with ≥50% PD-L1 expression on tumor cells (Figure 5A).
Another effect of systemic inflammation on survival outcomes is increased treatment-related adverse events. In patients with cachexia or pre-cachexia, elevated baseline levels of inflammatory cytokines and further inflammation due to treatment are associated with increased adverse events during immunotherapy [38]. In addition, patients with cachexia tend to have poor ECOG-PS and difficulty continuing chemotherapy, owing to adverse events [39]. Furthermore, platinum-based chemotherapy and chemoradiotherapy are associated with decreased plasma levels of ghrelin, an endogenous ligand for growth hormone secretagogue receptors. Ghrelin administration improves gastrointestinal symptoms [40,41]. Pharmacological intervention with anamorelin, a selective ghrelin receptor agonist, in addition to nutritional and exercise interventions, preserves and improves the nutritional status in patients with cachexia [42]. Thus, the early detection of cachexia or persistent inflammation in patients with locally advanced NSCLC treated with CRT reduces the risk of treatment discontinuation and maximizes the effect of durvalumab consolidation. This study suggests that patients with a pre-CRT mGPS of 1 and persistent systemic inflammation after CRT may experience early treatment discontinuation, owing to disease progression or treatment-related adverse events, which deteriorates survival outcomes.
This study has several limitations. First, the effect of unknown confounding factors could not be excluded because of the retrospective study design and limited sample size. For example, chronic obstructive pulmonary disease, smoking-related lung diseases, and the progression of atherosclerotic lesion would have led to the elevated CRP levels, affecting the results. Second, the data were based on medical records, rendering it challenging to accurately differentiate the source of persistent inflammation after CRT. Third, the cutoff values for various predictive markers were selected from previous reports. Therefore, using biomarkers and optimal cutoff values should be clarified in prospective studies with large sample sizes. The effect of non-pharmacological interventions, including nutritional management and exercise guidance, and pharmacological interventions for cachexia on the outcomes of durvalumab consolidation therapy should also be evaluated.

5. Conclusions

This study demonstrated that pre- and post-CRT mGPS values were the essential predictors of immunological and nutritional markers. Additionally, combining pre-CRT mGPS values and post-CRT CRP levels in patients with locally advanced NSCLC helped to predict the PFS and OS of durvalumab consolidation after CRT.

Supplementary Materials

The following supporting information can be downloaded at: https://www.mdpi.com/article/10.3390/cancers15174358/s1, Figure S1. Patient flow-diagram.

Author Contributions

Conceptualization, K.T. (Keiko Tanimura), T.T., R.H., S.S. and M.F.; methodology, Y.C., K.U., Y.K., M.H. and T.Y.; validation, T.T., A.Y., R.H., S.S., M.F., Y.C., K.U., S.T., Y.K., M.H. and T.Y.; formal analysis, K.T. (Keiko Tanimura), T.T., A.Y., S.T. and K.T. (Koichi Takayama); investigation, K.T. (Keiko Tanimura); resources, K.T. (Keiko Tanimura), R.H., S.G., S.S., M.F., Y.C., K.U., Y.K. and M.H.; data curation, K.T. (Keiko Tanimura), T.T., A.Y., R.H., S.G., S.T., Y.K. and T.Y.; writing original draft preparation, K.T. (Keiko Tanimura) and T.T.; writing review and editing, T.T.; visualization, K.T. (Keiko Tanimura); supervision, K.T. (Koichi Takayama). All authors have read and agreed to the published version of the manuscript.

Funding

This research received no external funding.

Institutional Review Board Statement

The study was conducted in accordance with the Declaration of Helsinki, and was approved by the Institutional Review Board of the Japanese Red Cross Kyoto Daini Hospital (protocol code: S2021-12, 8 July 2021) and the committee of each participating hospital.

Informed Consent Statement

Patient consent was waived because this was a retrospective observational study. Patients were allowed to opt out of the research’s use of their data, and the related information was publicly available on each hospital’s website.

Data Availability Statement

The datasets generated and analyzed in the current study are available from the corresponding author upon reasonable request.

Conflicts of Interest

The authors declare no conflict of interest.

References

  1. Antonia, S.J.; Villegas, A.; Daniel, D.; Vicente, D.; Murakami, S.; Hui, R.; Kurata, T.; Chiappori, A.; Lee, K.H.; De Wit, M.; et al. Overall Survival with Durvalumab after Chemoradiotherapy in Stage III NSCLC. N. Engl. J. Med. 2018, 379, 2342–2350. [Google Scholar] [CrossRef]
  2. Doroshow, D.B.; Bhalla, S.; Beasley, M.B.; Sholl, L.M.; Kerr, K.M.; Gnjatic, S.; Wistuba, I.I.; Rimm, D.L.; Tsao, M.S.; Hirsch, F.R. PD-L1 as a biomarker of response to immune-checkpoint inhibitors. Nat. Rev. Clin. Oncol. 2021, 18, 345–362. [Google Scholar] [CrossRef]
  3. Marabelle, A.; Fakih, M.; Lopez, J.; Shah, M.; Shapira-Frommer, R.; Nakagawa, K.; Chung, H.C.; Kindler, H.L.; Lopez-Martin, J.A.; Miller, W.H., Jr.; et al. Association of tumour mutational burden with outcomes in patients with advanced solid tumours treated with pembrolizumab: Prospective biomarker analysis of the multicohort, open-label, phase 2 KEYNOTE-158 study. Lancet Oncol. 2020, 21, 1353–1365. [Google Scholar] [CrossRef]
  4. Lebow, E.S.; Shepherd, A.; Eichholz, J.E.; Offin, M.; Gelblum, D.Y.; Wu, A.J.; Simone, C.B.; Schoenfeld, A.J.; Jones, D.R.; Rimner, A.; et al. Analysis of Tumor Mutational Burden, Progression-Free Survival, and Local-Regional Control in Patents with Locally Advanced Non-Small Cell Lung Cancer Treated with Chemoradiation and Durvalumab. JAMA Netw. Open 2023, 6, e2249591. [Google Scholar] [CrossRef]
  5. Mantovani, A.; Barajon, I.; Garlanda, C. IL-1 and IL-1 regulatory pathways in cancer progression and therapy. Immunol. Rev. 2018, 281, 57–61. [Google Scholar] [CrossRef]
  6. Carmi, Y.; Dotan, S.; Rider, P.; Kaplanov, I.; White, M.R.; Baron, R.; Abutbul, S.; Huszar, M.; Dinarello, C.A.; Apte, R.N.; et al. The Role of IL-1β in the Early Tumor Cell–Induced Angiogenic Response. J. Immunol. 2013, 190, 3500–3509. [Google Scholar] [CrossRef]
  7. Kitamura, H.; Ohno, Y.; Toyoshima, Y.; Ohtake, J.; Homma, S.; Kawamura, H.; Takahashi, N.; Taketomi, A. Interleukin-6/STAT3 signaling as a promising target to improve the efficacy of cancer immunotherapy. Cancer Sci. 2017, 108, 1947–1952. [Google Scholar] [CrossRef]
  8. Fearon, K.; Strasser, F.; Anker, S.D.; Bosaeus, I.; Bruera, E.; Fainsinger, R.L.; Jatoi, A.; Loprinzi, C.; MacDonald, N.; Mantovani, G.; et al. Definition and classification of cancer cachexia: An international consensus. Lancet Oncol. 2011, 12, 489–495. [Google Scholar] [CrossRef]
  9. Kamp, C.O.D.; Langen, R.; Minnaard, R.; Kelders, M.; Snepvangers, F.; Hesselink, M.; Dingemans, A.; Schols, A. Pre-cachexia in patients with stages I–III non-small cell lung cancer: Systemic inflammation and functional impairment without activation of skeletal muscle ubiquitin proteasome system. Lung Cancer 2012, 76, 112–117. [Google Scholar] [CrossRef]
  10. Smith, I.J.; Aversa, Z.; Hasselgren, P.-O.; Pacelli, F.; Rosa, F.; Doglietto, G.B.; Bossola, M. CALPAIN activity is increased in skeletal muscle from gastric cancer patients with no or minimal weight loss. Muscle Nerve 2011, 43, 410–414. [Google Scholar] [CrossRef]
  11. Miyawaki, T.; Naito, T.; Kodama, A.; Nishioka, N.; Miyawaki, E.; Mamesaya, N.; Kawamura, T.; Kobayashi, H.; Omori, S.; Wakuda, K.; et al. Desensitizing Effect of Cancer Cachexia on Immune Checkpoint Inhibitors in Patients with Advanced NSCLC. JTO Clin. Res. Rep. 2020, 1, 100020. [Google Scholar] [CrossRef] [PubMed]
  12. Morimoto, K.; Uchino, J.; Yokoi, T.; Kijima, T.; Goto, Y.; Nakao, A.; Hibino, M.; Takeda, T.; Yamaguchi, H.; Takumi, C.; et al. Impact of cancer cachexia on the therapeutic outcome of combined chemoimmunotherapy in patients with non-small cell lung cancer: A retrospective study. OncoImmunology 2021, 10, 1950411. [Google Scholar] [CrossRef] [PubMed]
  13. Bagley, S.J.; Kothari, S.; Aggarwal, C.; Bauml, J.M.; Alley, E.W.; Evans, T.L.; Kosteva, J.A.; Ciunci, C.A.; Gabriel, P.E.; Thompson, J.C.; et al. Pretreatment neutrophil-to-lymphocyte ratio as a marker of outcomes in nivolumab-treated patients with advanced non-small-cell lung cancer. Lung Cancer 2017, 106, 1–7. [Google Scholar] [CrossRef] [PubMed]
  14. Valero, C.; Lee, M.; Hoen, D.; Weiss, K.; Kelly, D.W.; Adusumilli, P.S.; Paik, P.K.; Plitas, G.; Ladanyi, M.; Postow, M.A.; et al. Pretreatment neutrophil-to-lymphocyte ratio and mutational burden as biomarkers of tumor response to immune checkpoint inhibitors. Nat. Commun. 2021, 12, 729. [Google Scholar] [CrossRef] [PubMed]
  15. Zhou, X.; Du, Y.; Huang, Z.; Xu, J.; Qiu, T.; Wang, J.; Wang, T.; Zhu, W.; Liu, P. Prognostic Value of PLR in Various Cancers: A Meta-Analysis. PLoS ONE 2014, 9, e101119. [Google Scholar] [CrossRef]
  16. Gu, X.; Sun, S.; Gao, X.-S.; Xiong, W.; Qin, S.; Qi, X.; Ma, M.; Li, X.; Zhou, D.; Wang, W.; et al. Prognostic value of platelet to lymphocyte ratio in non-small cell lung cancer: Evidence from 3430 patients. Sci. Rep. 2016, 6, 23893. [Google Scholar] [CrossRef]
  17. Frey, A.; Martin, D.; D’cruz, L.; Fokas, E.; Rödel, C.; Fleischmann, M. C-Reactive Protein to Albumin Ratio as Prognostic Marker in Locally Advanced Non-Small Cell Lung Cancer Treated with Chemoradiotherapy. Biomedicines 2022, 10, 598. [Google Scholar] [CrossRef]
  18. Kinoshita, A.; Onoda, H.; Imai, N.; Iwaku, A.; Oishi, M.; Tanaka, K.; Fushiya, N.; Koike, K.; Nishino, H.; Matsushima, M. The C-Reactive Protein/Albumin Ratio, a Novel Inflammation-Based Prognostic Score, Predicts Outcomes in Patients with Hepatocellular Carcinoma. Ann. Surg. Oncol. 2015, 22, 803–810. [Google Scholar] [CrossRef]
  19. Mountzios, G.; Samantas, E.; Senghas, K.; Zervas, E.; Krisam, J.; Samitas, K.; Bozorgmehr, F.; Kuon, J.; Agelaki, S.; Baka, S.; et al. Association of the advanced lung cancer inflammation index (ALI) with immune checkpoint inhibitor efficacy in patients with advanced non-small-cell lung cancer. ESMO Open 2021, 6, 100254. [Google Scholar] [CrossRef]
  20. Hu, B.; Yang, X.-R.; Xu, Y.; Sun, Y.-F.; Sun, C.; Guo, W.; Zhang, X.; Wang, W.-M.; Qiu, S.-J.; Zhou, J.; et al. Systemic Immune-Inflammation Index Predicts Prognosis of Patients after Curative Resection for Hepatocellular Carcinoma. Clin. Cancer Res. 2014, 20, 6212–6222. [Google Scholar] [CrossRef]
  21. Tian, B.-W.; Yang, Y.-F.; Yang, C.-C.; Yan, L.-J.; Ding, Z.-N.; Liu, H.; Xue, J.-S.; Dong, Z.-R.; Chen, Z.-Q.; Hong, J.-G.; et al. Systemic immune–inflammation index predicts prognosis of cancer immunotherapy: Systemic review and meta-analysis. Immunotherapy 2022, 14, 1481–1496. [Google Scholar] [CrossRef]
  22. Mezquita, L.; Auclin, E.; Ferrara, R.; Charrier, M.; Remon, J.; Planchard, D.; Ponce, S.; Ares, L.P.; Leroy, L.; Audigier-Valette, C.; et al. Association of the lung immune prognostic index with immune checkpoint inhibitor outcomes in patients with advanced non-small cell lung cancer. JAMA Oncol. 2018, 4, 351–357. [Google Scholar] [CrossRef]
  23. Mcmillan, D.C. An inflammation-based prognostic score and its role in the nutrition-based management of patients with cancer. Proc. Nutr. Soc. 2008, 67, 257–262. [Google Scholar] [CrossRef]
  24. Mcmillan, D.C. The systemic inflammation-based Glasgow Prognostic Score: A decade of experience in patients with cancer. Cancer Treat. Rev. 2013, 39, 534–540. [Google Scholar] [CrossRef]
  25. Chu, C.H.; Chiu, T.H.; Wang, C.C.; Chang, W.C.; Huang, A.C.; Liu, C.Y.; Wang, C.L.; Ko, H.W.; Chung, F.T.; Hsu, P.C.; et al. Consolidation treatment of durvalumab after chemoradiation in real-world patients with stage III unresectable non-small cell lung cancer. Thorac. Cancer 2020, 11, 1541–1549. [Google Scholar] [CrossRef]
  26. Araki, T.; Tateishi, K.; Komatsu, M.; Sonehara, K.; Wasamoto, S.; Koyama, S.; Yoshiike, F.; Hama, M.; Nishie, K.; Kondo, D.; et al. Predictive value of post-treatment C-reactive protein-to-albumin ratio in locally advanced non-small cell lung cancer patients receiving durvalumab after chemoradiotherapy. Thorac. Cancer 2022, 13, 2031–2040. [Google Scholar] [CrossRef]
  27. Silva, G.A.D.; Wiegert, E.V.M.; Calixto-Lima, L.; Oliveira, L.C. Clinical utility of the modified Glasgow Prognostic Score to classify cachexia in patients with advanced cancer in palliative care. Clin. Nutr. 2020, 39, 1587–1592. [Google Scholar] [CrossRef]
  28. Eisenhauer, E.A.; Therasse, P.; Bogaerts, J.; Schwartz, L.H.; Sargent, D.; Ford, R.; Dancey, J.; Arbuck, S.; Gwyther, S.; Mooney, M.; et al. New response evaluation criteria in solid tumours: Revised RECIST guideline (version 1.1). Eur. J. Cancer 2009, 45, 228–247. [Google Scholar] [CrossRef]
  29. Sharabi, A.B.; Lim, M.; Deweese, T.L.; Drake, C.G. Radiation and checkpoint blockade immunotherapy: Radiosensitisation and potential mechanisms of synergy. Lancet Oncol. 2015, 16, e498–e509. [Google Scholar] [CrossRef]
  30. Choe, E.A.; Cha, Y.J.; Kim, J.H.; Pyo, K.H.; Hong, M.H.; Park, S.Y.; Shim, H.S.; Jung, I.; Lee, C.Y.; Cho, B.C.; et al. Dynamic changes in PD-L1 expression and CD8+ T cell infiltration in non-small cell lung cancer following chemoradiation therapy. Lung Cancer 2019, 136, 30–36. [Google Scholar] [CrossRef]
  31. Whiteside, T.L. The tumor microenvironment and its role in promoting tumor growth. Oncogene 2008, 27, 5904–5912. [Google Scholar] [CrossRef] [PubMed]
  32. Petitprez, F.; Meylan, M.; de Reyniès, A.; Sautès-Fridman, C.; Fridman, W.H. The tumor microenvironment in the response to immune checkpoint blockade therapies. Front. Immunol. 2020, 11, 784. [Google Scholar] [CrossRef] [PubMed]
  33. Bertrand, F.; Montfort, A.; Marcheteau, E.; Imbert, C.; Gilhodes, J.; Filleron, T.; Rochaix, P.; Andrieu-Abadie, N.; Levade, T.; Meyer, N.; et al. TNFalpha blockade overcomes resistance to anti-PD-1 in experimental melanoma. Nat. Commun. 2017, 8, 2256. [Google Scholar] [CrossRef] [PubMed]
  34. Kaplanov, I.; Carmi, Y.; Kornetsky, R.; Shemesh, A.; Shurin, G.V.; Shurin, M.R.; Dinarello, C.A.; Voronov, E.; Apte, R.N. Blocking IL-1β reverses the immunosuppression in mouse breast cancer and synergizes with anti–PD-1 for tumor abrogation. Proc. Natl. Acad. Sci. USA 2019, 116, 1361–1369. [Google Scholar] [CrossRef] [PubMed]
  35. Flint, T.R.; Janowitz, T.; Connell, C.M.; Roberts, E.W.; Denton, A.E.; Coll, A.P.; Jodrell, D.I.; Fearon, D.T. Tumor-induced IL-6 reprograms host metabolism to suppress anti-tumor immunity. Cell Metab. 2016, 24, 672–684. [Google Scholar] [CrossRef] [PubMed]
  36. Shen, M.J.; Xu, L.J.; Yang, L.; Tsai, Y.; Keng, P.C.; Chen, Y.; Lee, S.O.; Chen, Y. Radiation alters PD-L1/NKG2D ligand levels in lung cancer cells and leads to immune escape from NK cell cytotoxicity via IL-6-MEK/Erk signaling pathway. Oncotarget 2017, 8, 80506–80520. [Google Scholar] [CrossRef]
  37. Wang, X.; Yang, L.; Huang, F.; Zhang, Q.; Liu, S.; Ma, L.; You, Z. Inflammatory cytokines IL-17 and TNF-α up-regulate PD-L1 expression in human prostate and colon cancer cells. Immunol. Lett. 2017, 184, 7–14. [Google Scholar] [CrossRef]
  38. Hailemichael, Y.; Johnson, D.H.; Abdel-Wahab, N.; Foo, W.C.; Bentebibel, S.E.; Daher, M.; Haymaker, C.; Wani, K.; Saberian, C.; Ogata, D.; et al. Interleukin-6 blockade abrogates immunotherapy toxicity and promotes tumor immunity. Cancer Cell 2022, 40, 509–523. [Google Scholar] [CrossRef]
  39. Sealy, M.J.; Dechaphunkul, T.; van der Schans, C.P.; Krijnen, W.P.; Roodenburg, J.L.; Walker, J.; Jager-Wittenaar, H.; Baracos, V.E. Low muscle mass is associated with early termination of chemotherapy related to toxicity in patients with head and neck cancer. Clin. Nutr. 2020, 39, 501–509. [Google Scholar] [CrossRef]
  40. Karaca, F.; Afsar, C.U.; Gunaldi, M.; Erkurt, E.; Ercolak, V.; Sertdemir, Y.; Paydas, S. Alterations of ghrelin with weights and correlation among ghrelin, cytokine and survival in patients receiving chemoradiotherapy for gastrointestinal cancers. Int. J. Clin. Exp. Med. 2015, 8, 876–882. [Google Scholar]
  41. Hiura, Y.; Takiguchi, S.; Yamamoto, K.; Takahashi, T.; Kurokawa, Y.; Yamasaki, M.; Nakajima, K.; Miyata, H.; Fujiwara, Y.; Mori, M.; et al. Effects of ghrelin administration during chemotherapy with advanced esophageal cancer patients: A prospective, randomized, placebo-controlled phase 2 study. Cancer 2012, 118, 4785–4794. [Google Scholar] [CrossRef] [PubMed]
  42. Katakami, N.; Uchino, J.; Yokoyama, T.; Naito, T.; Kondo, M.; Yamada, K.; Kitajima, H.; Yoshimori, K.; Sato, K.; Saito, H.; et al. Anamorelin (ONO-7643) for the treatment of patients with non-small cell lung cancer and cachexia: Results from a randomized, double-blind, placebo-controlled, multicenter study of Japanese patients (ONO-7643-04). Cancer 2018, 124, 606–616. [Google Scholar] [CrossRef] [PubMed]
Figure 1. Change in modified Glasgow prognostic score before and after chemoradiotherapy. (A) The number of patients with each modified Glasgow prognostic score (mGPS) value before chemoradiotherapy (CRT) is indicated at the center of each circle. The percentage of patients with each mGPS after CRT is presented in the surrounding circled space with gray back (post-CRT mGPS of 0), blue back (post-CRT mGPS of 1), and navy back (post-CRT mGPS of 2). The mGPS values were maintained at the same score after CRT in 76.9%, 11.5%, and 30.4% of patients with mGPS of 0, 1, and 2, respectively. (B) Pearson correlation analysis for percentage of body weight change during CRT and C-reactive protein levels after CRT in the subgroup with mGPS 0 or 1/2 before CRT. There was a negative correlation (r = −0.301, p = 0.035) between CRP levels after CRT and body weight loss during CRT among patients with mGPS values of 1 or 2 before CRT.
Cancers 15 04358 g001
Figure 2. Kaplan–Meier estimates of progression-free survival and overall survival of durvalumab according to C-reactive protein levels (≤1 mg/dL vs. >1 mg/dL) after chemoradiotherapy (CRT) in subgroups based on modified Glasgow prognostic score before CRT. Kaplan–Meier estimates of (A) progression-free survival (PFS) and (B) overall survival (OS) in the subgroup with modified Glasgow prognostic score (mGPS) of 0, (C) PFS and (D) OS in the subgroup with mGPS of 1, and (E) PFS and (F) OS in the subgroup with mGPS of 2, based on C-reactive protein (CRP) levels of ≤1 mg/dL (low CRP level) and CRP >1 mg/dL (high CRP level). Among the patients with mGPS of 1, patients with high CRP levels after CRT had significantly poor PFS and relatively poor OS compared with patients with low CRP levels (HR for PFS: 4.60 [95% CI: 1.44–14.7], HR for OS: 3.65 [95% CI: 0.79–16.84]). HR, hazard ratio; CI, confidence interval.
Cancers 15 04358 g002aCancers 15 04358 g002b
Figure 3. Kaplan–Meier estimates of progression-free survival and overall survival of durvalumab according to systemic inflammation-based prognostic risk classification. Kaplan–Meier estimates of (A) progression-free survival (PFS) and (B) overall survival (OS) according to the low- and high-risk groups based on the systemic inflammation-based prognostic risk classification. HR, hazard ratio; CI, confidence interval.
Cancers 15 04358 g003
Figure 4. Multivariate analysis of (A) progression-free survival and (B) overall survival. In the multivariate analysis, persistent inflammation, defined as a pre-chemoradiotherapy (CRT)-modified Glasgow prognostic score (mGPS) of 2, or a pre-CRT mGPS of 1 and post-CRT C-reactive protein levels >1 mg/dL, was associated with shorter progression-free survival and overall survival. HR, hazard ratio; CI, confidence interval; Sq, squamous cell carcinoma.
Cancers 15 04358 g004
Figure 5. Treatment efficacy of durvalumab in subgroups with programmed cell death ligand 1 of ≥50% or <50% according to systemic inflammation-based prognostic risk classification. Kaplan–Meier estimates of progression-free survival of patients within high- and low-risk groups among the subgroup with (A) programmed cell death ligand 1 (PD-L1) ≥50% and (B) PD-L1 <50%, based on the systemic inflammation-based prognostic risk classification, using Fisher’s Exact Test.
Cancers 15 04358 g005
Table 1. Characteristics of patients.
Characteristicsn = 126
Age—median (IQR), year71.0 (64.3, 76.0)
Sex-Male—n (%) 98 (77.8)
Smoking history—n (%)Never smoked16 (12.7)
Ex- or current smoker110 (87.3)
ECOG-PS—n (%)0 or 1118 (93.7)
≥28 (6.3)
Histology—n (%)Squamous cell carcinoma65 (51.6)
Adenocarcinoma57 (45.2)
Others4 (3.2)
Driver mutations—n (%)Wild-type19 (15.1)
EGFR or ALK6 (4.8)
Others2 (1.6)
Unknown99 (78.6)
PD-L1 expression—n (%)≥50%41 (32.5)
<50%50 (39.7)
Unknown35 (27.8)
Clinical stage—n (%)≤IIb11 (8.7)
IIIA48 (38.1)
IIIB56 (44.4)
IIIC11 (8.7)
Chemotherapy—n (%)Carboplatin/paclitaxel64 (50.8)
Carboplatin monotherapy22 (17.5)
Cisplatin/S-116 (12.7)
Cisplatin/docetaxel14 (11.1)
Others10 (8.0)
Best overall response to CRT—n (%) PR/CR93 (73.8)
SD32 (25.4)
NE1 (0.8)
Interval of CRT and durvalumab -median (IQR), day15.5 (13.0, 29.8)
IQR, interquartile range; ECOG-PS, Eastern Cooperative Oncology Group performance status; EGFR, epidermal growth factor receptor; ALK, anaplastic lymphoma kinase; PD-L1, programmed cell death ligand 1; CRT, chemoradiotherapy; PR, partial response; CR, complete response; SD, stable disease; S-1, tegafur/gimeracil/oteracil; NE, not evaluable.
Table 2. C-index of inflammation-based prognostic indicators in Cox proportional hazards model for progression-free survival and overall survival.
PFSOS
Pre/Post CRTC-IndexSEHR (95% CI)p-ValueC-IndexSEHR (95% CI)p-Value
mGPS (0,1,2)Pre0.5720.0351.45 (1.07–1.97)0.0160.6530.0491.84 (1.22–2.78)0.004
Post0.5490.0321.35 (0.99–1.83)0.0560.6150.0521.47 (0.98–2.20)0.065
CAR (<0.32 vs. ≥0.32)Pre0.5570.0331.67 (1.0–2.77)0.0490.640.0442.33 (1.16–4.68)0.018
Post0.5350.031.41 (0.81–2.45)0.220.610.0472.11 (1.03–4.33)0.041
NLR (<5 vs. ≥5)Pre0.5660.031.92 (1.04–3.55)0.0370.6030.0462.36 (1.09–5.11)0.029
Post0.5120.0320.99 (0.58–1.69)0.9620.5430.0471.46 (0.71–3.01)0.302
ALI (≥18 vs. <18)Pre0.5530.0321.56 (0.91–2.67)0.1030.6040.0472.43 (1.21–4.9)0.013
Post0.4890.0341.02 (0.61–1.70)0.9310.5260.0481.24 (0.61–2.49)0.556
PLR (<180 vs. ≥180)Pre0.5070.0341.04 (0.63–1.72)0.8790.5320.0481.12 (0.56–2.24)0.756
Post0.540.0280.64 (0.36–1.13)0.1220.540.0430.69 (0.32–1.49)0.34
SII (<750 vs. ≥750)Pre0.5390.0341.37 (0.82–2.27)0.2260.5810.0481.54 (0.76–3.12)0.232
Post0.5480.0340.77 (0.46–1.27)0.3040.5060.0490.99 (0.49–1.98)0.967
LIPI (0,1,2)Pre0.5470.0341.26 (0.86–1.84)0.2360.5460.0461.45 (0.85–2.47)0.173
Post0.510.0361.1 (0.73–1.67)0.6550.5620.0521.5 (0.87–2.59)0.141
PFS, progression-free survival; OS, overall survival; CRT, chemoradiotherapy; SE, standard error; HR, hazard ratio; CI, confidence interval; mGPS, modified Glasgow prognostic score; CAR, C-reactive protein to albumin ratio; NLR, neutrophil-to-lymphocyte ratio; ALI, advanced lung cancer inflammation index; PLR, platelet-to-lymphocyte ratio; SII, systemic immune-inflammation index; LIPI, lung immune prognostic index.
Table 3. Characteristics of patients according to inflammation-associated prognostic risk classification.
Low-Risk (n = 95)High-Risk (n = 31)p-Value
Age—median (IQR), y 70.0 [44.0, 89.0]72.0 [36.0, 84.0]0.351
Sex—n (%)Male75 (78.9) 23 (74.2) 0.622
ECOG-PS—n (%)0 or 189 (93.7) 29 (93.5) 1
≥26 (6.3) 2 (6.5)
Smoking history—n (%)Yes83 (87.4) 27 (87.1) 1
No12 (12.6) 4 (12.9)
Histology—n (%)Non-Sq.48 (50.5) 17 (54.8) 0.686
Sq.47 (49.5) 14 (45.2)
PD-L1 expression—n (%)≥50%31 (32.6) 10 (32.3) 0.293
1–49%24 (25.3) 12 (38.7)
<1%13 (13.7)1 (3.2)
Unknown27 (28.4) 8 (25.8)
Clinical Stage≤IIb11 (11.6) 0 (0.0) 0.031
IIIA36 (37.9) 12 (38.7)
IIIB43 (45.3) 13 (41.9)
IIIC5 (5.3) 6 (19.4)
% of change from pre-CRT BW—median (IQR)−1.72 (−5.10, 0.76)−4.86 (−8.24, −2.19)0.037
Best overall response to CRT—n (%)CR/PR69 (72.6)24 (77.4)0.859
SD25 (26.3)7 (22.6)
NE1 (1.1)0 (0)
Table 4. Adverse events observed in 5% or more of the population and the relationship between high- and low-risk groups classified by inflammation-based prognostic risk classification.
Total (n = 126)Low-Risk (n = 95)High-Risk (n = 31)
Adverse Events—n (%)Any GradeGrade 3–5Any GradeGrade 3–5Any GradeGrade 3–5
Any AE101 (80)17 (13)76 (80)10 (10.5)25 (80.6)7 (22.6)
Pneumonitis82 (65)10 (8)62 (65.2)5 (5.3)20 (64.5)5 (16.1)
Hypothyroidism19 (15)5 (4)16 (16.8)4 (4.4)3 (9.6)1 (3.2)
Rash11 (9)09 (9.5)02 (6.4)0
AE, adverse event.
Disclaimer/Publisher’s Note: The statements, opinions and data contained in all publications are solely those of the individual author(s) and contributor(s) and not of MDPI and/or the editor(s). MDPI and/or the editor(s) disclaim responsibility for any injury to people or property resulting from any ideas, methods, instructions or products referred to in the content.

