
Lineage Plasticity and Stemness Phenotypes in Prostate Cancer: Harnessing the Power of Integrated “Omics” Approaches to Explore Measurable Metrics

 ,
, 

Simple Summary
Abstract
1. Introduction
2. Genomic Drivers of PCa Progression and Evolution
3. Epigenetic Changes in PCa Evolution
3.1. DNA Methylation
3.2. Histone PTMs
3.3. Chromatin Remodeling through ncRNAs
4. PCa Heterogeneity as Defined by Transcriptomic Profiles
5. Computational and Molecular Perspectives on Lineage Plasticity
6. Bioinformatic Tools for Lineage Plasticity Signatures and Measures
6.1. Genomics
6.2. Transcriptomics
6.3. Epigenetics
6.3.1. ChIP-Seq Analysis Tools
6.3.2. DNAme-Seq Analysis Tools
6.3.3. ATAC-Seq Analysis Tools
6.4. Enrichment Analysis
7. Conclusions and Future Directions
Supplementary Materials
Author Contributions
Funding
Acknowledgments
Conflicts of Interest
References
- Siegel, R.L.; Miller, K.D.; Fuchs, H.E.; Jemal, A. Cancer Statistics, 2022. CA Cancer J. Clin. 2022, 72, 7–33. [Google Scholar] [CrossRef] [PubMed]
- Gleason, D.F. Histologic Grading and Clinical Staging of Prostatic Carcinom; Urol. Pathol. Prostate; Tann, M., Ed.; Lea Febiger: Philadelphia, PA, USA, 1977; pp. 171–197. [Google Scholar]
- Delahunt, B.; Miller, R.J.; Srigley, J.R.; Evans, A.J.; Samaratunga, H. Gleason Grading: Past, Present and Future. Histopathology 2012, 60, 75–86. [Google Scholar] [PubMed]
- Schaeffer, E.M.; Srinivas, S.; Adra, N.; An, Y.; Barocas, D.; Bitting, R.; Bryce, A.; Chapin, B.; Cheng, H.H.; D’Amico, A.V.; et al. NCCN GUIDELINES® INSIGHTS: Prostate Cancer, Version 1.2023: Featured Updates to the NCCN Guidelines. JNCCN J. Natl. Compr. Cancer Netw. 2022, 20, 1288–1298. [Google Scholar] [CrossRef]
- Mottet, N.; Bastian, P.; Bellmunt, J.; van den Bergh, R.; Bolla, M.; van Casteren, N.; Cornford, P.; Joniau, S.; Matveev, V.; van der Kwast, T.; et al. EAU-EANM-ESTRO-ESUR-SIOG: Guidelines on Prostate Cancer. Eur. Assoc. Urol. 2020, 1, 11–143. [Google Scholar]
- Cornford, P.; van den Bergh, R.C.N.; Briers, E.; Van den Broeck, T.; Cumberbatch, M.G.; De Santis, M.; Fanti, S.; Fossati, N.; Gandaglia, G.; Gillessen, S.; et al. EAU-EANM-ESTRO-ESUR-SIOG Guidelines on Prostate Cancer. Part II—2020 Update: Treatment of Relapsing and Metastatic Prostate Cancer [Formula Presented]. Eur. Urol. 2021, 79, 263–282. [Google Scholar]
- Mottet, N.; van den Bergh, R.C.N.; Briers, E.; Van den Broeck, T.; Cumberbatch, M.G.; De Santis, M.; Fanti, S.; Fossati, N.; Gandaglia, G.; Gillessen, S.; et al. EAU-EANM-ESTRO-ESUR-SIOG Guidelines on Prostate Cancer—2020 Update. Part 1: Screening, Diagnosis, and Local Treatment with Curative Intent. Eur. Urol. 2021, 79, 243–262. [Google Scholar]
- Aparicio, A.; Logothetis, C.J.; Maity, S.N. Understanding the Lethal Variant of Prostate Cancer: Power of Examining Extremes. Cancer Discov. 2011, 1, 466–468. [Google Scholar] [CrossRef]
- Beltran, H.; Prandi, D.; Mosquera, J.M.; Benelli, M.; Puca, L.; Cyrta, J.; Marotz, C.; Giannopoulou, E.; Chakravarthi, B.V.S.K.; Varambally, S.; et al. Divergent Clonal Evolution of Castration-Resistant Neuroendocrine Prostate Cancer. Nat. Med. 2016, 22, 298–305. [Google Scholar] [CrossRef]
- Aparicio, A.M.; Harzstark, A.L.; Corn, P.G.; Wen, S.; Araujo, J.C.; Tu, S.-M.; Pagliaro, L.C.; Kim, J.; Millikan, R.E.; Ryan, C.; et al. Platinum-Based Chemotherapy for Variant Castrate-Resistant Prostate Cancer. Clin. Cancer Res. 2013, 19, 3621–3630. [Google Scholar] [CrossRef]
- Corn, P.G.; Heath, E.I.; Zurita, A.; Ramesh, N.; Xiao, L.; Sei, E.; Li-Ning-Tapia, E.; Tu, S.M.; Subudhi, S.K.; Wang, J.; et al. Cabazitaxel plus Carboplatin for the Treatment of Men with Metastatic Castration-Resistant Prostate Cancers: A Randomised, Open-Label, Phase 1–2 Trial. Lancet Oncol. 2019, 20, 1432–1443. [Google Scholar] [CrossRef]
- Quintanal-Villalonga, Á.; Chan, J.M.; Yu, H.A.; Pe’er, D.; Sawyers, C.L.; Sen, T.; Rudin, C.M. Lineage Plasticity in Cancer: A Shared Pathway of Therapeutic Resistance. Nat. Rev. Clin. Oncol. 2020, 17, 360–371. [Google Scholar] [PubMed]
- Pérez-González, A.; Bévant, K.; Blanpain, C. Cancer Cell Plasticity during Tumor Progression, Metastasis and Response to Therapy. Nat. Cancer 2023, 4, 1063–1082. [Google Scholar] [CrossRef] [PubMed]
- Davies, A.; Zoubeidi, A.; Beltran, H.; Selth, L.A. The Transcriptional and Epigenetic Landscape of Cancer Cell Lineage Plasticity. Cancer Discov. 2023, 13, 1771–1788. [Google Scholar] [CrossRef] [PubMed]
- Chaffer, C.L.; San Juan, B.P.; Lim, E.; Weinberg, R.A. EMT, Cell Plasticity and Metastasis. Cancer Metastasis Rev. 2016, 35, 645–654. [Google Scholar] [CrossRef] [PubMed]
- Esquer, H.; Zhou, Q.; Nemkov, T.; Abraham, A.D.; Rinaldetti, S.; Chen, Y.C.; Zhang, X.; Orman, M.V.; D’Alessandro, A.; Ferrer, M.; et al. Isolating and Targeting the Real-Time Plasticity and Malignant Properties of Epithelial-Mesenchymal Transition in Cancer. Oncogene 2021, 40, 2884–2897. [Google Scholar] [CrossRef] [PubMed]
- Voon, D.C.; Huang, R.Y.; Jackson, R.A.; Thiery, J.P. The EMT Spectrum and Therapeutic Opportunities. Mol. Oncol. 2017, 11, 878–891. [Google Scholar] [CrossRef]
- Yuan, S.; Norgard, R.J.; Stanger, B.Z. Cellular Plasticity in Cancer. Cancer Discov. 2019, 9, 837–851. [Google Scholar]
- Beltran, H.; Hruszkewycz, A.; Scher, H.I.; Hildesheim, J.; Isaacs, J.; Yu, E.Y.; Kelly, K.; Lin, D.; Dicker, A.; Arnold, J.; et al. The Role of Lineage Plasticity in Prostate Cancer Therapy Resistance. Clin. Cancer Res. 2019, 25, 6916–6924. [Google Scholar] [CrossRef]
- Terry, S.; Beltran, H. The Many Faces of Neuroendocrine Differentiation in Prostate Cancer Progression. Front. Oncol. 2014, 4, 60. [Google Scholar] [CrossRef]
- Espiritu, S.M.G.; Liu, L.Y.; Rubanova, Y.; Bhandari, V.; Holgersen, E.M.; Szyca, L.M.; Fox, N.S.; Chua, M.L.K.; Yamaguchi, T.N.; Heisler, L.E.; et al. The Evolutionary Landscape of Localized Prostate Cancers Drives Clinical Aggression. Cell 2018, 173, 1003–1013.e15. [Google Scholar] [CrossRef]
- Fraser, M.; Sabelnykova, V.Y.; Yamaguchi, T.N.; Heisler, L.E.; Livingstone, J.; Huang, V.; Shiah, Y.J.; Yousif, F.; Lin, X.; Masella, A.P.; et al. Genomic Hallmarks of Localized, Non-Indolent Prostate Cancer. Nature 2017, 541, 359–364. [Google Scholar] [CrossRef] [PubMed]
- Wilt, T.J.; Ullman, K.E.; Linskens, E.J.; MacDonald, R.; Brasure, M.; Ester, E.; Nelson, V.A.; Saha, J.; Sultan, S.; Dahm, P. Therapies for Clinically Localized Prostate Cancer: A Comparative Effectiveness Review. J. Urol. 2021, 205, 967–976. [Google Scholar] [CrossRef] [PubMed]
- Zhao, S.G.; Chang, S.L.; Erho, N.; Yu, M.; Lehrer, J.; Alshalalfa, M.; Speers, C.; Cooperberg, M.R.; Kim, W.; Ryan, C.J.; et al. Associations of Luminal and Basal Subtyping of Prostate Cancer With Prognosis and Response to Androgen Deprivation Therapy. JAMA Oncol. 2017, 3, 1663–1672. [Google Scholar] [CrossRef]
- Blee, A.M.; He, Y.; Yang, Y.; Ye, Z.; Yan, Y.; Pan, Y.; Ma, T.; Dugdale, J.; Kuehn, E.; Kohli, M.; et al. TMPrSS2-ERG Controls Luminal Epithelial Lineage and Antiandrogen Sensitivity in PTEN and TP53-Mutated Prostate Cancer. Clin. Cancer Res. 2018, 24, 4551–4565. [Google Scholar] [CrossRef] [PubMed]
- Ku, S.Y.; Rosario, S.; Wang, Y.; Mu, P.; Seshadri, M.; Goodrich, Z.W.; Goodrich, M.M.; Labbé, D.P.; Gomez, E.C.; Wang, J.; et al. Rb1 and Trp53 Cooperate to Suppress Prostate Cancer Lineage Plasticity, Metastasis, and Antiandrogen Resistance. Science 2017, 355, 78–83. [Google Scholar] [CrossRef] [PubMed]
- Mu, P.; Zhang, Z.; Benelli, M.; Karthaus, W.R.; Hoover, E.; Chen, C.C.; Wongvipat, J.; Ku, S.Y.; Gao, D.; Cao, Z.; et al. SOX2 Promotes Lineage Plasticity and Antiandrogen Resistance in TP53-and RB1-Deficient Prostate Cancer. Science 2017, 355, 84–88. [Google Scholar] [CrossRef]
- Aparicio, A.M.; Shen, L.; Tapia, E.L.N.; Lu, J.F.; Chen, H.C.; Zhang, J.; Wu, G.; Wang, X.; Troncoso, P.; Corn, P.; et al. Combined Tumor Suppressor Defects Characterize Clinically Defined Aggressive Variant Prostate Cancers. Clin. Cancer Res. 2016, 22, 1520–1530. [Google Scholar] [CrossRef]
- Beltran, H.; Tomlins, S.; Aparicio, A.; Arora, V.; Rickman, D.; Ayala, G.; Huang, J.; True, L.; Gleave, M.E.; Soule, H.; et al. Aggressive Variants of Castration-Resistant Prostate Cancer. Clin. Cancer Res. 2014, 20, 2846–2850. [Google Scholar] [CrossRef]
- Matoso, A.; Epstein, J.I. Grading of Prostate Cancer: Past, Present, and Future. Curr. Urol. Rep. 2016, 17, 25. [Google Scholar] [CrossRef]
- Epstein, J.I.; Egevad, L.; Amin, M.B.; Delahunt, B.; Srigley, J.R.; Humphrey, P.A.; the Grading Committee. The 2014 International Society of Urological Pathology (ISUP) Consensus Conference on Gleason Grading of Prostatic Carcinoma: Definition of Grading Patterns and Proposal for a New Grading System. Am. J. Surg. Pathol. 2016, 40, 244–252. [Google Scholar] [CrossRef]
- Hussain, M.; Tangen, C.M.; Higano, C.; Schelhammer, P.F.; Faulkner, J.; Crawford, E.D.; Wilding, G.; Akdas, A.; Small, E.J.; Donnelly, B.; et al. Absolute Prostate-Specific Antigen Value after Androgen Deprivation Is a Strong Independent Predictor of Survival in New Metastatic Prostate Cancer: Data from Southwest Oncology Group Trial 9346 (INT-0162). J. Clin. Oncol. 2006, 24, 3984–3990. [Google Scholar] [CrossRef] [PubMed]
- Petrillo, A.; Fusco, R.; Setola, S.V.; Ronza, F.M.; Granata, V.; Petrillo, M.; Carone, G.; Sansone, M.; Franco, R.; Fulciniti, F.; et al. Multiparametric MRI for Prostate Cancer Detection: Performance in Patients with Prostate-Specific Antigen Values between 2.5 and 10 Ng/ML. J. Magn. Reson. Imaging 2014, 39, 1206–1212. [Google Scholar] [CrossRef] [PubMed]
- Slatko, B.E.; Gardner, A.F.; Ausubel, F.M. Overview of Next-Generation Sequencing Technologies. Curr. Protoc. Mol. Biol. 2018, 122, e59. [Google Scholar] [CrossRef] [PubMed]
- Thankamony, A.P.; Subbalakshmi, A.R.; Jolly, M.K.; Nair, R. Lineage Plasticity in Cancer: The Tale of a Skin-Walker. Cancers 2021, 13, 3602. [Google Scholar] [CrossRef] [PubMed]
- Le Magnen, C.; Shen, M.M.; Abate-Shen, C. Lineage Plasticity in Cancer Progression and Treatment. Annu. Rev. Cancer Biol. 2018, 2, 271–289. [Google Scholar] [CrossRef]
- Zou, M.; Toivanen, R.; Mitrofanova, A.; Floch, N.; Hayati, S.; Sun, Y.; Le Magnen, C.; Chester, D.; Mostaghel, E.A.; Califano, A.; et al. Transdifferentiation as a Mechanism of Treatment Resistance in a Mouse Model of Castration-Resistant Prostate Cancer. Cancer Discov. 2017, 7, 736–749. [Google Scholar] [CrossRef]
- Haffner, M.C.; Mosbruger, T.; Esopi, D.M.; Fedor, H.; Heaphy, C.M.; Walker, D.A.; Adejola, N.; Gürel, M.; Hicks, J.; Meeker, A.K.; et al. Tracking the Clonal Origin of Lethal Prostate Cancer. J. Clin. Investig. 2013, 123, 4918–4922. [Google Scholar] [CrossRef]
- Waddington, C.H. The Epigenotype. 1942. Int. J. Epidemiol. 2012, 41, 10–13. [Google Scholar] [CrossRef]
- Lyko, F. The DNA Methyltransferase Family: A Versatile Toolkit for Epigenetic Regulation. Nat. Rev. Genet. 2018, 19, 81–92. [Google Scholar] [CrossRef]
- Sharma, N.L.; Massie, C.E.; Ramos-Montoya, A.; Zecchini, V.; Scott, H.E.; Lamb, A.D.; MacArthur, S.; Stark, R.; Warren, A.Y.; Mills, I.G.; et al. The Androgen Receptor Induces a Distinct Transcriptional Program in Castration-Resistant Prostate Cancer in Man. Cancer Cell 2013, 23, 35–47. [Google Scholar] [CrossRef]
- Puca, L.; Bareja, R.; Prandi, D.; Shaw, R.; Benelli, M.; Karthaus, W.R.; Hess, J.; Sigouros, M.; Donoghue, A.; Kossai, M.; et al. Patient Derived Organoids to Model Rare Prostate Cancer Phenotypes. Nat. Commun. 2018, 9, 2404. [Google Scholar] [CrossRef] [PubMed]
- Prasetyanti, P.R.; Medema, J.P. Intra-Tumor Heterogeneity from a Cancer Stem Cell Perspective. Mol. Cancer 2017, 16, 41. [Google Scholar] [CrossRef] [PubMed]
- Davies, A.; Zoubeidi, A.; Selth, L.A. The Epigenetic and Transcriptional Landscape of Neuroendocrine Prostate Cancer. Endocr. Relat. Cancer 2020, 27, R35–R50. [Google Scholar] [CrossRef]
- Han, H.; Wang, Y.; Curto, J.; Gurrapu, S.; Laudato, S.; Rumandla, A.; Chakraborty, G.; Wang, X.; Chen, H.; Jiang, Y.; et al. Mesenchymal and Stem-like Prostate Cancer Linked to Therapy-Induced Lineage Plasticity and Metastasis. Cell Rep. 2022, 39, 110595. [Google Scholar] [CrossRef]
- Takahashi, K.; Yamanaka, S. Induction of Pluripotent Stem Cells from Mouse Embryonic and Adult Fibroblast Cultures by Defined Factors. Cell 2006, 126, 663–676. [Google Scholar] [CrossRef] [PubMed]
- Takahashi, K.; Yamanaka, S. A Decade of Transcription Factor-Mediated Reprogramming to Pluripotency. Nat. Rev. Mol. Cell Biol. 2016, 17, 183–193. [Google Scholar] [CrossRef]
- Paranjape, A.N.; Soundararajan, R.; Werden, S.J.; Joseph, R.; Taube, J.H.; Liu, H.; Rodriguez-Canales, J.; Sphyris, N.; Wistuba, I.; Miura, N.; et al. Inhibition of FOXC2 Restores Epithelial Phenotype and Drug Sensitivity in Prostate Cancer Cells with Stem-Cell Properties. Oncogene 2016, 35, 5963–5976. [Google Scholar] [CrossRef] [PubMed]
- Soundararajan, R.; Paranjape, A.N.; Maity, S.; Aparicio, A.; Mani, S.A. EMT, Stemness and Tumor Plasticity in Aggressive Variant Neuroendocrine Prostate Cancers. Biochim. Biophys. Acta-Rev. Cancer 2018, 1870, 229–238. [Google Scholar]
- Chan, J.M.; Zaidi, S.; Love, J.R.; Zhao, J.L.; Setty, M.; Wadosky, K.M.; Gopalan, A.; Choo, Z.-N.; Persad, S.; Choi, J.; et al. Lineage Plasticity in Prostate Cancer Depends on JAK/STAT Inflammatory Signaling. Science 2022, 377, 1180–1191. [Google Scholar] [CrossRef]
- Brabletz, T.; Kalluri, R.; Nieto, M.A.; Weinberg, R.A. EMT in Cancer. Nat. Rev. Cancer 2018, 18, 128–134. [Google Scholar] [CrossRef]
- Papanikolaou, S.; Vourda, A.; Syggelos, S.; Gyftopoulos, K. Cell Plasticity and Prostate Cancer: The Role of Epithelial–Mesenchymal Transition in Tumor Progression, Invasion, Metastasis and Cancer Therapy Resistance. Cancers 2021, 13, 2795. [Google Scholar] [CrossRef] [PubMed]
- Bakir, B.; Chiarella, A.M.; Pitarresi, J.R.; Rustgi, A.K. EMT, MET, Plasticity, and Tumor Metastasis. Trends Cell Biol. 2020, 30, 764–776. [Google Scholar] [CrossRef] [PubMed]
- Dardenne, E.; Beltran, H.; Benelli, M.; Gayvert, K.; Berger, A.; Puca, L.; Cyrta, J.; Sboner, A.; Noorzad, Z.; MacDonald, T.; et al. N-Myc Induces an EZH2-Mediated Transcriptional Program Driving Neuroendocrine Prostate Cancer. Cancer Cell 2016, 30, 563–577. [Google Scholar] [CrossRef] [PubMed]
- Lee, J.K.; Phillips, J.W.; Smith, B.A.; Park, J.W.; Stoyanova, T.; McCaffrey, E.F.; Baertsch, R.; Sokolov, A.; Meyerowitz, J.G.; Mathis, C.; et al. N-Myc Drives Neuroendocrine Prostate Cancer Initiated from Human Prostate Epithelial Cells. Cancer Cell 2016, 29, 536–547. [Google Scholar] [CrossRef] [PubMed]
- Berger, A.; Brady, N.J.; Bareja, R.; Robinson, B.; Conteduca, V.; Augello, M.A.; Puca, L.; Ahmed, A.; Dardenne, E.; Lu, X.; et al. N-Myc-Mediated Epigenetic Reprogramming Drives Lineage Plasticity in Advanced Prostate Cancer. J. Clin. Investig. 2019, 129, 3924–3940. [Google Scholar] [CrossRef] [PubMed]
- Beltran, H.; Oromendia, C.; Danila, D.C.; Montgomery, B.; Hoimes, C.; Szmulewitz, R.Z.; Vaishampayan, U.; Armstrong, A.J.; Stein, M.; Pinski, J.; et al. A Phase II Trial of the Aurora Kinase a Inhibitor Alisertib for Patients with Castration-Resistant and Neuroendocrine Prostate Cancer: Efficacy and Biomarkers. Clin. Cancer Res. 2019, 25, 43–51. [Google Scholar] [CrossRef]
- Jones, D.; Noble, M.; Wedge, S.R.; Robson, C.N.; Gaughan, L. Aurora A Regulates Expression of AR-V7 in Models of Castrate Resistant Prostate Cancer. Sci. Rep. 2017, 7, srep40957. [Google Scholar] [CrossRef]
- Beltran, H.; Rickman, D.S.; Park, K.; Chae, S.S.; Sboner, A.; MacDonald, T.Y.; Wang, Y.; Sheikh, K.L.; Terry, S.; Tagawa, S.T.; et al. Molecular Characterization of Neuroendocrine Prostate Cancer and Identification of New Drug Targets. Cancer Discov. 2011, 1, 487–495. [Google Scholar] [CrossRef]
- Ton, A.T.; Singh, K.; Morin, H.; Ban, F.; Leblanc, E.; Lee, J.; Lallous, N.; Cherkasov, A. Dual-Inhibitors of N-Myc and AURKA as Potential Therapy for Neuroendocrine Prostate Cancer. Int. J. Mol. Sci. 2020, 21, 8277. [Google Scholar] [CrossRef]
- Heo, Y.J.; Hwa, C.; Lee, G.H.; Park, J.M.; An, J.Y. Integrative Multi-Omics Approaches in Cancer Research: From Biological Networks to Clinical Subtypes. Mol. Cells 2021, 44, 433–443. [Google Scholar] [CrossRef]
- Rodriguez-Martin, B.; Alvarez, E.G.; Baez-Ortega, A.; Zamora, J.; Supek, F.; Demeulemeester, J.; Santamarina, M.; Ju, Y.S.; Temes, J.; Garcia-Souto, D.; et al. Pan-Cancer Analysis of Whole Genomes Identifies Driver Rearrangements Promoted by LINE-1 Retrotransposition. Nat. Genet. 2020, 52, 306–319. [Google Scholar] [CrossRef] [PubMed]
- Barbieri, C.E.; Bangma, C.H.; Bjartell, A.; Catto, J.W.F.; Culig, Z.; Grönberg, H.; Luo, J.; Visakorpi, T.; Rubin, M.A. The Mutational Landscape of Prostate Cancer. Eur. Urol. 2013, 64, 567–576. [Google Scholar] [CrossRef] [PubMed]
- Wang, G.; Zhao, D.; Spring, D.J.; DePinho, R.A. Genetics and Biology of Prostate Cancer. Genes Dev. 2018, 32, 1105–1140. [Google Scholar] [CrossRef]
- Farmer, H.; McCabe, H.; Lord, C.J.; Tutt, A.H.J.; Johnson, D.A.; Richardson, T.B.; Santarosa, M.; Dillon, K.J.; Hickson, I.; Knights, C.; et al. Targeting the DNA Repair Defect in BRCA Mutant Cells as a Therapeutic Strategy. Nature 2005, 434, 917–921. [Google Scholar] [CrossRef] [PubMed]
- Feng, F.Y.; Brenner, J.C.; Hussain, M.; Chinnaiyan, A.M. Molecular Pathways: Targeting ETS Gene Fusions in Cancer. Clin. Cancer Res. Off. J. Am. Assoc. Cancer Res. 2014, 20, 4442–4448. [Google Scholar] [CrossRef]
- Grasso, C.S.; Wu, Y.M.; Robinson, D.R.; Cao, X.; Dhanasekaran, S.M.; Khan, A.P.; Quist, M.J.; Jing, X.; Lonigro, R.J.; Brenner, J.C.; et al. The Mutational Landscape of Lethal Castration-Resistant Prostate Cancer. Nature 2012, 487, 239–243. [Google Scholar] [CrossRef]
- Sizemore, G.M.; Pitarresi, J.R.; Balakrishnan, S.; Ostrowski, M.C. The ETS Family of Oncogenic Transcription Factors in Solid Tumours. Nat. Rev. Cancer 2017, 17, 337–351. [Google Scholar]
- Kumar-Sinha, C.; Tomlins, S.A.; Chinnaiyan, A.M. Recurrent Gene Fusions in Prostate Cancer. Nat. Rev. Cancer 2008, 8, 497–511. [Google Scholar] [CrossRef]
- Tomlins, S.A.; Rhodes, D.R.; Perner, S.; Dhanasekaran, S.M.; Mehra, R.; Sun, X.W.; Varambally, S.; Cao, X.; Tchinda, J.; Kuefer, R.; et al. Recurrent Fusion of TMPRSS2 and ETS Transcription Factor Genes in Prostate Cancer. Science 2005, 310, 644–648. [Google Scholar] [CrossRef]
- Castro, E.; Goh, C.; Olmos, D.; Saunders, E.; Leongamornlert, D.; Tymrakiewicz, M.; Mahmud, N.; Dadaev, T.; Govindasami, K.; Guy, M.; et al. Germline BRCA Mutations Are Associated with Higher Risk of Nodal Involvement, Distant Metastasis, and Poor Survival Outcomes in Prostate Cancer. J. Clin. Oncol. 2013, 31, 1748–1757. [Google Scholar] [CrossRef]
- Pritchard, C.C.; Mateo, J.; Walsh, M.F.; De Sarkar, N.; Abida, W.; Beltran, H.; Garofalo, A.; Gulati, R.; Carreira, S.; Eeles, R.; et al. Inherited DNA-Repair Gene Mutations in Men with Metastatic Prostate Cancer. N. Engl. J. Med. 2016, 375, 443–453. [Google Scholar] [CrossRef] [PubMed]
- Oliva, L.; Lozano, R.; Llácer, C.; Aragón, I.; Pajares, B.I.; Sáez, M.I.; Herrera-Imbroda, B.; Montesa, A.; Hernández, D.; Villatoro, R.; et al. Risk Prediction Tools Available for Germline BRCA1/2 Mutations Underperform in Prostate Cancer Patients. Eur. Urol. Oncol. 2021, 4, 315–318. [Google Scholar] [CrossRef] [PubMed]
- Nyberg, T.; Frost, D.; Barrowdale, D.; Evans, D.G.; Bancroft, E.; Adlard, J.; Ahmed, M.; Barwell, J.; Brady, A.F.; Brewer, C.; et al. Prostate Cancer Risks for Male BRCA1 [Formula Presented] and BRCA2 Mutation Carriers: A Prospective Cohort Study. Eur. Urol. 2020, 77, 24–35. [Google Scholar] [CrossRef] [PubMed]
- Na, R.; Zheng, S.L.; Han, M.; Yu, H.; Jiang, D.; Shah, S.; Ewing, C.M.; Zhang, L.; Novakovic, K.; Petkewicz, J.; et al. Germline Mutations in ATM and BRCA1/2 Distinguish Risk for Lethal and Indolent Prostate Cancer and Are Associated with Early Age at Death [Figure Presented]. Eur. Urol. 2017, 71, 740–747. [Google Scholar] [CrossRef]
- Marshall, C.H.; Fu, W.; Wang, H.; Baras, A.S.; Lotan, T.L.; Antonarakis, E.S. Prevalence of DNA Repair Gene Mutations in Localized Prostate Cancer According to Clinical and Pathologic Features: Association of Gleason Score and Tumor Stage. Prostate Cancer Prostatic Dis. 2019, 22, 59–65. [Google Scholar] [CrossRef]
- Mohler, J.L.; Antonarakis, E.S. NCCN Guidelines Updates: Management of Prostate Cancer. J. Natl. Compr. Canc. Netw. 2019, 17, 583–586. [Google Scholar]
- Antonarakis, E.S.; Shaukat, F.; Isaacsson Velho, P.; Kaur, H.; Shenderov, E.; Pardoll, D.M.; Lotan, T.L. Clinical Features and Therapeutic Outcomes in Men with Advanced Prostate Cancer and DNA Mismatch Repair Gene Mutations. Eur. Urol. 2019, 75, 378–382. [Google Scholar] [CrossRef]
- Yoshida, T.; Yaegashi, H.; Toriumi, R.; Kadomoto, S.; Iwamoto, H.; Izumi, K.; Kadono, Y.; Ikeda, H.; Mizokami, A. Long Response Duration to Pembrolizumab in Metastatic, Castration-Resistant Prostate Cancer with Microsatellite Instability-High and Neuroendocrine Differentiation: A Case Report. Front. Oncol. 2022, 12, 912490. [Google Scholar] [CrossRef]
- Leongamornlert, D.; Mahmud, N.; Tymrakiewicz, M.; Saunders, E.; Dadaev, T.; Castro, E.; Goh, C.; Govindasami, K.; Guy, M.; O’Brien, L.; et al. Germline BRCA1 Mutations Increase Prostate Cancer Risk. Br. J. Cancer 2012, 106, 1697–1701. [Google Scholar] [CrossRef]
- Nicolosi, P.; Ledet, E.; Yang, S.; Michalski, S.; Freschi, B.; O’Leary, E.; Esplin, E.D.; Nussbaum, R.L.; Sartor, O. Prevalence of Germline Variants in Prostate Cancer and Implications for Current Genetic Testing Guidelines. JAMA Oncol. 2019, 5, 523–528. [Google Scholar] [CrossRef]
- Blattner, M.; Lee, D.J.; O’Reilly, C.; Park, K.; MacDonald, T.Y.; Khani, F.; Turner, K.R.; Chiu, Y.L.; Wild, P.J.; Dolgalev, I.; et al. SPOP Mutations in Prostate Cancer across Demographically Diverse Patient Cohorts. Neoplasia 2014, 16, 14-W10. [Google Scholar] [CrossRef] [PubMed]
- Barbieri, C.E.; Baca, S.C.; Lawrence, M.S.; Demichelis, F.; Blattner, M.; Theurillat, J.P.; White, T.A.; Stojanov, P.; Van Allen, E.; Stransky, N.; et al. Exome Sequencing Identifies Recurrent SPOP, FOXA1 and MED12 Mutations in Prostate Cancer. Nat. Genet. 2012, 44, 685–689. [Google Scholar] [CrossRef] [PubMed]
- Nakazawa, M.; Fang, M.; Issacsson Velho, P.; Antonarakis, E.S. SPOP Mutations in Prostate Cancer: Clinical and Genomic Features. J. Clin. Oncol. 2021, 39, 151. [Google Scholar] [CrossRef]
- Dai, X.; Gan, W.; Li, X.; Wang, S.; Zhang, W.; Huang, L.; Liu, S.; Zhong, Q.; Guo, J.; Zhang, J.; et al. Prostate Cancer-Associated SPOP Mutations Confer Resistance to BET Inhibitors through Stabilization of BRD4. Nat. Med. 2017, 23, 1063–1071. [Google Scholar] [CrossRef]
- de Bono, J.; Mateo, J.; Fizazi, K.; Saad, F.; Shore, N.; Sandhu, S.; Chi, K.N.; Sartor, O.; Agarwal, N.; Olmos, D.; et al. Olaparib for Metastatic Castration-Resistant Prostate Cancer. N. Engl. J. Med. 2020, 382, 2091–2102. [Google Scholar] [CrossRef] [PubMed]
- Oh, M.; Alkhushaym, N.; Fallatah, S.; Althagafi, A.; Aljadeed, R.; Alsowaida, Y.; Jeter, J.; Martin, J.R.; Babiker, H.M.; McBride, A.; et al. The Association of BRCA1 and BRCA2 Mutations with Prostate Cancer Risk, Frequency, and Mortality: A Meta-Analysis. Prostate 2019, 79, 880–895. [Google Scholar] [CrossRef] [PubMed]
- Jamaspishvili, T.; Berman, D.M.; Ross, A.E.; Scher, H.I.; De Marzo, A.M.; Squire, J.A.; Lotan, T.L. Clinical Implications of PTEN Loss in Prostate Cancer. Nat. Rev. Urol. 2018, 15, 222–234. [Google Scholar]
- Thangavel, C.; Boopathi, E.; Liu, Y.; Haber, A.; Ertel, A.; Bhardwaj, A.; Addya, S.; Williams, N.; Ciment, S.J.; Cotzia, P.; et al. RB Loss Promotes Prostate Cancer Metastasis. Cancer Res. 2017, 77, 982–995. [Google Scholar] [CrossRef]
- Aparicio, A.; Den, R.B.; Knudsen, K.E. Time to Stratify? The Retinoblastoma Protein in Castrate-Resistant Prostate Cancer. Nat. Rev. Urol. 2011, 8, 562–568. [Google Scholar] [CrossRef]
- Han, W.; Liu, M.; Han, D.; Li, M.; Toure, A.A.; Wang, Z.; Besschetnova, A.; Patalano, S.; Macoska, J.A.; Gao, S.; et al. RB1 Loss in Castration-Resistant Prostate Cancer Confers Vulnerability to LSD1 Inhibition. Oncogene 2022, 41, 852–864. [Google Scholar] [CrossRef]
- Mandigo, A.C.; McNair, C.; Ku, K.; Pang, A.; Guan, Y.F.; Holst, J.; Brown, M.; Kelly, W.K.; Knudsen, K.E. Molecular Underpinnings of RB Status as a Biomarker of Poor Outcome in Advanced Prostate Cancer. J. Clin. Oncol. 2020, 38, 189. [Google Scholar] [CrossRef]
- Quigley, D.A.; Dang, H.X.; Zhao, S.G.; Lloyd, P.; Aggarwal, R.; Alumkal, J.J.; Foye, A.; Kothari, V.; Perry, M.D.; Bailey, A.M.; et al. Genomic Hallmarks and Structural Variation in Metastatic Prostate Cancer. Cell 2018, 174, 758–769.e9. [Google Scholar] [CrossRef] [PubMed]
- Robinson, D.; Van Allen, E.M.; Wu, Y.M.; Schultz, N.; Lonigro, R.J.; Mosquera, J.M.; Montgomery, B.; Taplin, M.E.; Pritchard, C.C.; Attard, G.; et al. Integrative Clinical Genomics of Advanced Prostate Cancer. Cell 2015, 161, 1215–1228. [Google Scholar] [CrossRef]
- National Comprehensive Cancer Network. Prostate Cancer NCCN Guidelines (Version 3.2023). Available online: https://www.nccn.org/guidelines/recently-published-guidelines (accessed on 19 August 2023).
- Tan, H.-L.; Sood, A.; Rahimi, H.A.; Wang, W.; Gupta, N.; Hicks, J.; Mosier, S.; Gocke, C.D.; Epstein, J.I.; Netto, G.J.; et al. Rb Loss Is Characteristic of Prostatic Small Cell Neuroendocrine Carcinoma. Clin. Cancer Res. 2014, 20, 890–903. [Google Scholar] [CrossRef] [PubMed]
- Gurevich, L.E.; Bondarenko, E.V.; Vasyukova, O.A.; Mikhaleva, L.M. The Role of Yamanaka Cocktail Transcription Factors (OCT4, SOX2, KLF4, c-Myc) in the Differentiation of Somatic Cells, Their Malignant Transformation, and Tumor Progression. Clin. Exp. Morphol. 2021, 10, 7–22. [Google Scholar] [CrossRef]
- Yoshimoto, M.; Cutz, J.C.; Nuin, P.A.S.; Joshua, A.M.; Bayani, J.; Evans, A.J.; Zielenska, M.; Squire, J.A. Interphase FISH Analysis of PTEN in Histologic Sections Shows Genomic Deletions in 68% of Primary Prostate Cancer and 23% of High-Grade Prostatic Intra-Epithelial Neoplasias. Cancer Genet. Cytogenet. 2006, 169, 128–137. [Google Scholar] [CrossRef] [PubMed]
- Myint, Z.W.; Allison, D.B.; Ellis, C.S. A Case Report of Metastatic Castration-Resistant Prostate Cancer Harboring a PTEN Loss. Front. Oncol. 2021, 11, 731002. [Google Scholar] [CrossRef]
- Leinonen, K.A.; Saramäki, O.R.; Furusato, B.; Kimura, T.; Takahashi, H.; Egawa, S.; Suzuki, H.; Keiger, K.; Hahm, S.H.; Isaacs, W.B.; et al. Loss of PTEN Is Associated with Aggressive Behavior in ERG-Positive Prostate Cancer. Cancer Epidemiol. Biomarkers Prev. 2013, 22, 2333–2344. [Google Scholar] [CrossRef]
- Abeshouse, A.; Ahn, J.; Akbani, R.; Ally, A.; Amin, S.; Andry, C.D.; Annala, M.; Aprikian, A.; Armenia, J.; Arora, A.; et al. The Molecular Taxonomy of Primary Prostate Cancer. Cell 2015, 163, 1011–1025. [Google Scholar] [CrossRef]
- Choudhury, A.D. PTEN-PI3K Pathway Alterations in Advanced Prostate Cancer and Clinical Implications. Prostate 2022, 82, S60–S72. [Google Scholar] [CrossRef]
- Acikalin Coskun, K.; Tutar, M.; Al, M.; Gok Yurttas, A.; Cansu Abay, E.; Yurekli, N.; Yeman Kiyak, B.; Ucar Cifci, K.; Tutar, Y. Role of P53 in Human Cancers. In p53—A Guardian of the Genome and Beyond; Books on Demand: New York, NY, USA, 2022. [Google Scholar]
- Ecke, T.H.; Schlechte, H.H.; Schiemenz, K.; Sachs, M.D.; Lenk, S.V.; Rudolph, B.D.; Loening, S.A. TP53 Gene Mutations in Prostate Cancer Progression. Anticancer. Res. 2010, 30, 1579–1586. [Google Scholar] [PubMed]
- Teroerde, M.; Nientiedt, C.; Duensing, A.; Hohenfellner, M.; Stenzinger, A.; Duensing, S. Revisiting the Role of P53 in Prostate Cancer. In Prostate Cancer; Exon Publications: Brisbane, Australia, 2021; pp. 113–123. [Google Scholar]
- Hientz, K.; Mohr, A.; Bhakta-Guha, D.; Efferth, T. The Role of P53 in Cancer Drug Resistance and Targeted Chemotherapy. Oncotarget 2017, 8, 8921–8946. [Google Scholar] [CrossRef] [PubMed]
- Kim, S.; An, S.S.A. Role of P53 Isoforms and Aggregations in Cancer. Medicine 2016, 95, e3993. [Google Scholar] [CrossRef] [PubMed]
- Ozaki, T.; Nakagawara, A. Role of P53 in Cell Death and Human Cancers. Cancers 2011, 3, 994–1013. [Google Scholar] [CrossRef]
- Busuttil, R.A.; Zapparoli, G.V.; Haupt, S.; Fennell, C.; Wong, S.Q.; Pang, J.M.B.; Takeno, E.A.; Mitchell, C.; Di Costanzo, N.; Fox, S.; et al. Role of P53 in the Progression of Gastric Cancer. Oncotarget 2014, 5, 12016–12026. [Google Scholar] [CrossRef]
- Antonarakis, E.S.; Lu, C.; Wang, H.; Luber, B.; Nakazawa, M.; Roeser, J.C.; Chen, Y.; Mohammad, T.A.; Chen, Y.; Fedor, H.L.; et al. AR-V7 and Resistance to Enzalutamide and Abiraterone in Prostate Cancer. N. Engl. J. Med. 2014, 371, 1028–1038. [Google Scholar] [CrossRef]
- Azad, A.; Todenhöfer, T.; Stewart, C.; Gao, J.; Eigl, B.J.; Black, P.C.; Joshua, A.M.; Chi, K.N. Correlation of AR-V7 Expression in Whole Blood with Efficacy of Abiraterone Acetate (ABI) in Metastatic Castration-Resistant Prostate Cancer (MCRPC) Patients (Pts). J. Clin. Oncol. 2016, 34, e23075. [Google Scholar] [CrossRef]
- Antonarakis, E.S.; Lu, C.; Luber, B.; Wang, H.; Chen, Y.; Zhu, Y.; Silberstein, J.L.; Taylor, M.N.; Maughan, B.L.; Paller, C.J.; et al. AR-V7 and Efficacy of Abiraterone (Abi) and Enzalutamide (Enza) in Castration-Resistant Prostate Cancer (CRPC): Expanded Analysis of the Johns Hopkins Cohort. J. Clin. Oncol. 2016, 34, 5012. [Google Scholar] [CrossRef]
- Jerónimo, C.; Usadel, H.; Henrique, R.; Silva, C.; Oliveira, J.; Lopes, C.; Sidransky, D. Quantitative GSTP1 Hypermethylation in Bodily Fluids of Patients with Prostate Cancer. Urology 2002, 60, 1131–1135. [Google Scholar] [CrossRef]
- Jamshidian, F.; Akbari, M.T.; Noormohammadi, Z.; Nourozi, M.R.; Pourmand, G.R. CpG Islands Hypermethylatioin the Promoter Region of GSTP1 Gene in Cell-Free DNA as a Noninvasive Biomarker for Detecting Prostate Cancer. Biochem. Cell. Arch. 2016, 16, 79–83. [Google Scholar]
- Friedemann, M.; Horn, F.; Gutewort, K.; Tautz, L.; Jandeck, C.; Bechmann, N.; Sukocheva, O.; Wirth, M.P.; Fuessel, S.; Menschikowski, M. Increased Sensitivity of Detection of Rassf1a and Gstp1 Dna Fragments in Serum of Prostate Cancer Patients: Optimisation of Diagnostics Using Obbpa-Ddpcr. Cancers 2021, 13, 4459. [Google Scholar] [CrossRef] [PubMed]
- Pećina-Šlaus, N. Tumor Suppressor Gene E-Cadherin and Its Role in Normal and Malignant Cells. Cancer Cell Int. 2003, 3, 17. [Google Scholar] [CrossRef]
- Quinn, D.I.; Henshall, S.M.; Sutherland, R.L. Molecular Markers of Prostate Cancer Outcome. Eur. J. Cancer 2005, 41, 858–887. [Google Scholar] [CrossRef] [PubMed]
- Ouhtit, A.; Rizeq, B.; Saleh, H.A.; Rahman, M.D.M.; Zayed, H. Novel CD44-Downstream Signaling Pathways Mediating Breast Tumor Invasion. Int. J. Biol. Sci. 2018, 14, 1782–1790. [Google Scholar] [CrossRef] [PubMed]
- Sugiura, M.; Sato, H.; Kanesaka, M.; Imamura, Y.; Sakamoto, S.; Ichikawa, T.; Kaneda, A. Epigenetic Modifications in Prostate Cancer. Int. J. Urol. 2021, 28, 140–149. [Google Scholar] [CrossRef] [PubMed]
- Moison, C.; Assemat, F.; Daunay, A.; Tost, J.; Guieysse-Peugeot, A.L.; Arimondo, P.B. Synergistic Chromatin Repression of the Tumor Suppressor Gene RARB in Human Prostate Cancers. Epigenetics 2014, 9, 477–482. [Google Scholar] [CrossRef]
- Kang, G.H.; Lee, S.; Lee, H.J.; Hwang, K.S. Aberrant CpG Island Hypermethylation of Multiple Genes in Prostate Cancer and Prostatic Intraepithelial Neoplasia. J. Pathol. 2004, 202, 233–240. [Google Scholar] [CrossRef]
- Liu, L.; Yoon, J.H.; Dammann, R.; Pfeifer, G.P. Frequent Hypermethylation of the Rassf1a Gene in Prostate Cancer. Oncogene 2002, 21, 6835–6840. [Google Scholar] [CrossRef]
- Yaqinuddin, A.; Qureshi, S.A.; Pervez, S.; Bashir, M.U.; Nazir, R.; Abbas, F. Frequent DNA Hypermethylation at the RASSF1A and APC Gene Loci in Prostate Cancer Patients of Pakistani Origin. ISRN Urol. 2013, 2013, 627249. [Google Scholar] [CrossRef]
- Maruyama, R.; Toyooka, S.; Toyooka, K.O.; Virmani, A.K.; Zöchbauer-Müller, S.; Farinas, A.J.; Minna, J.D.; McConnell, J.; Frenkel, E.P.; Gazdar, A.F. Aberrant Promoter Methylation Profile of Prostate Cancers and Its Relationship to Clinicopathological Features. Clin. Cancer Res. 2002, 8, 514–519. [Google Scholar]
- Woodson, K.; Hayes, R.; Wideroff, L.; Villaruz, L.; Tangrea, J. Hypermethylation of GSTP1, CD44, and E-Cadherin Genes in Prostate Cancer among US Blacks and Whites. Prostate 2003, 55, 199–205. [Google Scholar] [CrossRef] [PubMed]
- Uhl, B.; Gevensleben, H.; Tolkach, Y.; Sailer, V.; Majores, M.; Jung, M.; Meller, S.; Stein, J.; Ellinger, J.; Dietrich, D.; et al. PITX2 DNA Methylation as Biomarker for Individualized Risk Assessment of Prostate Cancer in Core Biopsies. J. Mol. Diagn. 2017, 19, 107–114. [Google Scholar] [CrossRef] [PubMed]
- Steiner, I.; Jung, K.; Schatz, P.; Horns, T.; Wittschieber, D.; Lein, M.; Dietel, M.; Erbersdobler, A. Gene Promoter Methylation and Its Potential Relevance in Early Prostate Cancer Diagnosis. Pathobiology 2010, 77, 260–266. [Google Scholar] [CrossRef] [PubMed]
- Gurioli, G.; Martignano, F.; Salvi, S.; Costantini, M.; Gunelli, R.; Casadio, V. GSTP1 Methylation in Cancer: A Liquid Biopsy Biomarker? Clin. Chem. Lab. Med. 2018, 56, 702–717. [Google Scholar] [CrossRef] [PubMed]
- Fiano, V.; Zugna, D.; Grasso, C.; Trevisan, M.; Delsedime, L.; Molinaro, L.; Gillio-Tos, A.; Merletti, F.; Richiardi, L. LINE-1 Methylation Status in Prostate Cancer and Non-Neoplastic Tissue Adjacent to Tumor in Association with Mortality. Epigenetics 2017, 12, 11–18. [Google Scholar] [CrossRef][Green Version]
- Zelic, R.; Fiano, V.; Zugna, D.; Grasso, C.; Delsedime, L.; Daniele, L.; Galliano, D.; Pettersson, A.; Gillio-Tos, A.; Merletti, F.; et al. Global Hypomethylation (LINE-1) and Gene-Specific Hypermethylation (GSTP1) on Initial Negative Prostate Biopsy as Markers of Prostate Cancer on a Rebiopsy. Clin. Cancer Res. 2016, 22, 984–992. [Google Scholar] [CrossRef]
- Kleb, B.; Estécio, M.R.H.; Zhang, J.; Tzelepi, V.; Chung, W.; Jelinek, J.; Navone, N.M.; Tahir, S.; Marquez, V.E.; Issa, J.P.; et al. Differentially Methylated Genes and Androgen Receptor Re-Expression in Small Cell Prostate Carcinomas. Epigenetics 2016, 11, 184–193. [Google Scholar] [CrossRef]
- Yamada, Y.; Beltran, H. Clinical and Biological Features of Neuroendocrine Prostate Cancer. Curr. Oncol. Rep. 2021, 23, 15. [Google Scholar] [CrossRef]
- Gautam, N.; Kaur, M.; Kaur, S. Structural Assembly of Polycomb Group Protein and Insight of EZH2 in Cancer Progression: A Review. J. Cancer Res. Ther. 2021, 17, 311. [Google Scholar] [CrossRef]
- Hoffmann, M.J.; Engers, R.; Florl, A.R.; Otte, A.P.; Müller, M.; Schulz, W.A. Expression Changes in EZH2, but Not in BMI-1, SIRT1, DNMT1 or DNMT3B, Are Associated with DNA Methylation Changes in Prostate Cancer. Cancer Biol. Ther. 2007, 6, 1399–1408. [Google Scholar] [CrossRef]
- Gu, X.; Gao, X.S.; Bai, Y.; Cui, M.; Xiong, W.; Han, L.; Guo, W.; Xie, M.; Peng, C.; Su, M. EZH2 Overexpression as a Biomarker of Poor Prognosis in Prostate Cancer. Int. J. Clin. Exp. Med. 2016, 9, 21829–21835. [Google Scholar]
- Sehrawat, A.; Gao, L.; Wang, Y.; Bankhead, A.; McWeeney, S.K.; King, C.J.; Schwartzman, J.; Urrutia, J.; Bisson, W.H.; Coleman, D.J.; et al. LSD1 Activates a Lethal Prostate Cancer Gene Network Independently of Its Demethylase Function. Proc. Natl. Acad. Sci. USA 2018, 115, E4179–E4188. [Google Scholar] [CrossRef] [PubMed]
- Rudolph, T.; Beuch, S.; Reuter, G. Lysine-Specific Histone Demethylase LSD1 and the Dynamic Control of Chromatin. Biol. Chem. 2013, 394, 1019–1028. [Google Scholar] [CrossRef] [PubMed]
- Tzelepi, V.; Zhang, J.; Lu, J.-F.; Kleb, B.; Wu, G.; Wan, X.; Hoang, A.; Efstathiou, E.; Sircar, K.; Navone, N.M.; et al. Modeling a Lethal Prostate Cancer Variant with Small-Cell Carcinoma Features. Clin. Cancer Res. 2012, 18, 666–677. [Google Scholar] [CrossRef]
- Anselmino, N.; Labanca, E.; Song, X.; Yang, J.; Shepherd, P.D.A.; Dong, J.; Kundra, R.; Schultz, N.; Zhang, J.; Araujo, J.C.; et al. Integrative Analysis of the MD Anderson Prostate Cancer Patient-Derived Xenograft Series (MDA PCa PDX). bioRxiv 2022. [Google Scholar] [CrossRef]
- Hong, H.; Kao, C.; Jeng, M.H.; Eble, J.N.; Koch, M.O.; Gardner, T.A.; Zhang, S.; Li, L.; Pan, C.X.; Hu, Z.; et al. Aberrant Expression of CARM1, a Transcriptional Coactivator of Androgen Receptor, in the Development of Prostate Carcinoma and Androgen-Independent Status. Cancer 2004, 101, 83–89. [Google Scholar] [CrossRef]
- Grypari, I.M.; Logotheti, S.; Zolota, V.; Troncoso, P.; Efstathiou, E.; Bravou, V.; Melachrinou, M.; Logothetis, C.; Tzelepi, V. The Protein Arginine Methyltransferases (PRMTs) PRMT1 and CARM1 as Candidate Epigenetic Drivers in Prostate Cancer Progression. Medicine 2021, 100, e27094. [Google Scholar] [CrossRef]
- Raposo, A.E.; Piller, S.C. Protein Arginine Methylation: An Emerging Regulator of the Cell Cycle. Cell Div. 2018, 13, 3. [Google Scholar] [CrossRef]
- Dawson, M.A.; Kouzarides, T. Cancer Epigenetics: From Mechanism to Therapy. Cell 2012, 150, 12–27. [Google Scholar] [CrossRef]
- Chen, Q.W.; Zhu, X.Y.; Li, Y.Y.; Meng, Z.Q. Epigenetic Regulation and Cancer (Review). Oncol. Rep. 2014, 31, 523–532. [Google Scholar] [CrossRef]
- Skourti, E.; Dhillon, P. Cancer Epigenetics: Promises and Pitfalls for Cancer Therapy. FEBS J. 2022, 289, 1156–1159. [Google Scholar] [CrossRef] [PubMed]
- Flintoft, L. Epigenetics: DNA Methylation Gets Dynamic. Nat. Rev. Genet. 2008, 9, 251. [Google Scholar] [CrossRef]
- Jerónimo, C.; Bastian, P.J.; Bjartell, A.; Carbone, G.M.; Catto, J.W.F.; Clark, S.J.; Henrique, R.; Nelson, W.G.; Shariat, S.F. Epigenetics in Prostate Cancer: Biologic and Clinical Relevance. Eur. Urol. 2011, 60, 753–766. [Google Scholar] [CrossRef] [PubMed]
- Jones, P.A. Functions of DNA Methylation: Islands, Start Sites, Gene Bodies and Beyond. Nat. Rev. Genet. 2012, 13, 484–492. [Google Scholar] [CrossRef]
- Patel, P.G.; Wessel, T.; Kawashima, A.; Okello, J.B.A.; Jamaspishvili, T.; Guérard, K.P.; Lee, L.; Lee, A.Y.W.; How, N.E.; Dion, D.; et al. A Three-Gene DNA Methylation Biomarker Accurately Classifies Early Stage Prostate Cancer. Prostate 2019, 79, 1705–1714. [Google Scholar] [CrossRef]
- Luan, Z.M.; Zhang, H.; Qu, X.L. Prediction Efficiency of PITX2 DNA Methylation for Prostate Cancer Survival. Genet. Mol. Res. 2016, 15, gmr.15026750. [Google Scholar] [CrossRef]
- Li, J.Z.; Zhang, Y.; Wen, B.; Li, M.; Wang, Y.J. Ability of PITX2 Methylation to Predict Survival in Patients with Prostate Cancer. Onco. Targets. Ther. 2015, 8, 3507–3512. [Google Scholar] [CrossRef][Green Version]
- Tzelepi, V.; Logotheti, S.; Efstathiou, E.; Troncoso, P.; Aparicio, A.; Sakellakis, M.; Hoang, A.; Perimenis, P.; Melachrinou, M.; Logothetis, C.; et al. Epigenetics and Prostate Cancer: Defining the Timing of DNA Methyltransferase Deregulation during Prostate Cancer Progression. Pathology 2020, 52, 218–227. [Google Scholar] [CrossRef]
- Chen, S.; Petricca, J.; Ye, W.; Guan, J.; Zeng, Y.; Cheng, N.; Gong, L.; Shen, S.Y.; Hua, J.T.; Crumbaker, M.; et al. The Cell-Free DNA Methylome Captures Distinctions between Localized and Metastatic Prostate Tumors. Nat. Commun. 2022, 13, 6467. [Google Scholar] [CrossRef]
- Loyfer, N.; Magenheim, J.; Peretz, A.; Cann, G.; Bredno, J.; Klochendler, A.; Fox-Fisher, I.; Shabi-Porat, S.; Hecht, M.; Pelet, T.; et al. A DNA Methylation Atlas of Normal Human Cell Types. Nature 2023, 613, 355–364. [Google Scholar] [CrossRef]
- Steffan, J.J.; Koul, S.; Meacham, R.B.; Koul, H.K. The Transcription Factor SPDEF Suppresses Prostate Tumor Metastasis. J. Biol. Chem. 2012, 287, 29968–29978. [Google Scholar] [CrossRef] [PubMed]
- Niemeyer, C.M.; Flotho, C.; Lipka, D.B.; Stary, J.; Rössig, C.; Baruchel, A.; Klingebiel, T.; Micalizzi, C.; Michel, G.; Nysom, K.; et al. Response to Upfront Azacitidine in Juvenile Myelomonocytic Leukemia in the AZA-JMML-001 Trial. Blood Adv. 2021, 5, 2901–2908. [Google Scholar] [CrossRef]
- Niemeyer, C.M.; Flotho, C.; Lipka, D.B.; Starý, J.; Rössig, C.; Baruchel, A.; Klingebiel, T.; Micalizzi, C.; Michel, G.; Nysom, K.; et al. Upfront Azacitidine (AZA) in Juvenile Myelomonocytic Leukemia (JMML): Interim Analysis of the Prospective AZA-JMML-001 Study. J. Clin. Oncol. 2019, 37, 10031. [Google Scholar] [CrossRef]
- Janssen, A.; Breuer, G.A.; Brinkman, E.K.; Van Der Meulen, A.I.; Borden, S.V.; Van Steense, B.; Bindra, R.S.; Larocque, J.R.; Karpen, G.H. A Single Double-Strand Break System Reveals Repair Dynamics and Mechanisms in Heterochromatin and Euchromatin. Genes Dev. 2016, 30, 1645–1657. [Google Scholar] [CrossRef] [PubMed]
- Fischle, W. One, Two, Three: How Histone Methylation Is Read. Epigenomics 2012, 4, 641–653. [Google Scholar] [CrossRef] [PubMed]
- Kouzarides, T. Chromatin Modifications and Their Function. Cell 2007, 128, 693–705. [Google Scholar] [CrossRef] [PubMed]
- Bernstein, B.E.; Meissner, A.; Lander, E.S. The Mammalian Epigenome. Cell 2007, 128, 669–681. [Google Scholar] [CrossRef]
- Khare, S.P.; Habib, F.; Sharma, R.; Gadewal, N.; Gupta, S.; Galande, S. HIstome—A Relational Knowledgebase of Human Histone Proteins and Histone Modifying Enzymes. Nucleic Acids Res. 2012, 40, D337–D342. [Google Scholar] [CrossRef]
- Haberland, M.; Montgomery, R.L.; Olson, E.N. The Many Roles of Histone Deacetylases in Development and Physiology: Implications for Disease and Therapy. Nat. Rev. Genet. 2009, 10, 32–42. [Google Scholar] [CrossRef]
- Shi, Y. Histone Lysine Demethylases: Emerging Roles in Development, Physiology and Disease. Nat. Rev. Genet. 2007, 8, 829–833. [Google Scholar] [CrossRef]
- Sharma, S.; Kelly, T.K.; Jones, P.A. Epigenetics in Cancer. Carcinogenesis 2009, 31, 27–36. [Google Scholar] [CrossRef] [PubMed]
- Loenarz, C.; Ge, W.; Coleman, M.L.; Rose, N.R.; Cooper, C.D.O.; Klose, R.J.; Ratcliffe, P.J.; Schofield, C.J. PHF8, a Gene Associated with Cleft Lip/Palate and Mental Retardation, Encodes for an Nepsilon-Dimethyl Lysine Demethylase. Hum. Mol. Genet. 2010, 19, 217–222. [Google Scholar] [CrossRef] [PubMed]
- Cao, R.; Wang, L.; Wang, H.; Xia, L.; Erdjument-Bromage, H.; Tempst, P.; Jones, R.S.; Zhang, Y. Role of Histone H3 Lysine 27 Methylation in Polycomb-Group Silencing. Science 2002, 298, 1039–1043. [Google Scholar] [CrossRef] [PubMed]
- Rana, Z.; Diermeier, S.; Hanif, M.; Rosengren, R.J. Understanding Failure and Improving Treatment Using HDAC Inhibitors for Prostate Cancer. Biomedicines 2020, 8, 22. [Google Scholar] [CrossRef]
- Davies, A.; Nouruzi, S.; Ganguli, D.; Namekawa, T.; Thaper, D.; Linder, S.; Karaoğlanoğlu, F.; Omur, M.E.; Kim, S.; Kobelev, M.; et al. An Androgen Receptor Switch Underlies Lineage Infidelity in Treatment-Resistant Prostate Cancer. Nat. Cell Biol. 2021, 23, 1023–1034. [Google Scholar] [CrossRef] [PubMed]
- Storck, W.K.; May, A.M.; Westbrook, T.C.; Duan, Z.; Morrissey, C.; Yates, J.A.; Alumkal, J.J. The Role of Epigenetic Change in Therapy-Induced Neuroendocrine Prostate Cancer Lineage Plasticity. Front. Endocrinol. 2022, 13, 926585. [Google Scholar] [CrossRef]
- He, L.; Hannon, G.J. Correction: MicroRNAs: Small RNAs with a Big Role in Gene Regulation. Nat. Rev. Genet. 2004, 5, 631. [Google Scholar] [CrossRef]
- Wang, X.W.; Hu, L.F.; Hao, J.; Liao, L.Q.; Chiu, Y.T.; Shi, M.; Wang, Y. A MicroRNA-Inducible CRISPR–Cas9 Platform Serves as a MicroRNA Sensor and Cell-Type-Specific Genome Regulation Tool. Nat. Cell Biol. 2019, 21, 522–530. [Google Scholar] [CrossRef]
- Misawa, A.; Takayama, K.I.; Inoue, S. Long Non-Coding RNAs and Prostate Cancer. Cancer Sci. 2017, 108, 2107–2114. [Google Scholar] [CrossRef]
- Ha, M.; Kim, V.N. Regulation of MicroRNA Biogenesis. Nat. Rev. Mol. Cell Biol. 2014, 15, 509–524. [Google Scholar] [CrossRef]
- Prensner, J.R.; Chinnaiyan, A.M. The Emergence of LncRNAs in Cancer Biology. Cancer Discov. 2011, 1, 391–407. [Google Scholar] [CrossRef] [PubMed]
- Smolle, M.A.; Bauernhofer, T.; Pummer, K.; Calin, G.A.; Pichler, M. Current Insights into Long Non-Coding RNAs (LncRNAs) in Prostate Cancer. Int. J. Mol. Sci. 2017, 18, 473. [Google Scholar] [CrossRef] [PubMed]
- Zhang, A.; Zhang, J.; Kaipainen, A.; Lucas, J.M.; Yang, H. Long Non-Coding RNA: A Newly Deciphered “Code” in Prostate Cancer. Cancer Lett. 2016, 375, 323–330. [Google Scholar] [CrossRef] [PubMed]
- An, C.; Wang, I.; Li, X.; Xia, R.; Deng, F. Long Non-Coding RNA in Prostate Cancer. Am. J. Clin. Exp. Urol. 2022, 10, 170–179. [Google Scholar]
- Pickard, M.R.; Mourtada-Maarabouni, M.; Williams, G.T. Long Non-Coding RNA GAS5 Regulates Apoptosis in Prostate Cancer Cell Lines. Biochim. Biophys. Acta-Mol. Basis Dis. 2013, 1832, 1613–1623. [Google Scholar] [CrossRef]
- Gong, X.; Ning, B. Five LncRNAs Associated With Prostate Cancer Prognosis Identified by Coexpression Network Analysis. Technol. Cancer Res. Treat. 2020, 19, 1533033820963578. [Google Scholar] [CrossRef]
- Xiong, T.; Li, J.; Chen, F.; Zhang, F. PCAT-1: A Novel Oncogenic Long Non-Coding RNA in Human Cancers. Int. J. Biol. Sci. 2019, 15, 847–856. [Google Scholar] [CrossRef]
- Yang, Z.; Zhao, S.; Zhou, X.; Zhao, H.; Jiang, X. PCAT-1: A Pivotal Oncogenic Long Non-Coding RNA in Human Cancers. Biomed. Pharmacother. 2019, 110, 493–499. [Google Scholar] [CrossRef]
- Prensner, J.R.; Iyer, M.K.; Balbin, O.A.; Dhanasekaran, S.M.; Cao, Q.; Brenner, J.C.; Laxman, B.; Asangani, I.; Grasso, C.; Kominsky, H.D.; et al. Transcriptome Sequencing Identifies PCAT-1, a Novel LincRNA Implicated in Prostate Cancer Progression. Nat. Biotechnol. 2012, 29, 742. [Google Scholar] [CrossRef]
- Prensner, J.R.; Chen, W.; Han, S.; Iyer, M.K.; Cao, Q.; Kothari, V.; Evans, J.R.; Knudsen, K.E.; Paulsen, M.T.; Ljungman, M.; et al. The Long Non-Coding RNA PCAT-1 Promotes Prostate Cancer Cell Proliferation through CMyc. Neoplasia 2014, 16, 900–908. [Google Scholar] [CrossRef]
- White, N.M.; Zhao, S.G.; Zhang, J.; Rozycki, E.B.; Dang, H.X.; McFadden, S.D.; Eteleeb, A.M.; Alshalalfa, M.; Vergara, I.A.; Erho, N.; et al. Multi-Institutional Analysis Shows That Low PCAT-14 Expression Associates with Poor Outcomes in Prostate Cancer. Eur. Urol. 2017, 71, 257–266. [Google Scholar] [CrossRef]
- Singh, N.; Ramnarine, V.R.; Song, J.H.; Pandey, R.; Padi, S.K.R.; Nouri, M.; Olive, V.; Kobelev, M.; Okumura, K.; McCarthy, D.; et al. The Long Noncoding RNA H19 Regulates Tumor Plasticity in Neuroendocrine Prostate Cancer. Nat. Commun. 2021, 12, 7349. [Google Scholar] [CrossRef]
- Bonci, D.; Coppola, V.; Patrizii, M.; Addario, A.; Cannistraci, A.; Francescangeli, F.; Pecci, R.; Muto, G.; Collura, D.; Bedini, R.; et al. A MicroRNA Code for Prostate Cancer Metastasis. Oncogene 2016, 35, 1180–1192. [Google Scholar] [CrossRef]
- Chiam, K.; Ricciardelli, C.; Bianco-Miotto, T. Epigenetic Biomarkers in Prostate Cancer: Current and Future Uses. Cancer Lett. 2014, 342, 248–256. [Google Scholar] [CrossRef]
- Walter, B.A.; Valera, V.A.; Pinto, P.A.; Merino, M.J. Comprehensive MicroRNA Profiling of Prostate Cancer. J. Cancer 2013, 4, 350–357. [Google Scholar] [CrossRef]
- Folini, M.; Gandellini, P.; Longoni, N.; Profumo, V.; Callari, M.; Pennati, M.; Colecchia, M.; Supino, R.; Veneroni, S.; Salvioni, R.; et al. MiR-21: An Oncomir on Strike in Prostate Cancer. Mol. Cancer 2010, 9, 12. [Google Scholar] [CrossRef]
- Ghorbanmehr, N.; Gharbi, S.; Korsching, E.; Tavallaei, M.; Einollahi, B.; Mowla, S.J. MiR-21-5p, MiR-141-3p, and MiR-205-5p Levels in Urine—Promising Biomarkers for the Identification of Prostate and Bladder Cancer. Prostate 2019, 79, 88–95. [Google Scholar] [CrossRef]
- Stafford, M.Y.C.; Willoughby, C.E.; Walsh, C.P.; McKenna, D.J. Prognostic Value of MiR-21 for Prostate Cancer: A Systematic Review and Meta-Analysis. Biosci. Rep. 2022, 42, BSR20211972. [Google Scholar] [CrossRef]
- Cheng, C.Y.; Hwang, C.I.; Corney, D.C.; Flesken-Nikitin, A.; Jiang, L.; Öner, G.M.; Munroe, R.J.; Schimenti, J.C.; Hermeking, H.; Nikitin, A.Y. MiR-34 Cooperates with P53 in Suppression of Prostate Cancer by Joint Regulation of Stem Cell Compartment. Cell Rep. 2014, 6, 1000–1007. [Google Scholar] [CrossRef]
- Oh-Hohenhorst, S.J.; Lange, T. Role of Metastasis-Related Micrornas in Prostate Cancer Progression and Treatment. Cancers 2021, 13, 4492. [Google Scholar] [CrossRef]
- Zhao, Z.; Weickmann, S.; Jung, M.; Lein, M.; Kilic, E.; Stephan, C.; Erbersdobler, A.; Fendler, A.; Jung, K. A Novel Predictor Tool of Biochemical Recurrence after Radical Prostatectomy Based on a Five-MicroRNA Tissue Signature. Cancers 2019, 11, 1603. [Google Scholar] [CrossRef]
- Liu, F.; Fan, Y.; Ou, L.; Li, T.; Fan, J.; Duan, L.; Yang, J.; Luo, C.; Wu, X. CircHIPK3 Facilitates the G2/M Transition in Prostate Cancer Cells by Sponging MiR-338-3p. Onco. Targets. Ther. 2020, 13, 4545–4558. [Google Scholar] [CrossRef] [PubMed]
- Chen, D.; Lu, X.; Yang, F.; Xing, N. Circular RNA CircHIPK3 Promotes Cell Proliferation and Invasion of Prostate Cancer by Sponging MiR-193a-3p and Regulating MCL1 Expression. Cancer Manag. Res. 2019, 11, 1415–1423. [Google Scholar] [CrossRef] [PubMed]
- Liu, D.C.; Song, L.L.; Li, X.Z.; Liang, Q.; Zhang, Z.G.; Han, C.H. Circular RNA CircHIPK3 Modulates Prostate Cancer Progression via Targeting MiR-448/MTDH Signaling. Clin. Transl. Oncol. 2021, 23, 2497–2506. [Google Scholar] [CrossRef] [PubMed]
- Cai, C.; Zhi, Y.; Wang, K.; Zhang, P.; Ji, Z.; Xie, C.; Sun, F. CircHIPK3 Overexpression Accelerates the Proliferation and Invasion of Prostate Cancer Cells through Regulating MiRNA-338-3p. Onco. Targets. Ther. 2019, 12, 3363–3372. [Google Scholar] [CrossRef]
- Xie, X.; Sun, F.K.; Huang, X.; Wang, C.H.; Dai, J.; Zhao, J.P.; Fang, C.; He, W. A Circular RNA, CircSMARCA5, Inhibits Prostate Cancer Proliferative, Migrative, and Invasive Capabilities via the MiR-181b-5p/MiR-17-3p-TIMP3 Axis. Aging 2021, 13, 19908–19919. [Google Scholar] [CrossRef]
- Yi, C.; Wan, X.; Zhang, Y.; Fu, F.; Zhao, C.; Qin, R.; Wu, H.; Li, Y.; Huang, Y. SNORA42 Enhances Prostate Cancer Cell Viability, Migration and EMT and Is Correlated with Prostate Cancer Poor Prognosis. Int. J. Biochem. Cell Biol. 2018, 102, 138–150. [Google Scholar] [CrossRef]
- Zhang, L.; Meng, X.; Pan, C.; Qu, F.; Gan, W.; Xiang, Z.; Han, X.; Li, D. PiR-31470 Epigenetically Suppresses the Expression of Glutathione S-Transferase Pi 1 in Prostate Cancer via DNA Methylation. Cell. Signal. 2020, 67, 109501. [Google Scholar] [CrossRef]
- Zhang, L.; Meng, X.; Li, D.; Han, X. PiR-001773 and PiR-017184 Promote Prostate Cancer Progression by Interacting with PCDH9. Cell. Signal. 2020, 76, 109780. [Google Scholar] [CrossRef]
- Visser, W.C.H.; de Jong, H.; Melchers, W.J.G.; Mulders, P.F.A.; Schalken, J.A. Commercialized Blood-, Urinary-and Tissue-Based Biomarker Tests for Prostate Cancer Diagnosis and Prognosis. Cancers 2020, 12, 3790. [Google Scholar] [CrossRef]
- Salami, S.S.; Hovelson, D.H.; Kaplan, J.B.; Mathieu, R.; Udager, A.M.; Curci, N.E.; Lee, M.; Plouffe, K.R.; de la Vega, L.L.; Susani, M.; et al. Transcriptomic Heterogeneity in Multifocal Prostate Cancer. JCI Insight 2018, 3, e123468. [Google Scholar] [CrossRef]
- Wei, L.; Wang, J.; Lampert, E.; Schlanger, S.; DePriest, A.D.; Hu, Q.; Gomez, E.C.; Murakam, M.; Glenn, S.T.; Conroy, J.; et al. Intratumoral and Intertumoral Genomic Heterogeneity of Multifocal Localized Prostate Cancer Impacts Molecular Classifications and Genomic Prognosticators. Eur. Urol. 2017, 71, 183–192. [Google Scholar] [CrossRef] [PubMed]
- Chen, S.; Zhu, G.; Yang, Y.; Wang, F.; Xiao, Y.T.; Zhang, N.; Bian, X.; Zhu, Y.; Yu, Y.; Liu, F.; et al. Single-Cell Analysis Reveals Transcriptomic Remodellings in Distinct Cell Types That Contribute to Human Prostate Cancer Progression. Nat. Cell Biol. 2021, 23, 87–98. [Google Scholar] [CrossRef] [PubMed]
- Spratt, D.E.; Alshalalfa, M.; Fishbane, N.; Weiner, A.B.; Mehra, R.; Mahal, B.A.; Lehrer, J.; Liu, Y.; Zhao, S.G.; Speers, C.; et al. Transcriptomic Heterogeneity of Androgen Receptor Activity Defines a de Novo Low AR-Active Subclass in Treatment Naïve Primary Prostate Cancer. Clin. Cancer Res. 2019, 25, 6721–6730. [Google Scholar] [CrossRef] [PubMed]
- Sutera, P.A.; Shetty, A.C.; Hakansson, A.; Van der Eecken, K.; Song, Y.; Liu, Y.; Chang, J.; Fonteyne, V.; Mendes, A.A.; Lumen, N.; et al. Transcriptomic and Clinical Heterogeneity of Metastatic Disease Timing within Metastatic Castration-Sensitive Prostate Cancer. Ann. Oncol. 2023, 34, 605–614. [Google Scholar] [CrossRef] [PubMed]
- Han, H.; Lee, H.H.; Choi, K.; Moon, Y.J.; Heo, J.E.; Ham, W.S.; Jang, W.S.; Rha, K.H.; Cho, N.H.; Giancotti, F.G.; et al. Prostate Epithelial Genes Define Therapy-Relevant Prostate Cancer Molecular Subtype. Prostate Cancer Prostatic Dis. 2021, 24, 1080–1092. [Google Scholar] [CrossRef]
- Cuzick, J.M.; Fisher, G.; Berney, D.; Mesher, D.; Møller, H.; Reid, J.E.; Gutin, A.; Lanchbury, J.S.; Stone, S. Prognostic Value of a 46-Gene Cell Cycle Progression (CCP) RNA Signature for Prostate Cancer Death in a Conservatively Managed Watchful Waiting Needle Biopsy Cohort. J. Clin. Oncol. 2011, 29, 4542. [Google Scholar] [CrossRef]
- Erho, N.; Crisan, A.; Vergara, I.A.; Mitra, A.P.; Ghadessi, M.; Buerki, C.; Bergstralh, E.J.; Kollmeyer, T.; Fink, S.; Haddad, Z.; et al. Discovery and Validation of a Prostate Cancer Genomic Classifier That Predicts Early Metastasis Following Radical Prostatectomy. PLoS ONE 2013, 8, e66855. [Google Scholar] [CrossRef]
- Klein, E.A.; Cooperberg, M.R.; Magi-Galluzzi, C.; Simko, J.P.; Falzarano, S.M.; Maddala, T.; Chan, J.M.; Li, J.; Cowan, J.E.; Tsiatis, A.C.; et al. A 17-Gene Assay to Predict Prostate Cancer Aggressiveness in the Context of Gleason Grade Heterogeneity, Tumor Multifocality, and Biopsy Undersampling. Eur. Urol. 2014, 66, 550–560. [Google Scholar] [CrossRef]
- Ståhl, P.L.; Salmén, F.; Vickovic, S.; Lundmark, A.; Navarro, J.F.; Magnusson, J.; Giacomello, S.; Asp, M.; Westholm, J.O.; Huss, M.; et al. Visualization and Analysis of Gene Expression in Tissue Sections by Spatial Transcriptomics. Science 2016, 353, 78–82. [Google Scholar] [CrossRef]
- Yu, Q.; Jiang, M.; Wu, L. Spatial Transcriptomics Technology in Cancer Research. Front. Oncol. 2022, 12, 1019111. [Google Scholar] [CrossRef]
- Mutuku, S.M.; Spotbeen, X.; Trim, P.J.; Snel, M.F.; Butler, L.M.; Swinnen, J.V. Unravelling Prostate Cancer Heterogeneity Using Spatial Approaches to Lipidomics and Transcriptomics. Cancers 2022, 14, 1702. [Google Scholar] [CrossRef]
- Watanabe, R.; Miura, N.; Kurata, M.; Kitazawa, R.; Kikugawa, T.; Saika, T. Spatial Gene Expression Analysis Reveals Characteristic Gene Expression Patterns of De Novo Neuroendocrine Prostate Cancer Coexisting with Androgen Receptor Pathway Prostate Cancer. Int. J. Mol. Sci. 2023, 24, 8955. [Google Scholar] [CrossRef]
- Wang, Y.; Ma, S.; Ruzzo, W.L. Spatial Modeling of Prostate Cancer Metabolic Gene Expression Reveals Extensive Heterogeneity and Selective Vulnerabilities. Sci. Rep. 2020, 10, 3490. [Google Scholar] [CrossRef]
- Berglund, E.; Maaskola, J.; Schultz, N.; Friedrich, S.; Marklund, M.; Bergenstråhle, J.; Tarish, F.; Tanoglidi, A.; Vickovic, S.; Larsson, L.; et al. Spatial Maps of Prostate Cancer Transcriptomes Reveal an Unexplored Landscape of Heterogeneity. Nat. Commun. 2018, 9, 2419. [Google Scholar] [CrossRef]
- Cunha, G.R.; Lung, B. The Possible Influence of Temporal Factors in Androgenic Responsiveness of Urogenital Tissue Recombinants from Wild-type and Androgen-insensitive (Tfm) Mice. J. Exp. Zool. 1978, 205, 181–193. [Google Scholar] [CrossRef]
- Cunha, G.R.; Hayward, S.W.; Wang, Y.Z. Role of Stroma in Carcinogenesis of the Prostate. Differentiation 2002, 70, 473–485. [Google Scholar] [CrossRef]
- Niu, Y.N.; Xia, S.J. Stroma-Epithelium Crosstalk in Prostate Cancer. Asian J. Androl. 2009, 11, 28–35. [Google Scholar] [CrossRef]
- Arnold, J.T.; Gray, N.E.; Jacobowitz, K.; Viswanathan, L.; Cheung, P.W.; McFann, K.K.; Le, H.; Blackman, M.R. Human Prostate Stromal Cells Stimulate Increased PSA Production in DHEA-Treated Prostate Cancer Epithelial Cells. J. Steroid Biochem. Mol. Biol. 2008, 111, 240–246. [Google Scholar] [CrossRef]
- Owen, J.S.; Clayton, A.; Pearson, H.B. Cancer-Associated Fibroblast Heterogeneity, Activation and Function: Implications for Prostate Cancer. Biomolecules 2023, 13, 67. [Google Scholar] [CrossRef]
- Mo, F.; Lin, D.; Takhar, M.; Ramnarine, V.R.; Dong, X.; Bell, R.H.; Volik, S.V.; Wang, K.; Xue, H.; Wang, Y.; et al. Stromal Gene Expression Is Predictive for Metastatic Primary Prostate Cancer. Eur. Urol. 2018, 73, 524–532. [Google Scholar] [CrossRef] [PubMed]
- González, L.O.; Eiro, N.; Fraile, M.; Beridze, N.; Escaf, A.R.; Escaf, S.; Fernández-Gómez, J.M.; Vizoso, F.J. Prostate Cancer Tumor Stroma: Responsibility in Tumor Biology, Diagnosis and Treatment. Cancers 2022, 14, 4412. [Google Scholar] [CrossRef] [PubMed]
- Henshall, S.M.; Quinn, D.I.; Lee, C.S.; Head, D.R.; Golovsky, D.; Brenner, P.C.; Delprado, W.; Stricker, P.D.; Grygiel, J.J.; Sutherland, R.L. Altered Expression of Androgen Receptor in the Malignant Epithelium and Adjacent Stroma Is Associated with Early Relapse in Prostate Cancer. Cancer Res. 2001, 61, 423–427. [Google Scholar] [PubMed]
- Ricciardelli, C.; Choong, C.S.; Buchanan, G.; Vivekanandan, S.; Neufing, P.; Stahl, J.; Marshall, V.R.; Horsfall, D.J.; Tilley, W.D. Androgen Receptor Levels in Prostate Cancer Epithelial and Peritumoral Stromal Cells Identify Non-Organ Confined Disease. Prostate 2005, 63, 19–28. [Google Scholar] [CrossRef]
- Leach, D.A.; Buchanan, G. Stromal Androgen Receptor in Prostate Cancer Development and Progression. Cancers 2017, 9, 10. [Google Scholar] [CrossRef] [PubMed]
- Jia, Z.; Rahmatpanah, F.B.; Chen, X.; Lernhardt, W.; Wang, Y.; Xia, X.Q.; Sawyers, A.; Sutton, M.; McClelland, M.; Mercola, D. Expression Changes in the Stroma of Prostate Cancer Predict Subsequent Relapse. PLoS ONE 2012, 7, e41371. [Google Scholar] [CrossRef]
- Jia, Z.; Wang, Y.; Sawyers, A.; Yao, H.; Rahmatpanah, F.; Xia, O.Q.; Xu, Q.; Pio, R.; Turan, T.; Koziol, J.A.; et al. Diagnosis of Prostate Cancer Using Differentially Expressed Genes in Stroma. Cancer Res. 2011, 71, 2476–2487. [Google Scholar] [CrossRef]
- Kester, L.; van Oudenaarden, A. Single-Cell Transcriptomics Meets Lineage Tracing. Cell Stem Cell 2018, 23, 166–179. [Google Scholar] [CrossRef]
- Kretzschmar, K.; Watt, F.M. Lineage Tracing. Cell 2012, 148, 33–45. [Google Scholar] [CrossRef]
- Humphreys, B.D.; Dirocco, D.P. Lineage-Tracing Methods and the Kidney. Kidney Int. 2014, 86, 481–488. [Google Scholar] [CrossRef]
- Klein, A.M.; Mazutis, L.; Akartuna, I.; Tallapragada, N.; Veres, A.; Li, V.; Peshkin, L.; Weitz, D.A.; Kirschner, M.W. Droplet Barcoding for Single-Cell Transcriptomics Applied to Embryonic Stem Cells. Cell 2015, 161, 1187–1201. [Google Scholar] [CrossRef] [PubMed]
- Hsu, Y.C. Theory and Practice of Lineage Tracing. Stem Cells 2015, 33, 3197–3204. [Google Scholar] [CrossRef] [PubMed]
- Lamprecht, S.; Schmidt, E.M.; Blaj, C.; Hermeking, H.; Jung, A.; Kirchner, T.; Horst, D. Multicolor Lineage Tracing Reveals Clonal Architecture and Dynamics in Colon Cancer. Nat. Commun. 2017, 8, 1406. [Google Scholar] [CrossRef] [PubMed]
- Singh, K.; Bailey-Lundberg, J.M. Murine Models for Lineage Tracing Cancer Initiating Cells. In Methods in Molecular Biology; Springer Nature: Cham, Switzerland, 2022. [Google Scholar]
- Wolf, S.; Wan, Y.; McDole, K. Current Approaches to Fate Mapping and Lineage Tracing Using Image Data. Development 2021, 148, dev198994. [Google Scholar] [CrossRef] [PubMed]
- Griffiths, J.A.; Scialdone, A.; Marioni, J.C. Using Single-cell Genomics to Understand Developmental Processes and Cell Fate Decisions. Mol. Syst. Biol. 2018, 14, e8046. [Google Scholar] [CrossRef]
- VanHorn, S.; Morris, S.A. Next-Generation Lineage Tracing and Fate Mapping to Interrogate Development. Dev. Cell 2021, 56, 7–21. [Google Scholar] [CrossRef]
- Forrow, A.; Schiebinger, G. LineageOT Is a Unified Framework for Lineage Tracing and Trajectory Inference. Nat. Commun. 2021, 12, 4940. [Google Scholar] [CrossRef]
- Wagner, D.E.; Klein, A.M. Lineage Tracing Meets Single-Cell Omics: Opportunities and Challenges. Nat. Rev. Genet. 2020, 21, 410–427. [Google Scholar] [CrossRef]
- Fletcher, R.B.; Das, D.; Ngai, J. Creating Lineage Trajectory Maps Via Integration of Single-Cell RNA-Sequencing and Lineage Tracing. BioEssays 2018, 40, e1800056. [Google Scholar] [CrossRef]
- Chen, C.; Liao, Y.; Peng, G. Connecting Past and Present: Single-Cell Lineage Tracing. Protein Cell 2022, 13, 790–807. [Google Scholar] [CrossRef]
- Gabbutt, C.; Schenck, R.O.; Weisenberger, D.J.; Kimberley, C.; Berner, A.; Househam, J.; Lakatos, E.; Robertson-Tessi, M.; Martin, I.; Patel, R.; et al. Fluctuating Methylation Clocks for Cell Lineage Tracing at High Temporal Resolution in Human Tissues. Nat. Biotechnol. 2022, 40, 720–730. [Google Scholar] [CrossRef] [PubMed]
- Marjanovic, N.D.; Hofree, M.; Chan, J.E.; Canner, D.; Wu, K.; Trakala, M.; Hartmann, G.G.; Smith, O.C.; Kim, J.Y.; Evans, K.V.; et al. Emergence of a High-Plasticity Cell State during Lung Cancer Evolution. Cancer Cell 2020, 38, 229–246.e13. [Google Scholar] [CrossRef] [PubMed]
- LaFave, L.M.; Kartha, V.K.; Ma, S.; Meli, K.; Del Priore, I.; Lareau, C.; Naranjo, S.; Westcott, P.M.K.; Duarte, F.M.; Sankar, V.; et al. Epigenomic State Transitions Characterize Tumor Progression in Mouse Lung Adenocarcinoma. Cancer Cell 2020, 38, 212–228.e13. [Google Scholar] [CrossRef] [PubMed]
- Blanco, M.A.; Sykes, D.B.; Gu, L.; Wu, M.; Petroni, R.; Karnik, R.; Wawer, M.; Rico, J.; Li, H.; Jacobus, W.D.; et al. Chromatin-State Barriers Enforce an Irreversible Mammalian Cell Fate Decision. Cell Rep. 2021, 37, 109967. [Google Scholar] [CrossRef]
- Berenguer, J.; Celià-Terrassa, T. Cell Memory of Epithelial-Mesenchymal Plasticity in Cancer. Curr. Opin. Cell Biol. 2021, 69, 103–110. [Google Scholar] [CrossRef]
- Tang, F.; Xu, D.; Wang, S.; Wong, C.K.; Martinez-Fundichely, A.; Lee, C.J.; Cohen, S.; Park, J.; Hill, C.E.; Eng, K.; et al. Chromatin Profiles Classify Castration-Resistant Prostate Cancers Suggesting Therapeutic Targets. Science 2022, 376, eabe1505. [Google Scholar] [CrossRef]
- Soundararajan, R.; Viscuse, P.; Pilie, P.; Liu, J.; Logotheti, S.; Laberiano Fernández, C.; Lorenzini, D.; Hoang, A.; Lu, W.; Soto, L.M.; et al. Genotype-to-Phenotype Associations in the Aggressive Variant Prostate Cancer Molecular Profile (AVPC-m) Components. Cancers 2022, 14, 3233. [Google Scholar] [CrossRef]
- Formaggio, N.; Rubin, M.A.; Theurillat, J.P. Loss and Revival of Androgen Receptor Signaling in Advanced Prostate Cancer. Oncogene 2021, 40, 1205–1216. [Google Scholar] [CrossRef]
- Ling, B.; Liao, X.; Huang, Y.; Liang, L.; Jiang, Y.; Pang, Y.; Qi, G. Identification of Prognostic Markers of Lung Cancer through Bioinformatics Analysis and in Vitro Experiments. Int. J. Oncol. 2020, 56, 193–205. [Google Scholar] [CrossRef]
- Huang, G.J.; Yang, B.B. Identification of Core MiRNA Prognostic Markers in Patients with Laryngeal Cancer Using Bioinformatics Analysis. Eur. Arch. Oto-Rhino-Laryngol. 2021, 278, 1613–1626. [Google Scholar] [CrossRef]
- Chen, Y.; Gong, Y.; Dou, L.; Zhou, X.; Zhang, Y. Bioinformatics Analysis Methods for Cell-Free DNA. Comput. Biol. Med. 2022, 143, 105283. [Google Scholar] [CrossRef] [PubMed]
- Gao, Y.; Liu, J.; Qian, X.; He, X. Identification of Markers Associated with Brain Metastasis from Breast Cancer through Bioinformatics Analysis and Verification in Clinical Samples. Gland Surg. 2021, 10, 924–942. [Google Scholar] [CrossRef] [PubMed]
- Huang, H.; Zhang, Q.; Ye, C.; Lv, J.M.; Liu, X.; Chen, L.; Wu, H.; Yin, L.; Cui, X.G.; Xu, D.F.; et al. Identification of Prognostic Markers of High Grade Prostate Cancer through an Integrated Bioinformatics Approach. J. Cancer Res. Clin. Oncol. 2017, 143, 2571–2579. [Google Scholar] [CrossRef] [PubMed]
- Ye, D.M.; Xu, G.; Ma, W.; Li, Y.; Luo, W.; Xiao, Y.; Liu, Y.; Zhang, Z. Significant Function and Research Progress of Biomarkers in Gastric Cancer (Review). Oncol. Lett. 2020, 19, 17–29. [Google Scholar] [CrossRef] [PubMed]
- Van De Vijver, M.J. Molecular Tests as Prognostic Factors in Breast Cancer. Virchows Arch. 2014, 464, 283–291. [Google Scholar] [CrossRef]
- Hynst, J.; Navrkalova, V.; Pal, K.; Pospisilova, S. Bioinformatic Strategies for the Analysis of Genomic Aberrations Detected by Targeted NGS Panels with Clinical Application. PeerJ 2021, 9, e10897. [Google Scholar] [CrossRef]
- Garcia-Moreno, A.; López-Domínguez, R.; Villatoro-García, J.A.; Ramirez-Mena, A.; Aparicio-Puerta, E.; Hackenberg, M.; Pascual-Montano, A.; Carmona-Saez, P. Functional Enrichment Analysis of Regulatory Elements. Biomedicines 2022, 10, 590. [Google Scholar] [CrossRef]
- Zhao, K.; Rhee, S.Y. Interpreting Omics Data with Pathway Enrichment Analysis. Trends Genet. 2023, 39, 308–319. [Google Scholar] [CrossRef]
- Cibulskis, K.; Lawrence, M.S.; Carter, S.L.; Sivachenko, A.; Jaffe, D.; Sougnez, C.; Gabriel, S.; Meyerson, M.; Lander, E.S.; Getz, G. Sensitive Detection of Somatic Point Mutations in Impure and Heterogeneous Cancer Samples. Nat. Biotechnol. 2013, 31, 213–219. [Google Scholar] [CrossRef]
- do Valle, Í.F.; Giampieri, E.; Simonetti, G.; Padella, A.; Manfrini, M.; Ferrari, A.; Papayannidis, C.; Zironi, I.; Garonzi, M.; Bernardi, S.; et al. Optimized Pipeline of MuTect and GATK Tools to Improve the Detection of Somatic Single Nucleotide Polymorphisms in Whole-Exome Sequencing Data. BMC Bioinform. 2016, 17, 27–35. [Google Scholar] [CrossRef]
- Cibulskis, K.; Lawrence, M.S.; Carter, S.L.; Sivachenko, A.; Jaffe, D.; Sougnez, C.; Gabriel, S.; Meyerson, M.; Lander, E.S.; Getz, G. MuTect—Brief Summary. Nat. Biotechnol. 2013, 31, 213–219. [Google Scholar] [CrossRef] [PubMed]
- Mayakonda, A.; Lin, D.C.; Assenov, Y.; Plass, C.; Koeffler, H.P. Maftools: Efficient and Comprehensive Analysis of Somatic Variants in Cancer. Genome Res. 2018, 28, 1747–1756. [Google Scholar] [CrossRef] [PubMed]
- Wen, C.; Ge, Q.; Dai, B.; Li, J.; Yang, F.; Meng, J.; Gao, S.; Fan, S.; Zhang, L. Signature for Prostate Cancer Based on Autophagy-Related Genes and a Nomogram for Quantitative Risk Stratification. Dis. Markers 2022, 2022, 7598942. [Google Scholar] [CrossRef] [PubMed]
- Minussi, D.C.; Sei, E.; Wang, J.; Schalck, A.; Yan, Y.; Davis, A.; Wu, H.-J.; Bai, S.; Peng, C.; Hu, M.; et al. Resolving Clonal Substructure from Single Cell Genomic Data Using CopyKit. bioRxiv 2022. [Google Scholar] [CrossRef]
- Mallory, X.F.; Edrisi, M.; Navin, N.; Nakhleh, L. Assessing the Performance of Methods for Copy Number Aberration Detection from Single-Cell DNA Sequencing Data. PLoS Comput. Biol. 2020, 16, e1008012. [Google Scholar] [CrossRef] [PubMed]
- Zaccaria, S.; Raphael, B.J. Characterizing the Allele- and Haplotype-Specific Copy Number Landscape of Cancer Genomes at Single-Cell Resolution with CHISEL. Nat. Biotechnol. 2021, 39, 207–214. [Google Scholar] [CrossRef]
- Garvin, T.; Aboukhalil, R.; Kendall, J.; Baslan, T.; Atwal, G.S.; Hicks, J.; Wigler, M.; Schatz, M.C. Interactive Analysis and Assessment of Single-Cell Copy-Number Variations. Nat. Methods 2015, 12, 1058–1060. [Google Scholar] [CrossRef]
- Schiebinger, G.; Shu, J.; Tabaka, M.; Cleary, B.; Subramanian, V.; Solomon, A.; Gould, J.; Liu, S.; Lin, S.; Berube, P.; et al. Optimal-Transport Analysis of Single-Cell Gene Expression Identifies Developmental Trajectories in Reprogramming. Cell 2019, 176, 928–943.e22. [Google Scholar] [CrossRef]
- Qiu, X.; Mao, Q.; Tang, Y.; Wang, L.; Chawla, R.; Pliner, H.A.; Trapnell, C. Reversed Graph Embedding Resolves Complex Single-Cell Trajectories. Nat. Methods 2017, 14, 979–982. [Google Scholar] [CrossRef]
- Trapnell, C.; Cacchiarelli, D.; Grimsby, J.; Pokharel, P.; Li, S.; Morse, M.; Lennon, N.J.; Livak, K.J.; Mikkelsen, T.S.; Rinn, J.L. The Dynamics and Regulators of Cell Fate Decisions Are Revealed by Pseudotemporal Ordering of Single Cells. Nat. Biotechnol. 2014, 32, 381–386. [Google Scholar] [CrossRef]
- Satija, R.; Farrell, J.A.; Gennert, D.; Schier, A.F.; Regev, A. Spatial Reconstruction of Single-Cell Gene Expression Data. Nat. Biotechnol. 2015, 33, 495–502. [Google Scholar] [CrossRef] [PubMed]
- Butler, A.; Hoffman, P.; Smibert, P.; Papalexi, E.; Satija, R. Integrating Single-Cell Transcriptomic Data across Different Conditions, Technologies, and Species. Nat. Biotechnol. 2018, 36, 411–420. [Google Scholar] [CrossRef] [PubMed]
- Tirosh, I.; Izar, B.; Prakadan, S.M.; Wadsworth, M.H.; Treacy, D.; Trombetta, J.J.; Rotem, A.; Rodman, C.; Lian, C.; Murphy, G.; et al. Dissecting the Multicellular Ecosystem of Metastatic Melanoma by Single-Cell RNA-Seq. Science 2016, 352, 189–196. [Google Scholar] [CrossRef]
- Andreatta, M.; Carmona, S.J. UCell: Robust and Scalable Single-Cell Gene Signature Scoring. Comput. Struct. Biotechnol. J. 2021, 19, 3796–3798. [Google Scholar] [CrossRef] [PubMed]
- Stuart, T.; Butler, A.; Hoffman, P.; Hafemeister, C.; Papalexi, E.; Mauck, W.M.; Hao, Y.; Stoeckius, M.; Smibert, P.; Satija, R. Comprehensive Integration of Single-Cell Data. Cell 2019, 177, 1888–1902.e21. [Google Scholar] [CrossRef]
- Gulati, G.S.; Sikandar, S.S.; Wesche, D.J.; Manjunath, A.; Bharadwaj, A.; Berger, M.J.; Ilagan, F.; Kuo, A.H.; Hsieh, R.W.; Cai, S.; et al. Single-Cell Transcriptional Diversity Is a Hallmark of Developmental Potential. Science 2020, 367, 405–411. [Google Scholar] [CrossRef]
- Zhang, Y.; Liu, T.; Meyer, C.A.; Eeckhoute, J.; Johnson, D.S.; Bernstein, B.E.; Nussbaum, C.; Myers, R.M.; Brown, M.; Li, W.; et al. Model-Based Analysis of ChIP-Seq (MACS). Genome Biol. 2008, 9, R137. [Google Scholar] [CrossRef]
- Feng, J.; Liu, T.; Qin, B.; Zhang, Y.; Liu, X.S. Identifying ChIP-Seq Enrichment Using MACS. Nat. Protoc. 2012, 7, 1728–1740. [Google Scholar] [CrossRef]
- Gaspar, J.M. Improved Peak-Calling with MACS2. bioRxiv 2018, 496521. [Google Scholar] [CrossRef]
- Xu, S.; Grullon, S.; Ge, K.; Peng, W. Spatial Clustering for Identification of Chip-Enriched Regions (SICER) to Map Regions of Histone Methylation Patterns in Embryonic Stem Cells. Methods Mol. Biol. 2014, 1150, 97–111. [Google Scholar] [CrossRef]
- Yu, G.; Wang, L.G.; He, Q.Y. ChIP Seeker: An R/Bioconductor Package for ChIP Peak Annotation, Comparison and Visualization. Bioinformatics 2015, 31, 2382–2383. [Google Scholar] [CrossRef] [PubMed]
- Krueger, F.; Andrews, S.R. Bismark: A Flexible Aligner and Methylation Caller for Bisulfite-Seq Applications. Bioinformatics 2011, 27, 1571–1572. [Google Scholar] [CrossRef] [PubMed]
- Chen, P.-Y.; Cokus, S.J.; Pellegrini, M. BS Seeker: Precise Mapping for Bisulfite Sequencing. BMC Bioinform. 2010, 11, 203. [Google Scholar] [CrossRef] [PubMed]
- Akalin, A.; Kormaksson, M.; Li, S.; Garrett-Bakelman, F.E.; Figueroa, M.E.; Melnick, A.; Mason, C.E. MethylKit: A Comprehensive R Package for the Analysis of Genome-Wide DNA Methylation Profiles. Genome Biol. 2012, 13, R87. [Google Scholar] [CrossRef] [PubMed]
- Akalin, A.; Franke, V.; Vlahoviček, K.; Mason, C.E.; Schübeler, D. Genomation: A Toolkit to Summarize, Annotate and Visualize Genomic Intervals. Bioinformatics 2015, 31, 1127–1129. [Google Scholar] [CrossRef]
- Fang, R.; Preissl, S.; Li, Y.; Hou, X.; Lucero, J.; Wang, X.; Motamedi, A.; Shiau, A.K.; Zhou, X.; Xie, F.; et al. Comprehensive Analysis of Single Cell ATAC-Seq Data with SnapATAC. Nat. Commun. 2021, 12, 1337. [Google Scholar] [CrossRef]
- Ma, W.; Lu, J.; Wu, H. Cellcano: Supervised Cell Type Identification for Single Cell ATAC-Seq Data. Nat. Commun. 2023, 14, 1864. [Google Scholar] [CrossRef]
- Stuart, T.; Srivastava, A.; Madad, S.; Lareau, C.A.; Satija, R. Single-Cell Chromatin State Analysis with Signac. Nat. Methods 2021, 18, 1333–1341. [Google Scholar] [CrossRef]
- Chen, X.; Chen, S.; Song, S.; Gao, Z.; Hou, L.; Zhang, X.; Lv, H.; Jiang, R. Cell Type Annotation of Single-Cell Chromatin Accessibility Data via Supervised Bayesian Embedding. Nat. Mach. Intell. 2022, 4, 116–126. [Google Scholar] [CrossRef]
- Subramanian, A.; Tamayo, P.; Mootha, V.K.; Mukherjee, S.; Ebert, B.L.; Gillette, M.A.; Paulovich, A.; Pomeroy, S.L.; Golub, T.R.; Lander, E.S.; et al. Gene Set Enrichment Analysis: A Knowledge-Based Approach for Interpreting Genome-Wide Expression Profiles. Proc. Natl. Acad. Sci. USA 2005, 102, 15545–15550. [Google Scholar] [CrossRef]
- Krämer, A.; Green, J.; Pollard, J.; Tugendreich, S. Causal Analysis Approaches in Ingenuity Pathway Analysis. Bioinformatics 2014, 30, 523–530. [Google Scholar] [CrossRef] [PubMed]
- Chen, E.Y.; Tan, C.M.; Kou, Y.; Duan, Q.; Wang, Z.; Meirelles, G.V.; Clark, N.R.; Ma’ayan, A. Enrichr: Interactive and Collaborative HTML5 Gene List Enrichment Analysis Tool. BMC Bioinform. 2013, 14, 128. [Google Scholar] [CrossRef] [PubMed]
- Kuleshov, M.V.; Jones, M.R.; Rouillard, A.D.; Fernandez, N.F.; Duan, Q.; Wang, Z.; Koplev, S.; Jenkins, S.L.; Jagodnik, K.M.; Lachmann, A.; et al. Enrichr: A Comprehensive Gene Set Enrichment Analysis Web Server 2016 Update. Nucleic Acids Res. 2016, 44, W90–W97. [Google Scholar] [CrossRef]
- Xie, Z.; Bailey, A.; Kuleshov, M.V.; Clarke, D.J.B.; Evangelista, J.E.; Jenkins, S.L.; Lachmann, A.; Wojciechowicz, M.L.; Kropiwnicki, E.; Jagodnik, K.M.; et al. Gene Set Knowledge Discovery with Enrichr. Curr. Protoc. 2021, 1, e90. [Google Scholar] [CrossRef] [PubMed]
- Thanati, F.; Karatzas, E.; Baltoumas, F.A.; Stravopodis, D.J.; Eliopoulos, A.G.; Pavlopoulos, G.A. FLAME: A Web Tool for Functional and Literature Enrichment Analysis of Multiple Gene Lists. Biology 2021, 10, 665. [Google Scholar] [CrossRef] [PubMed]
- Shah, S.P.; Xuan, X.; DeLeeuw, R.J.; Khojasteh, M.; Lam, W.L.; Ng, R.; Murphy, K.P. Integrating Copy Number Polymorphisms into Array CGH Analysis Using a Robust HMM. Bioinformatics 2006, 22, e431–e439. [Google Scholar] [CrossRef]
- Mallory, X.F.; Edrisi, M.; Navin, N.; Nakhleh, L. Methods for Copy Number Aberration Detection from Single-Cell DNA-Sequencing Data. Genome Biol. 2020, 21, 208. [Google Scholar] [CrossRef]
- Berger, M.F.; Lawrence, M.S.; Demichelis, F.; Drier, Y.; Cibulskis, K.; Sivachenko, A.Y.; Sboner, A.; Esgueva, R.; Pflueger, D.; Sougnez, C.; et al. The Genomic Complexity of Primary Human Prostate Cancer. Nature 2011, 470, 214–220. [Google Scholar] [CrossRef]
- Jaratlerdsiri, W.; Chan, E.K.F.; Gong, T.; Petersen, D.C.; Kalsbeek, A.M.F.; Venter, P.A.; Stricker, P.D.; Riana Bornman, M.S.; Hayes, V.M. Whole-Genome Sequencing Reveals Elevated Tumor Mutational Burden and Initiating Driver Mutations in African Men with Treatment-Naïve, High-Risk Prostate Cancer. Cancer Res. 2018, 78, 6736–6746. [Google Scholar] [CrossRef]
- Hong, M.K.H.; Macintyre, G.; Wedge, D.C.; Van Loo, P.; Patel, K.; Lunke, S.; Alexandrov, L.B.; Sloggett, C.; Cmero, M.; Marass, F.; et al. Tracking the Origins and Drivers of Subclonal Metastatic Expansion in Prostate Cancer. Nat. Commun. 2015, 6, 6605. [Google Scholar] [CrossRef]
- Rajendran, B.K.; Deng, C.X. A Comprehensive Genomic Meta-Analysis Identifies Confirmatory Role of OBSCN Gene in Breast Tumorigenesis. Oncotarget 2017, 8, 102263–102276. [Google Scholar] [CrossRef] [PubMed]
- Tolkach, Y.; Kristiansen, G. The Heterogeneity of Prostate Cancer: A Practical Approach. Pathobiology 2018, 85, 108–116. [Google Scholar] [CrossRef] [PubMed]
- Mateo, J.; Seed, G.; Bertan, C.; Rescigno, P.; Dolling, D.; Figueiredo, I.; Miranda, S.; Rodrigues, D.N.; Gurel, B.; Clarke, M.; et al. Genomics of Lethal Prostate Cancer at Diagnosis and Castration Resistance. J. Clin. Investig. 2020, 130, 1743–1751. [Google Scholar] [CrossRef] [PubMed]
- Sumanasuriya, S.; Seed, G.; Parr, H.; Christova, R.; Pope, L.; Bertan, C.; Bianchini, D.; Rescigno, P.; Figueiredo, I.; Goodall, J.; et al. Elucidating Prostate Cancer Behaviour During Treatment via Low-Pass Whole-Genome Sequencing of Circulating Tumour DNA. Eur. Urol. 2021, 80, 243–253. [Google Scholar] [CrossRef]
- Choudhury, A.D.; Werner, L.; Francini, E.; Wei, X.X.; Ha, G.; Freeman, S.S.; Rhoades, J.; Reed, S.C.; Gydush, G.; Rotem, D.; et al. Tumor Fraction in Cell-Free DNA as a Biomarker in Prostate Cancer. JCI Insight 2018, 3, e122109. [Google Scholar] [CrossRef]
- Rodriguez, A.; Laio, A. Machine Learning. Clustering by Fast Search and Find of Density Peaks. Science 2014, 344, 1492–1496. [Google Scholar] [CrossRef]
- Mao, Q.; Wang, L.; Goodison, S.; Sun, Y. Dimensionality Reduction via Graph Structure Learning. In Proceedings of the ACM SIGKDD International Conference on Knowledge Discovery and Data Mining, Sydney, Australia, 10–13 August 2015. [Google Scholar]
- Mao, Q.; Wang, L.; Tsang, I.W.; Sun, Y. Principal Graph and Structure Learning Based on Reversed Graph Embedding. IEEE Trans. Pattern Anal. Mach. Intell. 2017, 39, 2227–2241. [Google Scholar] [CrossRef]
- Qiu, X.; Hill, A.; Packer, J.; Lin, D.; Ma, Y.A.; Trapnell, C. Single-Cell MRNA Quantification and Differential Analysis with Census. Nat. Methods 2017, 14, 309–315. [Google Scholar] [CrossRef]
- Risbridger, G.P.; Clark, A.K.; Porter, L.H.; Toivanen, R.; Bakshi, A.; Lister, N.L.; Pook, D.; Pezaro, C.J.; Sandhu, S.; Keerthikumar, S.; et al. The MURAL Collection of Prostate Cancer Patient-Derived Xenografts Enables Discovery through Preclinical Models of Uro-Oncology. Nat. Commun. 2021, 12, 5049. [Google Scholar] [CrossRef]
- Dong, B.; Miao, J.; Wang, Y.; Luo, W.; Ji, Z.; Lai, H.; Zhang, M.; Cheng, X.; Wang, J.; Fang, Y.; et al. Single-Cell Analysis Supports a Luminal-Neuroendocrine Transdifferentiation in Human Prostate Cancer. Commun. Biol. 2020, 3, 778. [Google Scholar] [CrossRef]
- Baures, M.; Puig Lombardi, E.; Di Martino, D.; Zeitouni, W.; Pacreau, E.; Dos Santos, L.; Dariane, C.; Boutillon, F.; Guidotti, J.E.; Goffin, V. Transcriptomic Signature and Growth Factor Regulation of Castration-Tolerant Prostate Luminal Progenitor Cells. Cancers 2022, 14, 3775. [Google Scholar] [CrossRef] [PubMed]
- Valdés-Mora, F.; Clark, S.J. Prostate Cancer Epigenetic Biomarkers: Next-Generation Technologies. Oncogene 2015, 34, 1609–1618. [Google Scholar] [CrossRef] [PubMed]
- Tonmoy, M.I.Q.; Fariha, A.; Hami, I.; Kar, K.; Reza, H.A.; Bahadur, N.M.; Hossain, M.S. Computational Epigenetic Landscape Analysis Reveals Association of CACNA1G-AS1, F11-AS1, NNT-AS1, and MSC-AS1 LncRNAs in Prostate Cancer Progression through Aberrant Methylation. Sci. Rep. 2022, 12, 10260. [Google Scholar] [CrossRef] [PubMed]
- Zhang, C.; Macchi, F.; Magnani, E.; Sadler, K.C. Chromatin States Shaped by an Epigenetic Code Confer Regenerative Potential to the Mouse Liver. Nat. Commun. 2021, 12, 4110. [Google Scholar] [CrossRef] [PubMed]
- He, Y.; Wei, T.; Ye, Z.; Orme, J.J.; Lin, D.; Sheng, H.; Fazli, L.; Jeffrey Karnes, R.; Jimenez, R.; Wang, L.; et al. A Noncanonical AR Addiction Drives Enzalutamide Resistance in Prostate Cancer. Nat. Commun. 2021, 12, 1521. [Google Scholar] [CrossRef] [PubMed]
- Cejas, P.; Xie, Y.; Font-Tello, A.; Lim, K.; Syamala, S.; Qiu, X.; Tewari, A.K.; Shah, N.; Nguyen, H.M.; Patel, R.A.; et al. Subtype Heterogeneity and Epigenetic Convergence in Neuroendocrine Prostate Cancer. Nat. Commun. 2021, 12, 5775. [Google Scholar] [CrossRef]
- Stelloo, S.; Nevedomskaya, E.; Kim, Y.; Schuurman, K.; Valle-Encinas, E.; Lobo, J.; Krijgsman, O.; Peeper, D.S.; Chang, S.L.; Feng, F.Y.C.; et al. Integrative Epigenetic Taxonomy of Primary Prostate Cancer. Nat. Commun. 2018, 9, 4900. [Google Scholar] [CrossRef]
- Zang, C.; Schones, D.E.; Zeng, C.; Cui, K.; Zhao, K.; Peng, W. A Clustering Approach for Identification of Enriched Domains from Histone Modification ChIP-Seq Data. Bioinformatics 2009, 25, 1952–1958. [Google Scholar] [CrossRef]
- Coleman, D.J.; Gao, L.; Schwartzman, J.; Korkola, J.E.; Sampson, D.; Derrick, D.S.; Urrutia, J.; Balter, A.; Burchard, J.; King, C.J.; et al. Maintenance of MYC Expression Promotes de Novo Resistance to BET Bromodomain Inhibition in Castration-Resistant Prostate Cancer. Sci. Rep. 2019, 9, 3823. [Google Scholar] [CrossRef]
- Dhar, S.; Kumar, A.; Gomez, C.R.; Akhtar, I.; Hancock, J.C.; Lage, J.M.; Pound, C.R.; Levenson, A.S. MTA1-Activated Epi-MicroRNA-22 Regulates E-Cadherin and Prostate Cancer Invasiveness. FEBS Lett. 2017, 591, 924–933. [Google Scholar] [CrossRef]
- Xiao, L.; Parolia, A.; Qiao, Y.; Bawa, P.; Eyunni, S.; Mannan, R.; Carson, S.E.; Chang, Y.; Wang, X.; Zhang, Y.; et al. Targeting SWI/SNF ATPases in Enhancer-Addicted Prostate Cancer. Nature 2022, 601, 434–439. [Google Scholar] [CrossRef] [PubMed]
- Cranor, L.F. Programming Perl. XRDS Crossroads ACM Mag. Stud. 1994, 1, 10–11. [Google Scholar] [CrossRef]
- Rothwell, W.B. Advanced Perl Programming; Apress: Berkeley, CA, USA, 2020. [Google Scholar] [CrossRef]
- Langmead, B.; Trapnell, C.; Pop, M.; Salzberg, S.L. Ultrafast and Memory-Efficient Alignment of Short DNA Sequences to the Human Genome. Genome Biol. 2009, 10, R25. [Google Scholar] [CrossRef] [PubMed]
- B Langmead, C.T.M.P.S.S. Bowtie: An Ultrafast Memory-Efficient Short Read Aligner. Genome Biol. 2009, 10, R25. [Google Scholar] [CrossRef]
- Langmead, B.; Salzberg, S. Fast gapped-read alignment with Bowtie2. Nat. Methods 2013, 9, 357–359. [Google Scholar] [CrossRef]
- Kipfer, B.A. Bowtie. In Encyclopedic Dictionary of Archaeology; Springer International Publishing: Cham, Switzerland, 2021. [Google Scholar]
- Zhao, S.G.; Chen, W.S.; Li, H.; Foye, A.; Zhang, M.; Sjöström, M.; Aggarwal, R.; Playdle, D.; Liao, A.; Alumkal, J.J.; et al. The DNA Methylation Landscape of Advanced Prostate Cancer. Nat. Genet. 2020, 52, 778–789. [Google Scholar] [CrossRef]
- Yu, Y.P.; Ding, Y.; Chen, R.; Liao, S.G.; Ren, B.G.; Michalopoulos, A.; Michalopoulos, G.; Nelson, J.; Tseng, G.C.; Luo, J.H. Whole-Genome Methylation Sequencing Reveals Distinct Impact of Differential Methylations on Gene Transcription in Prostate Cancer. Am. J. Pathol. 2013, 183, 1960–1970. [Google Scholar] [CrossRef]
- Li, J.; Xu, C.; Lee, H.J.; Ren, S.; Zi, X.; Zhang, Z.; Wang, H.; Yu, Y.; Yang, C.; Gao, X.; et al. A Genomic and Epigenomic Atlas of Prostate Cancer in Asian Populations. Nature 2020, 580, 93–99. [Google Scholar] [CrossRef]
- Schmidt, T.; Leha, A.; Salinas-Riester, G. Treatment of Prostate Cancer Cells with S-Adenosylmethionine Leads to Genome-Wide Alterations in Transcription Profiles. Gene 2016, 595, 161–167. [Google Scholar] [CrossRef]
- Ketola, K.; Kaljunen, H.; Taavitsainen, S.; Kaarijärvi, R.; Järvelä, E.; Rodríguez-Martín, B.; Haase, K.; Woodcock, D.J.; Tubio, J.; Wedge, D.C.; et al. Subclone Eradication Analysis Identifies Targets for Enhanced Cancer Therapy and Reveals L1 Retrotransposition as a Dynamic Source of Cancer Heterogeneity. Cancer Res. 2021, 81, 4901–4909. [Google Scholar] [CrossRef]
- Eksi, S.E.; Chitsazan, A.; Sayar, Z.; Thomas, G.V.; Fields, A.J.; Kopp, R.P.; Spellman, P.T.; Adey, A.C. Epigenetic Loss of Heterogeneity from Low to High Grade Localized Prostate Tumours. Nat. Commun. 2021, 12, 7292. [Google Scholar] [CrossRef] [PubMed]
- Liu, Y.; Shen, S.; Lapata, M. Noisy Self-Knowledge Distillation for Text Summarization. In Proceedings of the NAACL-HLT 2021-2021 Conference of the North American Chapter of the Association for Computational Linguistics: Human Language Technologies, Online, 6–11 June 2021. [Google Scholar]
- Kneppers, J.; Severson, T.M.; Siefert, J.C.; Schol, P.; Joosten, S.E.P.; Yu, I.P.L.; Huang, C.C.F.; Morova, T.; Altıntaş, U.B.; Giambartolomei, C.; et al. Extensive Androgen Receptor Enhancer Heterogeneity in Primary Prostate Cancers Underlies Transcriptional Diversity and Metastatic Potential. Nat. Commun. 2022, 13, 7367. [Google Scholar] [CrossRef] [PubMed]
- Taavitsainen, S.; Engedal, N.; Cao, S.; Handle, F.; Erickson, A.; Prekovic, S.; Wetterskog, D.; Tolonen, T.; Vuorinen, E.M.; Kiviaho, A.; et al. Single-Cell ATAC and RNA Sequencing Reveal Pre-Existing and Persistent Cells Associated with Prostate Cancer Relapse. Nat. Commun. 2021, 12, 5307. [Google Scholar] [CrossRef] [PubMed]
- Weinstein, J.N.; Collisson, E.A.; Mills, G.B.; Shaw, K.R.M.; Ozenberger, B.A.; Ellrott, K.; Sander, C.; Stuart, J.M.; Chang, K.; Creighton, C.J.; et al. The Cancer Genome Atlas Pan-Cancer Analysis Project. Nat. Genet. 2013, 45, 1113–1120. [Google Scholar] [CrossRef]
- Edgar, R.; Domrachev, M.; Lash, A.E. Gene Expression Omnibus: NCBI Gene Expression and Hybridization Array Data Repository. Nucleic Acids Res. 2002, 30, 207–210. [Google Scholar] [CrossRef]
- Hung, J.-H.; Yang, T.-H.; Hu, Z.; Weng, Z.; DeLisi, C. Gene Set Enrichment Analysis: Performance Evaluation and Usage Guidelines. Brief. Bioinform. 2012, 13, 281–291. [Google Scholar] [CrossRef]
- Zhao, Y.; Tao, Z.; Li, L.; Zheng, J.; Chen, X. Predicting Biochemical-Recurrence-Free Survival Using a Three-Metabolic-Gene Risk Score Model in Prostate Cancer Patients. BMC Cancer 2022, 22, 239. [Google Scholar] [CrossRef]
- Wang, Y.; Wang, J.; Tang, Q.; Ren, G. Identification of UBE2C as Hub Gene in Driving Prostate Cancer by Integrated Bioinformatics Analysis. PLoS ONE 2021, 16, e0247827. [Google Scholar] [CrossRef]
- Yu, C.; Cao, H.; He, X.; Sun, P.; Feng, Y.; Chen, L.; Gong, H. Cyclin-Dependent Kinase Inhibitor 3 (CDKN3) Plays a Critical Role in Prostate Cancer via Regulating Cell Cycle and DNA Replication Signaling. Biomed. Pharmacother. 2017, 96, 1109–1118. [Google Scholar] [CrossRef]
- Chen, W.S.; Aggarwal, R.; Zhang, L.; Zhao, S.G.; Thomas, G.V.; Beer, T.M.; Quigley, D.A.; Foye, A.; Playdle, D.; Huang, J.; et al. Genomic Drivers of Poor Prognosis and Enzalutamide Resistance in Metastatic Castration-Resistant Prostate Cancer (Figure Presented.). Eur. Urol. 2019, 76, 562–571. [Google Scholar] [CrossRef]
- Gong, H.; Chen, X.Y.; Jin, Y.C.; Lu, J.S.; Cai, Y.J.; Wei, O.; Zhao, J.; Zhang, W.Y.; Wen, X.F.; Wang, Y.M.; et al. Expression of ARHGAP10 Correlates with Prognosis of Prostate Cancer. Int. J. Clin. Exp. Pathol. 2019, 12, 3839–3846. [Google Scholar] [PubMed]
- Patel, R.; Brzezinska, E.A.; Repiscak, P.; Ahmad, I.; Mui, E.; Gao, M.; Blomme, A.; Harle, V.; Tan, E.H.; Malviya, G.; et al. Activation of β-Catenin Cooperates with Loss of Pten to Drive AR-Independent Castration-Resistant Prostate Cancer. Cancer Res. 2020, 80, 576–590. [Google Scholar] [CrossRef] [PubMed]
- Irshad, S.; Bansal, M.; Castillo-Martin, M.; Zheng, T.; Aytes, A.; Wenske, S.; Le Magnen, C.; Guarnieri, P.; Sumazin, P.; Benson, M.C.; et al. A Molecular Signature Predictive of Indolent Prostate Cancer. Sci. Transl. Med. 2013, 5, 202ra122. [Google Scholar] [CrossRef] [PubMed]
- Chen, W.Y.; Wen, Y.C.; Lin, S.R.; Yeh, H.L.; Jiang, K.C.; Chen, W.H.; Lin, Y.S.; Zhang, Q.; Liew, P.L.; Hsiao, M.; et al. Nerve Growth Factor Interacts with CHRM4 and Promotes Neuroendocrine Differentiation of Prostate Cancer and Castration Resistance. Commun. Biol. 2021, 4, 22. [Google Scholar] [CrossRef] [PubMed]
- Savli, H.; Szendröi, A.; Romics, I.; Nagy, B. Gene Network and Canonical Pathway Analysis in Prostate Cancer: A Microarray Study. Exp. Mol. Med. 2008, 40, 176–185. [Google Scholar] [CrossRef][Green Version]
- Sethi, S.; Kong, D.; Land, S.; Dyson, G.; Sakr, W.A.; Sarkar, F.H. Comprehensive Molecular Oncogenomic Profiling and MiRNA Analysis of Prostate Cancer. Am. J. Transl. Res. 2013, 5, 200–211. [Google Scholar]
- Wu, X.C.; Yu, Y.Z.; Zuo, Y.Z.; Song, X.L.; Zhou, Z.E.; Xiao, Y.; Luo, D.S.; Yan, W.G.; Zhao, S.C. Identification of UAP1L1 as a Critical Factor for Prostate Cancer and Underlying Molecular Mechanism in Tumorigenicity. J. Transl. Med. 2022, 20, 91. [Google Scholar] [CrossRef]
- Russo, A.L.; Jedlicka, K.; Wernick, M.; McNally, D.; Kirk, M.; Sproull, M.; Smith, S.; Shankavaram, U.; Kaushal, A.; Figg, W.D.; et al. Urine Analysis and Protein Networking Identify Met as a Marker of Metastatic Prostate Cancer. Clin. Cancer Res. 2009, 15, 4292–4298. [Google Scholar] [CrossRef]
- Farashi, S.; Kryza, T.; Batra, J. Pathway Analysis of Genes Identified through Post-GWAS to Underpin Prostate Cancer Aetiology. Genes 2020, 11, 526. [Google Scholar] [CrossRef]
- Nagaya, N.; Rosenfeld, J.; Lee, G.T.; Kim, I.Y. RNA-Seq Profile of African American Men with a Clinically Localized Prostate Cancer. Prostate Int. 2021, 9, 125–131. [Google Scholar] [CrossRef]
- Szklarczyk, D.; Franceschini, A.; Wyder, S.; Forslund, K.; Heller, D.; Huerta-Cepas, J.; Simonovic, M.; Roth, A.; Santos, A.; Tsafou, K.P.; et al. STRING V10: Protein-Protein Interaction Networks, Integrated over the Tree of Life. Nucleic Acids Res. 2015, 43, D447–D452. [Google Scholar] [CrossRef] [PubMed]
- Woodworth, M.B.; Girskis, K.M.; Walsh, C.A. Building a Lineage from Single Cells: Genetic Techniques for Cell Lineage Tracking. Nat. Rev. Genet. 2017, 18, 230–244. [Google Scholar] [CrossRef] [PubMed]
- Castro, L.N.G.; Tirosh, I.; Suvà, M.L. Decoding Cancer Biology One Cell at a Time. Cancer Discov. 2021, 11, 960–970. [Google Scholar] [CrossRef] [PubMed]
- LaFave, L.M.; Savage, R.E.; Buenrostro, J.D. Single-Cell Epigenomics Reveals Mechanisms of Cancer Progression. Annu. Rev. Cancer Biol. 2022, 6, 167–185. [Google Scholar] [CrossRef]
- Guruprasad, P.; Lee, Y.G.; Kim, K.H.; Ruella, M. The Current Landscape of Single-Cell Transcriptomics for Cancer Immunotherapy. J. Exp. Med. 2021, 218, e20201574. [Google Scholar] [CrossRef] [PubMed]
- Bernard, V.; Semaan, A.; Huang, J.; Anthony San Lucas, F.; Mulu, F.C.; Stephens, B.M.; Guerrero, P.A.; Huang, Y.; Zhao, J.; Kamyabi, N.; et al. Single-Cell Transcriptomics of Pancreatic Cancer Precursors Demonstrates Epithelial and Microenvironmental Heterogeneity as an Early Event in Neoplastic Progression. Clin. Cancer Res. 2019, 25, 2194–2205. [Google Scholar] [CrossRef]
- Wu, S.Z.; Al-Eryani, G.; Roden, D.L.; Junankar, S.; Harvey, K.; Andersson, A.; Thennavan, A.; Wang, C.; Torpy, J.R.; Bartonicek, N.; et al. A Single-Cell and Spatially Resolved Atlas of Human Breast Cancers. Nat. Genet. 2021, 53, 1334–1347. [Google Scholar] [CrossRef]
- Saviano, A.; Henderson, N.C.; Baumert, T.F. Single-Cell Genomics and Spatial Transcriptomics: Discovery of Novel Cell States and Cellular Interactions in Liver Physiology and Disease Biology. J. Hepatol. 2020, 73, 1219–1230. [Google Scholar] [CrossRef]
- Siefert, J.C.; Cioni, B.; Muraro, M.J.; Alshalalfa, M.; Vivie, J.; van der Poel, H.G.; Schoots, I.G.; Bekers, E.; Feng, F.Y.; Wessels, L.F.A.; et al. The Prognostic Potential of Human Prostate Cancer-Associated Macrophage Subtypes as Revealed by Single-Cell Transcriptomics. Mol. Cancer Res. 2021, 19, 1778–1791. [Google Scholar] [CrossRef]
- Shendure, J.; Balasubramanian, S.; Church, G.M.; Gilbert, W.; Rogers, J.; Schloss, J.A.; Waterston, R.H. DNA Sequencing at 40: Past, Present and Future. Nature 2017, 550, 345–353. [Google Scholar] [CrossRef]
- Baylin, S.B.; Jones, P.A. Epigenetic Determinants of Cancer. Cold Spring Harb. Perspect. Biol. 2016, 8, a019505. [Google Scholar] [CrossRef] [PubMed]


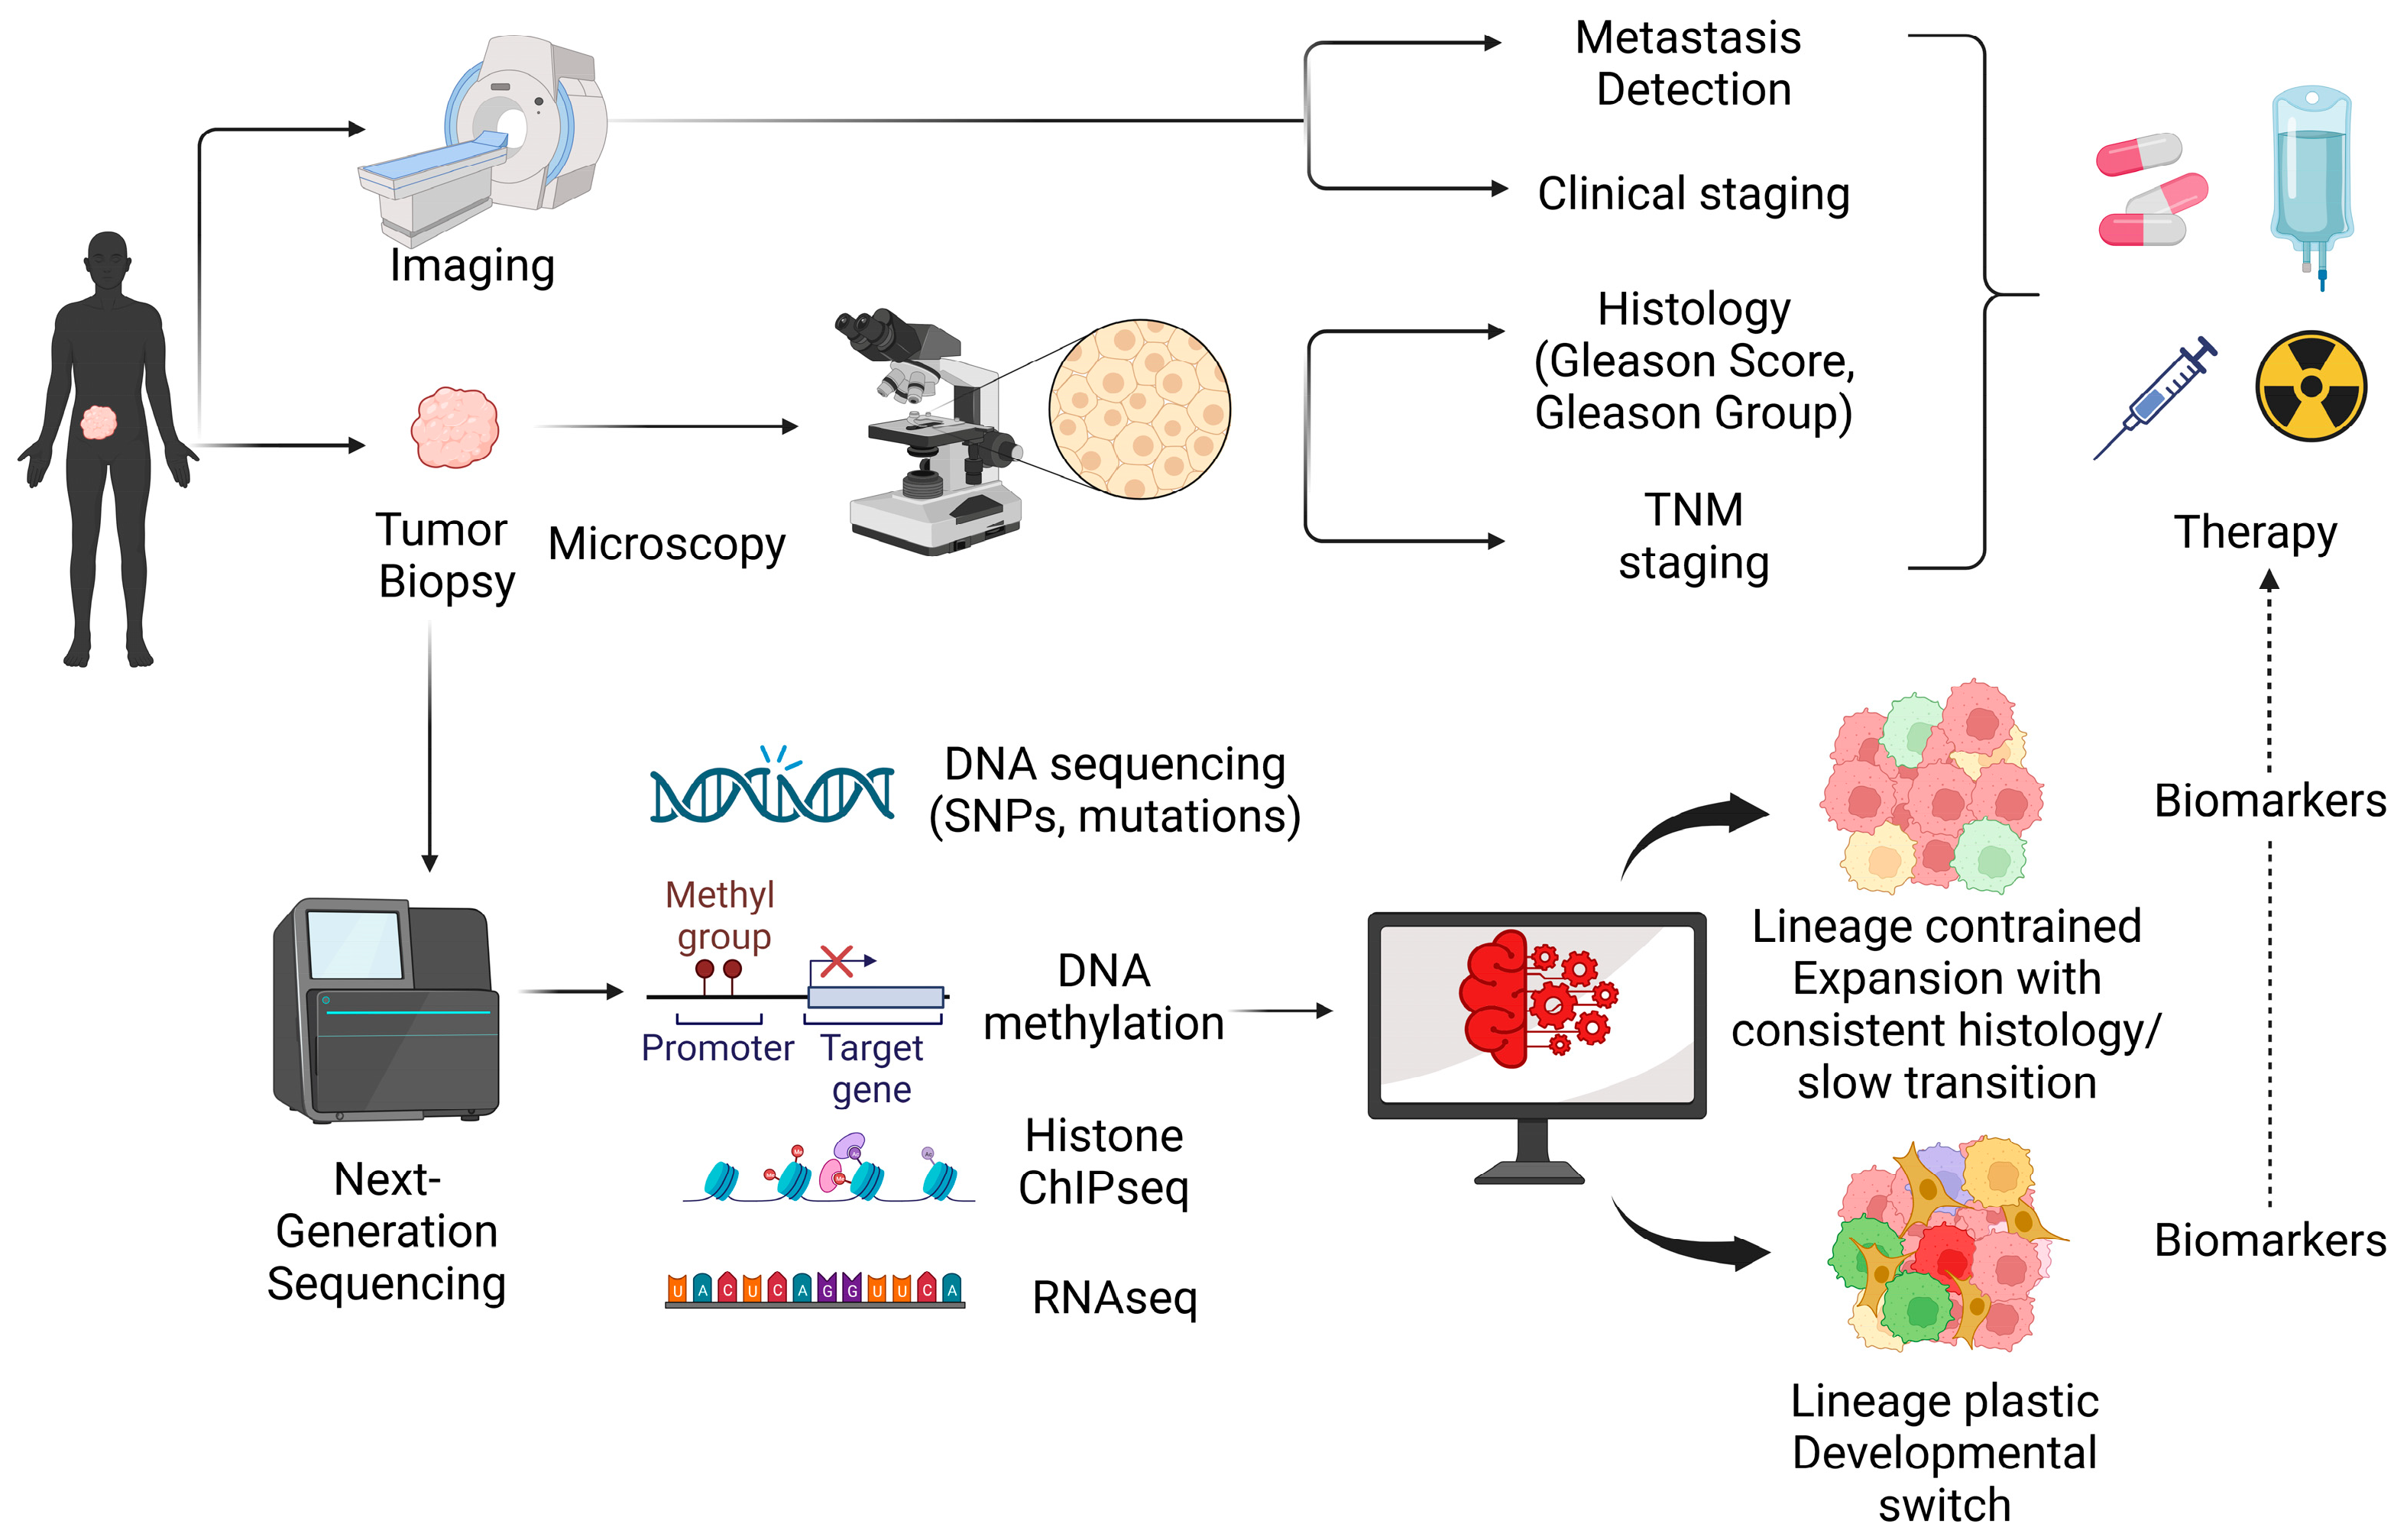
| Gene | Type of Alteration | Frequency in PCa | Relevance to PCa | References |
|---|---|---|---|---|
| ETS TMPRSS2-ERG TMPRSS2-ETV1/4 SLC45A3-ELK4 | Fusion | 24–79% | Enhances tumorigenesis and disease progression | [64,65,66,67,68,69,70] |
| SPOP BRCA1 BRCA2 ATM CHEK2 MMR genes | Mutation | 12% 0.4–0.9% 3–5.3% 1.6% 1.9% <1% | More often in aggressive disease | [71,72,73,74,75,76,77,78,79,80,81,82,83,84,85,86,87] |
| PTEN RB1 | Loss | 15–20% ~1–10% | Associated with aggressive disease | [11,26,27,28,86,88,89,90,91,92,93,94,95,96,97,98,99,100,101,102] |
| TP53 | Mutation | 6–8% in primary disease >28% in metastatic disease | More frequent in aggressive disease | [26,27,28,95,103,104,105,106,107,108,109] |
| AR | Splice variant Amplification Mutation | varies 30–40% 10–15% | Associated with response and resistance to ARSI therapies | [69,110,111,112] |
| GSTP1 RASSF1A APC RARβ CDH1 CD44 PITX2 | Hypermethylation | 30–90% 53–83.6% 27–84% 53–96% 27% 32% 1–80% | Downregulation of target genes with a potential higher risk of recurrence and metastasis | [113,114,115,116,117,118,119,120,121,122,123,124,125,126,127,128] |
| LINE-1 SAT2 | Hypomethylation | Not determined | Linked with poor prognosis | [129,130] |
| EZH2 KDM1A KDM7B | Overexpression | Not determined | Affects histone post-translational modifications and associated with poor recurrence-free survival | [64,91,131,132,133,134,135,136,137] |
| Tool | Description | GitHub Link (If Available) | References |
|---|---|---|---|
| Genomics | |||
| MuTect | Detection of somatic mutations using tumor–normal paired samples obtained from NGS data | https://github.com/broadinstitute/mutect (accessed on 1 July 2023) | [264,265,266] |
| Maftools | Analysis and visualization of mutations in cancer genomics data | https://github.com/PoisonAlien/maftools (accessed on 1 July 2023) | [267,268] |
| CopyKit | Preprocessing and analysis of single-cell CNVs | https://github.com/navinlabcode/copykit (accessed on 1 July 2022) | [269] |
| HMMcopy | Inference copy number alterations and single-cell CNV analysis | https://github.com/shahcompbio/hmmcopy_utils (accessed on 1 July 2023) | [270] |
| CHISEL | Allele-specific and haplotype-specific copy number inference of scDNA-seq data | https://github.com/raphael-group/chisel-data (accessed on 1 July 2023) | [271] |
| Ginkgo | Analysis of scDNA-seq data as well as post-processing steps, such as downstream analysis and phylogenetic trees | https://www.ginkgobioworks.com/ (accessed on 1 July 2023) | [270,272] |
| Transcriptomics | |||
| Waddington-OT | Cellular fate determination and differentiation | https://github.com/zsteve/gWOT (accessed on 1 July 2023) | [273] |
| Lineage-OT | Lineage tracing and trajectory inference | https://github.com/aforr/LineageOT (accessed on 1 July 2023) | [242] |
| Monocle 2 | Cell fate identification through single-cell trajectories | https://github.com/cole-trapnell-lab/monocle2-rge-paper (accessed on 1 July 2023) | [274,275] |
| Seurat R package | Single-cell RNA-seq data analysis, including quality control, preprocessing, exploratory analysis, and downstream analysis | https://github.com/satijalab/seurat (accessed on 1 July 2023) | [276,277] |
| AddModuleScore function | Biological pathway analysis, gene signatures, or functional modules in individual cells, and for downstream analysis, such as identifying cell states or characterizing cellular heterogeneity based on pathway or module activity. | https://github.com/satijalab/seurat/blob/master/man/AddModuleScore.Rd (accessed on 1 July 2023) | [276,278] |
| UCell | Gene signature scores | https://github.com/carmonalab/UCell (accessed on 1 July 2023) | [279,280] |
| CytoTRACE | Quantification of cellular trajectories and differentiation of cell states using (scRNA-seq) data | https://github.com/pinellolab/pyrovelocity/blob/master/pyrovelocity/cytotrace.py (accessed on 1 July 2023) https://cytotrace.stanford.edu (accessed on 1 July 2023) | [281] |
| Epigenetics | |||
| MACS (Model-based Analysis of ChIP-Seq) | Chromatin immunoprecipitation sequencing (ChIP-seq) data analysis | https://macs3-project.github.io/MACS/ (accessed on 1 July 2023) | [282,283,284] |
| SICER (Spatial Clustering for Identification of ChIP-Enriched Regions) | Peak calling in ChIP-seq data | https://github.com/zanglab/SICER2 (accessed on 1 July 2023) | [285] |
| ChIPseeker | Annotation and visualization of ChIP-seq data | https://github.com/YuLab-SMU/ChIPseeker (accessed on 1 July 2023) | [286] |
| Bismark | Alignment and analysis of DNAme data | https://github.com/FelixKrueger/Bismark (accessed on 1 July 2023) | [287] |
| BS Seeker | Alignment of bisulfite-treated reads to the reference genome | https://github.com/BSSeeker/BSseeker2 (accessed on 1 July 2023) | [288] |
| MethylKit | Analysis and visualization of DNAme data | https://github.com/al2na/methylKit (accessed on 1 July 2023) | [289] |
| Genomation | Visualization, annotation, and analysis of DNAme data | https://github.com/BIMSBbioinfo/genomation (accessed on 1 July 2023) | [290] |
| SnapATAC (Single Nucleus Analysis Pipeline for ATAC-seq) | scATAC-seq analysis (alignment of the read to a reference genome, quality control, peak calling, visualization, and clustering) | https://github.com/r3fang/SnapATAC (accessed on 1 July 2023) | [291] |
| Cellcano | Inference of cellular hierarchies of scATAC-seq data | https://marvinquiet.github.io/Cellcano/ (accessed on 1 July 2023) | [292] |
| Signac | Analysis and visualization of scATAC-seq data (peak calling, quality control, visualization, clustering, and integration with scRNA-seq data) | https://github.com/stuart-lab/signac (accessed on 1 July 2023) | [293] |
| EpiAnno | Analysis of scATAC-seq data | https://github.com/xy-chen16/EpiAnno (accessed on 1 July 2023) | [294] |
| Enrichment Analysis | |||
| GSEA (gene set enrichment analysis) | Characterization of cellular functions as well as pathway enrichment analysis | https://www.gsea-msigdb.org/gsea/index.jsp (accessed on 1 July 2023) | [295] |
| IPA (Ingenuity Pathway Analysis) | Gene set analysis | https://digitalinsights.qiagen.com/products-overview/discovery-insights-portfolio/analysis-and-visualization/qiagen-ipa/ (accessed on 1 July 2023) | [296] |
| Enrichr | Integrative web-based tool for enrichment analysis | https://maayanlab.cloud/Enrichr/ (accessed on 19 August 2023) | [297,298,299] |
| FLAME | Integrative web-based tool for enrichment analysis | https://github.com/PavlopoulosLab/Flame (accessed on 19 August 2023) | [300] |
Disclaimer/Publisher’s Note: The statements, opinions and data contained in all publications are solely those of the individual author(s) and contributor(s) and not of MDPI and/or the editor(s). MDPI and/or the editor(s) disclaim responsibility for any injury to people or property resulting from any ideas, methods, instructions or products referred to in the content. |
© 2023 by the authors. Licensee MDPI, Basel, Switzerland. This article is an open access article distributed under the terms and conditions of the Creative Commons Attribution (CC BY) license (https://creativecommons.org/licenses/by/4.0/).
Share and Cite
Logotheti, S.; Papadaki, E.; Zolota, V.; Logothetis, C.; Vrahatis, A.G.; Soundararajan, R.; Tzelepi, V. Lineage Plasticity and Stemness Phenotypes in Prostate Cancer: Harnessing the Power of Integrated “Omics” Approaches to Explore Measurable Metrics. Cancers 2023, 15, 4357. https://doi.org/10.3390/cancers15174357
Logotheti S, Papadaki E, Zolota V, Logothetis C, Vrahatis AG, Soundararajan R, Tzelepi V. Lineage Plasticity and Stemness Phenotypes in Prostate Cancer: Harnessing the Power of Integrated “Omics” Approaches to Explore Measurable Metrics. Cancers. 2023; 15(17):4357. https://doi.org/10.3390/cancers15174357
Chicago/Turabian StyleLogotheti, Souzana, Eugenia Papadaki, Vasiliki Zolota, Christopher Logothetis, Aristidis G. Vrahatis, Rama Soundararajan, and Vasiliki Tzelepi. 2023. "Lineage Plasticity and Stemness Phenotypes in Prostate Cancer: Harnessing the Power of Integrated “Omics” Approaches to Explore Measurable Metrics" Cancers 15, no. 17: 4357. https://doi.org/10.3390/cancers15174357
APA StyleLogotheti, S., Papadaki, E., Zolota, V., Logothetis, C., Vrahatis, A. G., Soundararajan, R., & Tzelepi, V. (2023). Lineage Plasticity and Stemness Phenotypes in Prostate Cancer: Harnessing the Power of Integrated “Omics” Approaches to Explore Measurable Metrics. Cancers, 15(17), 4357. https://doi.org/10.3390/cancers15174357