1. Introduction
Prostate cancer has the character of malignant growth metastasis, and prostate cancer with bone marrow metastasis, in particular, is a global medical problem with no efficient therapy. Prostate cancer is considered the second greatest threat to the health of American males, with 268,490 new cases and 34,500 deaths predicted to occur in 2022, according to American Cancer Society [
1]. Sixty percent of patients with prostate cancer are diagnosed at the age of 65 or older; it is rarely diagnosed in individuals younger than 40 years [
2]
Cancer cells require sufficient energy and biosynthetic precursors for rapid proliferation. Unlike in normal cells, active glycolysis occurs in cancer cells even though oxygen is sufficient, which requires abundant glucose [
3,
4]. Pyruvate kinase (PK), a key rate-limiting enzyme in the Warburg effect, consists of four subtypes (PKM1, PKM2, PKL, and PKR) encoded by two groups of genes. PKM2 in cancer cells has become a key target for cancer treatment. Unlike other pyruvate kinases, PKM2 has tetrameric and dimeric forms (
Figure 1). Tetramers, mainly PKM1, function as pyruvate kinase and regulate glycolysis, while dimers act as switches in energy metabolism and biosynthesis, converting the glucose metabolism of producing pyruvate [
5]. Dimeric PKM2, as a transcription factor, translocates to the nucleus and activates and regulates the transcription of certain genes, including
β-catenin. In addition, c-Myc, glucose transporter 1 (GLUT1), and lactate exporter monocarboxylate transporter 4 (MCT4), as the downstream protein of β-catenin, can be regulated [
6,
7]; therefore, PKM2-overexpression leads to increased glycolysis by increasing glucose input and lactate acid output, which speeds cancer progression [
8,
9]. In addition, the ratio of PKM2 determines whether the intracellular glucose metabolism is involved in the biosynthesis for proliferation or oxidative phosphorylation (OXPHOS) in the mitochondria [
10].
Endogenous and exogenous activators and inhibitors can regulate the transition between the dimers and tetramers of PKM2. Tetramers have a seesaw-like pattern with allosteric regulatory domains, and they switch between the inactive T-state and active R-state [
11]. Yuan et al. found that amino acids bind to an allosteric pocket (existing in PKM2 and PKM1); most of them stabilize PKM2 in an inactive T-state, and phenylalanine and alanine are almost 100% inhibited [
12]. In addition, most amino acids show specificity for PKM2, with phenylalanine, arginine, glycine, and lysine showing a slight inhibitory effect (approximately 10%) on PKM1 [
12,
13]. Recently, novel naphthoquinone derivatives have been synthesized as selective inhibitors of PKM2, including compound
3K. The anticancer and PKM2 inhibitory effects of compound
3K were evaluated in vivo and in vitro. Currently, a novel 2, 3-didithiocarbamate-substituted naphthoquinone called compound
3h (half-maximal inhibitory concentration [IC
50] = 0.96 ± 0.18 μM), which is synthesized based on compound
3K, provides potent inhibition of PKM2 that is superior to compound
3K (IC
50 = 2.95 ± 0.53 μM) [
14].
Activation of the protein kinase B (Akt)/mechanistic or mammalian target of rapamycin (mTOR) plays a vital role in regulating cell survival and suppressing autophagy in cancer cells [
15,
16]. It has been proven that autophagy in human prostate cancer cells is induced by PKM2 knockdown via the Akt/mTOR pathway [
17], and a specific PKM2 inhibitor, compound
3K, also promoted the cell death of SK-OV-3 via restraining the Akt/mTOR pathway [
18].
Although inhibiting PKM2 and glycolysis has been explored as an effective approach for cancer therapy, screening for novel PKM2 inhibitors and comparing their anticancer effects, thereby clarifying their action mechanisms, have not yet been reported; therefore, we found a specific PKM2 inhibitor called compound 3h, evaluated its anticancer effects on prostate cancer cells, and performed molecular docking to further understand the mechanism of PKM2 inhibition in this study. Our results suggest that compound 3h can suppress glycolysis by selectively inhibiting PKM2 expression and activity and then playing an anticancer role, which may provide a strategy for prostate cancer treatment.
2. Materials and Methods
2.1. Reagents
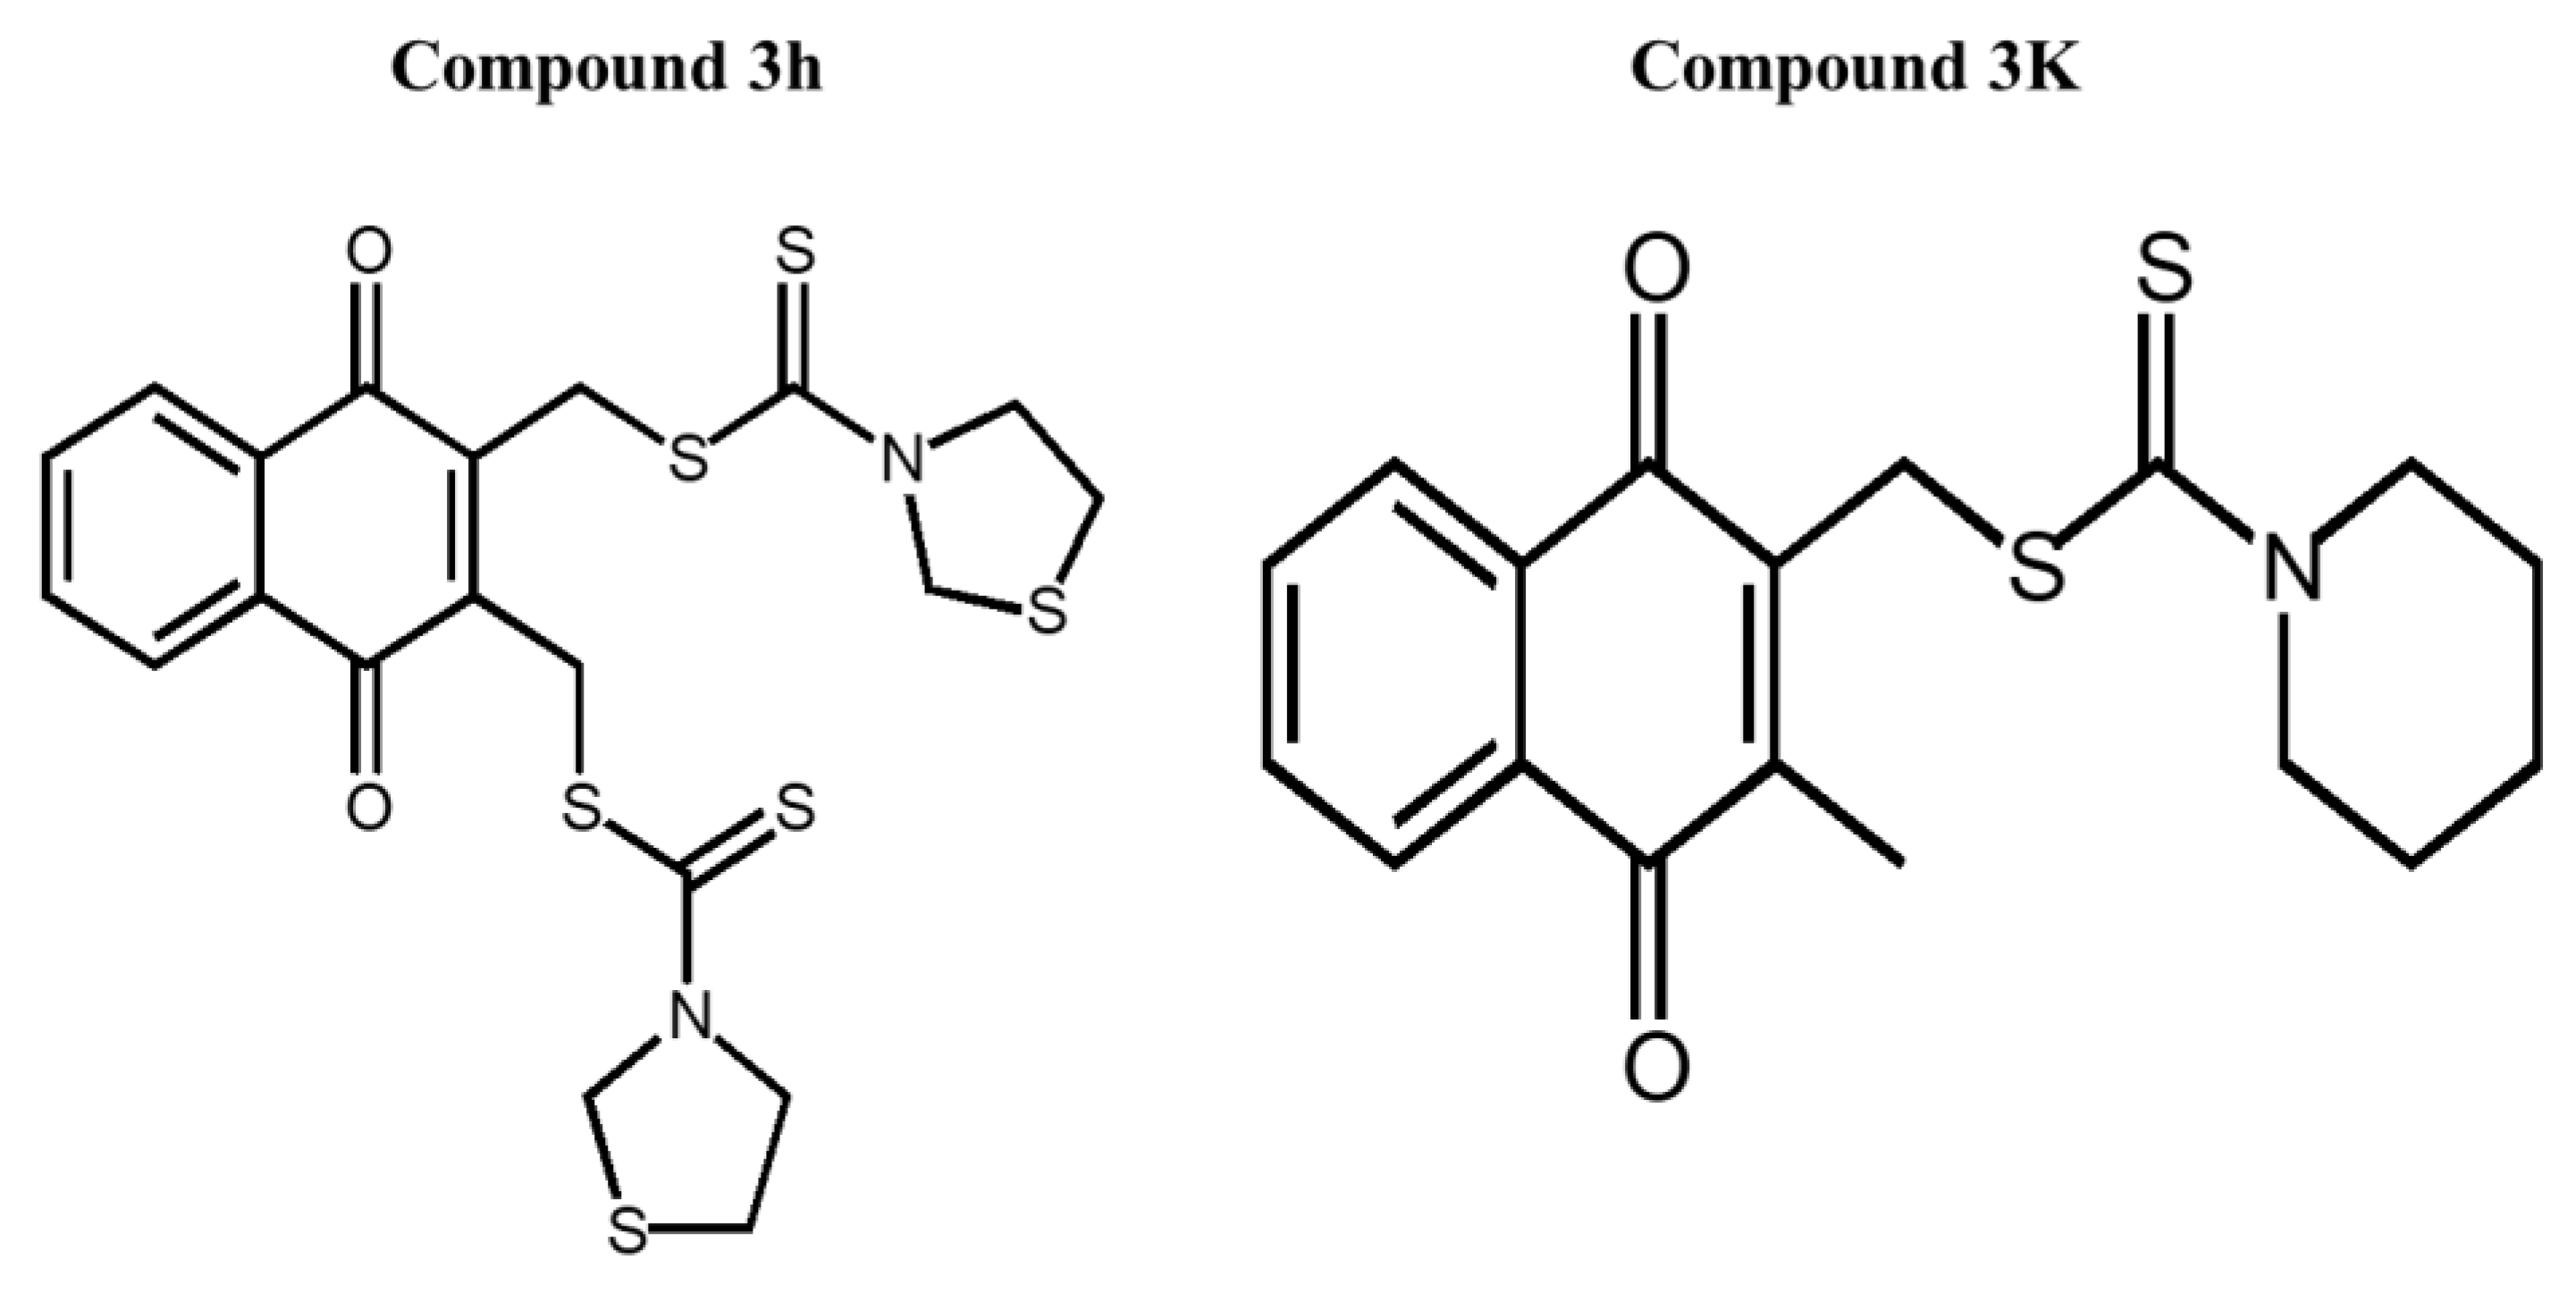
Compounds
3h and
3K were dissolved in dimethyl sulfoxide (DMSO) (Sigma-Aldrich, St. Louis, MO, USA). Compound
3h was synthesized by Professor In Su Kim (Department of Pharmacy, Sungkyunkwan University, Suwon, Republic of Korea) according to Ning’s method [
14]. Compound
3K (Catalog No. S8616) was purchased from SelleckChem (Houston, TX, USA). The structures of compounds
3h and
3K are shown in
Figure 2. Roswell Park Memorial Institute (RPMI) 1640 medium (LM011-01) and fetal bovine serum (FBS) were purchased from Gibco Invitrogen Corporation (Carlsbad, CA, USA). Compound
3h was diluted to an appropriate concentration in RPMI 1640 medium containing 10% FBS (S101-07, Welgene, Gyeongsan-si, Republic of Korea). Propidium iodide (PI) solutions and 4,6-diamidino-2-phenylindole (DAPI) were purchased from Sigma-Aldrich (St. Louis, MO, USA).
2.2. Antibodies
Primary antibodies against PKM2 (#4053S), PKM1 (#7067), poly (ADP-ribose) polymerase (PARP) (#9542), cleaved-PARP (#5625S), pro-caspase-7 (#9492), pro-caspase-3 (#9662), Cyclin-B1 (#4138), cell division cycle protein 2 homolog (Cdc2) (#77055), p-Cdc2 (#9111S), AMP-activated protein kinase (AMPK)-α (#2532), p-AMPKα (#2535), phosphatase and tensin homolog (PTEN) (#9559S), p-PTEN (#9551), Akt (#9272), p-Akt (#9271S), p-mTOR (#2971S), mTOR (#2972), ribosomal protein S6 kinase beta-1 (p70S6K) (#9202S), and p-p70S6K (#9206S) were purchased from Cell Signaling (Beverly, MA, USA). Primary antibodies against B-cell lymphoma 2 (Bcl-2) (sc-783), c-Myc (sc-40), Bcl-2-associated X (Bax) (sc-7480), GLUT1 (sc-7903), MCT4 (sc-376465), and β-actin (sc-47778) were purchased from Santa Cruz Biotechnology (Santa Cruz, CA, USA). Purchased primary antibodies against LC3B (ab51520), p62 (ab56416), and β-catenin (ab6302) were from Abcam (Abcam, Cambridge, UK). Beclin-1 (NB500-249) was purchased from Novus Biologicals (Littleton, CO, USA). Horseradish peroxidase (HRP)-conjugated secondary antibodies were purchased from Santa Cruz Biotechnology (Santa Cruz, Dallas, TX, USA).
2.3. Cell Lines and Cell Culture
All three human prostate cancer cell lines (LNCaP, PC3, and DU145) were purchased from the American Type Culture Collection (Manassas, VA, USA). Cultured cells in RPMI 1640 medium were supplemented with 10% heat-inactivated FBS, antibiotic–antimycotic (15240062) in a humidified, 5% CO2 atmosphere at 37 °C.
2.4. PK Assay
A PK assay kit (ab83432, Abcam, Cambridge, UK) was used to detect PK assay activity in LNCaP cells. In short, according to the guide, protein was extracted from cells (50 × 104), pellets with four volumes of assay buffer and protein were added to a 96-well plate, then the PK assay buffer was added for a volume of 50 μL/well. The prepared reaction was mixed with the assay buffer, substrate mix, enzyme mix, and OxiRed™ probe provided in the PK assay kit, and the 50 μL/well reaction mix was added to the 96-well plate containing the protein. The standard linear curve was determined by serial dilutions of 1 nmol/mL standard pyruvate solution. After the reaction, the absorbance of all standards and samples was determined at a 570 nm wavelength using a VERSA Max Microplate Reader (Molecular Devices Corp., Sunnyvale, CA, USA).
2.5. Prepare Ligand and Receptor for Docking
All docking modeling procedures were performed using the Tripos Sybyl-X 2.1.1 (Tripos Inc., St Louis, MO, USA) molecular modeling package with a Windows 7 professional K operating system. First, compounds 3h and 3K were prepared with the sketch module and saved as mol2 format; we then assigned all atoms Gasteiger-Hückel charges. Before performing molecular docking, in order to obtain a stable conformation that converged to the maximum derivatives of 0.001 kcal mol−1.Å−1, we performed an energy minimization of ligands. The crystal structure of PKM2 in complex with phenylalanine (Protein Data Bank [PDB]:4FXJ) used in the experiment was downloaded from PDB. To prepare the receptor, the ligand phenylalanine was extracted, and all water molecules were deleted from the complex structure. The structure was then prepared with the protein preparation module of Sybyl-X 2.1.1 using the default parameters.
2.6. Molecular Docking of PKM2 and Compound 3K and 3h
In this study, we used Surflex-Dock embedded in Tripos Sybyl-X 2.1.1 to perform flexible docking. An SFXC file was constructed using a mol2 prepared protein structure. Phenylalanine was separated from the co-crystal structure of PKM2 (PDB: 4FXJ) to generate the binding site, and the binding site was saved as a protomol. The main setting was 20 solutions per compound, and other parameters accepted the Surflex-Dock Geom settings. Surflex-Dock scoring function was used to calculate the binding affinity (−log Kd) for each docking model. Subsequently, the consensus scores were calculated to compare the Total Score, PMF score, ChemScore, G score, and D score. Lastly, we selected the best docking model equipped with excellent binding affinity, consensus scores (≥3), and the number of intermolecular interactions.
2.7. Cytotoxicity Assay
LNCaP, PC3, and DU145 cells (1 × 10⁴ or 5 × 10³ cells) were seeded into a 96-well plate and after 24 h incubation, different concentrations of compounds 3h and 3K were made and then treated for 24 or 48 h. A total of 10 μL/well EZ-Cytox cell viability (WST) assay kit (EZ-BULK150, Daeillab, Republic of Korea) was added and incubated, followed by detecting the absorbance measurement at 450 nm with a VERSA Max Microplate Reader (Molecular Devices Corp., CA, USA) to determine cell viability. Finally, according to absorbance measurement, we calculated the IC50 using Sigma Plot 10.0 software.
2.8. Proliferation Assay
Plated LNCaP (5 × 10³ cells/well) were placed into a 96-well plate and incubated until the confluency of cells achieved 50%. Then, we treated compound 3h (0, 2.5, 5, and 10 µM) and put the 96-well plate into IncuCyte® ZOOM 2016B software (Essen Bioscience, Ann Arbor, MI, USA) to acquire the images every 3h, and analyze the confluency.
2.9. Colony Forming Assay of LNCaP cells
A total of 1000 cells/well was seeded into a 6-well plate. It was treated with either compound 3h or control for 24 h after 5 days incubation, and then the cells were fixed and stained overnight with 4% paraformaldehyde (J19943, Thermo Fisher Scientific, Waltham, MA, USA) and 0.5% crystal violet (CR1035-100-00, Biosesang, Seongnam, Republic of Korea). ImageJ software 1.52a (NIH, Bethesda, MD, USA) was used to analyze the relative colony area.
2.10. Cell Cycle Analysis
LNCaP cells (30 × 104 cells/dish) were seeded into 100-π dishes for 24 h incubation. Amounts of 0, 2.5, 5, and 10 μM compound 3h were treated to LNCaP for 48 h, the attached cells were harvested and put into 70% cold ethyl alcohol (EtOH) to fix overnight at 4 °C. Then, cells were resuspended in phosphate-buffered saline (PBS), and stained with a mixed solution of 0.5 mL PBS and 5 μL of PI (P4864-10ML, Sigma-Aldrich, St. Louis, MO, USA) and 10 mg/mL RNase A. In the last step, we measured the effect of compound 3h on the cell cycle in LNCaP cells using a NovoCyte flow cytometer (ACEA Biosciences, Santa Clara, CA, USA).
2.11. Western Blot Analysis
LNCaP cells were seeded at a density of 80 × 104 cells/dish in 100-π dishes and compound 3h (0, 2.5, 5, and 10 μM) was treated afterwards. Cells were harvested and then lysed with PRO-PREPTM extraction solution (17081, iNtRON, Seongnam-shi, Republic of Korea) on ice for 30 min. Before Western blotting, we conducted a bicinchoninic acid (BCA) assay (23228, Thermo Fisher Scientific, Waltham, MA, USA) to measure protein concentrations in the different samples according to the manufacturer’s instructions. After electrophoresing 30 μg protein on 6–15% sodium dodecyl sulfate polyacrylamide gels for 30 min under 80 V, and for 1 h 30 min under 100 V, we transferred the protein to olyvinylidene fluoride (PVDF) membranes (Millipore, Billerica, MA, USA) for 1 h 10 min under 400 mA. We followed this by blocking with skimmed milk for 1 h, and then incubated the PVDF membranes with all kinds of primary antibodies for at least 8 h at 4 °C. The following day, horseradish peroxidase-conjugated anti-rabbit IgG (NB7176, 1:20000; Novus Biologicals, Littleton, CO, USA) or anti-mouse IgG (NB7561, 1:40000; Novus Biologicals, Littleton, CO, USA) secondary antibodies were incubated with PVDF membranes for 1 h at room temperature. At the last step, the Immobilon Forte Western HRP (Merck Millipore, Burlington, MA, USA) and WSE-6200 LuminoGraph Ⅱ Imaging System (ATTO, Tokyo, Japan) were used to visualize and detect the protein bands. The intensities of protein bands were quantified with ImageJ software 1.52a (NIH, Bethesda, MD, USA).
2.12. Apoptosis
After treatment for 48 h with compound 3h, LNCaP cells were harvested and stained with 2 μL Annexin V-FITC (556419, BD Biosciences, San Diego, CA, USA) and 4 μL PI in 100 μL of 1 × binding buffer for 30 min. After diluting cells with 1 × binding buffer, an apoptosis assay was performed using a NovoCyte flow cytometer (ACEA Biosciences, Santa Clara, CA, USA).
2.13. DAPI Nuclear Staining
Apoptosis can be identified based on the presence of broken, condensed, degenerated nuclei, which can be stained by DAPI. LNCaP cells (5 × 10⁴) seeded in confocal dishes were treated with DMSO or compound 3h (2.5, 5, and 10 µM) for 48 h. Acetone was used for fixation, and 0.1 μg/mL DAPI (D9542, Sigma-Aldrich, St. Louis, MO, USA) was used to stain DNA. At the last step, a confocal K1-fluo microscope (Nanoscope Systems, Daejeon, Republic of Korea) was used to observe morphological changes in the nucleus.
2.14. Stain LNCaP Cells with Acridine Orange
Seeded LNCaP cells (5 × 10⁴) in confocal dishes were treated with DMSO or compound 3h (2.5, 5, and 10 µM) for an extra 48 h. LNCaP was stained with 1 μg/mL acridine orange (00910250, Thermo Fisher Scientific, Waltham, MA, USA) for 15 min. Last, stained cells were observed under a Confocal K1-fluo microscope (Nanoscope Systems, Daejeon, Republic of Korea) at 400×/600× magnification.
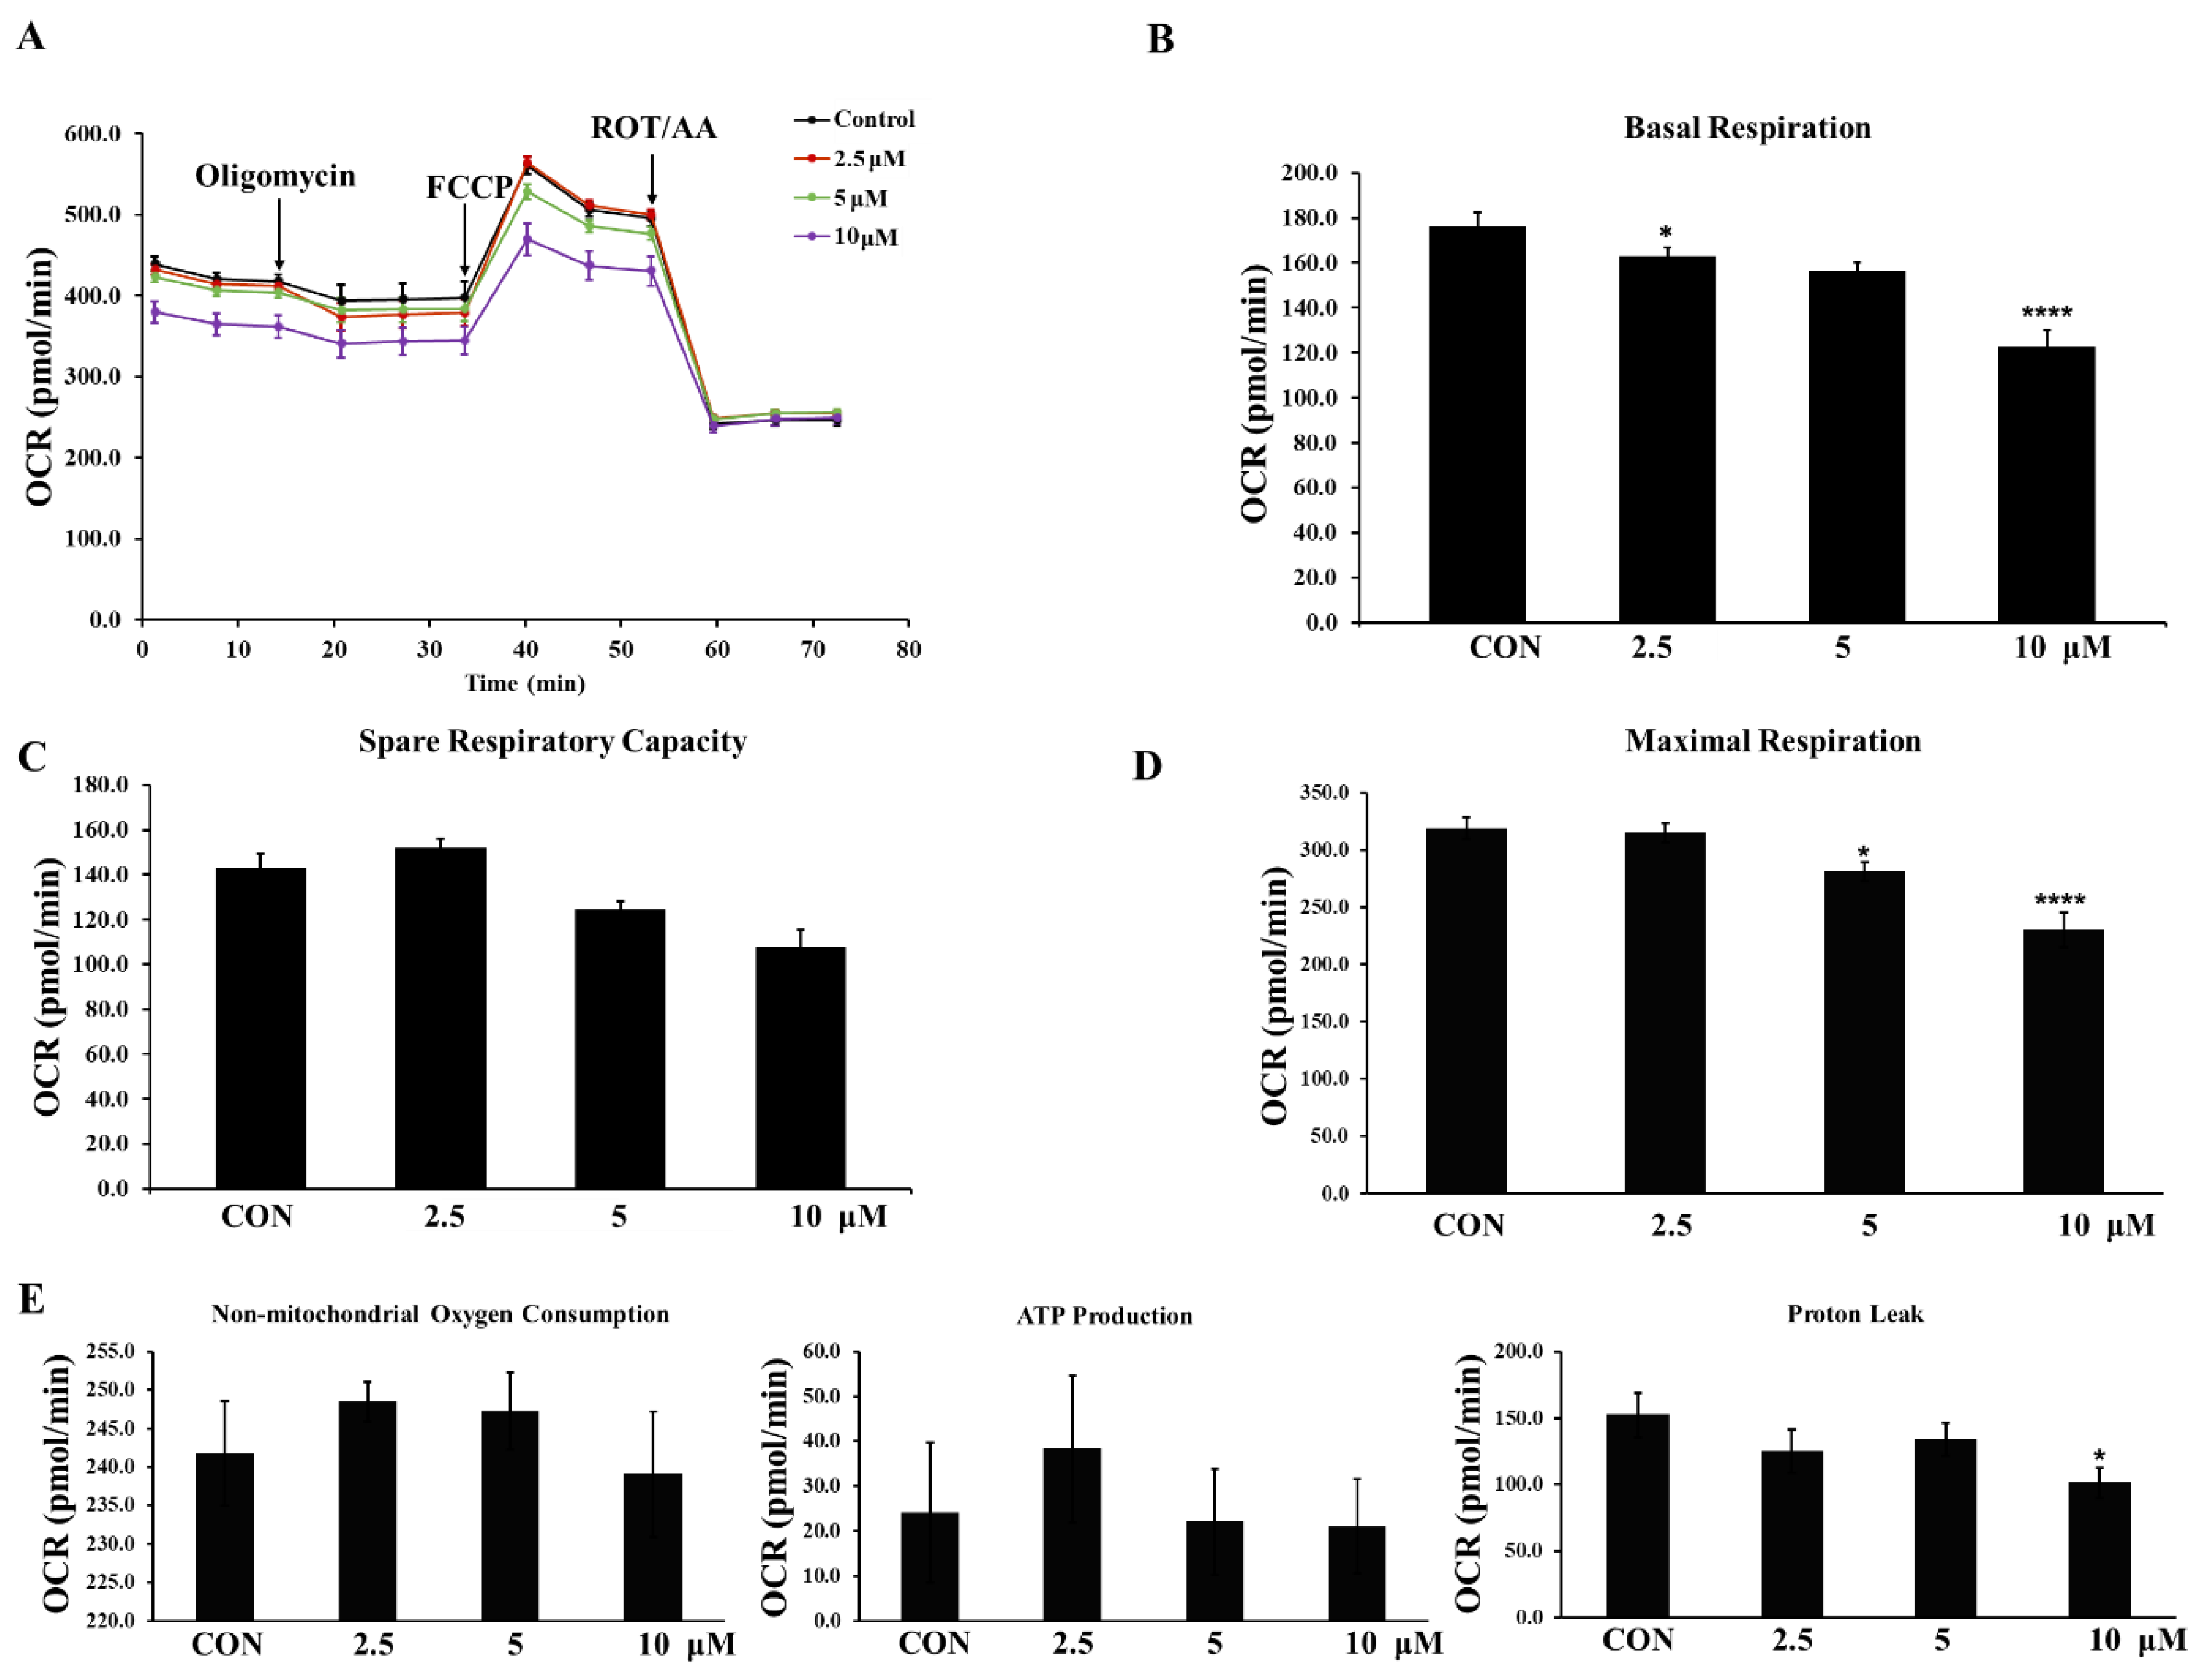
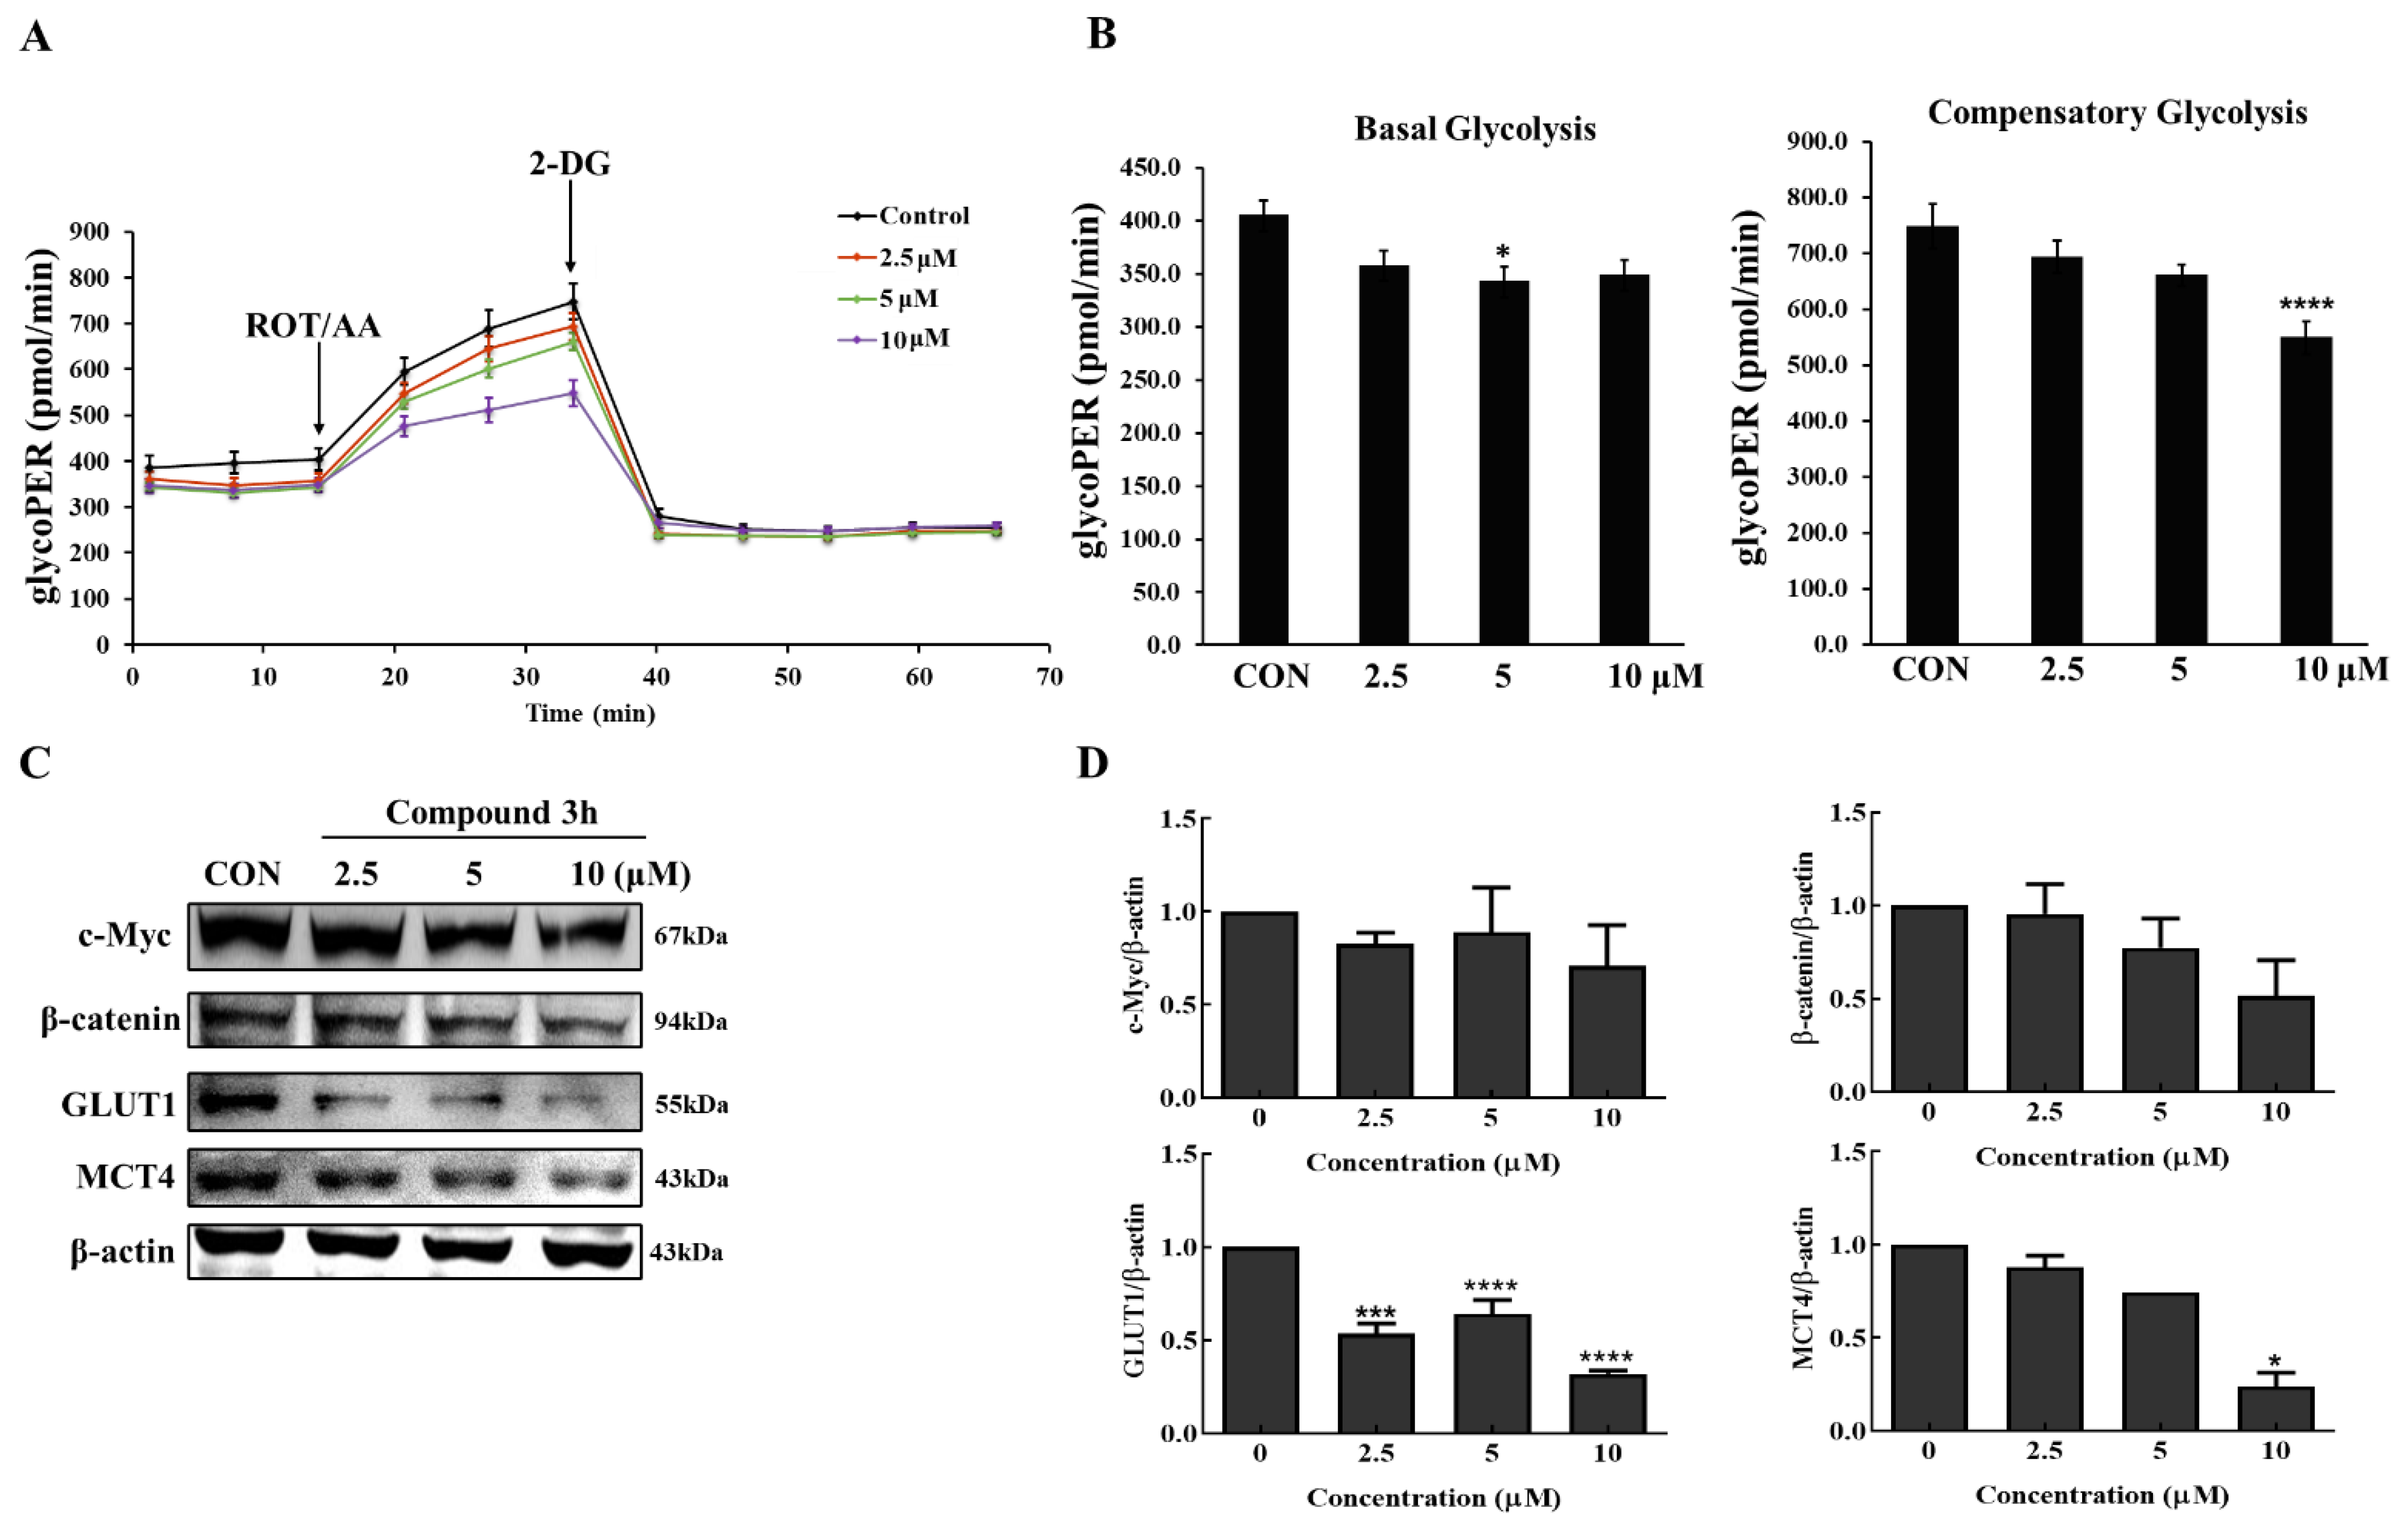
2.15. Seahorse XFe96 Analysis of Cell Mito Stress Test and Glycolytic Rate Assay
The Agilent Seahorse Xfe cell mito stress test (Kit 103015-100) evaluated key parameters of mitochondrial function by directly measuring the OCR, and after mitochondrial inhibition, a glycolytic rate assay (Kit 103344-100) accurately measured glycolytic rates under basal glycolysis and compensatory glycolysis. During both experiments, the OCR and ECAR were continuously monitored and recorded by a Seahorse Xfe96 analyzer (Agilent, Santa Clara, CA, USA). Briefly, on the day before detecting with the Seahorse Xfe96 analyzer, LNCaP cells seeded into a Xfe96 cell culture microplate were treated with DMSO or compound 3h (2.5, 5, and 10 µM), and calibrated by an XFe cartridge with 200 μL XF calibration buffer overnight. On the day of assay, according to the user guide, XF assay medium was used to wash cells; different compounds (oligomycin, carbonyl cyanide-p-trifluoromethoxyphenylhydrazone (FCCP), Rotenone and antimycin A (ROT/AA) for the cell mito stress test, and ROT/AA, 2-Deoxy-D-glucose (2-DG) for the glycolytic rate assay) were added to the injection ports for the cell mito stress test and glycolytic rate assay. After detection, raw data were analyzed automatically by Assay Generator.
2.16. Statistical Analysis
All data are expressed as the mean ± standard error (SEM) of at least three independent experiments. Our analysis was conducted using GraphPad Prism software 5.0 (GraphPad Software, San Diego, CA, USA). Statistical significance was analyzed using one-way analysis of variance followed by Bonferroni’s post hoc comparisons test. Statistical significance was set at p value < 0.05.
4. Discussion
Prostate cancer is a common malignant cancer characterized by slow progression, with a gradually increasing incidence, and a high mortality rate in advanced cases. Although the 5-year survival rate of localized prostate cancer is >99%, advanced prostate cancer is regarded as incurable [
20,
21]. Although androgen deprivation therapy (ADT) is considered to be the primary treatment option for advanced prostate cancer, most patients develop recurrence and insensitivity after an initial positive response [
22]. Docetaxel significantly improves the overall survival of castration-resistant prostate cancer (CRPC) patients, and has been approved as a first-line treatment option for CRPC [
23]. However, many patients develop resistance to docetaxel. Therefore, the development of novel agents as new targets for prostate cancer treatment is essential to solve the problems associated with chemotherapy.
Currently, the Warburg effect, as a hallmark of cancer, may be a breakthrough for cancer therapy. PKM2 plays an important role in the regulation of anabolic metabolism, including the Warburg effect. High PKM2 expression was previously shown in prostate cancer tissues [
24]; therefore, targeting PKM2 or glycolysis may be a potent strategy for prostate cancer treatment. Previously, it was shown that PKM2 knockdown in the PKM2-overexpressed prostate cancer cell line DU145 induced autophagic cell death by influencing cellular metabolism and the Akt/mTOR pathway [
17]; however, PKM2 knockdown therapy is severely limited in clinical treatment. Therefore, exploring novel anticancer agents that target PKM2 remains a hotspot of research. Recently, the anticancer effect of several PKM2 inhibitors (shikonin, metformin) has been identified. In particular, the inhibitory effect of compound
3K, a PKM2 specific inhibitor, on SK-OV-3 has been proven in vitro and in vivo [
18]. In this study, we evaluated the anticancer effect of compound
3h, which was synthesized based on the structure of compound
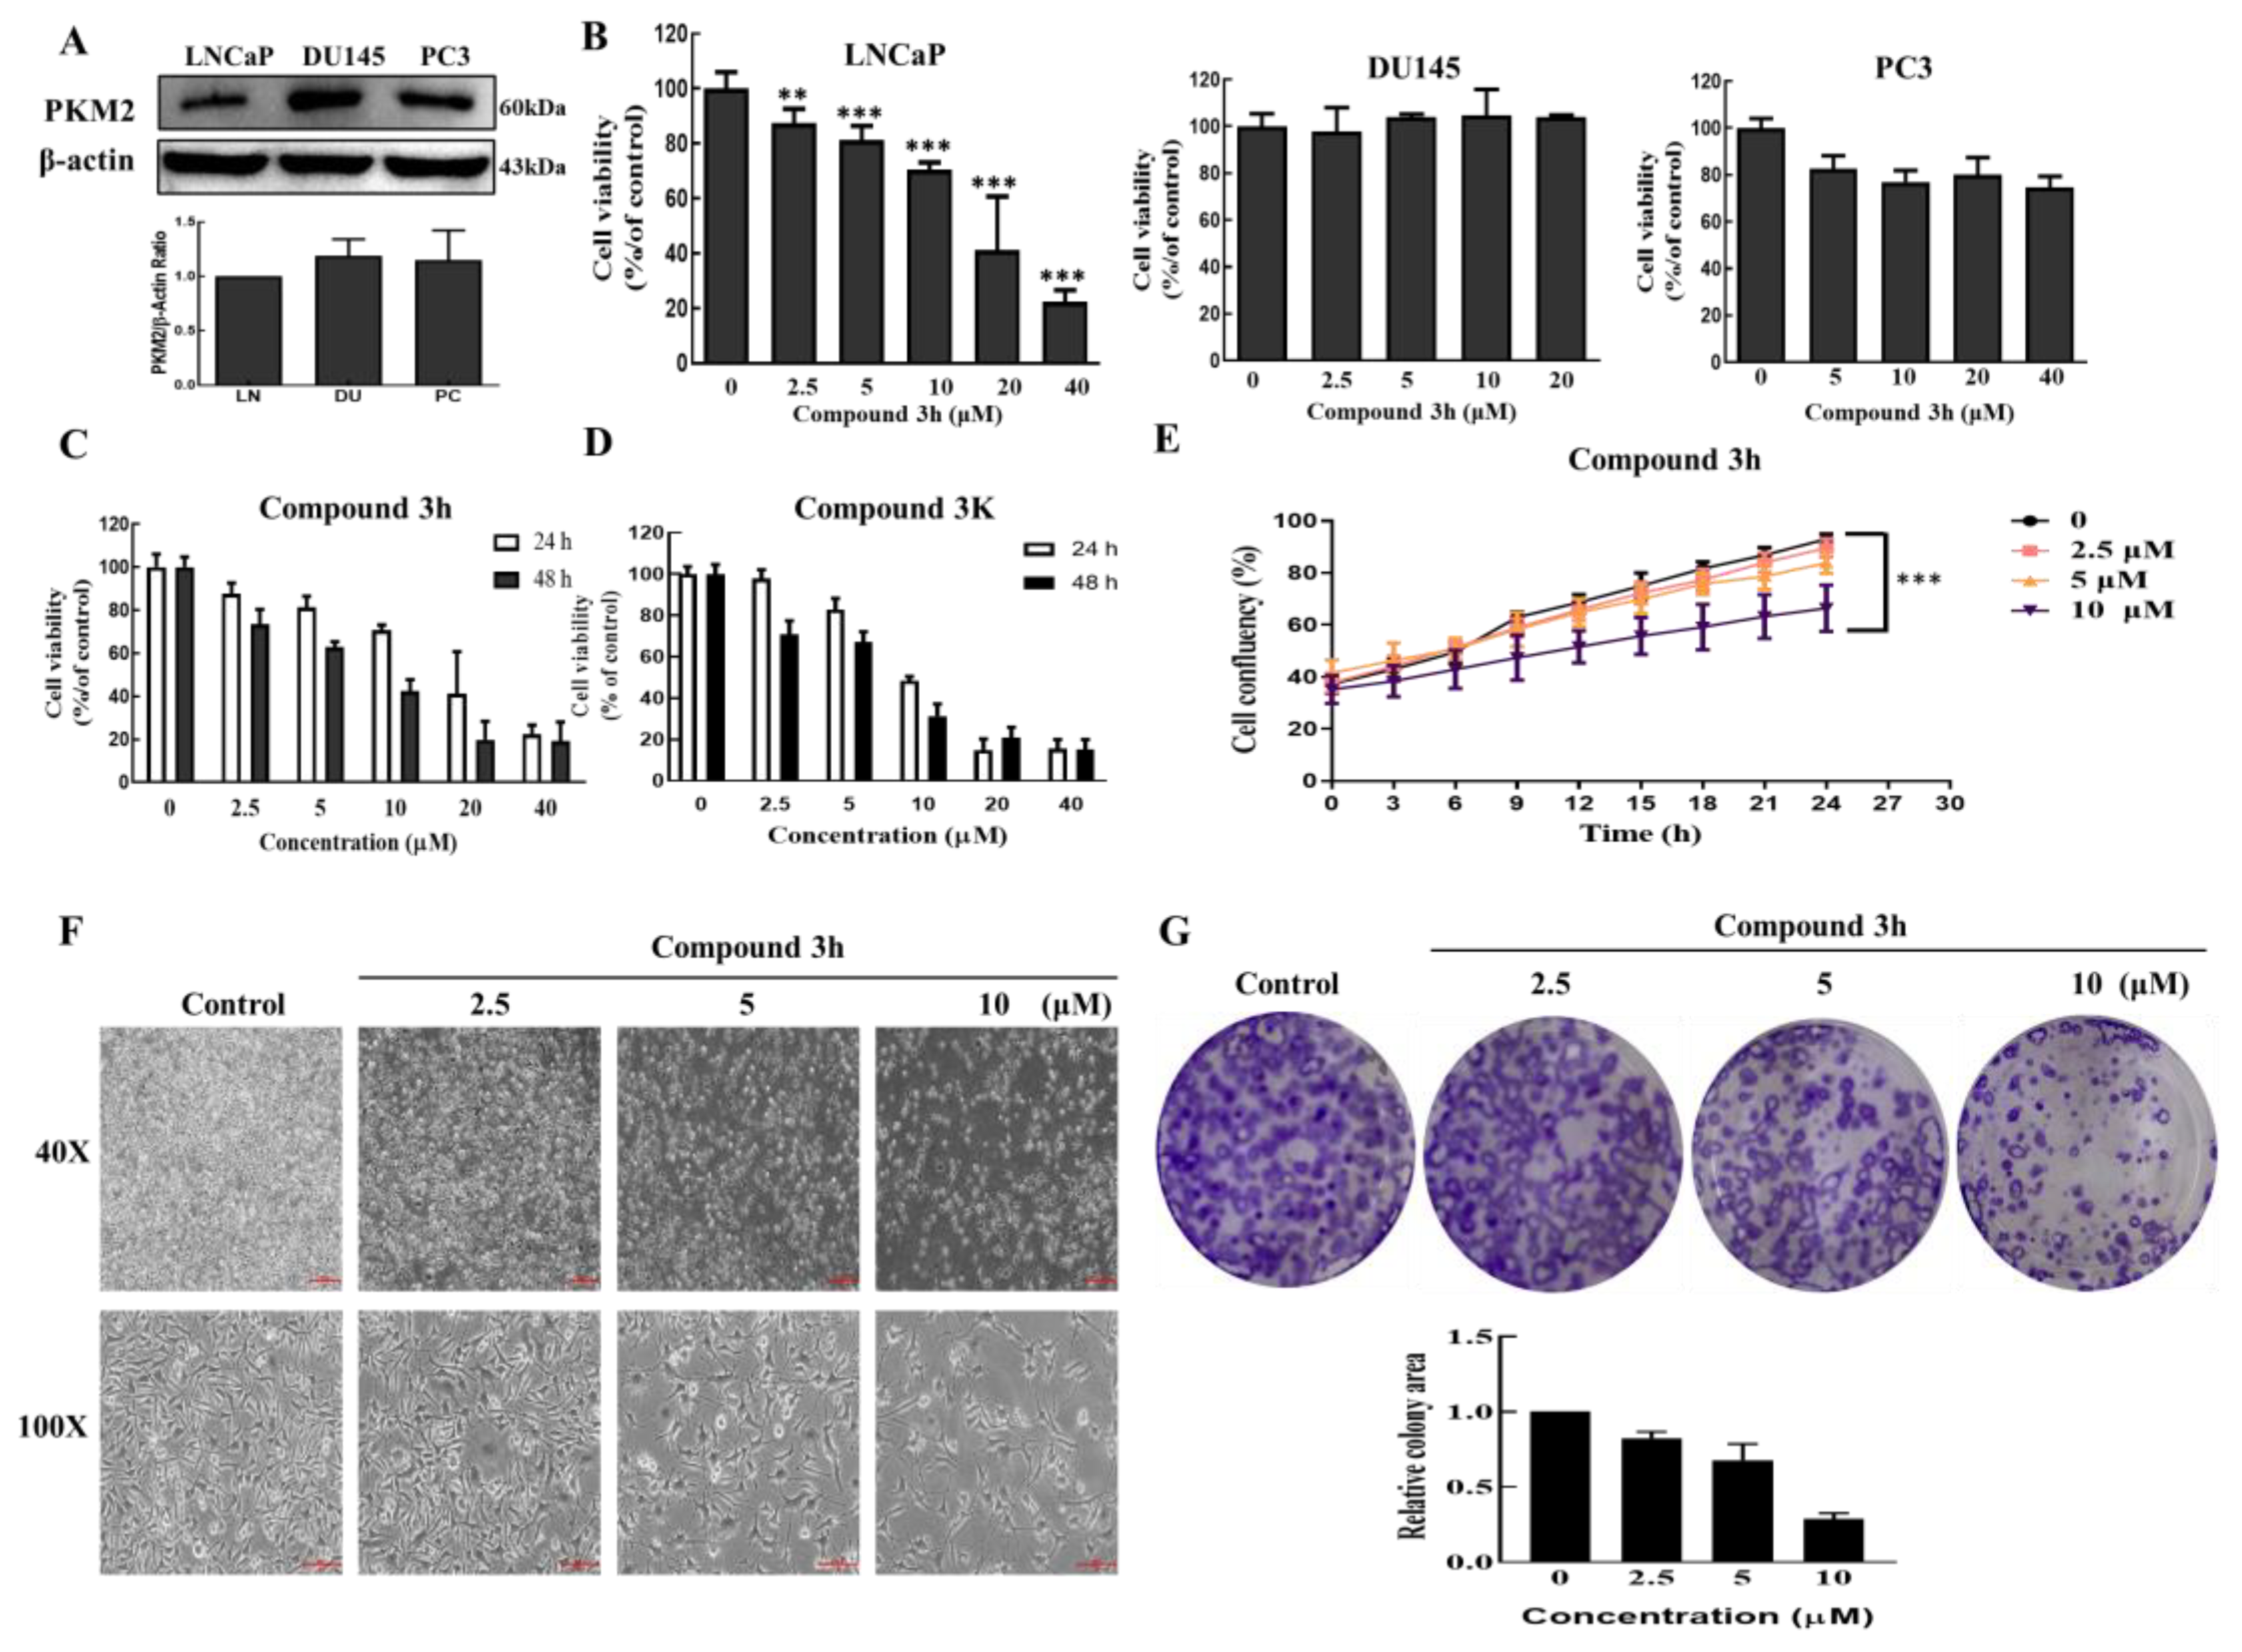
3K and its molecular mechanism in LNCaP. Our results provide a new perspective for the development of novel agents for prostate cancer treatment. We found that compound
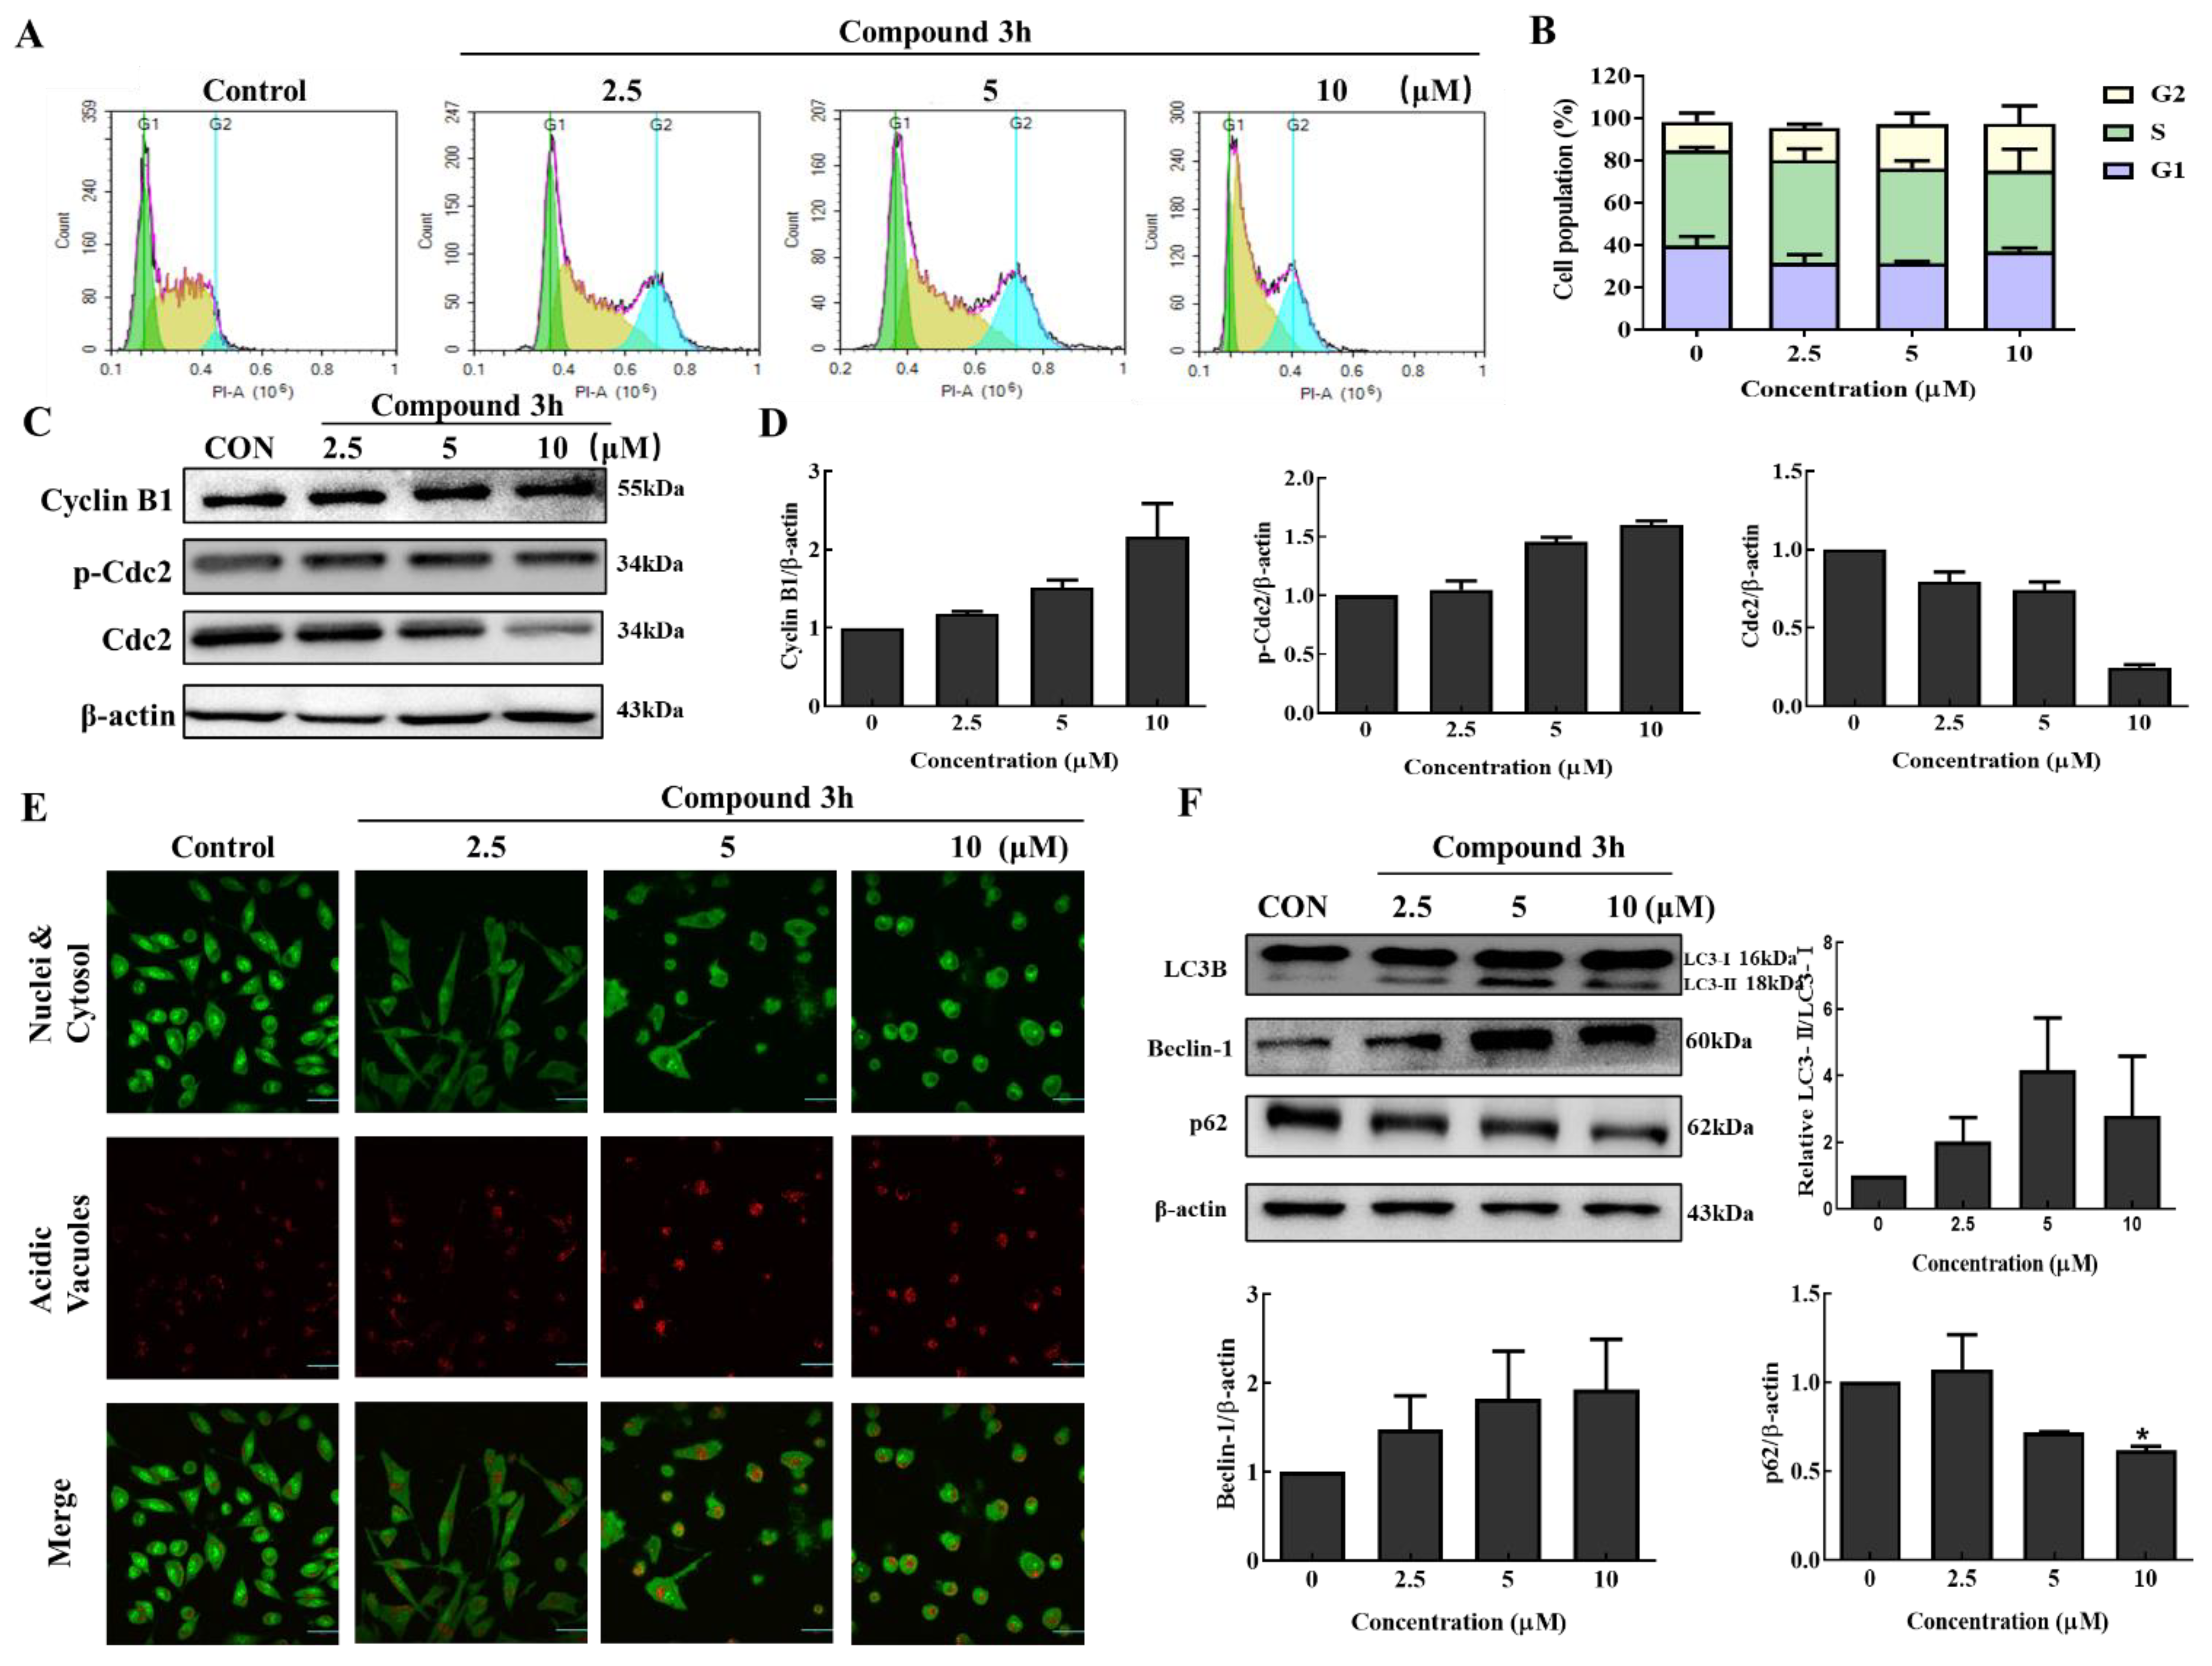
3h treatment decreased the proliferation and colony formation of LNCaP cells in a dose- and time-dependent manner. According to a previous report, PKM2 knockdown was related to G2/M arrest in HeLa and SiHa cells [
25]; therefore, we assessed the influence of compound
3h on the cell cycle in LNCaP cells. Compound
3h treatment led to a slight increase in the percentage of cells in the G2/M phase, which was mediated by increased p-Cdc2 expression.
Abundant glucose uptake and lactate elimination are essential features of aerobic glycolysis in cancer cells [
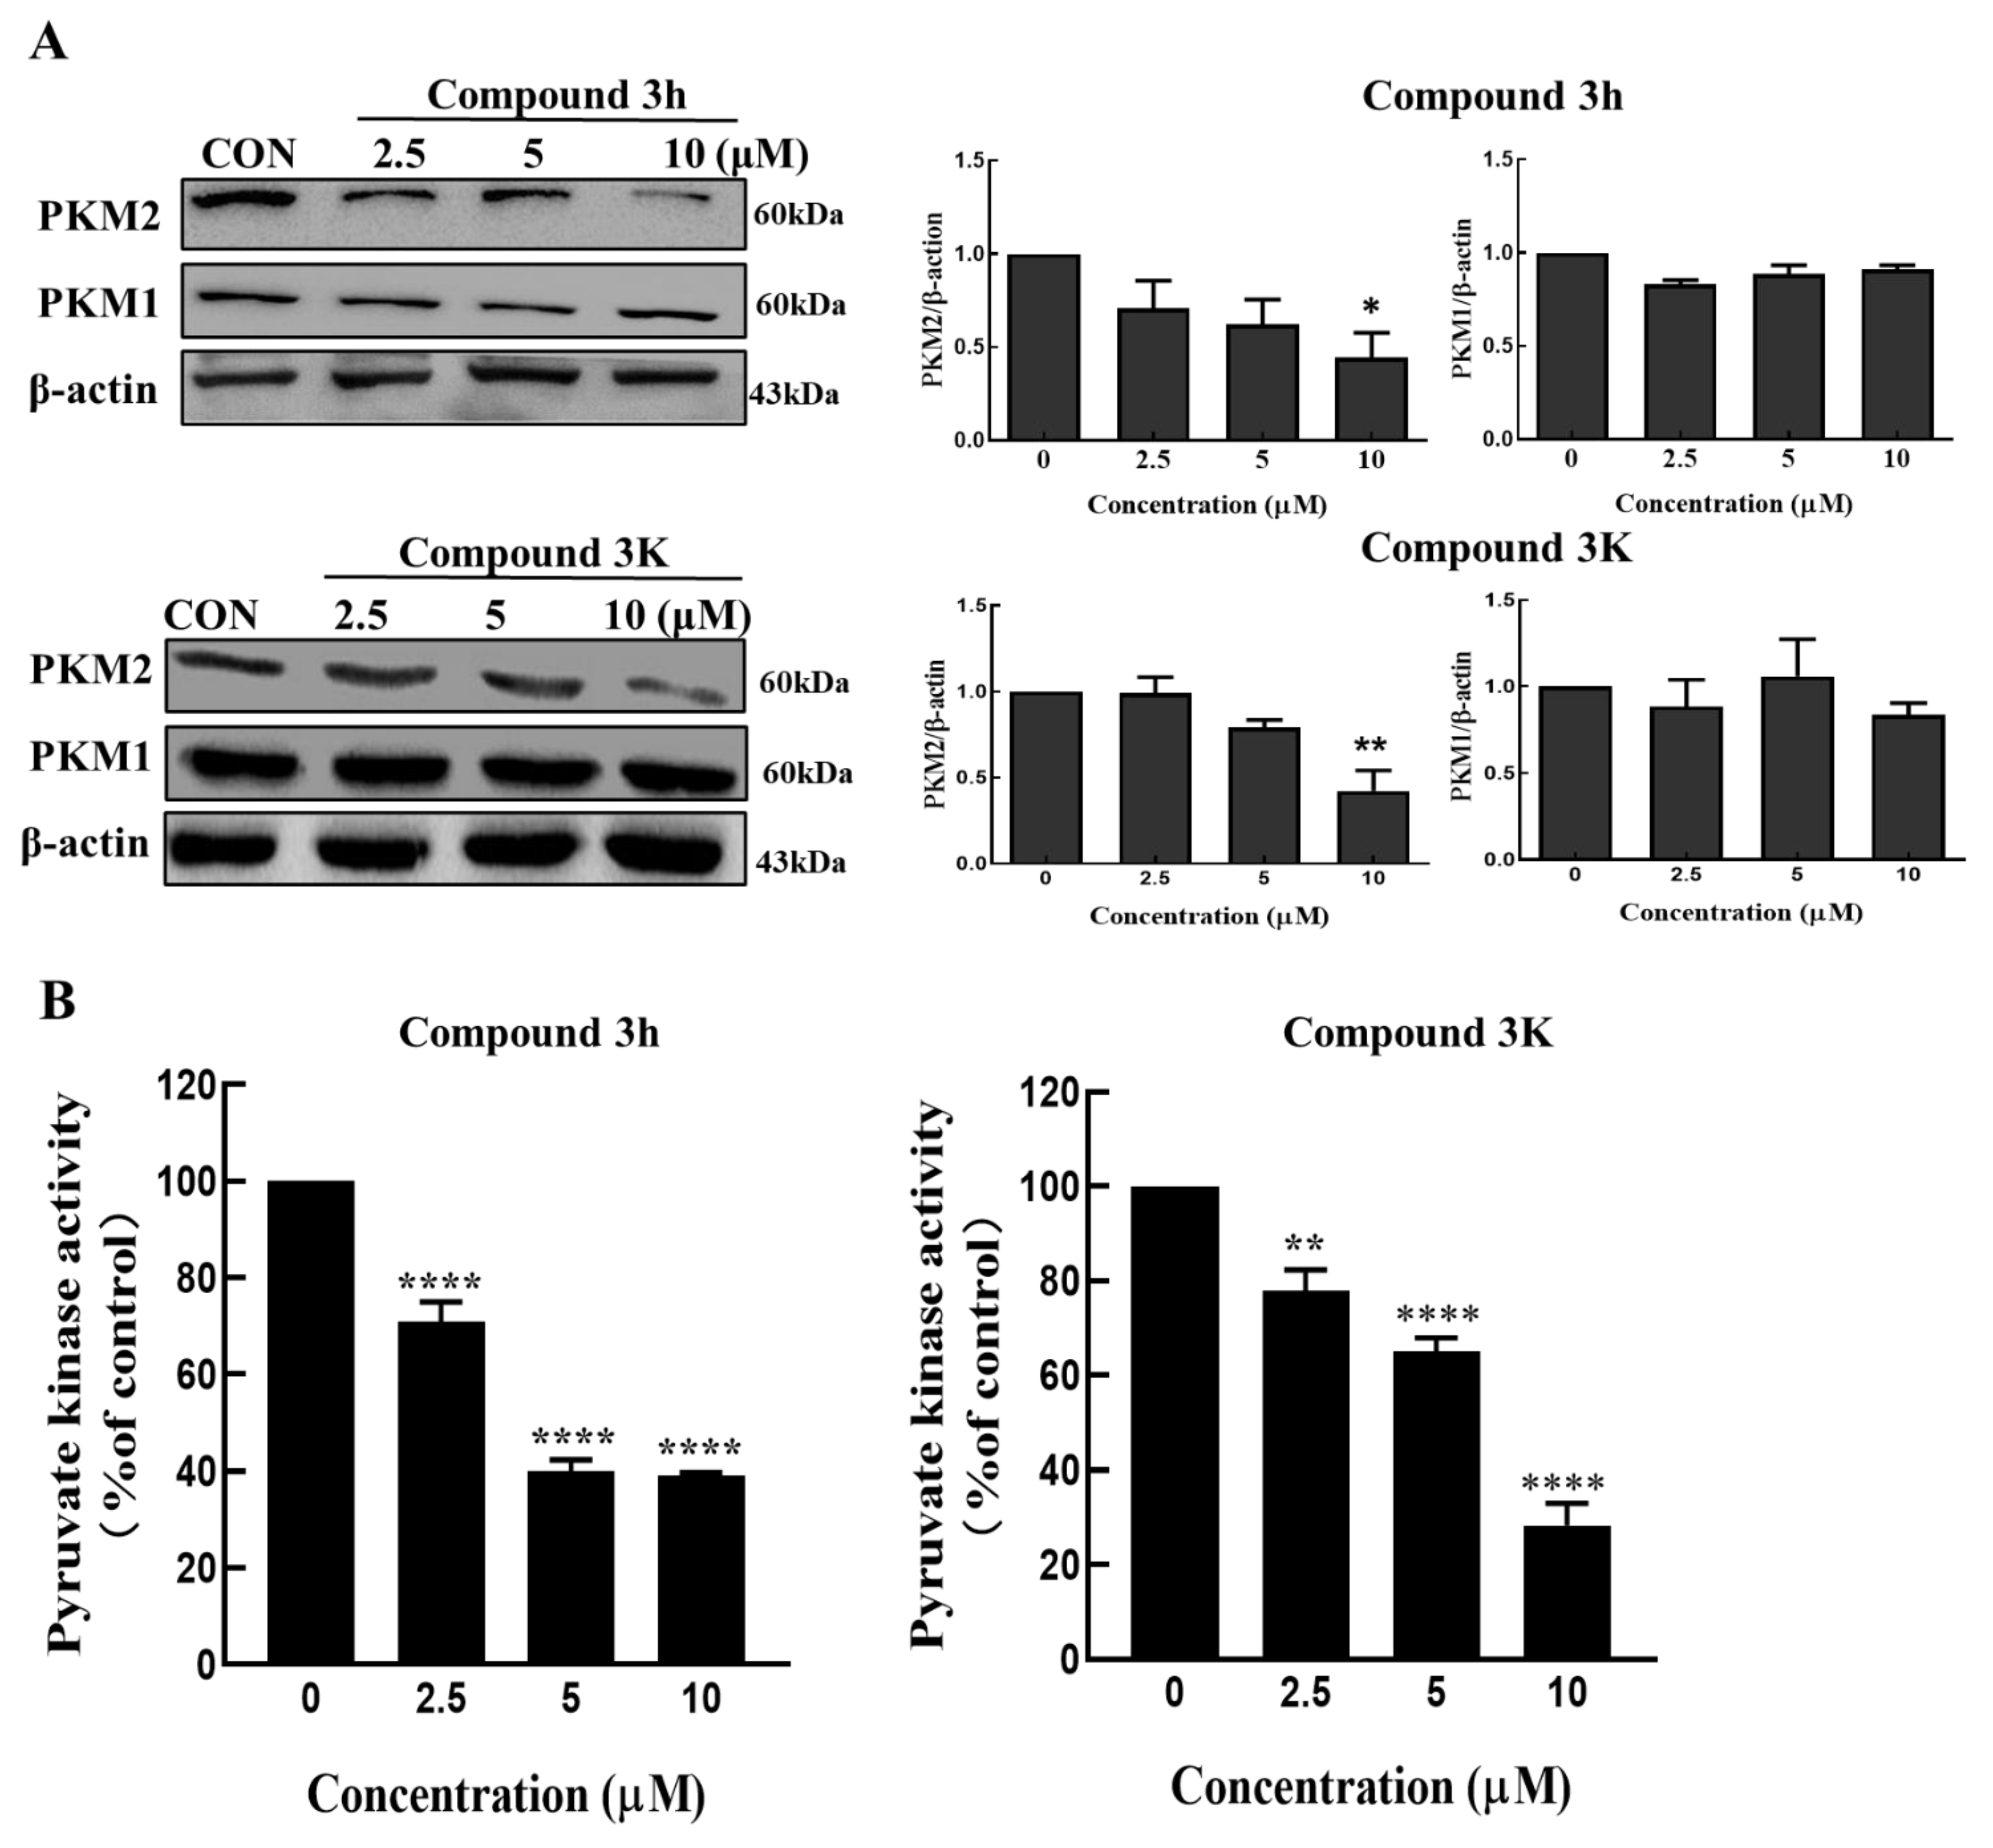
4]. In this study, compound
3h inhibited PKM2 expression in LNCaP cells, which led to the inhibition of aerobic glycolysis, reduction of glucose intake and lactate elimination—consistent with our results of downregulated GLUT1 and MCT4 expression—and decreased basal glycolysis and compensatory glycolysis. It has been reported that the mTOR-MFN2-PKM2 signaling axis couples glycolysis and mitochondrial OXPHOS, which increases the phosphorylation of MFN2, leading to increased PKM2:MFN2 interaction and OXPHOS increase [
26]. Therefore, compound
3h may impair OXPHOS and glycolysis by inhibiting PKM2 and interfering with the PKM2:MFN2 interaction.
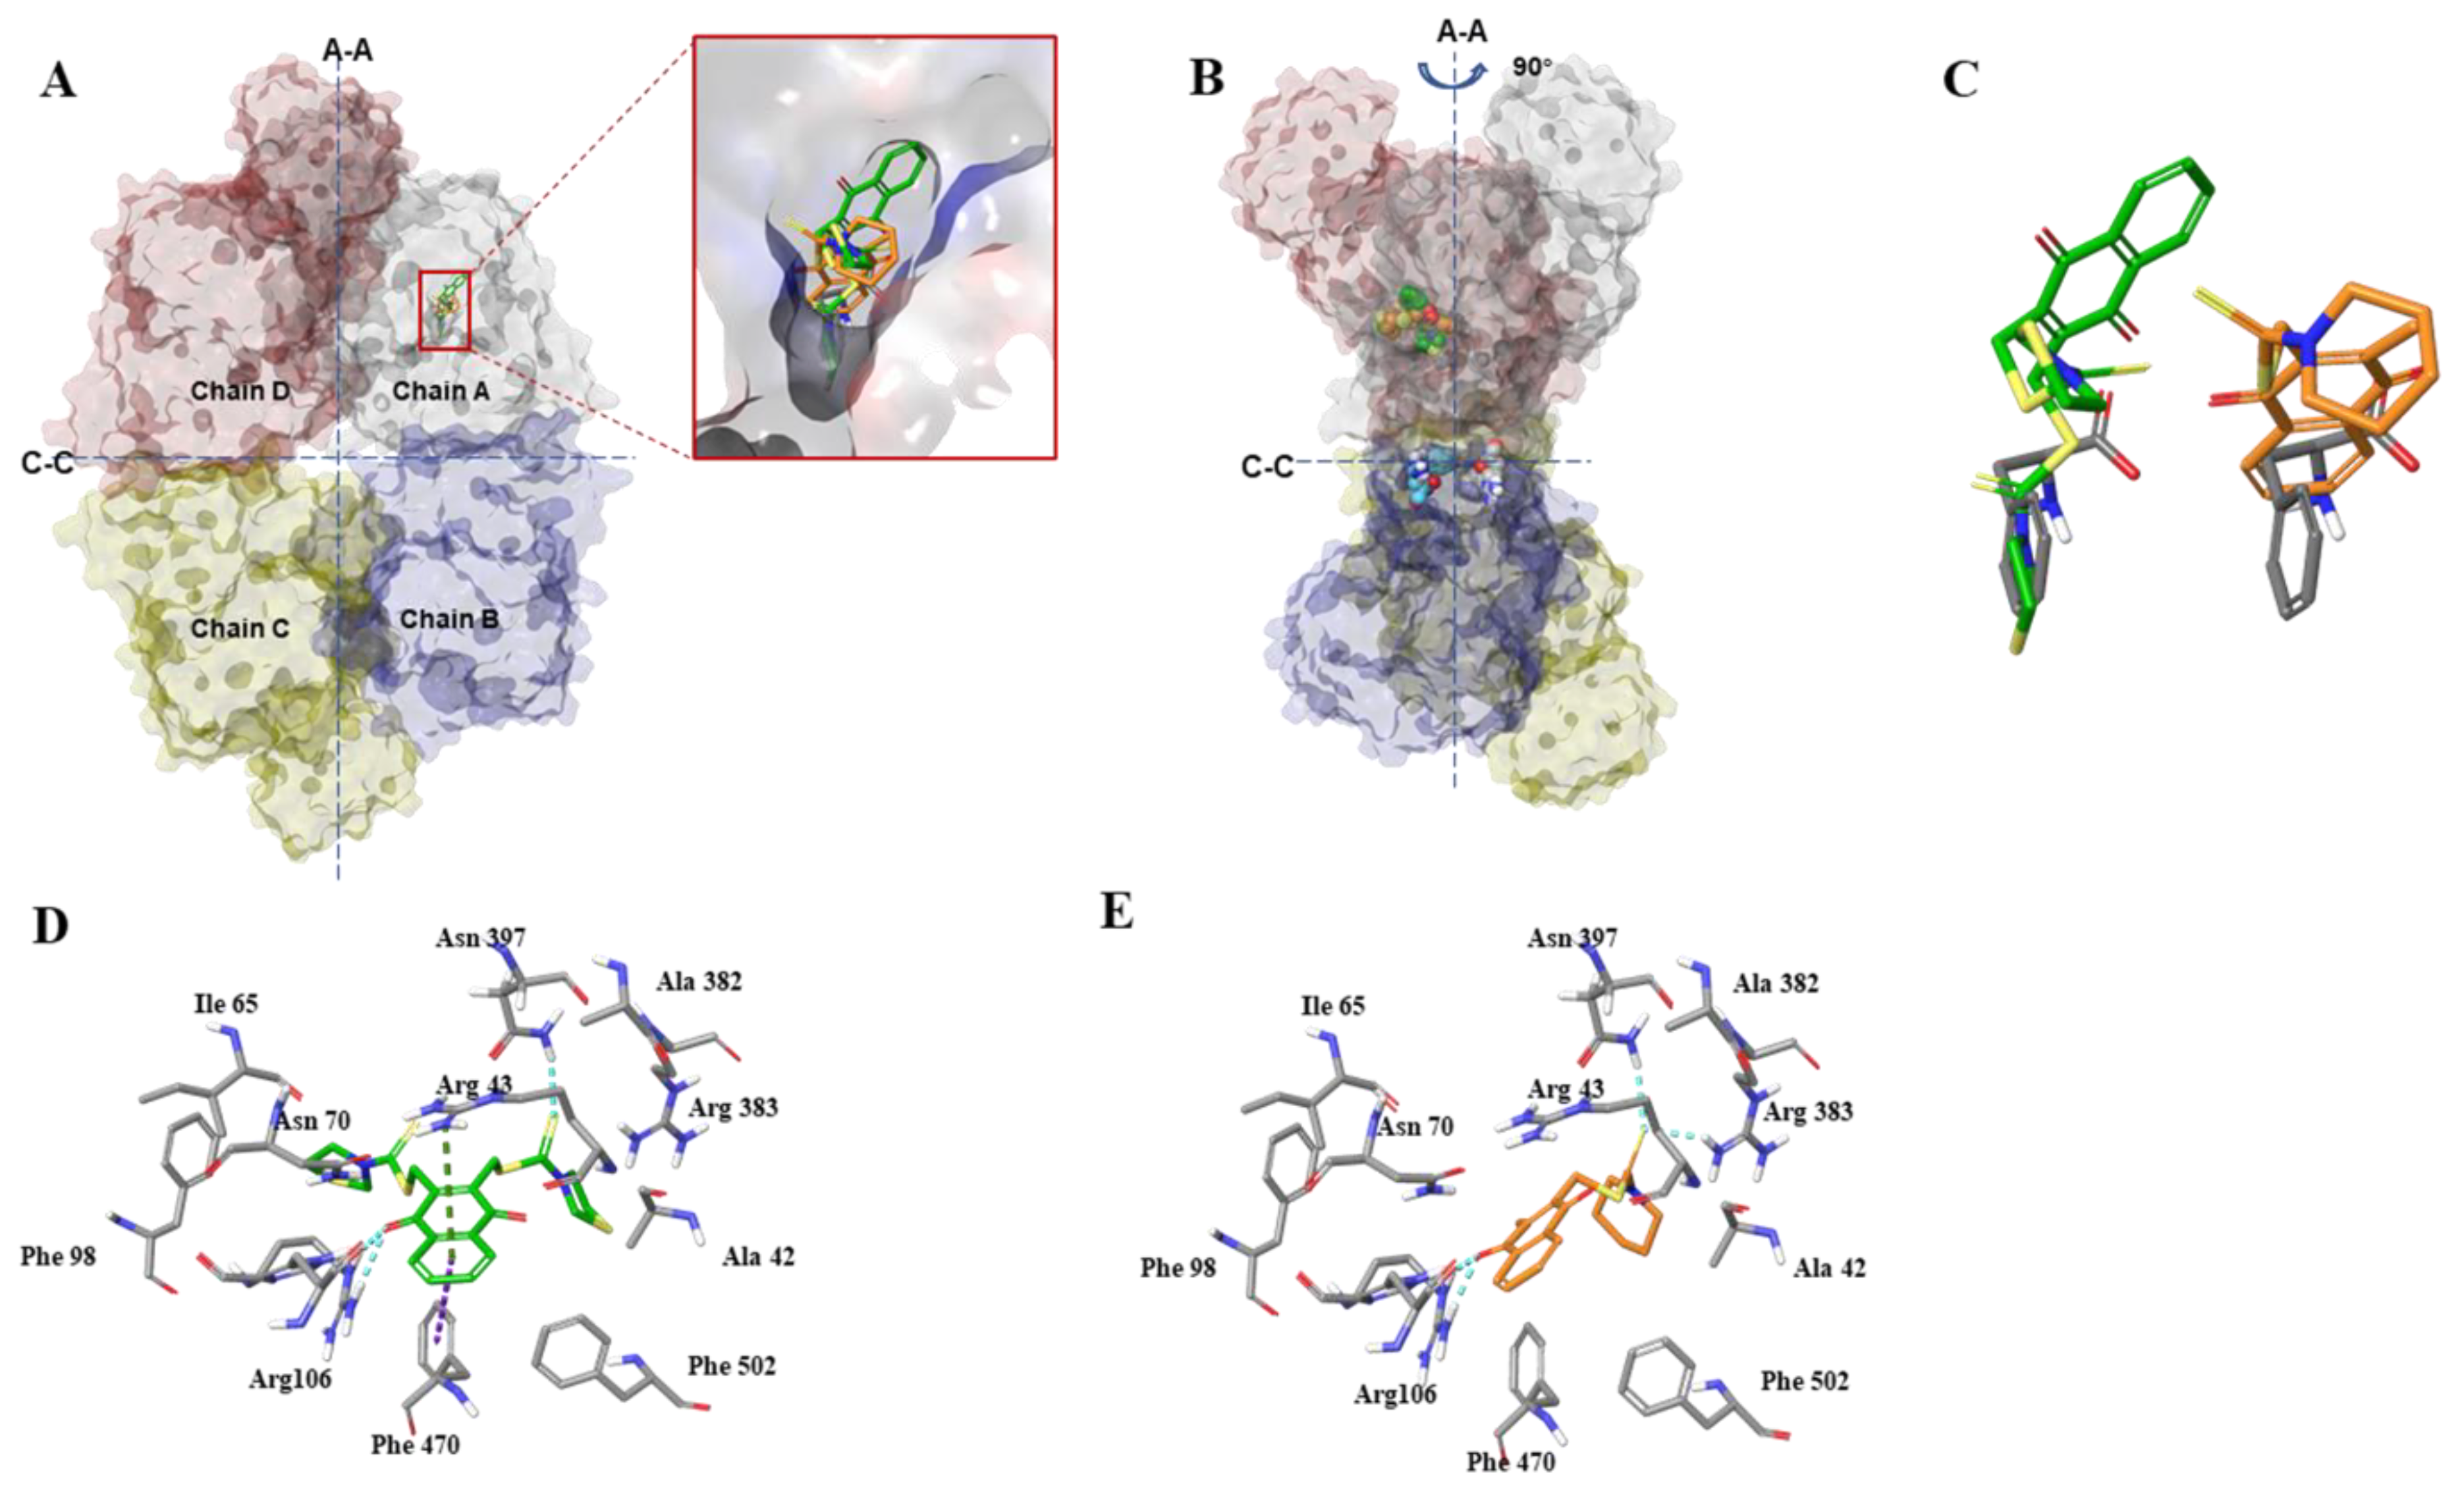
PKM2 has dimeric and tetrameric forms. Dimeric PKM2 translocates to the nucleus and regulates transcription factors (including β-catenin), thus affecting a variety of signaling pathways that can promote tumor progression [
27,
28]. Tetrameric PKM2 has allosteric regulatory domains, and PKM2 can be stabilized in the inactive T-state when inhibitory phenylalanine binds to the binding pocket [
12]. According to our molecular docking results, compound
3h can bind to the phenylalanine-binding pocket at a similar position; therefore, compound
3h also stabilizes PKM2 in the inactive T-state, which inhibits PKM2 activity and blocks dimer formation, causing inhibition of glycolysis and nuclear translocation of dimeric PKM2, further suppressing cancer cell proliferation.
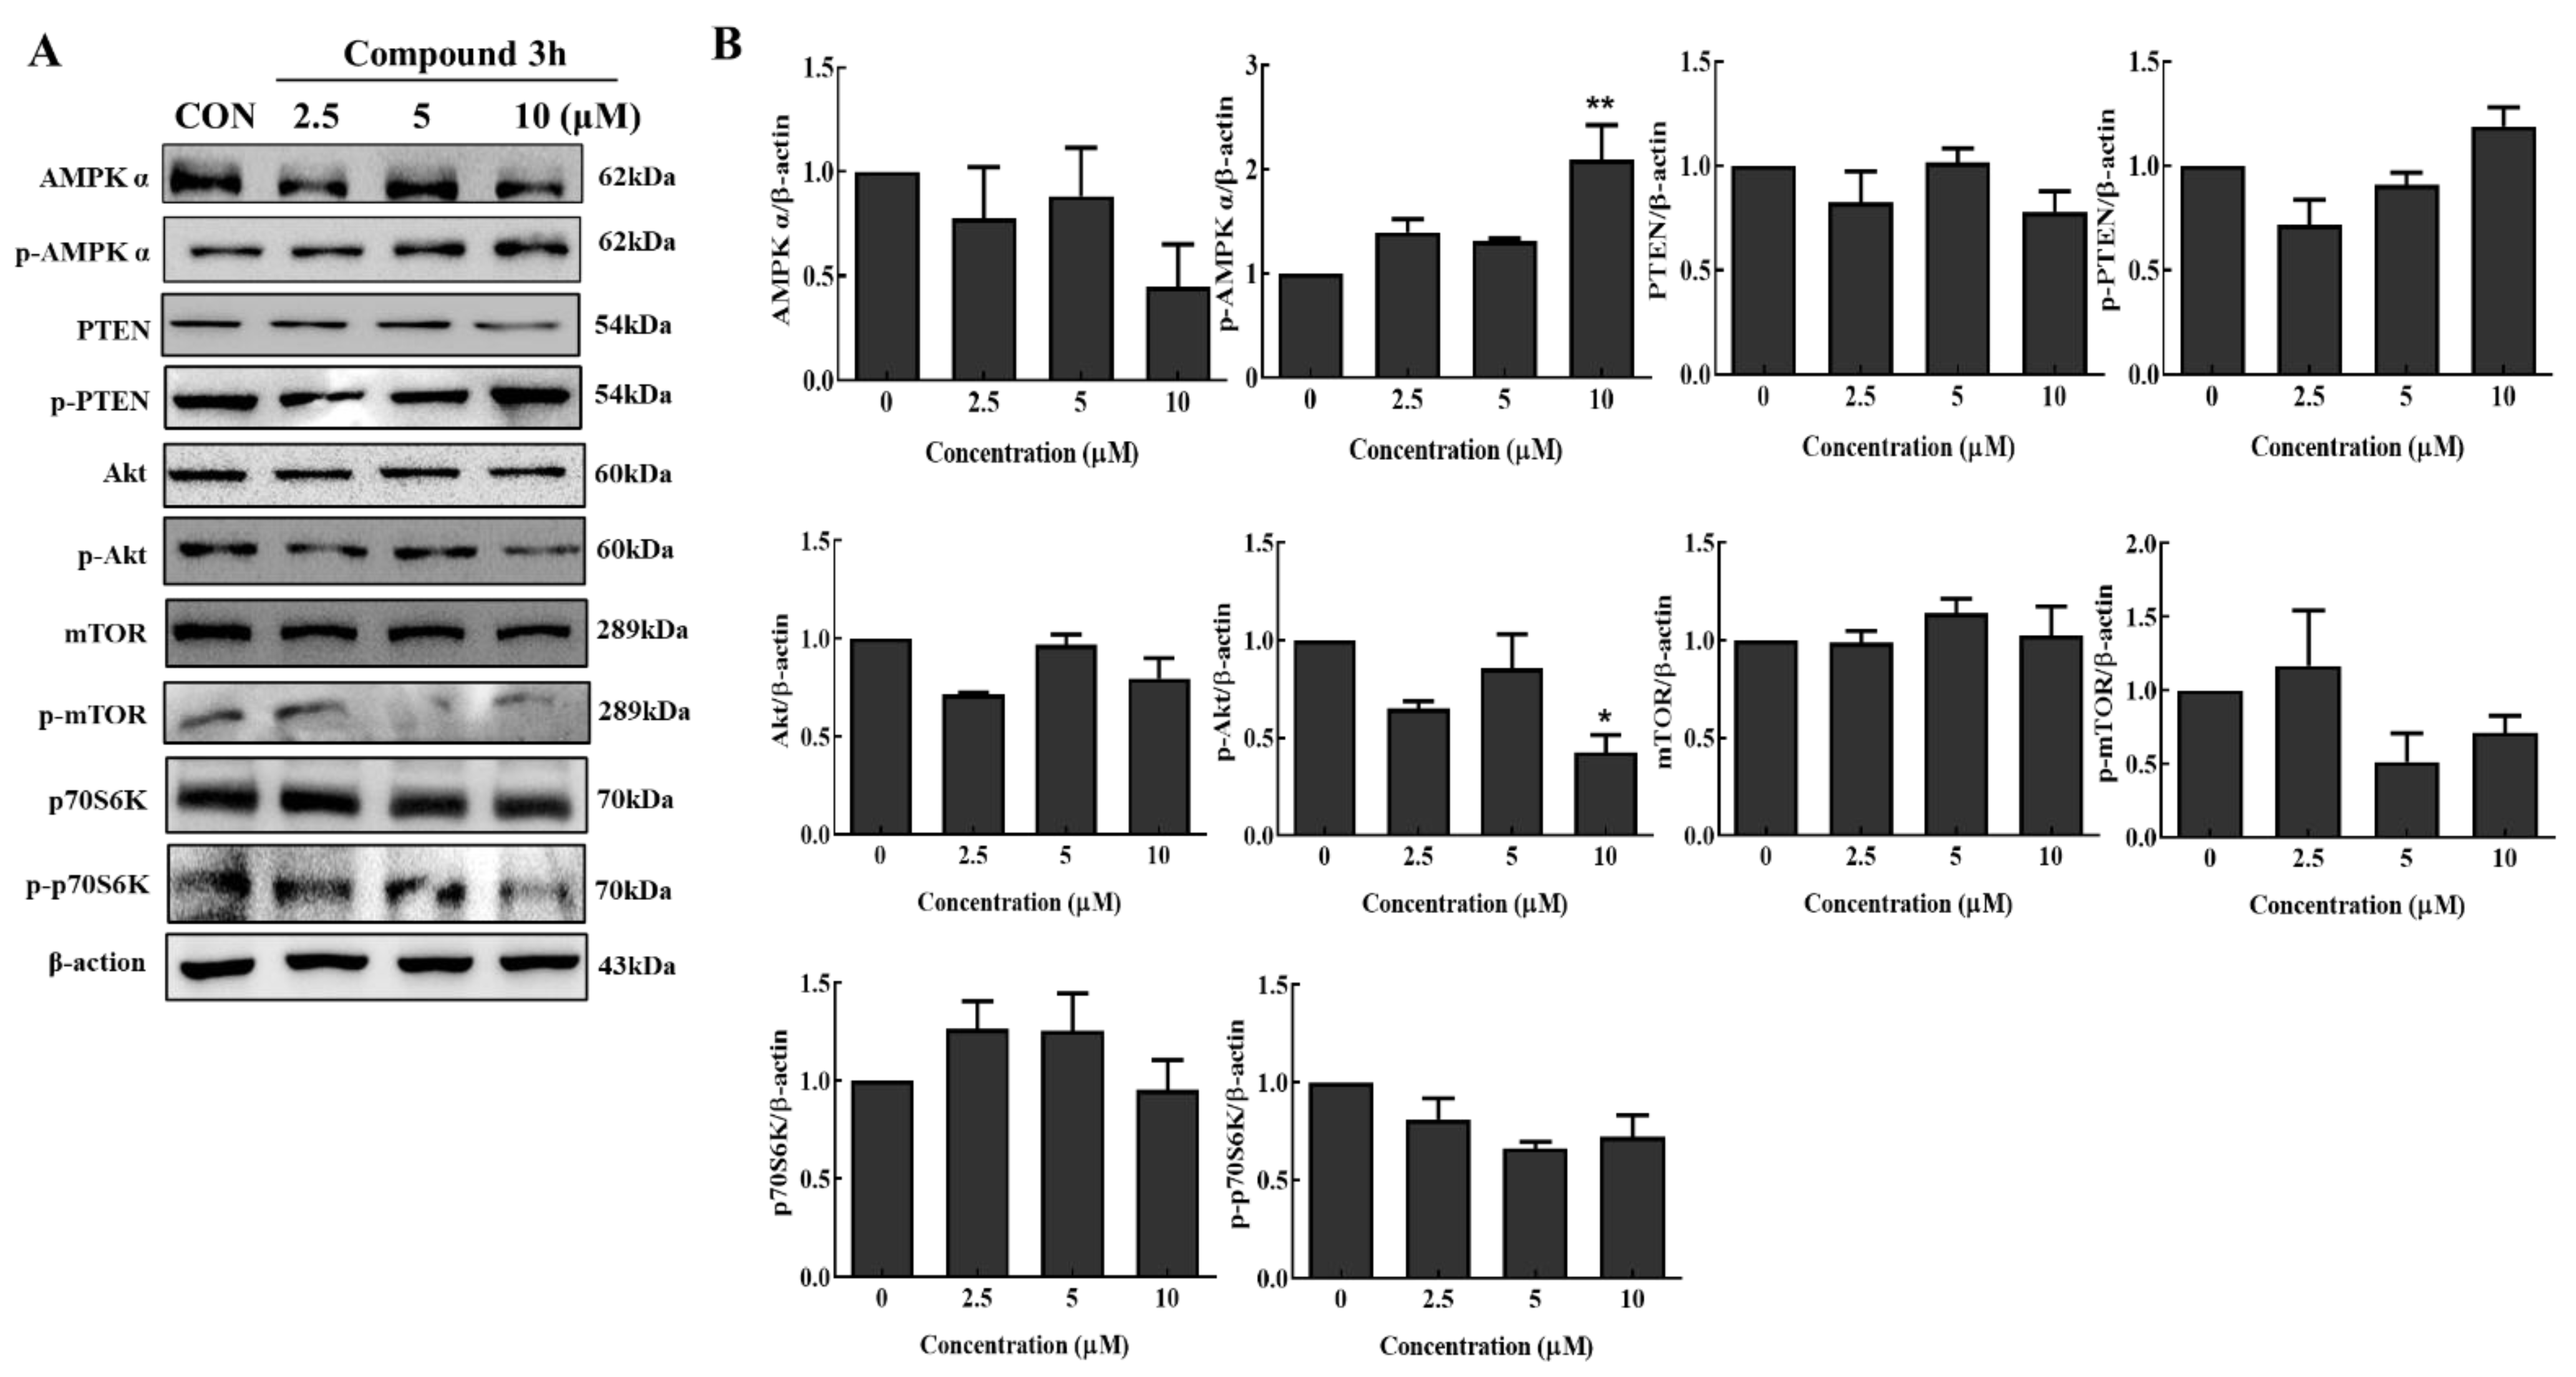
Autophagic death is a common pathway of cell death. Activation of the Akt/mTOR pathway can inhibit autophagy, which is critical for cancer cell growth and survival [
29]. Akt is a major regulator of cell survival under stressful conditions [
30], which not only regulates nutrient intake, but also the expression of growth factors [
31]. P70S6K is a downstream target of mTOR, and can be upregulated and phosphorylated by mTOR phosphorylation; thus, more downstream proteins associated with proliferation will be activated and induced [
32]. In addition, AMPK phosphorylation induces mTOR inhibition, leading to autophagy inhibition [
33]. It was reported that the PKM2 knockdown, and PKM2 inhibitor, compound
3K, inhibited mTOR phosphorylation and autophagy activation by activating AMPK phosphorylation in DU145 cells and SK-OV-3 cells, respectively [
17,
18]. In this study, according to the Western blot results, compound
3h increased the expression of p-AMPKα, and decreased that of PKM2, p-Akt, p-mTOR, and p-p70S6K; therefore, compound
3h inhibited PKM2, which caused autophagic cell death by inhibiting the Akt/mTOR signaling pathway in LNCaP.
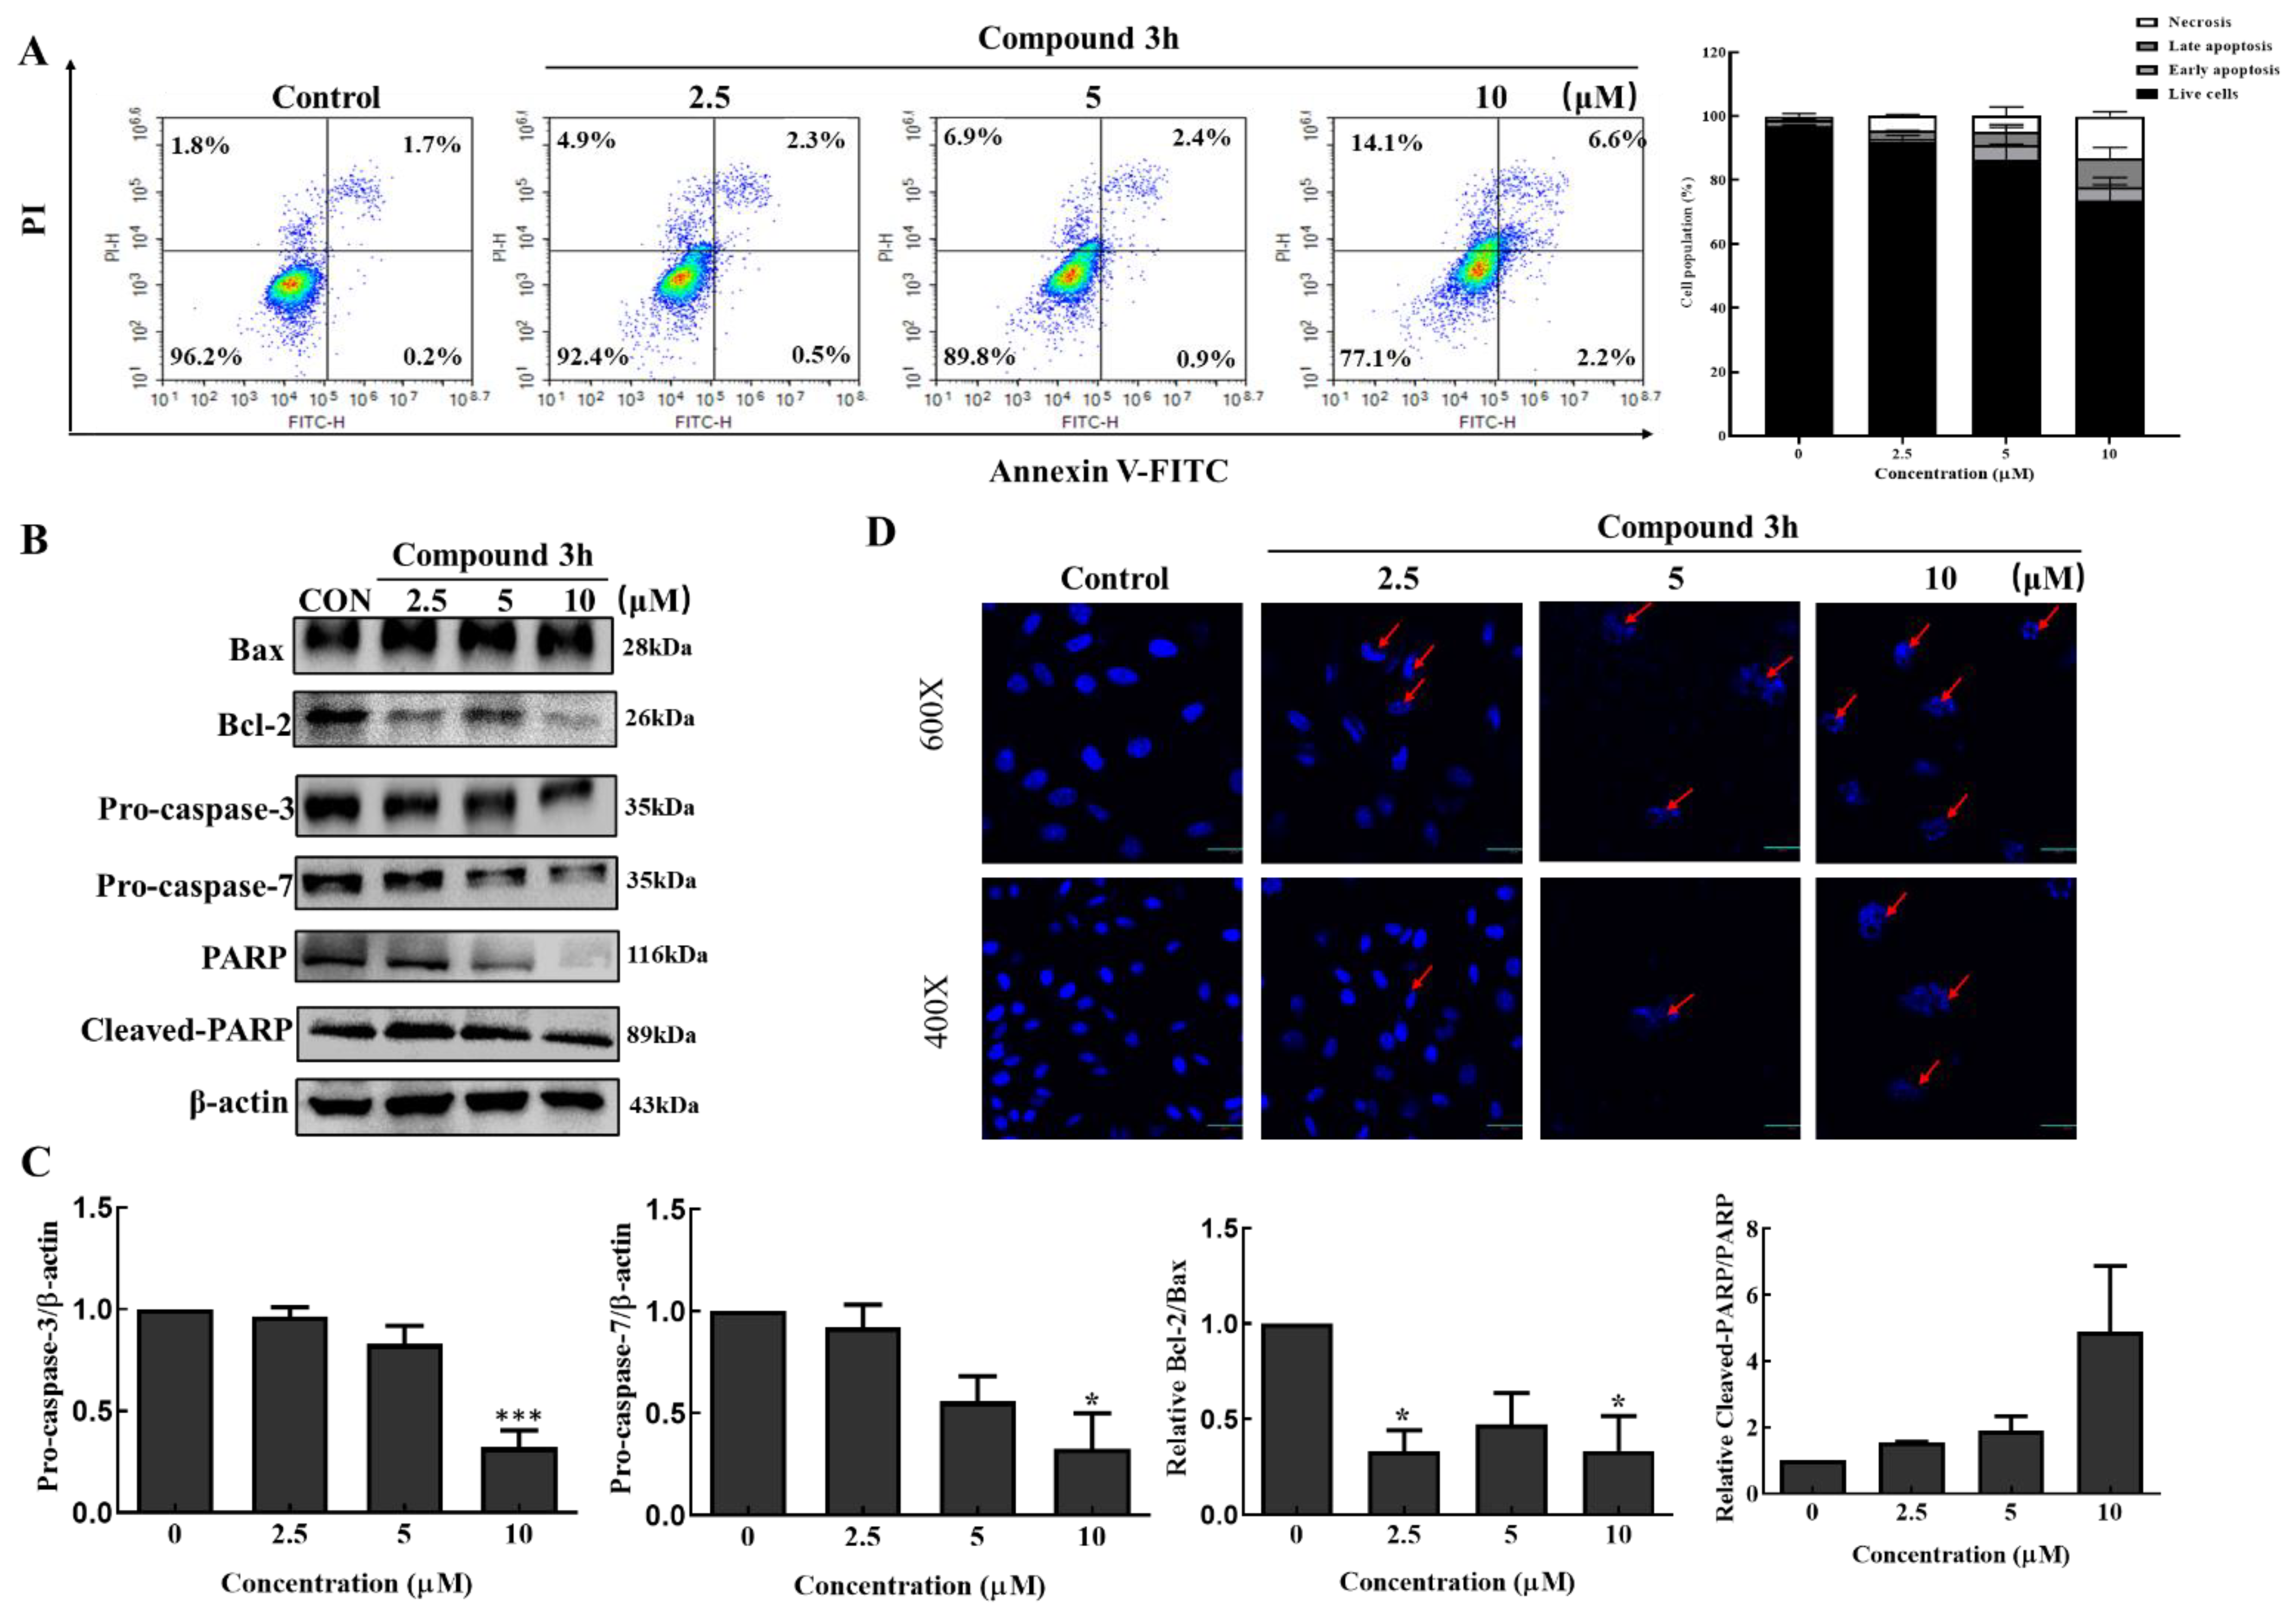
Apoptosis and autophagy are key cellular processes that maintain cellular homeostasis and are connected in complex ways. Bcl-2 and Beclin-1 play important roles in the connection between apoptosis and autophagy [
34]. Bcl-2 activation can be modulated by post-translational modifications such as phosphorylation of Bad. Bad is phosphorylated by Akt and p70S6K, which inhibits its interaction with anti-apoptotic Bcl-2 proteins, and leads to the inhibition of Bax-triggered apoptosis [
35]. Beclin-1 is a lipid-kinase complex that is involved in autophagosome nucleation. Beclin-1 conjugates with members of the Bcl-2 family through the BH3 domain, and dissociation from Bcl-2 is critical for its autophagic activity [
36]. PKM2 knockdown activates apoptotic and autophagic signaling pathways in different cancer cells, including DU145 and A549 cells [
17,
37]. So, PKM2 knockdown and PKM2 inhibition influence the interaction between Bcl-2 and Beclin-1, which may be accompanied by a decrease in Bcl-2 expression, and a Beclin-1 dissociation. In this study, compound
3h inhibited Akt and p70S6K phosphorylation, which may have promoted Bax-triggered apoptosis through the interaction between Bcl-2 and Bad. In addition, Bcl-2 decreased after compound
3h treatment, and more Beclin-1 was dissociated, which led to autophagic death. Our results suggested that compound
3h inhibited PKM2, and induced apoptosis and autophagy in LNCaP cells.


 and
and 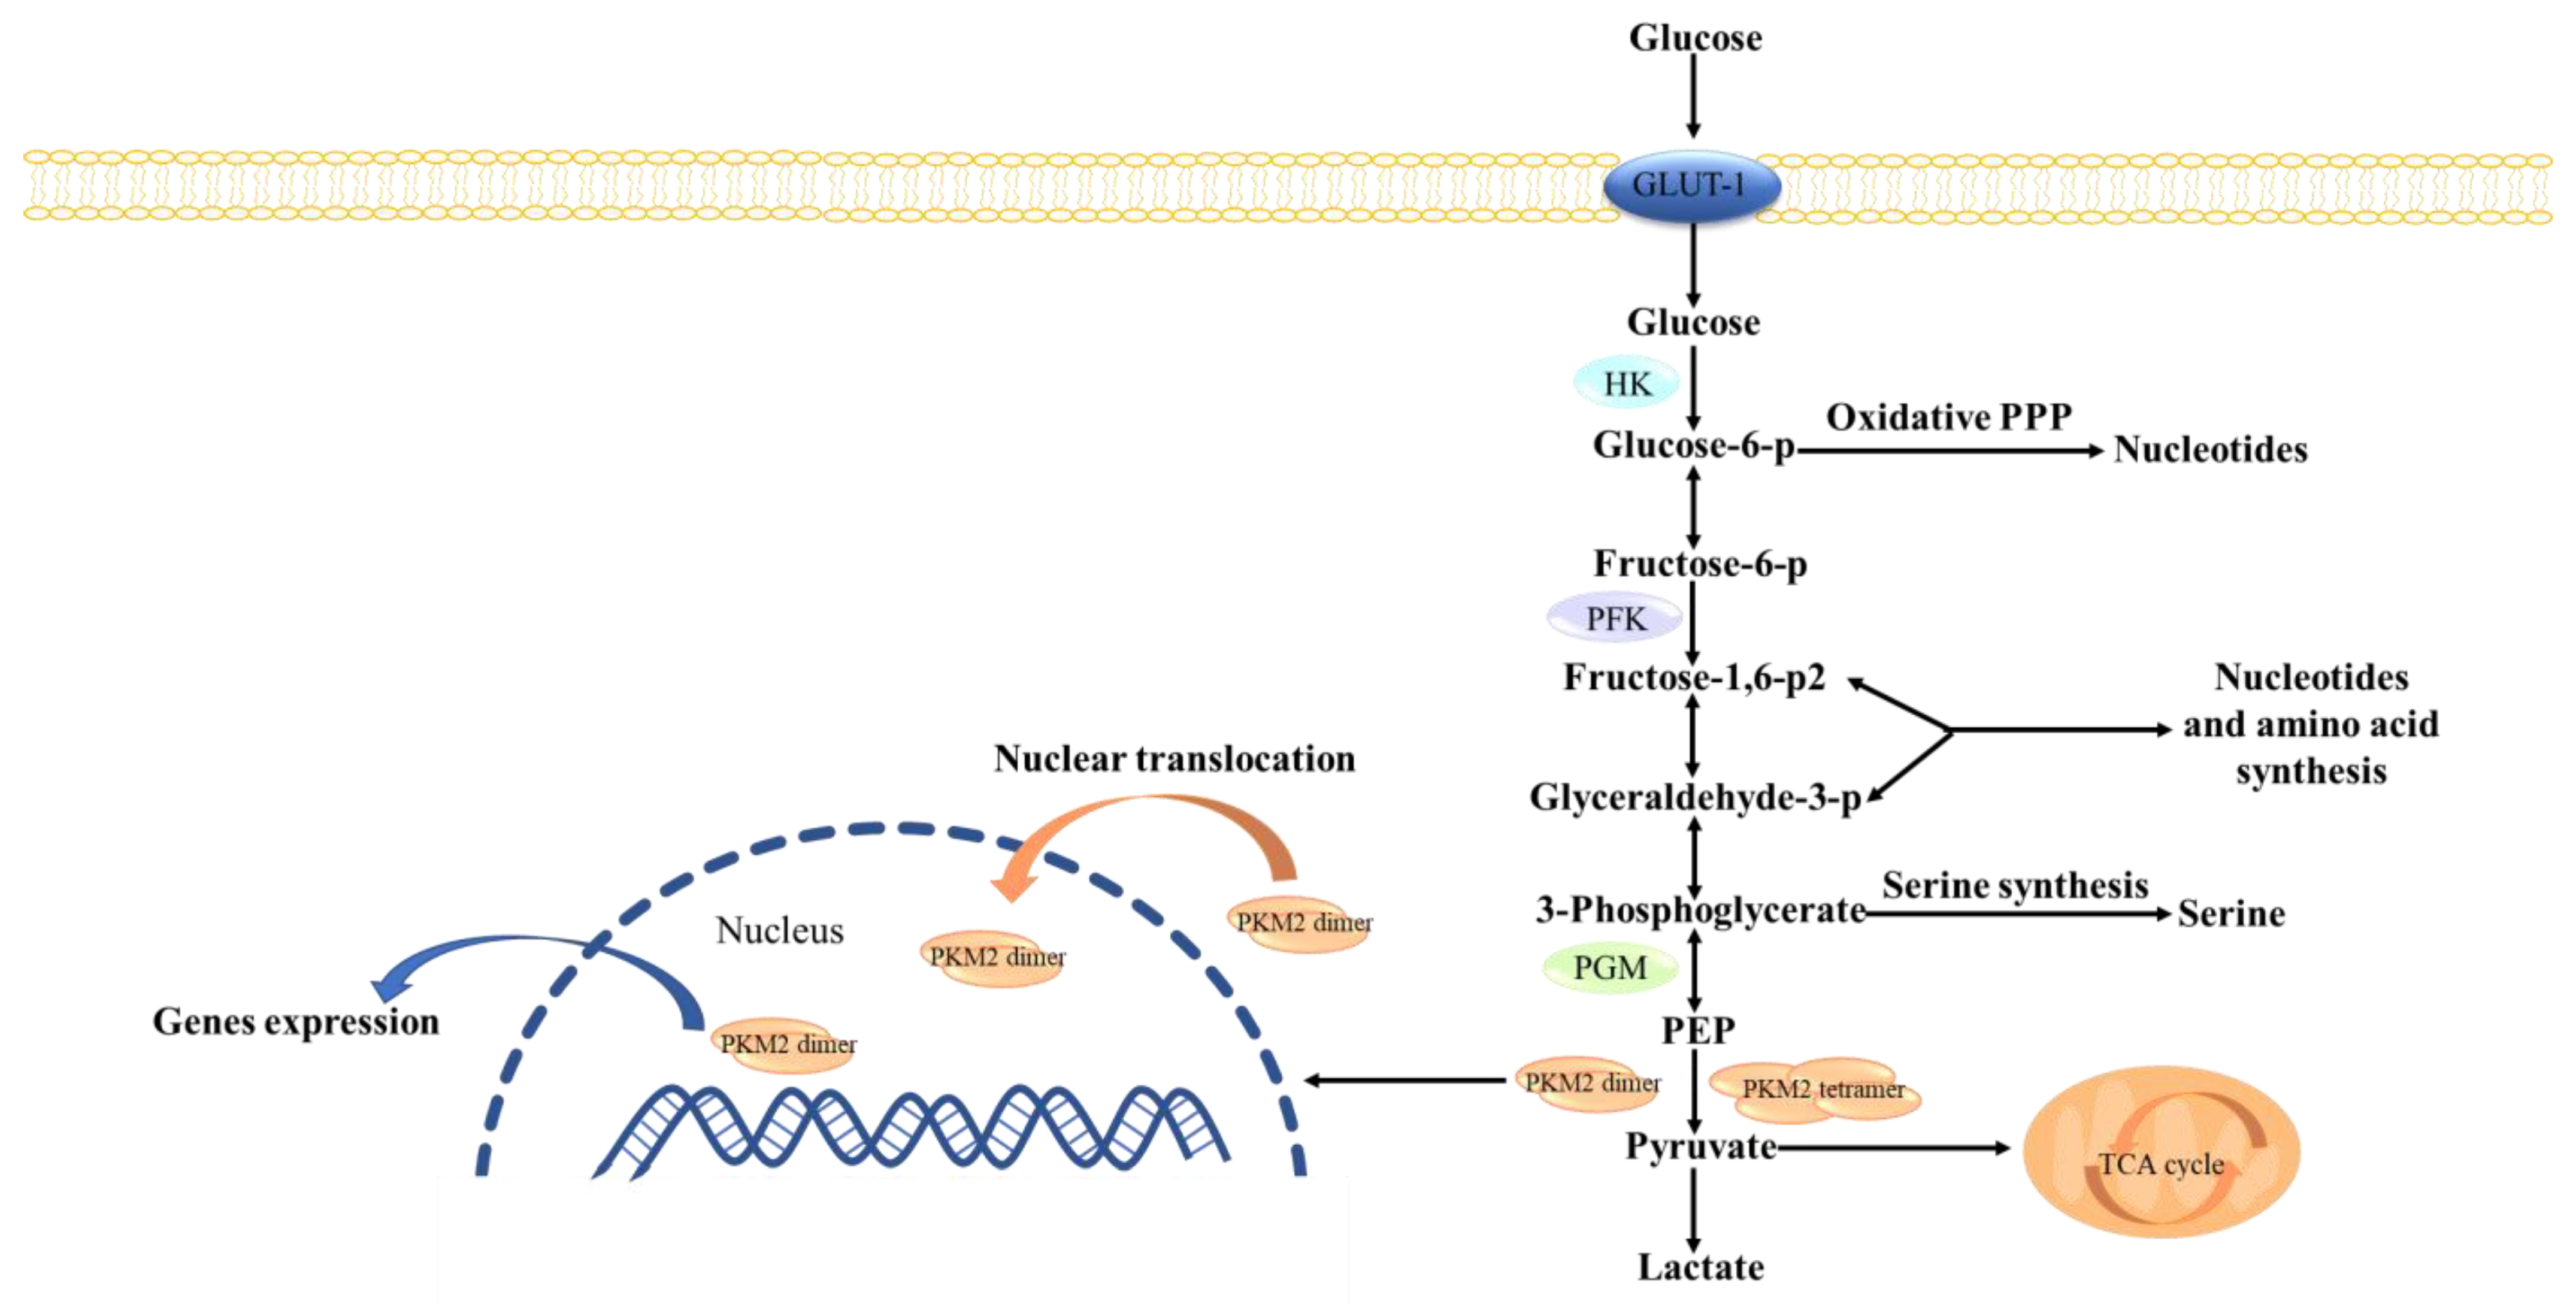


