
Combining TMEM Doorway Score and MenaCalc Score Improves the Prediction of Distant Recurrence Risk in HR+/HER2− Breast Cancer Patients

 , ,
, ,  and
and
Abstract
:Simple Summary
Abstract
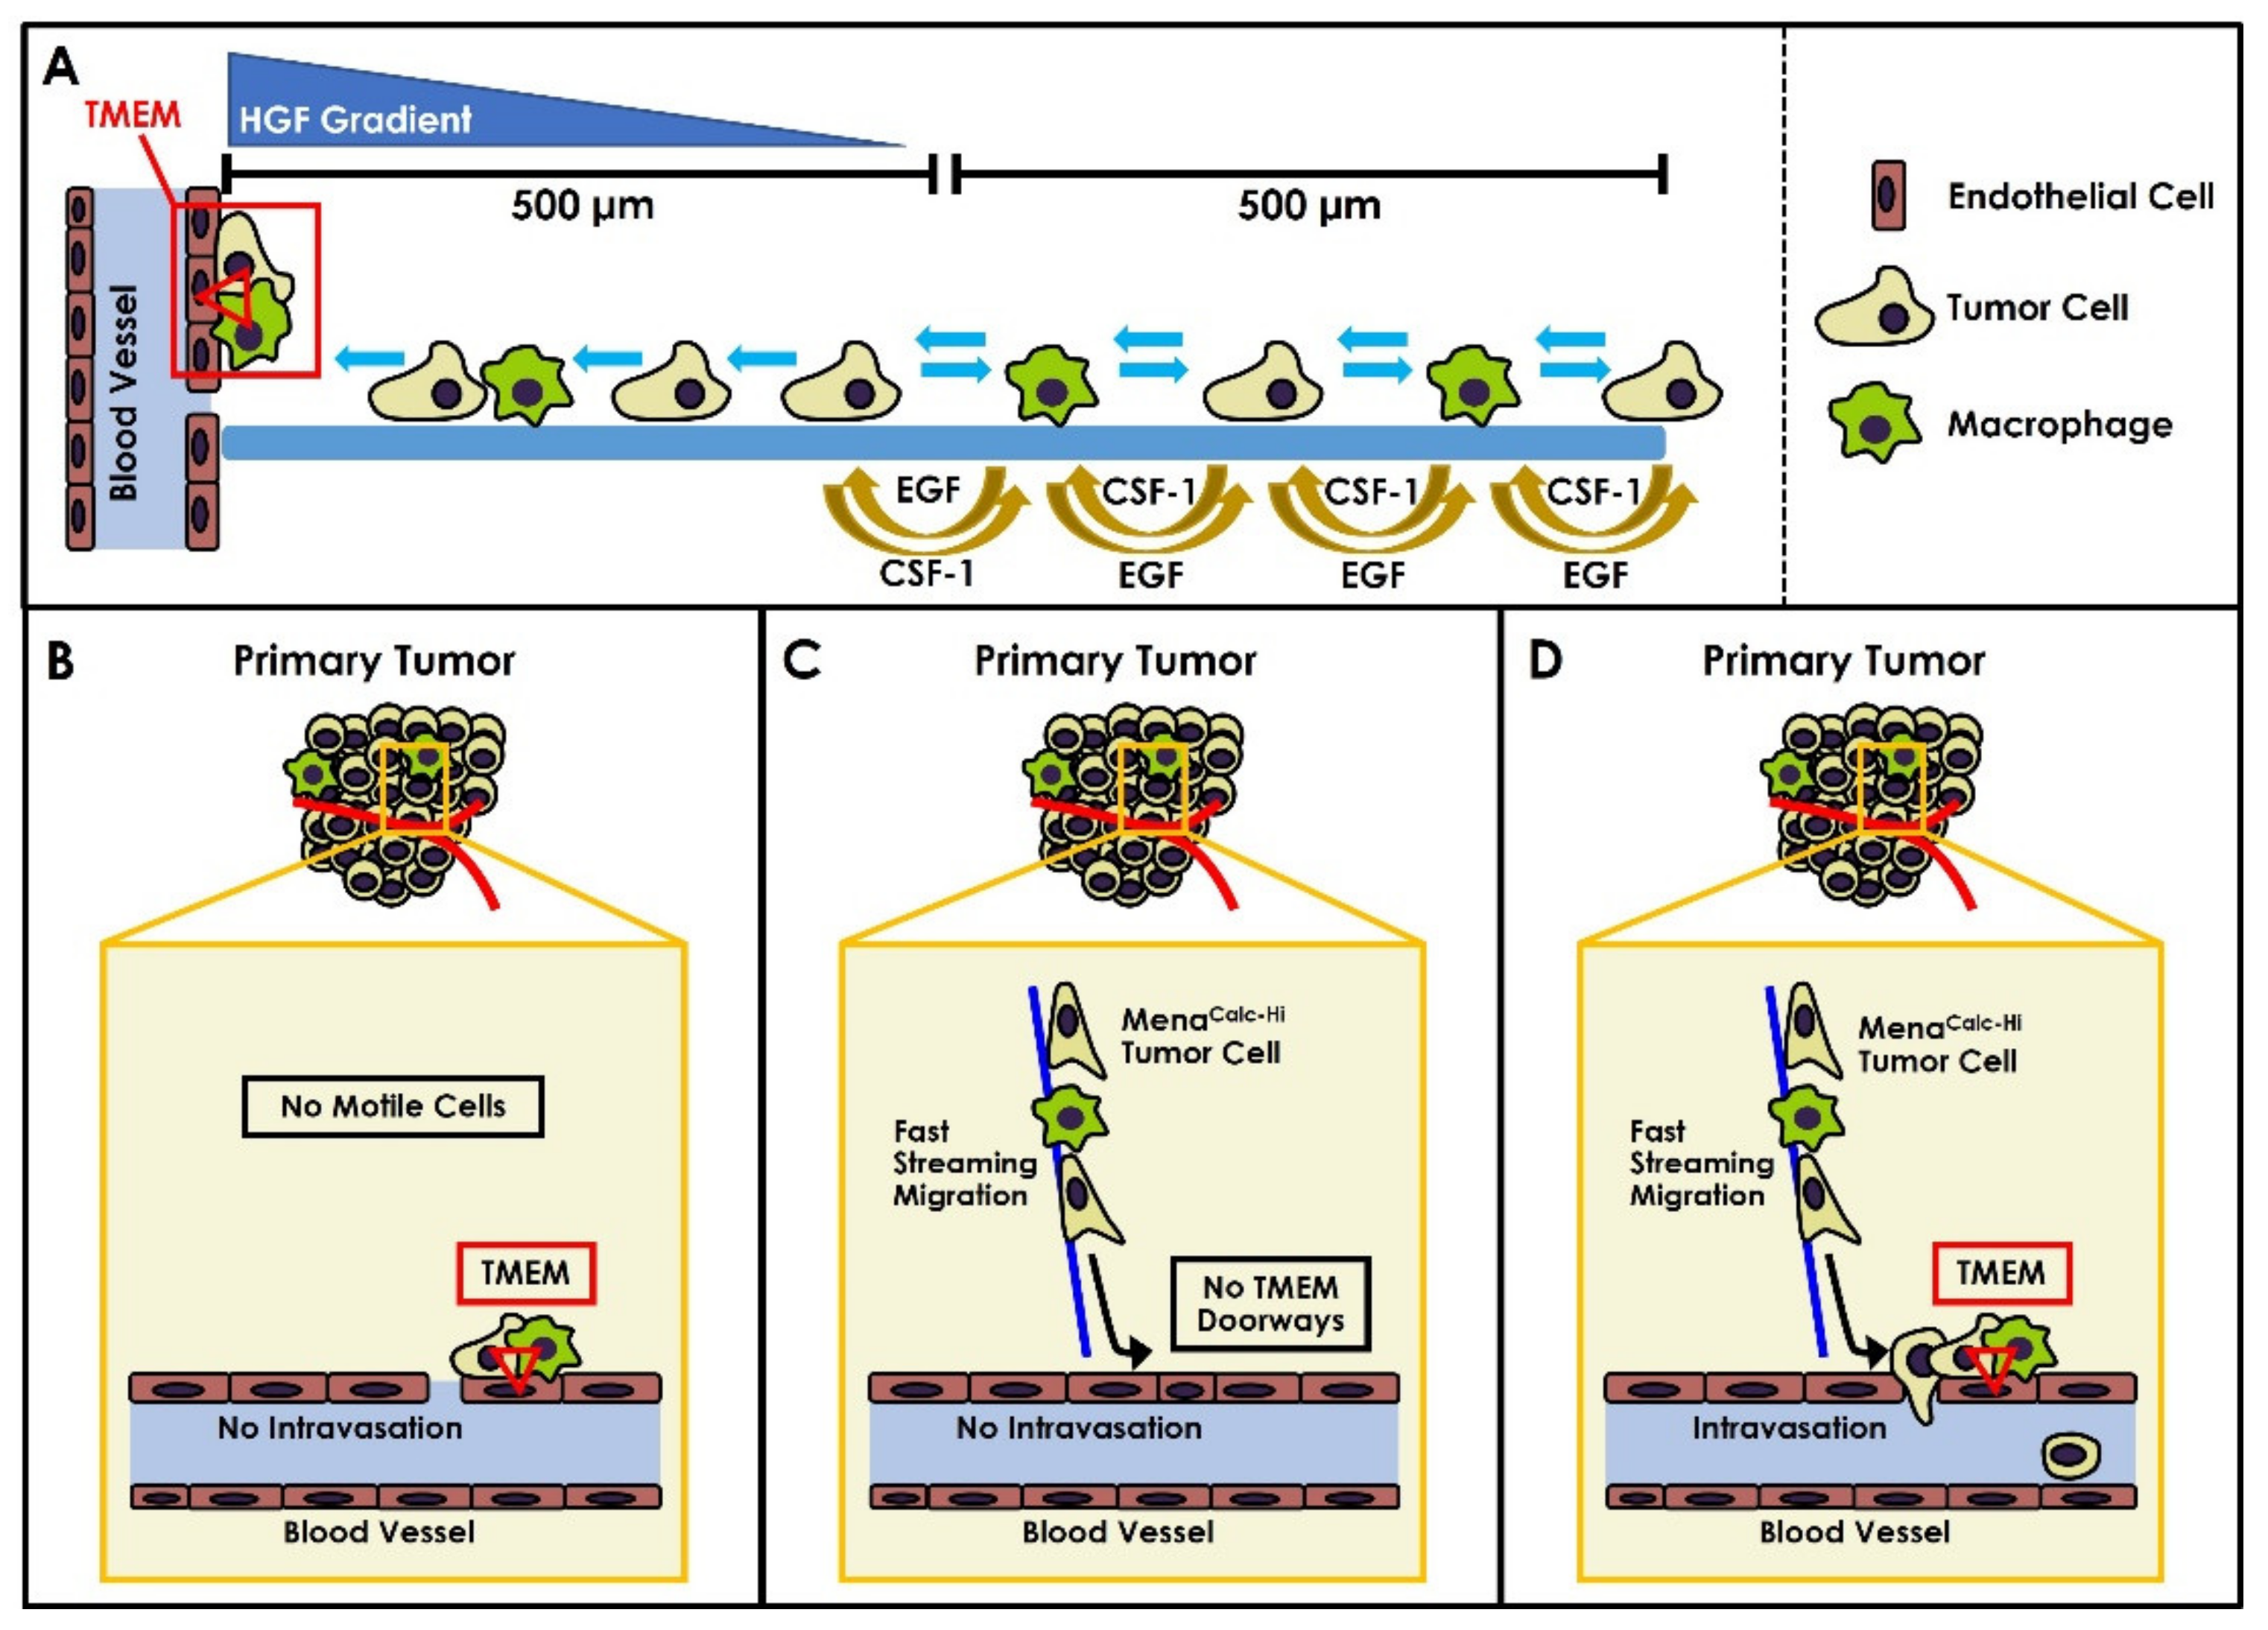
1. Introduction
2. Results
2.1. Methods of Biomarker Combination
2.2. Measurement of Performance
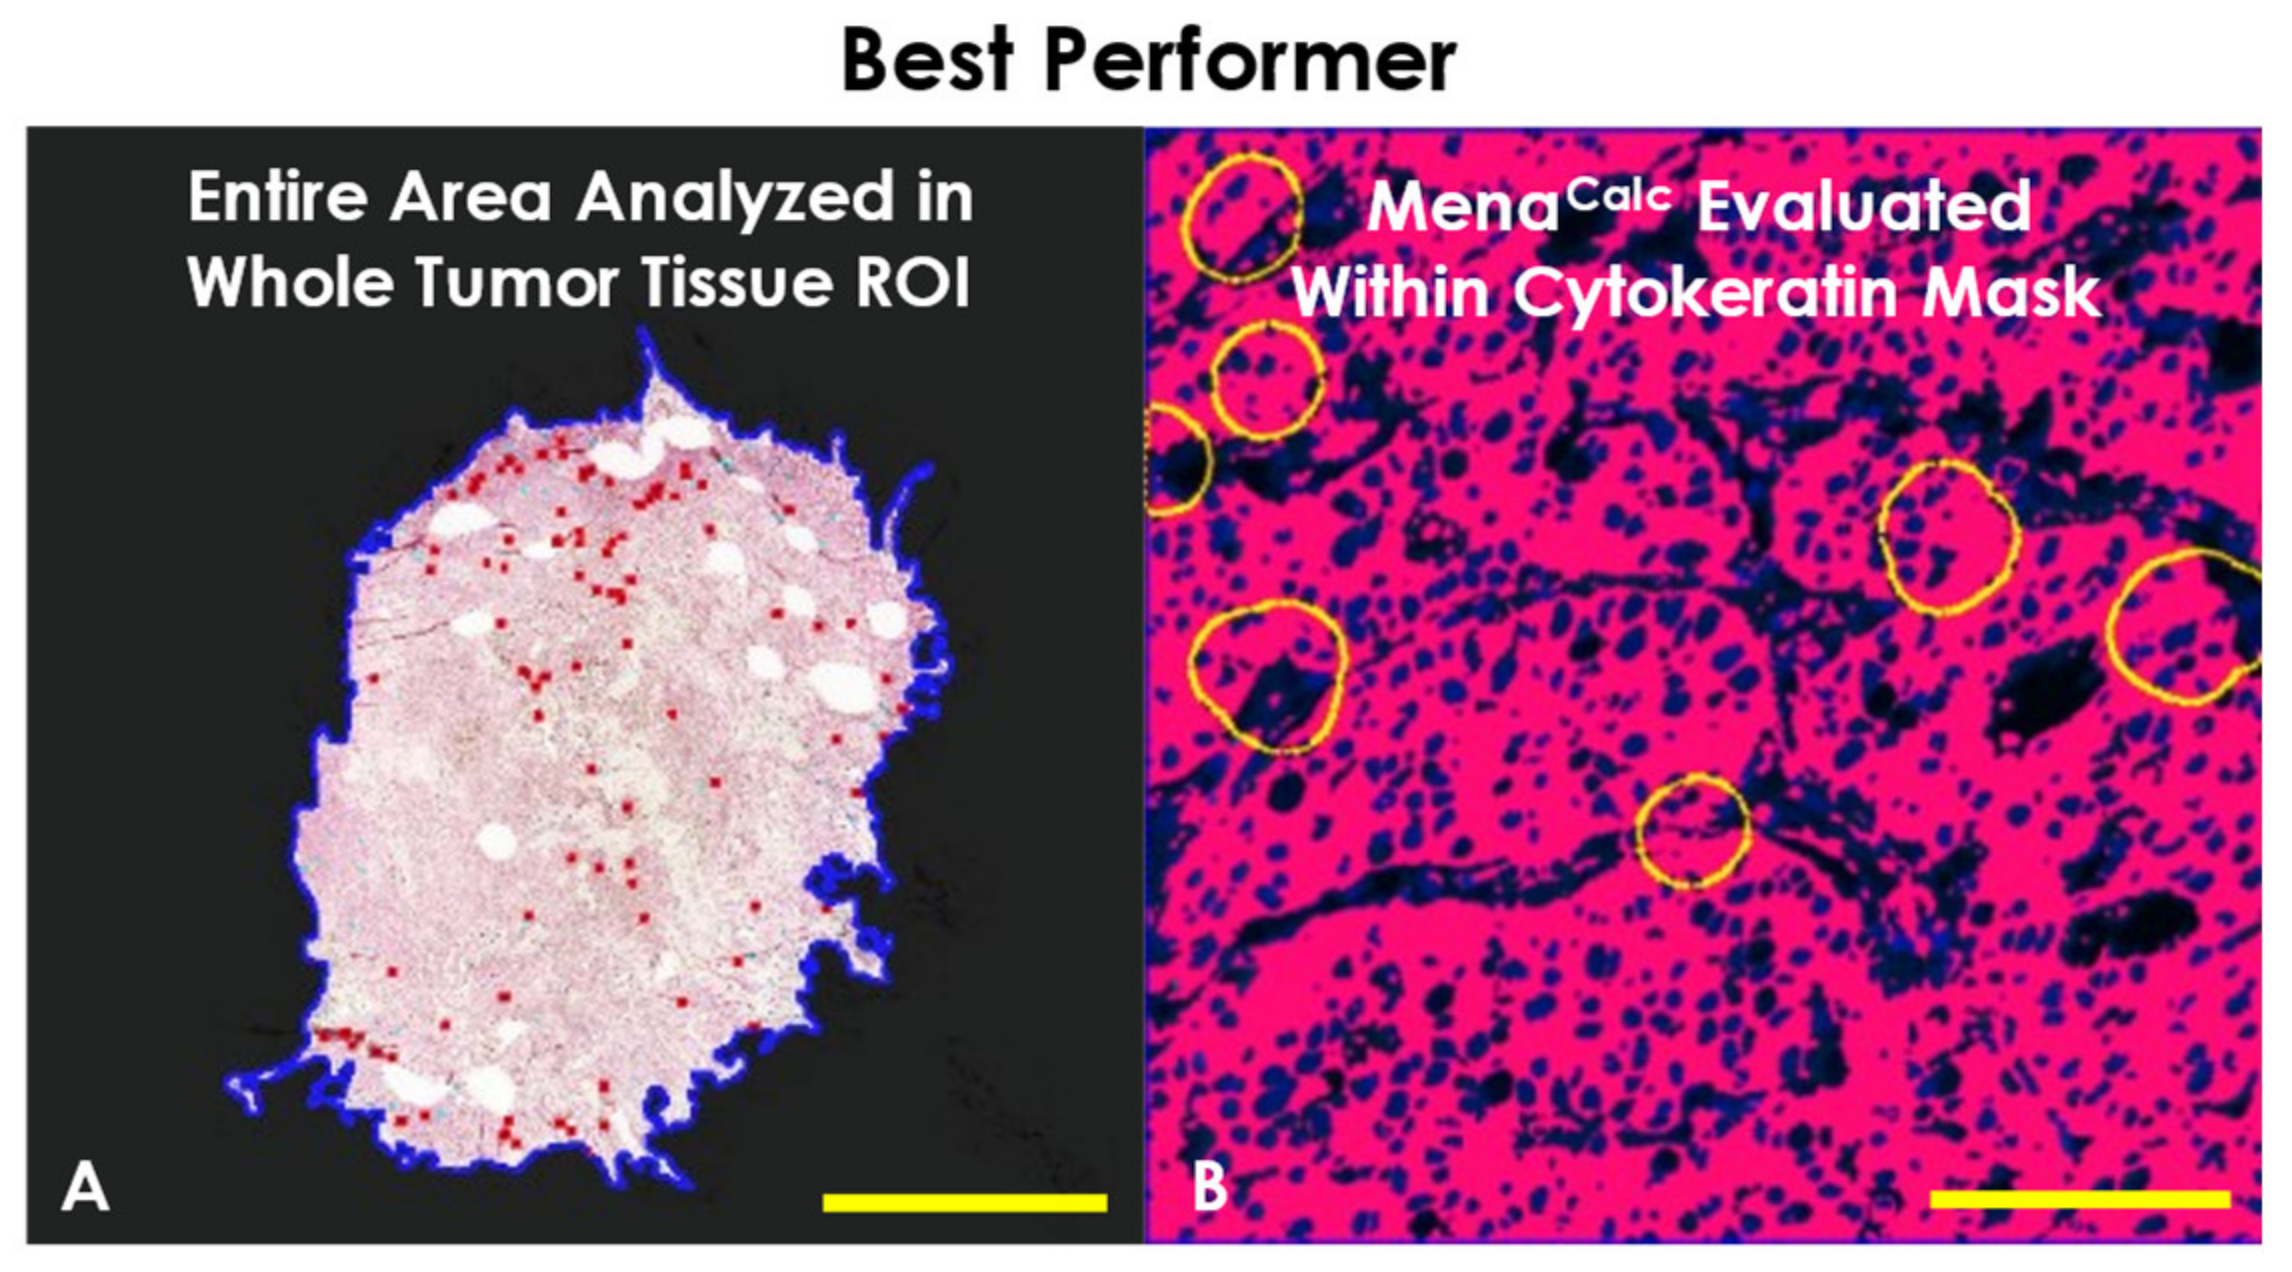
2.3. Determination of Best Performer
3. Discussion
4. Materials and Methods
4.1. Cohort
4.2. IHC Triple Staining

| Full Cohort | Analyzed vs. Not | 15 YR Disease-Free Survival | |||||
|---|---|---|---|---|---|---|---|
| # of Cases | % | Not Analyzed | Analyzed | No Event | Event | ||
| (n = 130) | (n = 44) | (n = 86) | (n = 43) | (n = 43) | |||
| AGE | |||||||
| Range | 37.9–88.1 | ||||||
| Median | 70.1 | ||||||
| <53 | 18 | 13.9 | 6 | 12 | 10 | 2 | |
| ≥53 | 112 | 86.2 | 38 | 74 | 33 | 41 | |
| TUMOUR SIZE | |||||||
| Range | 0.4 cm–13.0 cm | ||||||
| Median | 2 cm | ||||||
| <2 cm | 53 | 40.8 | 14 | 39 | 26 | 13 | |
| ≥2 cm | 73 | 56.2 | 28 | 45 | 17 | 28 | |
| Unknown | 4 | 3.1 | 2 | 2 | 0 | 2 | |
| GRADE | |||||||
| Low (1/2) | 88 | 67.7 | 31 | 57 | 32 | 25 | |
| High (3) | 32 | 24.6 | 8 | 24 | 10 | 14 | |
| Unknown | 10 | 7.7 | 5 | 5 | 1 | 4 | |
| NODE STATUS | |||||||
| Negative | 61 | 46.9 | 20 | 41 | 27 | 14 | |
| Positive | 49 | 37.7 | 16 | 33 | 10 | 23 | |
| Unknown | 20 | 15.4 | 8 | 12 | 6 | 6 | |
| ER STATUS | |||||||
| Negative | 5 | 3.9 | 0 | 5 | 0 | 5 | |
| Positive | 100 | 76.9 | 22 | 78 | 40 | 38 | |
| Unknown | 25 | 19.2 | 22 | 3 | 3 | 0 | |
| PR STATUS | |||||||
| Negative | 12 | 9.2 | 1 | 11 | 3 | 8 | |
| Positive | 87 | 66.9 | 18 | 69 | 34 | 35 | |
| Unknown | 31 | 23.9 | 25 | 6 | 6 | 0 | |
| HER2 STATUS | |||||||
| Negative | 106 | 81.5 | 23 | 83 | 41 | 42 | |
| Positive | 4 | 3.1 | 1 | 3 | 2 | 1 | |
| Unknown | 20 | 15.4 | 20 | 0 | 0 | 0 | |
4.3. Multiplexed Immunofluorescence Staining
4.4. Digital Whole Slide Scanning
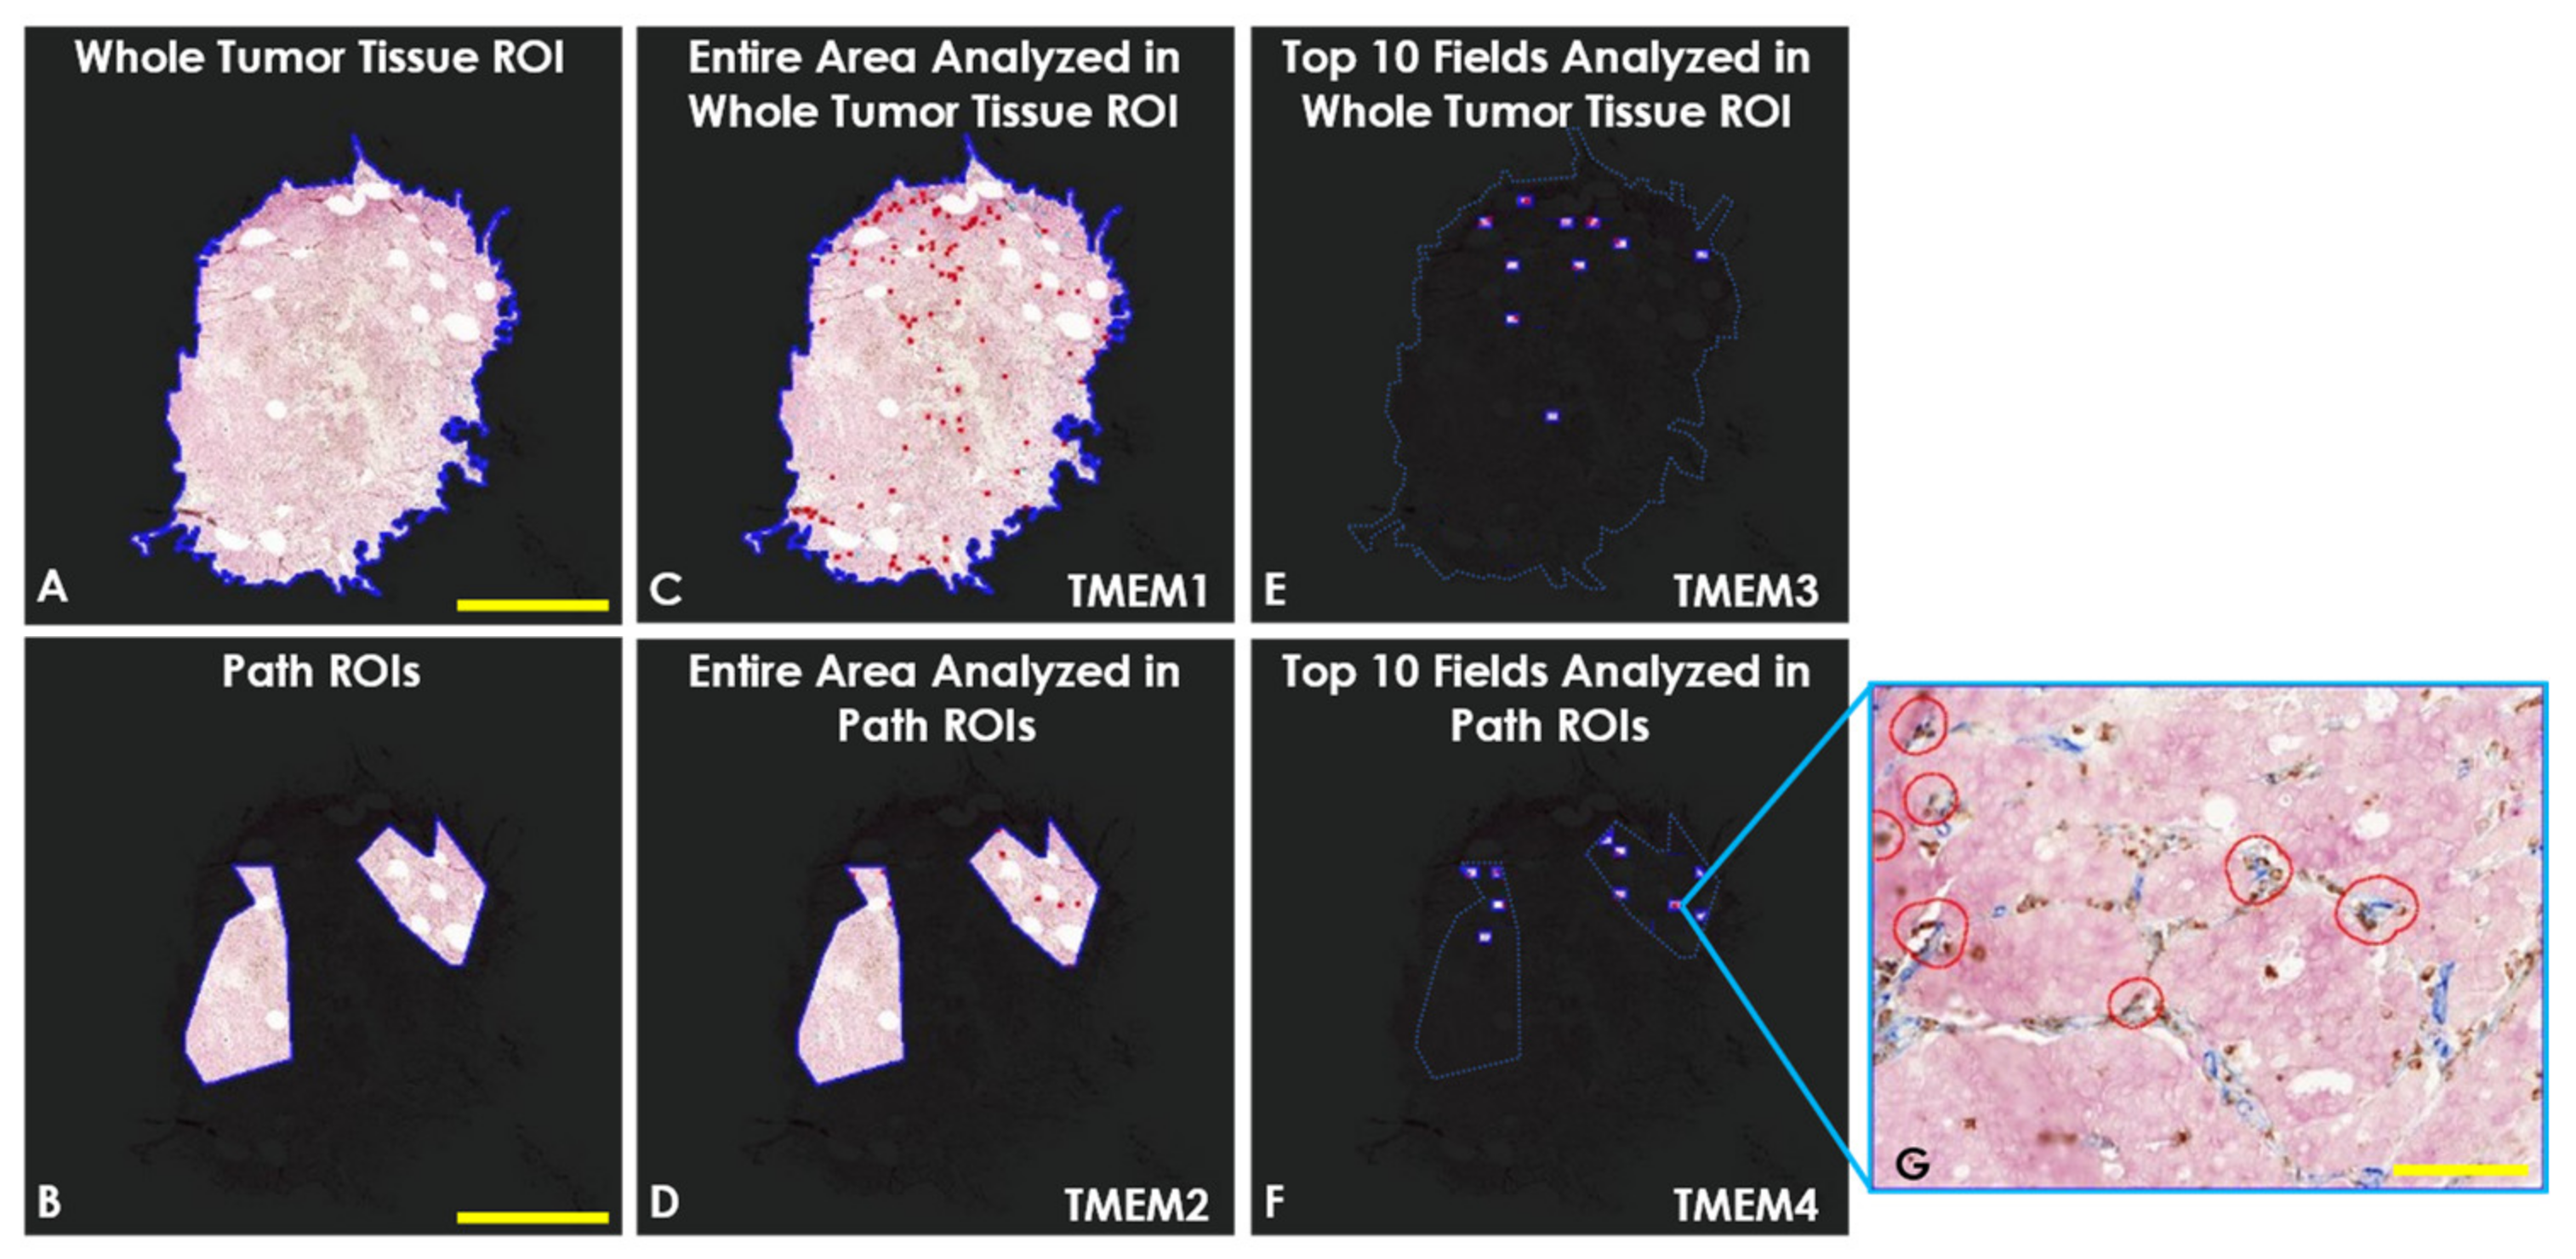
4.5. Automated TMEM Doorway Quantification
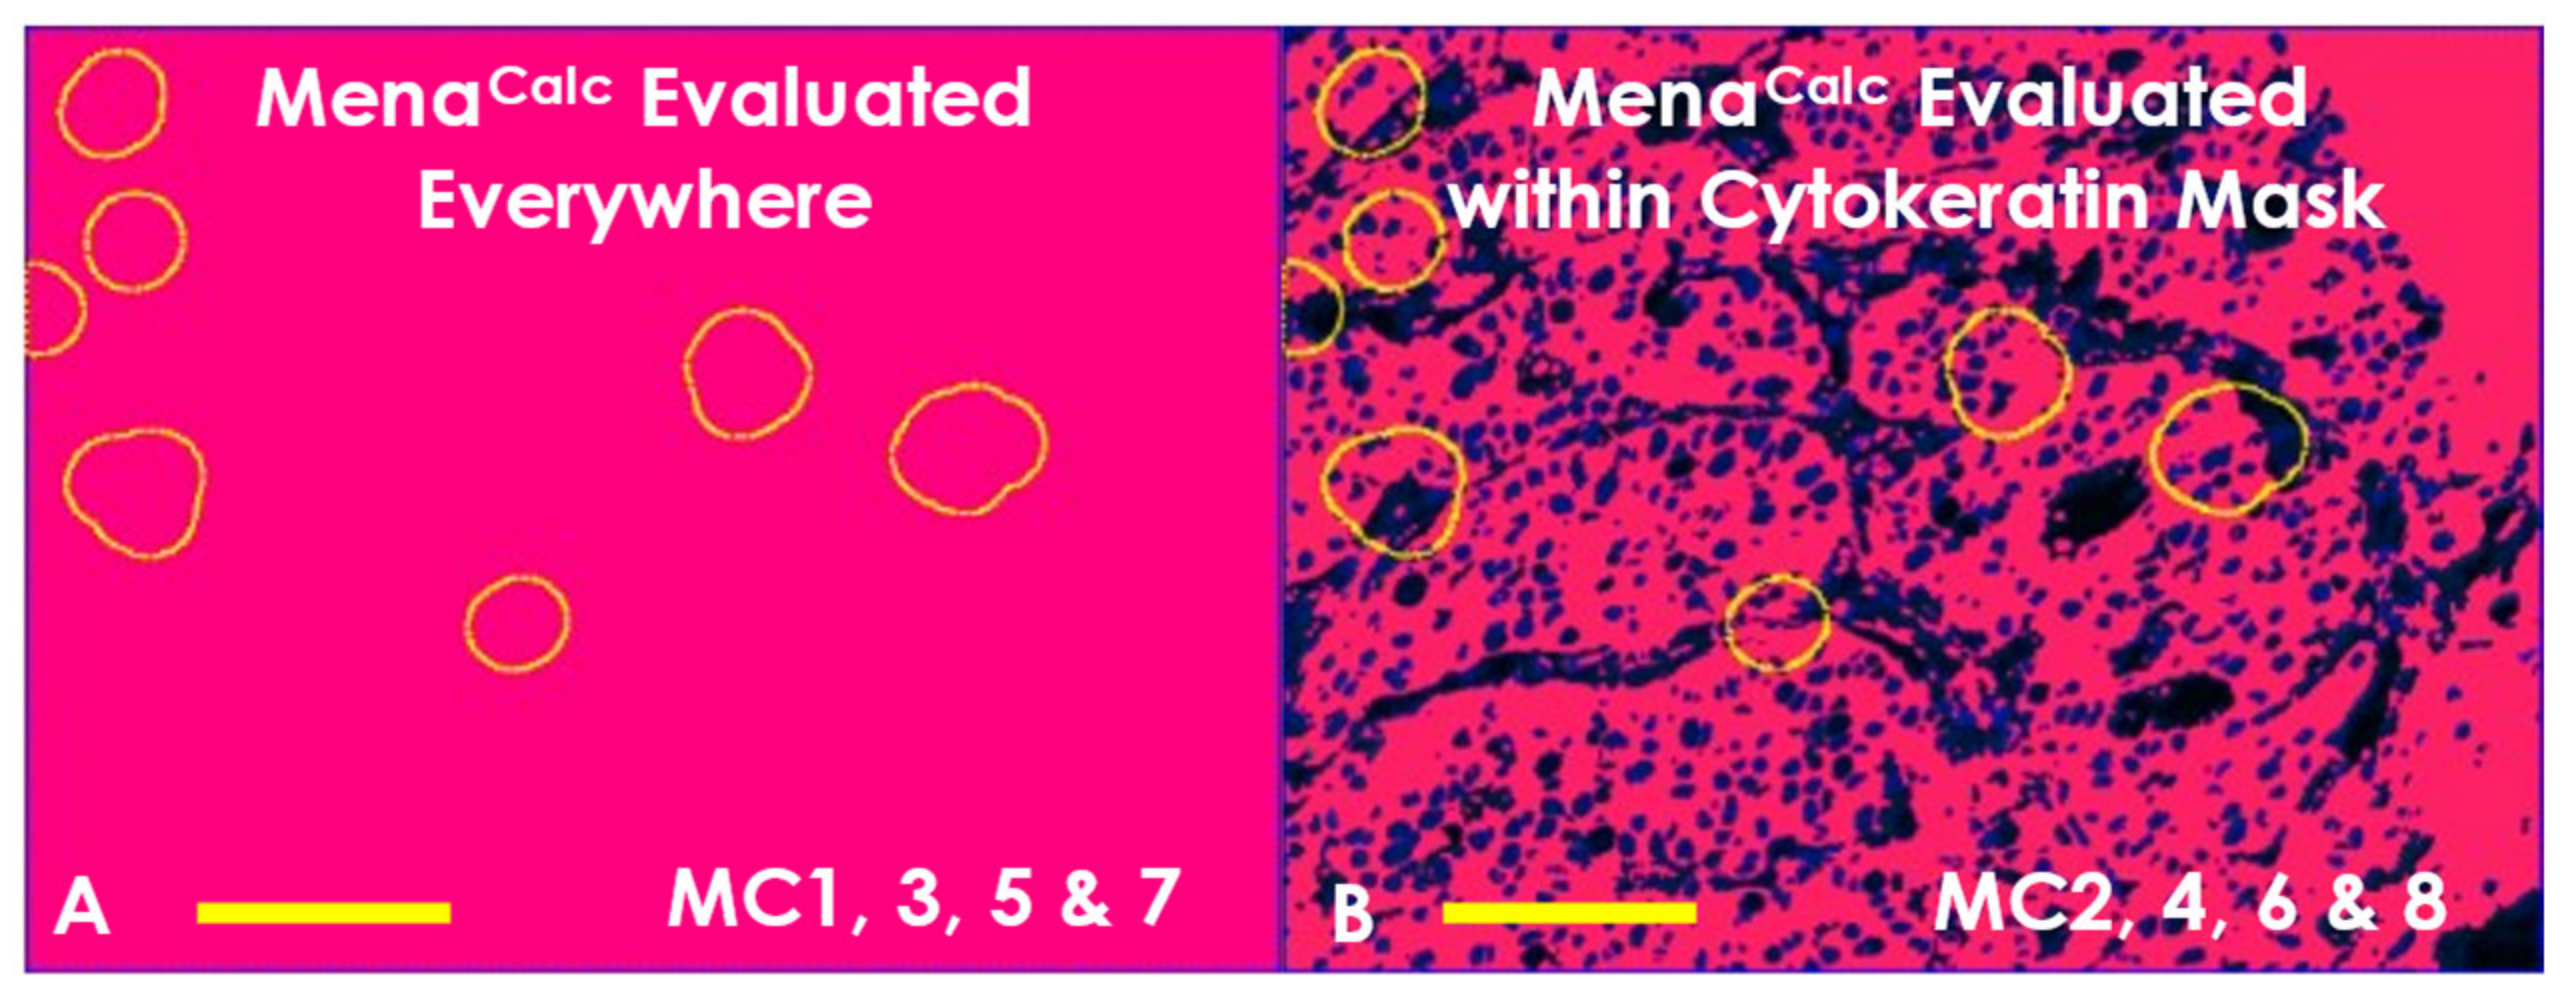
4.6. Automated MenaCalc Quantification
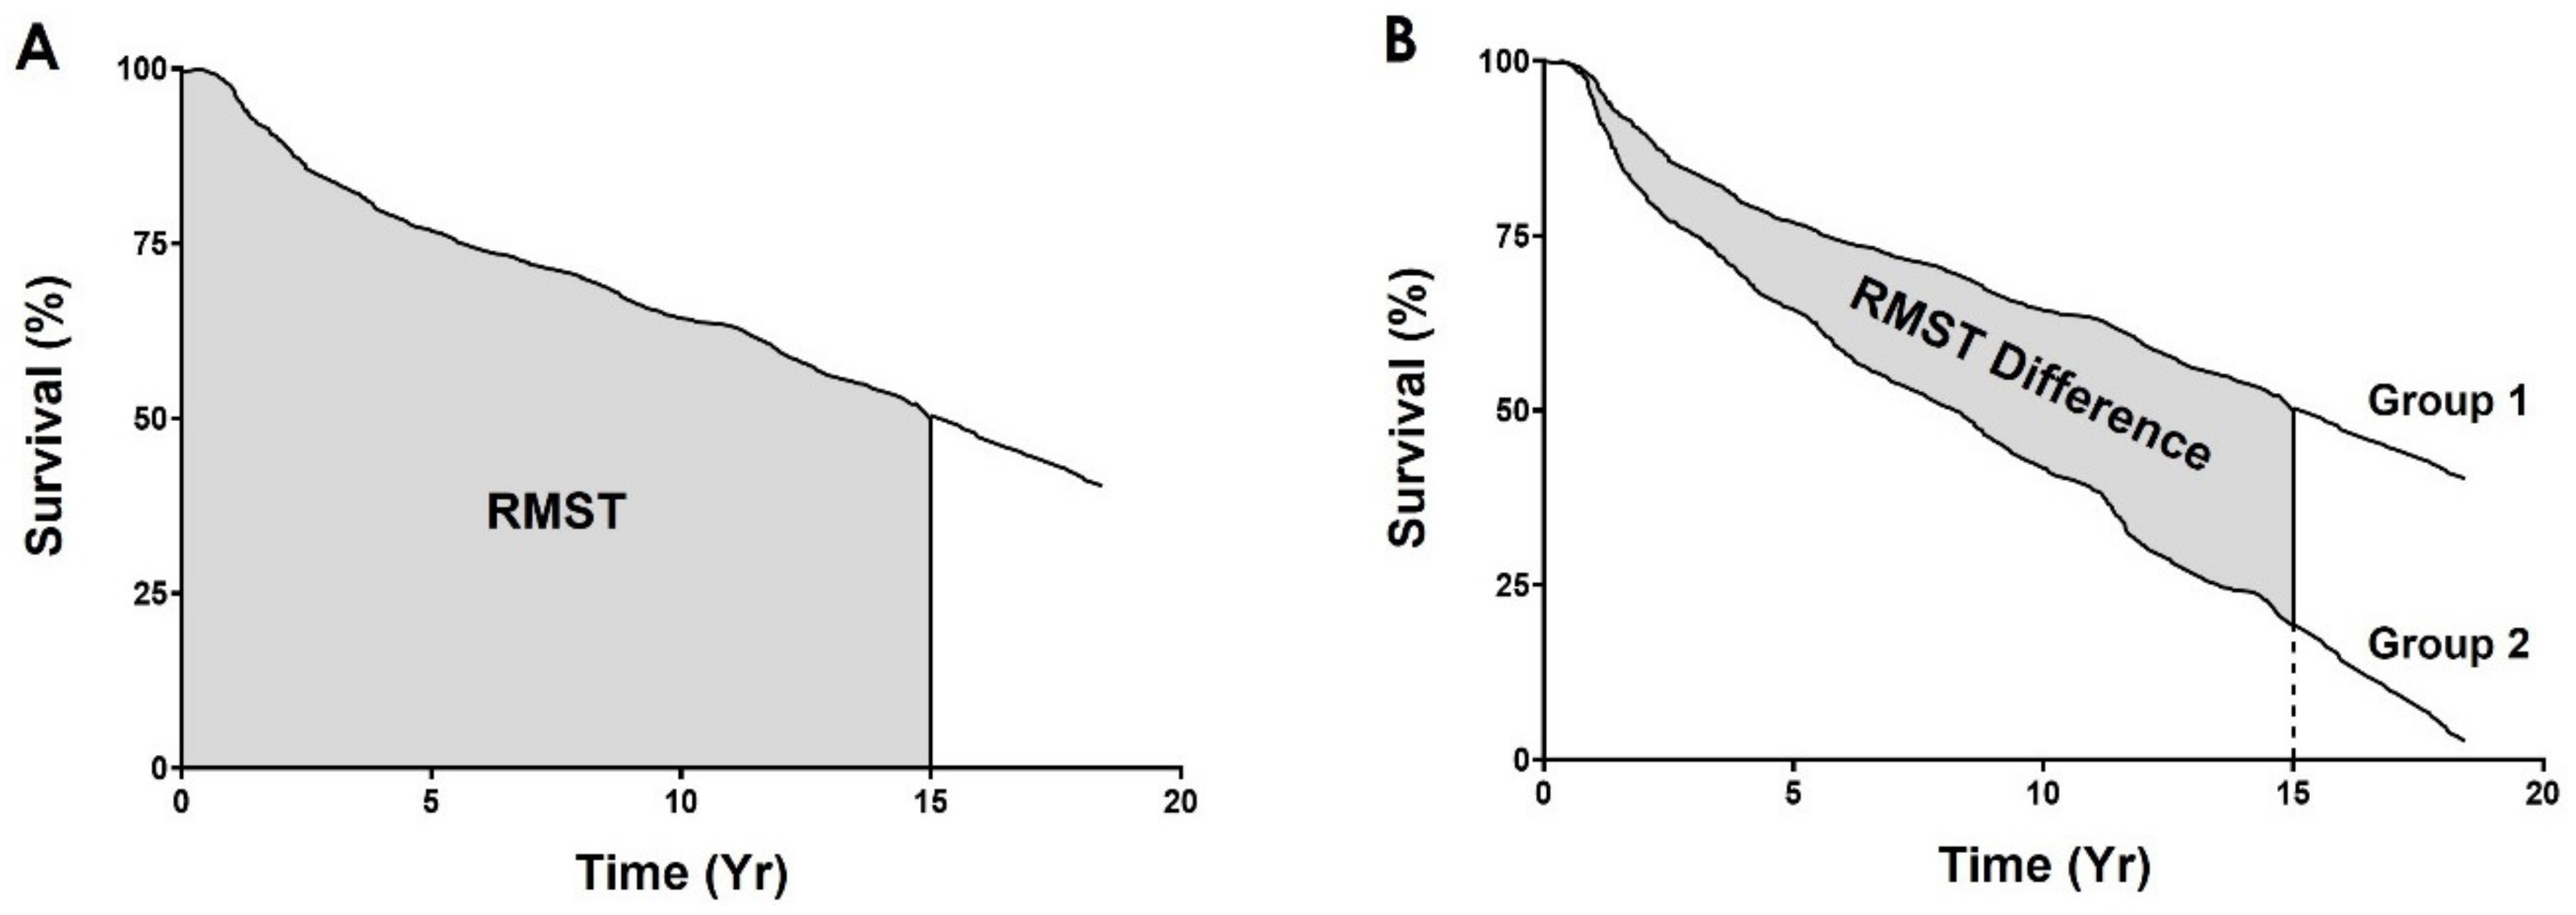
4.7. Statistical and Survival Analysis
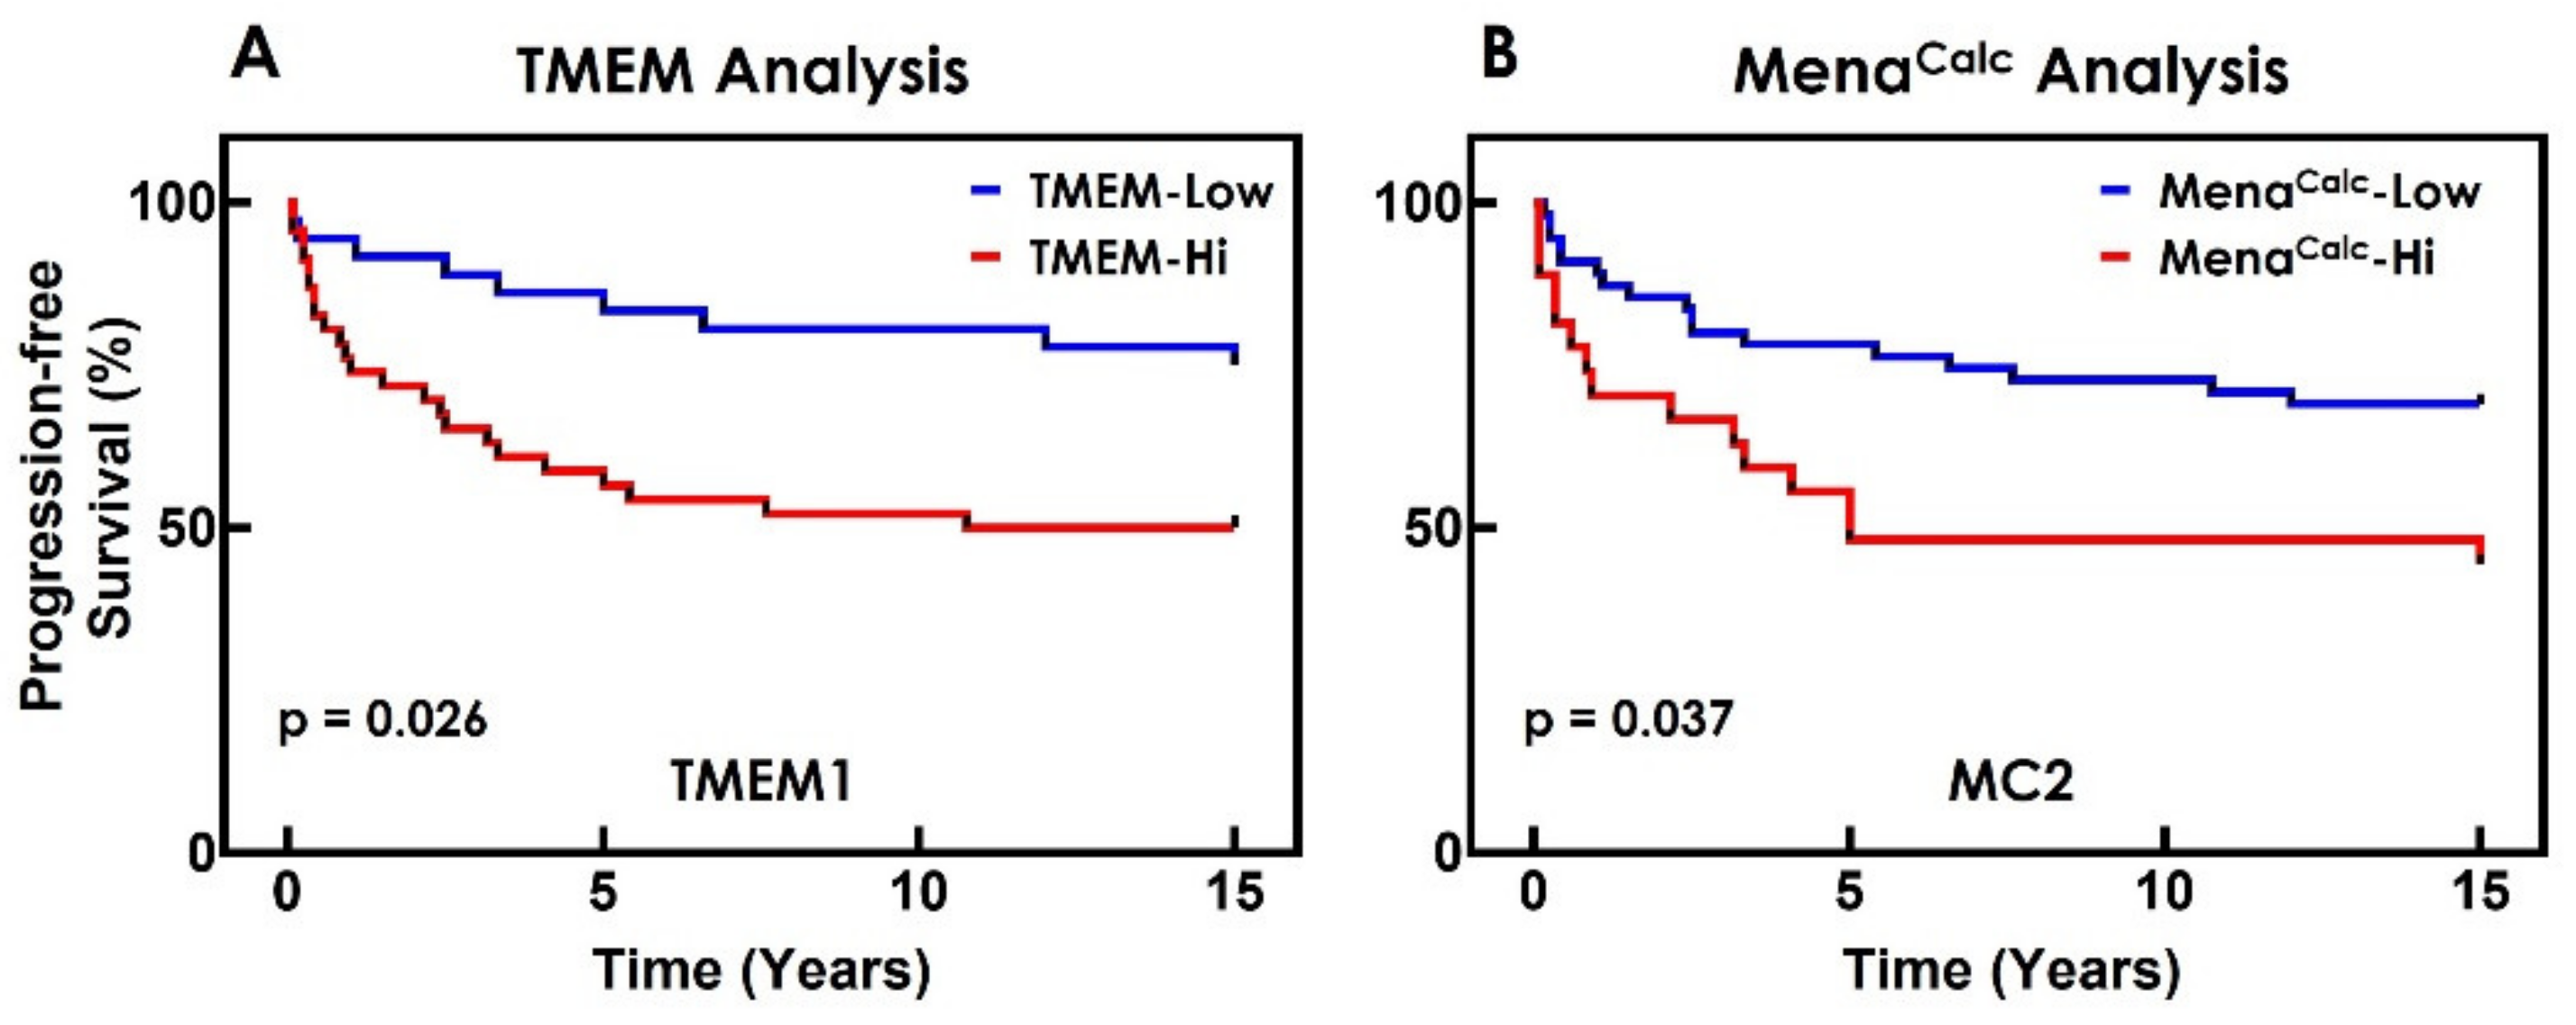
4.8. Standalone TMEM Doorway and MenaCalc Analyses
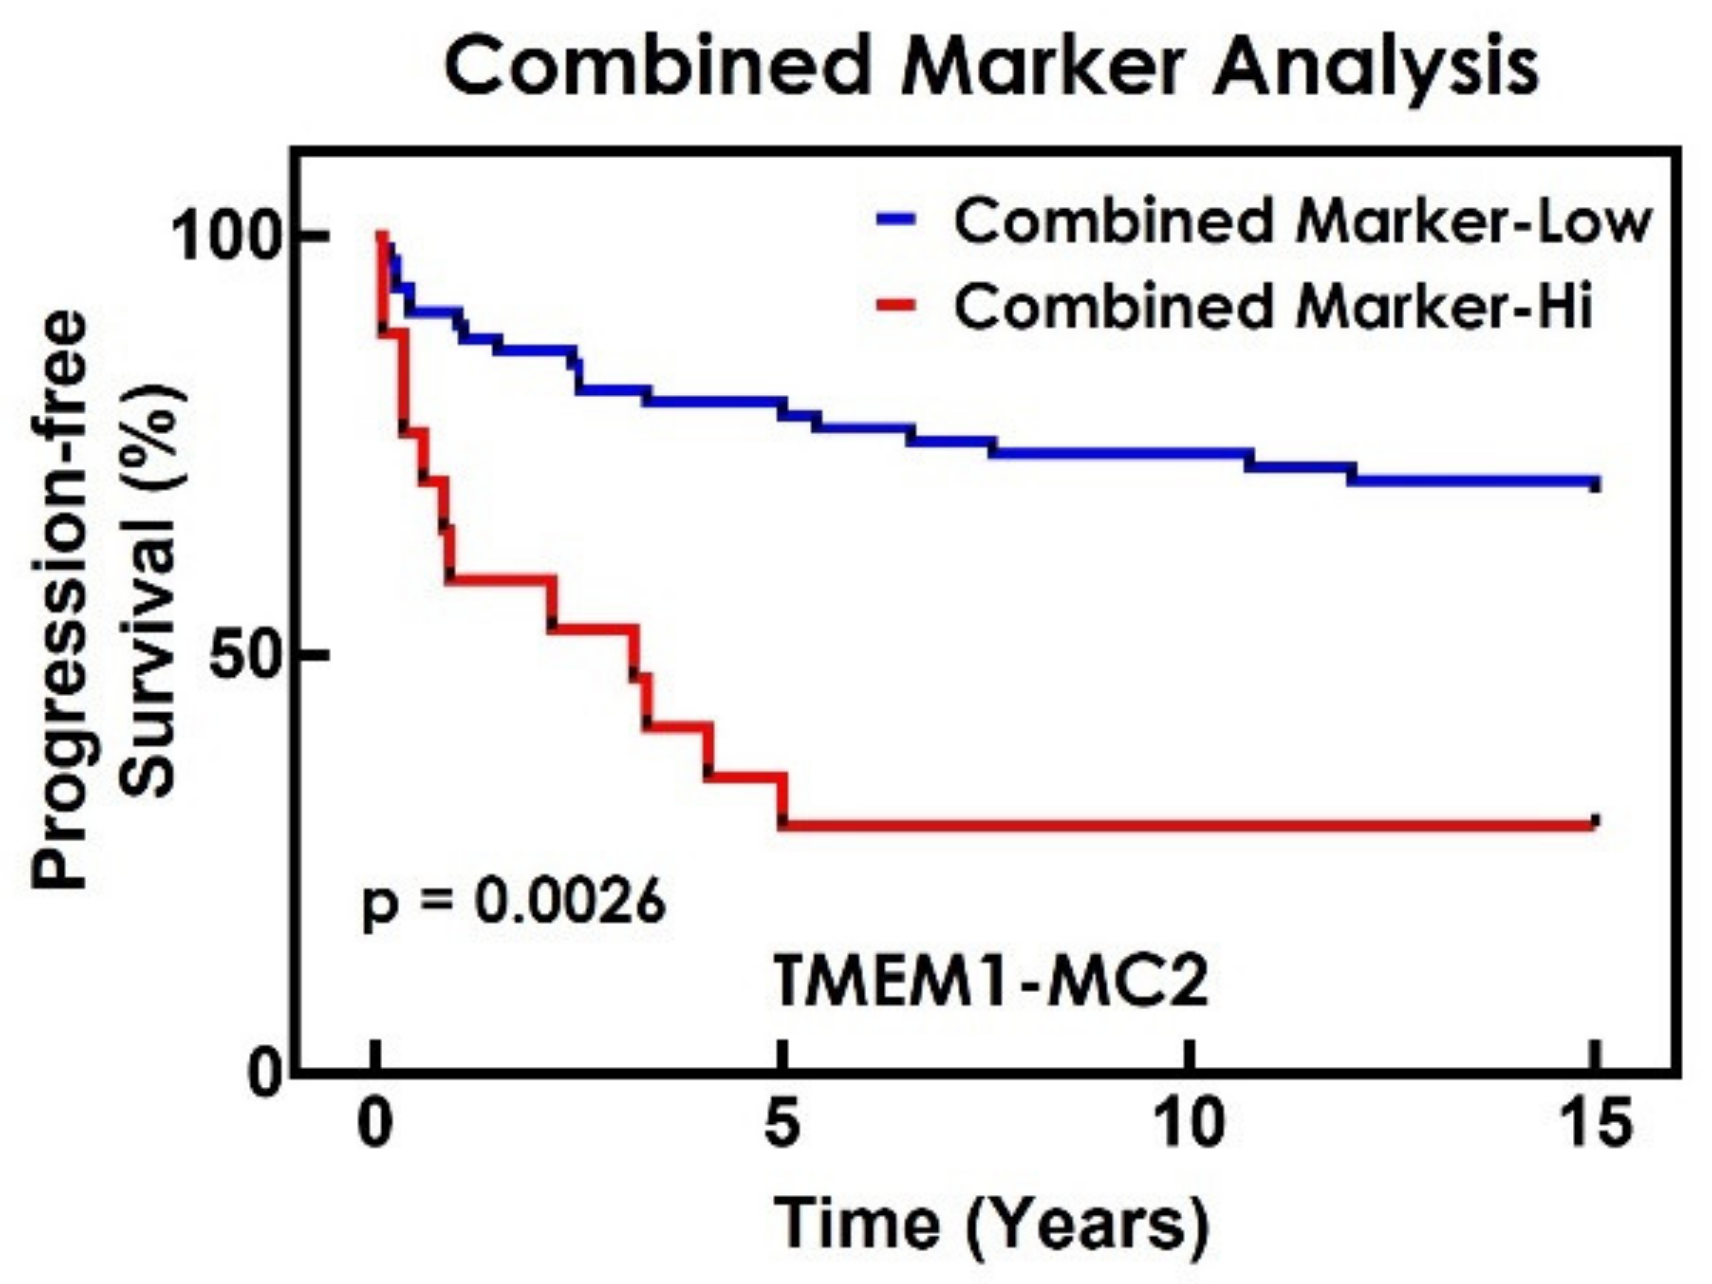
4.9. Combined Marker Analysis
5. Conclusions
Supplementary Materials
Author Contributions
Funding
Institutional Review Board Statement
Informed Consent Statement
Data Availability Statement
Acknowledgments
Conflicts of Interest
References
- Chaffer, C.L.; Weinberg, R.A. A perspective on cancer cell metastasis. Science 2011, 331, 1559–1564. [Google Scholar] [CrossRef] [PubMed]
- Weigelt, B.; Peterse, J.L.; van’t Veer, L.J. Breast cancer metastasis: Markers and models. Nat. Rev. Cancer 2005, 5, 591–602. [Google Scholar] [CrossRef] [PubMed]
- Sparano, J.A.; Fazzari, M.; Kenny, P.A. Clinical application of gene expression profiling in breast cancer. Surg. Oncol. Clin. N. Am. 2010, 19, 581–606. [Google Scholar] [CrossRef] [PubMed]
- Rohan, T.E.; Xue, X.; Lin, H.M.; D’Alfonso, T.M.; Ginter, P.S.; Oktay, M.H.; Robinson, B.D.; Ginsberg, M.; Gertler, F.B.; Glass, A.G.; et al. Tumor microenvironment of metastasis and risk of distant metastasis of breast cancer. J. Natl. Cancer Inst. 2014, 106, dju136. [Google Scholar] [CrossRef] [Green Version]
- Entenberg, D.; Oktay, M.H.; D’Alfonso, T.; Ginter, P.S.; Robinson, B.D.; Xue, X.; Rohan, T.E.; Sparano, J.A.; Jones, J.G.; Condeelis, J.S. Validation of an Automated Quantitative Digital Pathology Approach for Scoring TMEM, a Prognostic Biomarker for Metastasis. Cancers 2020, 12, 846. [Google Scholar] [CrossRef] [Green Version]
- Harney, A.S.; Arwert, E.N.; Entenberg, D.; Wang, Y.; Guo, P.; Qian, B.Z.; Oktay, M.H.; Pollard, J.W.; Jones, J.G.; Condeelis, J.S. Real-Time Imaging Reveals Local, Transient Vascular Permeability, and Tumor Cell Intravasation Stimulated by TIE2hi Macrophage-Derived VEGFA. Cancer Discov. 2015, 5, 932–943. [Google Scholar] [CrossRef] [Green Version]
- Wyckoff, J.B.; Wang, Y.; Lin, E.Y.; Li, J.F.; Goswami, S.; Stanley, E.R.; Segall, J.E.; Pollard, J.W.; Condeelis, J. Direct visualization of macrophage-assisted tumor cell intravasation in mammary tumors. Cancer Res. 2007, 67, 2649–2656. [Google Scholar] [CrossRef] [Green Version]
- Robinson, B.D.; Sica, G.L.; Liu, Y.F.; Rohan, T.E.; Gertler, F.B.; Condeelis, J.S.; Jones, J.G. Tumor microenvironment of metastasis in human breast carcinoma: A potential prognostic marker linked to hematogenous dissemination. Clin. Cancer Res. 2009, 15, 2433–2441. [Google Scholar] [CrossRef] [Green Version]
- Cuzick, J.; Dowsett, M.; Pineda, S.; Wale, C.; Salter, J.; Quinn, E.; Zabaglo, L.; Mallon, E.; Green, A.R.; Ellis, I.O.; et al. Prognostic value of a combined estrogen receptor, progesterone receptor, Ki-67, and human epidermal growth factor receptor 2 immunohistochemical score and comparison with the Genomic Health recurrence score in early breast cancer. J. Clin. Oncol. 2011, 29, 4273–4278. [Google Scholar] [CrossRef] [Green Version]
- Sparano, J.A.; Gray, R.; Oktay, M.H.; Entenberg, D.; Rohan, T.; Xue, X.; Donovan, M.; Peterson, M.; Shuber, A.; Hamilton, D.A.; et al. A metastasis biomarker (MetaSite Breast Score) is associated with distant recurrence in hormone receptor-positive, HER2-negative early-stage breast cancer. NPJ Breast Cancer 2017, 3, 42. [Google Scholar] [CrossRef] [Green Version]
- Wyckoff, J.B.; Segall, J.E.; Condeelis, J.S. The collection of the motile population of cells from a living tumor. Cancer Res. 2000, 60, 5401–5404. [Google Scholar]
- Wyckoff, J.; Gligorijevic, B.; Entenberg, D.; Segall, J.; Condeelis, J. The in vivo invasion assay: Preparation and handling of collection needles. Cold Spring Harb Protoc. 2011, 2011, 1232–1234. [Google Scholar] [CrossRef] [Green Version]
- Wyckoff, J.; Wang, W.; Lin, E.Y.; Wang, Y.; Pixley, F.; Stanley, E.R.; Graf, T.; Pollard, J.W.; Segall, J.; Condeelis, J. A paracrine loop between tumor cells and macrophages is required for tumor cell migration in mammary tumors. Cancer Res. 2004, 64, 7022–7029. [Google Scholar] [CrossRef] [Green Version]
- Leung, E.; Xue, A.; Wang, Y.; Rougerie, P.; Sharma, V.P.; Eddy, R.; Cox, D.; Condeelis, J. Blood vessel endothelium-directed tumor cell streaming in breast tumors requires the HGF/C-Met signaling pathway. Oncogene 2017, 36, 2680–2692. [Google Scholar] [CrossRef]
- Philippar, U.; Roussos, E.T.; Oser, M.; Yamaguchi, H.; Kim, H.D.; Giampieri, S.; Wang, Y.; Goswami, S.; Wyckoff, J.B.; Lauffenburger, D.A.; et al. A Mena invasion isoform potentiates EGF-induced carcinoma cell invasion and metastasis. Dev. Cell 2008, 15, 813–828. [Google Scholar] [CrossRef] [Green Version]
- Roussos, E.T.; Balsamo, M.; Alford, S.K.; Wyckoff, J.B.; Gligorijevic, B.; Wang, Y.; Pozzuto, M.; Stobezki, R.; Goswami, S.; Segall, J.E.; et al. Mena invasive (MenaINV) promotes multicellular streaming motility and transendothelial migration in a mouse model of breast cancer. J. Cell Sci. 2011, 124, 2120–2131. [Google Scholar] [CrossRef] [Green Version]
- Roussos, E.T.; Condeelis, J.S.; Patsialou, A. Chemotaxis in cancer. Nat. Rev. Cancer 2011, 11, 573–587. [Google Scholar] [CrossRef]
- Roussos, E.T.; Goswami, S.; Balsamo, M.; Wang, Y.; Stobezki, R.; Adler, E.; Robinson, B.D.; Jones, J.G.; Gertler, F.B.; Condeelis, J.S.; et al. Mena invasive (Mena(INV)) and Mena11a isoforms play distinct roles in breast cancer cell cohesion and association with TMEM. Clin. Exp. Metastasis 2011, 28, 515–527. [Google Scholar] [CrossRef] [Green Version]
- Gertler, F.; Condeelis, J. Metastasis: Tumor cells becoming MENAcing. Trends Cell Biol. 2011, 21, 81–90. [Google Scholar] [CrossRef] [Green Version]
- Eddy, R.J.; Weidmann, M.D.; Sharma, V.P.; Condeelis, J.S. Tumor Cell Invadopodia: Invasive Protrusions that Orchestrate Metastasis. Trends Cell Biol. 2017, 27, 595–607. [Google Scholar] [CrossRef]
- Agarwal, S.; Gertler, F.B.; Balsamo, M.; Condeelis, J.S.; Camp, R.L.; Xue, X.; Lin, J.; Rohan, T.E.; Rimm, D.L. Quantitative assessment of invasive mena isoforms (Menacalc) as an independent prognostic marker in breast cancer. Breast Cancer Res. 2012, 14, R124. [Google Scholar] [CrossRef] [PubMed] [Green Version]
- Forse, C.L.; Agarwal, S.; Pinnaduwage, D.; Gertler, F.; Condeelis, J.S.; Lin, J.; Xue, X.; Johung, K.; Mulligan, A.M.; Rohan, T.E.; et al. Menacalc, a quantitative method of metastasis assessment, as a prognostic marker for axillary node-negative breast cancer. BMC Cancer 2015, 15, 483. [Google Scholar] [CrossRef] [PubMed] [Green Version]
- Rich, J.T.; Neely, J.G.; Paniello, R.C.; Voelker, C.C.J.; Nussenbaum, B.; Wang, E.W. A practical guide to understanding Kaplan-Meier curves. Otolaryngol. Head Neck Surg. 2010, 143, 331–336. [Google Scholar] [CrossRef] [Green Version]
- Irwin, J.O. The standard error of an estimate of expectation of life, with special reference to expectation of tumourless life in experiments with mice. J. Hyg. 1949, 47, 188–189. [Google Scholar] [CrossRef] [PubMed] [Green Version]
- Karrison, T. Restricted Mean Life With Adjustment for Covariates. J. Am. Stat. Assoc. 1987, 82, 1169–1176. [Google Scholar] [CrossRef]
- Karrison, T.G. Use of Irwin’s restricted mean as an index for comparing survival in different treatment groups—Interpretation and power considerations. Control. Clin. Trials 1997, 18, 151–167. [Google Scholar] [CrossRef]
- Zucker, D.M. Restricted Mean Life with Covariates: Modification and Extension of a Useful Survival Analysis Method. J. Am. Stat. Assoc. 1998, 93, 702–709. [Google Scholar] [CrossRef]
- Royston, P.; Parmar, M.K.B. Restricted mean survival time: An alternative to the hazard ratio for the design and analysis of randomized trials with a time-to-event outcome. BMC Med. Res. Methodol. 2013, 13, 152. [Google Scholar] [CrossRef] [Green Version]
- Uno, H.; Claggett, B.; Tian, L.; Inoue, E.; Gallo, P.; Miyata, T.; Schrag, D.; Takeuchi, M.; Uyama, Y.; Zhao, L.; et al. Moving Beyond the Hazard Ratio in Quantifying the Between-Group Difference in Survival Analysis. J. Clin. Oncol. 2014, 32, 2380–2385. [Google Scholar] [CrossRef]
- Uno, H.; Wittes, J.; Fu, H.; Solomon, S.D.; Claggett, B.; Tian, L.; Cai, T.; Pfeffer, M.A.; Evans, S.R.; Wei, L.-J. Alternatives to Hazard Ratios for Comparing the Efficacy or Safety of Therapies in Noninferiority Studies. Ann. Intern. Med. 2015, 163, 127–134. [Google Scholar] [CrossRef] [Green Version]
- Kim, D.H.; Uno, H.; Wei, L.-J. Restricted Mean Survival Time as a Measure to Interpret Clinical Trial Results. JAMA Cardiol. 2017, 2, 1179–1180. [Google Scholar] [CrossRef]
- McCaw, Z.R.; Yin, G.; Wei, L.-J. Using the Restricted Mean Survival Time Difference as an Alternative to the Hazard Ratio for Analyzing Clinical Cardiovascular Studies. Circulation 2019, 140, 1366–1368. [Google Scholar] [CrossRef]
- Rivano, M.; Cancanelli, L.; Spazio, L.D.; Chiumente, M.; Mengato, D.; Messori, A. Restricted mean survival time as outcome measure in advanced urothelial bladder cancer: Analysis of 4 clinical studies. Immunotherapy 2021, 13, 95–101. [Google Scholar] [CrossRef]
- Zhang, X.H.; Giuliano, M.; Trivedi, M.V.; Schiff, R.; Osborne, C.K. Metastasis dormancy in estrogen receptor-positive breast cancer. Clin. Cancer Res. 2013, 19, 6389–6397. [Google Scholar] [CrossRef] [Green Version]
- Kornaga, E.N.; Klimowicz, A.C.; Guggisberg, N.; Ogilvie, T.; Morris, D.G.; Webster, M.; Magliocco, A.M. A systematic comparison of three commercial estrogen receptor assays in a single clinical outcome breast cancer cohort. Mod. Pathol. 2016, 29, 799–809. [Google Scholar] [CrossRef] [Green Version]
- Feng, X.; Li, H.; Dean, M.; Wilson, H.E.; Kornaga, E.; Enwere, E.K.; Tang, P.; Paterson, A.; Lees-Miller, S.P.; Magliocco, A.M.; et al. Low ATM protein expression in malignant tumor as well as cancer-associated stroma are independent prognostic factors in a retrospective study of early-stage hormone-negative breast cancer. Breast Cancer Res. 2015, 17, 65. [Google Scholar] [CrossRef] [Green Version]
- Sparano, J.A.; Gray, R.J.; Makower, D.F.; Pritchard, K.I.; Albain, K.S.; Hayes, D.F.; Geyer, C.E.; Dees, E.C.; Goetz, M.P.; Olson, J.A.; et al. Adjuvant Chemotherapy Guided by a 21-Gene Expression Assay in Breast Cancer. N. Engl. J. Med. 2018, 379, 111–121. [Google Scholar] [CrossRef] [Green Version]
- Kalinsky, K.; Barlow, W.E.; Gralow, J.R.; Meric-Bernstam, F.; Albain, K.S.; Hayes, D.F.; Lin, N.U.; Perez, E.A.; Goldstein, L.J.; Chia, S.K.L.; et al. 21-Gene Assay to Inform Chemotherapy Benefit in Node-Positive Breast Cancer. N. Engl. J. Med. 2021, 385, 2336–2347. [Google Scholar] [CrossRef]
- Karagiannis, G.S.; Pastoriza, J.M.; Wang, Y.; Harney, A.S.; Entenberg, D.; Pignatelli, J.; Sharma, V.P.; Xue, E.A.; Cheng, E.; D’Alfonso, T.M.; et al. Neoadjuvant chemotherapy induces breast cancer metastasis through a TMEM-mediated mechanism. Sci. Transl. Med. 2017, 9, eaan0026. [Google Scholar] [CrossRef] [Green Version]


| Quantification Parameters | |||
|---|---|---|---|
| Method | ROI Type | Tissue Coverage | Cytokeratin Mask |
| TMEM1 | Whole Tumor Tissue | Entire Area | |
| TMEM2 | Path ROI | Entire Area | |
| TMEM3 | Whole Tumor Tissue | Top 10 Fields | |
| TMEM4 | Path ROI | Top 10 Fields | |
| MC1 | Whole Tumor Tissue | Entire Area | No |
| MC2 | Whole Tumor Tissue | Entire Area | Yes |
| MC3 | Path ROI | Entire Area | No |
| MC4 | Path ROI | Entire Area | Yes |
| MC5 | Whole Tumor Tissue | Top 10 Fields | No |
| MC6 | Whole Tumor Tissue | Top 10 Fields | Yes |
| MC7 | Path ROI | Top 10 Fields | No |
| MC8 | Path ROI | Top 10 Fields | Yes |
| Combined Marker Test Pairs | ||||
|---|---|---|---|---|
| Method | TMEM1 | TMEM2 | TMEM3 | TMEM4 |
| MC1 | TMEM1-MC1 | |||
| MC2 | TMEM1-MC2 | |||
| MC3 | TMEM2-MC3 | |||
| MC4 | TMEM2-MC4 | |||
| MC5 | TMEM3-MC5 | |||
| MC6 | TMEM3-MC6 | |||
| MC7 | TMEM4-MC7 | |||
| MC8 | TMEM4-MC8 | |||
| TMEM RMST Difference | |||||||
| Method | TMEM1 | TMEM2 | TMEM3 | TMEM4 | |||
| Cut Point | 5.16 | 14.51 | 38.08 | 77.95 | |||
| RMST Difference (Yr) | 3.56 (95% CI: 0.95–6.1) | 4.57 (95% CI: 1.73–7.08) | 4 (95% CI: 1.42–6.59) | 3.56 (95% CI: −0.4–7.26) | |||
| MenaCalc RMST Difference | Combined Marker RMST Difference | ||||||
| Method | Cut Point | RMST Difference (Yr) | Method | TMEM1 | TMEM2 | TMEM3 | TMEM4 |
| MC1 | 0.44 | 0.89 (95% CI: −2.61–4.75) | MC1 | NA | |||
| MC2 | 0.02 | 2.94 (95% CI: 0.25–5.87) | MC2 | 5.27 (95% CI: 1.71–8.37) | |||
| MC3 | −0.01 | 2.46 (95% CI: −0.19–5.22) | MC3 | 5.16 (95% CI: 1.68–8.77) | |||
| MC4 | 0.35 | 0.97 (95% CI: −2.91–5.14) | MC4 | NA | |||
| MC5 | −0.31 | 1.06 (95% CI: −1.84–3.88) | MC5 | 4.53 (95% CI: 1.73–7.08) | |||
| MC6 | 0.38 | 5.32 (95% CI: 1.04–8.94) | MC6 | NA | |||
| MC7 | 0.21 | 1.66 (95% CI: −1.38–4.65) | MC7 | NA | |||
| MC8 | 0.34 | 2.29 (95% CI: −1.83–6.62) | MC8 | NA | |||
| # of Patients in TMEM-Hi | ||||||
| Method | TMEM1 | TMEM2 | TMEM3 | TMEM4 | ||
| # of Patients | 48 | 37 | 49 | 12 | ||
| # of Patients in MenaCalc-Hi | # of Patients in Combined Marker-Hi | |||||
| Method | # of Patients | Method | TMEM1 | TMEM2 | TMEM3 | TMEM4 |
| MC1 | 12 | MC1 | 4 | |||
| MC2 | 28 | MC2 | 17 | |||
| MC3 | 36 | MC3 | 15 | |||
| MC4 | 12 | MC4 | 5 | |||
| MC5 | 62 | MC5 | 32 | |||
| MC6 | 11 | MC6 | 7 | |||
| MC7 | 26 | MC7 | 2 | |||
| MC8 | 10 | MC8 | 1 | |||
| # of Cases | TMEM-Hi | TMEM-Low |
|---|---|---|
| MenaCalc-Hi | 17 | 11 |
| MenaCalc-Low | 31 | 27 |
Publisher’s Note: MDPI stays neutral with regard to jurisdictional claims in published maps and institutional affiliations. |
© 2022 by the authors. Licensee MDPI, Basel, Switzerland. This article is an open access article distributed under the terms and conditions of the Creative Commons Attribution (CC BY) license (https://creativecommons.org/licenses/by/4.0/).
Share and Cite
Ye, X.; Oktay, M.H.; Xue, X.; Rohan, T.E.; Ginter, P.S.; D’Alfonso, T.; Kornaga, E.N.; Morris, D.G.; Entenberg, D.; Condeelis, J.S. Combining TMEM Doorway Score and MenaCalc Score Improves the Prediction of Distant Recurrence Risk in HR+/HER2− Breast Cancer Patients. Cancers 2022, 14, 2168. https://doi.org/10.3390/cancers14092168
Ye X, Oktay MH, Xue X, Rohan TE, Ginter PS, D’Alfonso T, Kornaga EN, Morris DG, Entenberg D, Condeelis JS. Combining TMEM Doorway Score and MenaCalc Score Improves the Prediction of Distant Recurrence Risk in HR+/HER2− Breast Cancer Patients. Cancers. 2022; 14(9):2168. https://doi.org/10.3390/cancers14092168
Chicago/Turabian StyleYe, Xianjun, Maja H. Oktay, Xiaonan Xue, Thomas E. Rohan, Paula S. Ginter, Timothy D’Alfonso, Elizabeth N. Kornaga, Don G. Morris, David Entenberg, and John S. Condeelis. 2022. "Combining TMEM Doorway Score and MenaCalc Score Improves the Prediction of Distant Recurrence Risk in HR+/HER2− Breast Cancer Patients" Cancers 14, no. 9: 2168. https://doi.org/10.3390/cancers14092168
APA StyleYe, X., Oktay, M. H., Xue, X., Rohan, T. E., Ginter, P. S., D’Alfonso, T., Kornaga, E. N., Morris, D. G., Entenberg, D., & Condeelis, J. S. (2022). Combining TMEM Doorway Score and MenaCalc Score Improves the Prediction of Distant Recurrence Risk in HR+/HER2− Breast Cancer Patients. Cancers, 14(9), 2168. https://doi.org/10.3390/cancers14092168