Article

E-Cadherin-Deficient Cells Are Sensitive to the Multikinase Inhibitor Dasatinib

Centre for Translational Cancer Research (Te Aho Matatū), Cancer Genetics Laboratory, Department of Biochemistry, University of Otago, Dunedin 9016, New Zealand
*
Author to whom correspondence should be addressed.
Cancers 2022, 14(7), 1609; https://doi.org/10.3390/cancers14071609
Submission received: 31 January 2022 / Revised: 12 March 2022 / Accepted: 17 March 2022 / Published: 22 March 2022
(This article belongs to the Special Issue Hereditary Gastric Cancer—Molecular Basis and Diagnosis)

Abstract

:

Simple Summary

Inactivating mutations in the CDH1 gene, encoding the cell adhesion protein E-cadherin, cause hereditary diffuse gastric cancer syndrome (HDGC), as well as being a hallmark of sporadic diffuse gastric cancers and lobular breast cancers. We have previously identified AKT3 as a potential vulnerability in gastric cancers lacking CDH1 expression. This study aimed to test whether drugs which inhibit the AKT3-associated gene, discoidin domain receptor tyrosine kinase 2 (DDR2) specifically targeted cells deficient in E-cadherin. We demonstrated that cells and organoids lacking E-cadherin exhibited heightened sensitivity to dasatinib, a drug that targets multiple kinases including DDR2 and SRC.

Abstract

The CDH1 gene, encoding the cell adhesion protein E-cadherin, is one of the most frequently mutated genes in gastric cancer and inactivating germline CDH1 mutations are responsible for the cancer syndrome hereditary diffuse gastric cancer (HDGC). CDH1-deficient gastric cancers exhibit high AKT serine/threonine kinase 3 (AKT3) expression, but specific drugs against this AKT isoform are not available. We therefore used two publicly available datasets to identify AKT3-associated genes which could be used to indirectly target AKT3. Reactome analysis identified an enrichment of extracellular matrix remodelling genes in AKT3-high gastric cancers. Of the 51 genes that were significantly correlated with AKT3 (but not AKT1), discoidin domain receptor tyrosine kinase 2 (DDR2) showed the strongest positive association. Treatment of isogenic human cells and mouse gastric and mammary organoids with dasatinib, a small molecule inhibitor of multiple kinases including SRC, BCR-ABL and DDR2, preferentially slowed the growth and induced apoptosis of E-cadherin-deficient cells. Dasatinib treatment also preferentially slowed the growth of gastric and mammary organoids harbouring both Cdh1 and Tp53 mutations. In organoid models, dasatinib treatment was associated with decreased phosphorylation of total AKT, with a stronger effect seen in Cdh1-deficient organoids. Treatment with combinations of dasatinib and an inhibitor of AKT, MK2206, enhanced the effect of dasatinib in breast MCF10A cells. In conclusion, targeting the DDR2-SRC-AKT3 axis with dasatinib represents a promising approach for the chemoprevention and chemotherapy of gastric and breast cancers lacking E-cadherin.

1. Introduction

Germline mutations in CDH1, the gene encoding the cell adhesion protein E-cadherin, are responsible for the cancer syndrome hereditary diffuse gastric cancer (HDGC) [1]. HDGC was first described in three extended New Zealand Māori families in 1998 [2]. The lifetime risk of diffuse gastric cancer (DGC) in HDGC is estimated to be approximately 56% for women and 70% for men [3], although there is considerable variation reported between families; estimates from clinical genetic laboratories based on multi-gene panel testing range from 25–33% for women and 37–42% for men [4,5] whereas lifetime risks of 67% and 83% for men and women, respectively, were reported in one early series of stand-out families [6]. In addition to DGC, female germline CDH1 mutation carriers have a lifetime risk of lobular breast cancer (LBC) estimated at 39–55% [3,4,5,6]. Additionally, somatic CDH1 mutations are present in approximately 50% of sporadic cases of DGC [7], and loss of E-cadherin is a hallmark of lobular carcinoma in situ (LCIS) and LBC [8]. Approximately 90% of LBCs lack E-cadherin protein expression [9].
It is recommended that pathogenic CDH1 mutation carriers from HDGC families undergo a prophylactic gastrectomy [1]. However, this procedure can result in long term morbidity with common complications including lactose intolerance, fat malabsorption, nutritional deficiencies, weight loss and dysphagia [1]. Annual gastroscopic surveillance is recommended for mutation carriers declining or deferring surgery. Unfortunately, there are no chemoprevention methods that can be used to further reduce the risk of advanced gastric cancer in these families, with the possible exception of H. pylori eradication [10]. Annual magnetic resonance imaging (MRI) and mammographic surveillance are recommended for the management of the breast cancer risk in HDGC families, although bilateral, risk-reducing mastectomy can be considered [1]. The only current option for chemoprevention of LCIS/LBC in the context of HDGC is treatment with selective oestrogen receptor modulators (SERMS) or aromatase inhibitors. Although there is no direct data on HDGC-associated breast cancers, these anti-oestrogen drugs reduce risk by approximately 50% in women at elevated risk of developing LBC [1,11]. Unfortunately, chemopreventative endocrine therapy can have a significant impact on quality of life, particularly when continued over many years [12]. Moreover, the uptake of these drugs may be compromised in mutation carriers who have undergone a prophylactic gastrectomy, requiring serum drug concentration monitoring and, if required, dose modifications to ensure efficacy is maintained [13]. Genotype analysis for the drug metabolising enzyme CYP2D6 may also be useful for patients receiving tamoxifen [14].
Sporadic DGC and LBC frequently present at an advanced stage, and treatment options are therefore often limited. The standard of care for sporadic, locally advanced gastric cancer usually involves perioperative chemotherapy with docetaxel, oxaliplatin, fluorouracil and leucovorin [15]. However, there is growing evidence that patients with the diffuse subtype receive little benefit from this or other standard chemotherapies [16,17,18]. Traditional chemotherapeutic drugs are also of limited benefit to LBC, as the majority of these tumours have low proliferation rates [19] as well as relatively low mutational burden and the diffuse nature of these tumours also provides challenges for surgical resection [20]. Around 90% of LBCs are oestrogen receptor-positive and frequently respond well initially to adjuvant endocrine therapy with SERMS or aromatase inhibitors, however, a subset of LBC patients do not benefit from adjuvant endocrine therapy [21]. Resistance to the SERM tamoxifen can develop due to a number of factors including expression of oestrogen receptor-gamma as well as enhanced growth factor signalling [22]. Overall, there is a clear need for new chemoprevention and chemotherapy options for both hereditary and sporadic DGCs and LBCs lacking E-cadherin expression.
We have been taking a synthetic lethal approach to specifically target cells lacking E-cadherin expression [23,24] including a recent study that identified a synthetic lethal relationship between allosteric pan AKT inhibitors and CDH1 expression in breast and gastric cell lines and mouse gastric organoids [25]. Gene expression analysis of gastric tumour samples from The Cancer Genome Atlas (TCGA) stomach adenocarcinoma (STAD) cohort revealed that the expression of the AKT3 isoform (but not AKT1 or AKT2) is inversely correlated to the expression of CDH1 in gastric tumours [25]. This suggested that the sensitivity of CDH1-null cells to the pan AKT inhibitors may be explained more by the inhibition of AKT3 rather than AKT1 and AKT2, and therefore that over-expression of AKT3 represents a vulnerability in tumours deficient in E-cadherin. AKT3 is over-expressed in a number of other solid tumours, including breast cancers [26,27], and it has been shown to promote cell growth and an epithelial–mesenchymal transition in colorectal and gastric cancer cell lines [28,29]. In addition, shRNA knockdown of AKT3 inhibited triple negative breast cancer cell spheroid growth and tumour formation in in vivo xenograft studies [30].
Since there are no isoform-specific small molecule inhibitors of AKT3, we sought to identify an indirect route to target this protein in E-cadherin-deficient cells by identifying AKT3-associated genes in CDH1-low gastric tumours. This analysis identified the discoidin domain receptor 2 (DDR2) as an AKT3-associated gene. DDRs are unique receptor tyrosine kinases that are activated by binding of collagen components of the extracellular matrix (ECM), instead of soluble peptide growth factors [31]. Here, we examined the sensitivity of E-cadherin-deficient cells to multikinase inhibitors which target DDR2 and identified dasatinib treatment as having a significantly synthetic lethal effect in our cell and organoid models. Therefore, we postulate that the indirect inhibition of AKT3 via DDR2 could be a novel chemopreventative and chemotherapeutic approach for the treatment of E-cadherin-deficient breast and gastric cancers.

2. Materials and Methods

2.1. Bioinformatics

2.1.1. Datasets and Processing

The Cancer Genome Atlas (TCGA) Stomach Adenocarcinoma (STAD) cohort [32], and the Cristescu cohort (“GEO”) [33] from the Gene Expression Omnibus (GEO—accession GSE652254) were used for differential expression (DE) analysis. Gene level count data for the TCGA cohort were downloaded from the TCGA data portal and processed using the “voom” methodology from the limma (linear models for microarray analysis) package [34] within the statistical computing environment R, version 4.0.4 [35]. Raw microarray data from the Cristescu cohort were downloaded from the NCBI GEO data portal, and were normalised using the robust multiarray analysis (RMA) [36] approach.

2.1.2. Differential Expression Analysis

Differential expression analysis was carried out using the limma package for R, in order to identify differences in gene expression between samples with moderate-to-high (top 66.6%) vs. low (bottom 33.3%) expression of AKT3 within the GEO and TCGA datasets. The Benjamini–Hochberg procedure was employed to provide false discovery rate control, and an adjusted p-value of 0.05 was used to define significant differential expression. Genes achieving significance were further filtered by requiring an expression fold change (FC) of at least 2-fold up- or down-regulation. These analyses were repeated for AKT1, but without filtering for expression FC. Once a list of differentially expressed genes had been generated for each of AKT1 and AKT3, any ATK1-associated genes were removed from the AKT3-associated gene list, to avoid selecting compounds that target both CDH1+ and CDH1− gastric isoforms, as these were considered unlikely to be suitable for a targeted therapy approach. The top-ranked gene across both data sets (DDR2) was then selected as a potential target for further analysis.

2.1.3. Reactome Analysis

Lists of significantly differentially expressed genes (FDR adjust p-value < 0.05) were used for pathway enrichment analysis, in order to identify Reactome [37] pathways that were overrepresented among genes associated with AKT3. The methodology from the goseq package [38] for R was utilised to account for the gene-length bias that is known to impact enrichment analyses in RNA-seq data sets.

2.2. Cell Culture

MCF10A cells (CRL 10317), a non-tumorigenic mammary epithelial cell line, and the derived isogenic line with CDH1 knockout (MCF10A-CDH1−/−) (#CLLS1042) were purchased from Sigma Aldrich (St. Louis, MO, USA). The MCF10A isogenic lines were cultured in DMEM/F12: (1:1) (Invitrogen, Carlsbad, CA, USA) with 5% horse serum (Invitrogen), 10 μg/mL Actrapid neutral insulin (Novo Nordisk Pharmaceuticals Ltd. Gatwick, West Sussex, UK), 20 ng/mL human epidermal growth factor (Peprotech, Rehovot, Israel), 100 ng/mL cholera toxin and 500 ng/mL hydrocortisone (Sigma Aldrich, St. Louis, MO, USA).

2.3. Small Molecule Inhibitors and Chemicals

The kinase inhibitors dasatinib (#AOB87355), imatinib mesylate (#AOB6752), nilotinib (#AOB87155) and ponatinib (#AOB87302), were purchased from AOBious (Gloucester, MA, USA) and the powders reconstituted in sterile DMSO, aliquoted and stored at −20 °C until use. Endoxifen (E8285) was purchased from Sigma. Information regarding the components utilised for organoid media are detailed in Table S1.

2.4. Nuclei Enumeration Assay

MCF10A-WT/MCF10A-CDH1−/− and NCI-N87/NCI-N87-CDH1−/− cells were seeded in 96-well black plates (Greiner, Kremsmünster, Austria) at 4 (MCF10A) or 10 (NCI-N87) × 104 cells per well and left to attach overnight. The next day, outer wells of plates were stained with 1 µg/mL Hoechst 33,342 in PBS for 30 min and imaged on a Cytation 5 imager (Biotek, Winooski, VT, USA). Nuclei were counted at this stage to ensure plating accuracy. If the ratio of WT: CDH1−/− cells was >0.65 and <1.3, then plates proceeded to drugging. Cells were drugged with a dose response of compounds as previously described [39] and incubated for a further 48 h, cells were then fixed and stained with 1 µg/mL Hoechst 33,342, 0.25% paraformaldehyde and 0.075% saponin in PBS. Six fields/well at 4× magnification were captured using the Cytation 5 imager (Biotek). Nuclei were counted using Gen5 software (Biotek), and normalised to the vehicle control for each cell line.
MCF10A-WT/MCF10A-CDH1−/− cells were assessed for the efficacy of synergistic combinations utilising identical methodology to the nuclei enumeration assay, with the following modifications. Cells were seeded at 1 × 10³ cells per well in 384-well, black-walled, clear-bottom tissue culture plates (Greiner Bio-One, Frickenhausen, Germany) in 30 µL of complete growth medium. MCF10A WT and CDH1−/− cells were drugged with 10µL of a dose response of compounds; drug 1 + drug 2 vehicle control, drug 2 + drug 1 vehicle control and drug 1 + 2 in combination, as previously described [23] and incubated for a further 48 h. Combination index (CI) values were calculated using CompuSyn software. All experiments were performed as biological triplicates for combination treatments, with replicates of single agents accrued to provide standardised 9-point MCF10A WT and CDH1−/− viability measurements, allowing for accurate determination of combination synergism. Single agent standardised viability measurements comprised of 16 replicates minimum, with at least two measurements included from the same plates as the combination biological triplicates these single agents encompassed.

2.5. FACS

MCF10A-WT and MCF10A-CDH1−/− cells were seeded at 4 and 5 × 10⁴ cells per well, respectively, in 6-well plates. The next day, cells were drugged with dasatinib and left for 48 h. The day before analysis, control wells were drugged with Staurosporine (0.1 µM). On the day of analysis, cells were trypsinised, spun down at 1500 rpm for 5 min, and resuspended in 500 µL Annexin-binding buffer (10 mM Hepes (pH 7.4), 140 mM NaCl, 2.5 mM CaCl2). Cells were stained with propidium iodide (Sigma Aldrich, St. Louis, MO, USA) and FITC-Annexin-V (#556420, BD Biosciences, San Jose, CA, USA) for 15 min in the dark. Samples were analysed on BD Fortessa Flow cytometer (BD Biosciences, Franklin Lakes, NJ, USA). Compensation controls were: Untreated unstained, heat-treated cells stained with PI, and Staurosporine (0.1 µM)-treated cells stained with FITC-Annexin-V. Data analysis was performed on FlowJo software v10 (BD Biosciences).

2.6. Organoid Culture

Organoids were generated using the stomachs and mammary glands of 6–8 week old mice and an inducible Cre-lox system [40] controlling both Cdh1 deletion and the activation of the fluorescent marker protein TdTomato under the CD44 stem cell promotor; CD44-Cre/Cdh1(fl/fl)/tdTomato(fl/fl). Single loxP sites flank a region encompassing exons 6 through 10 of Cdh1 followed by a floxed selection cassette which is excised via in vitro Cre mediated recombination. These organoids are referred to as Cdh1−/− in this manuscript. Control organoids derived from CD44-Cre/tdTomato mice are referred to as WT. An additional mouse strain CD44-Cre/Cdh1(fl/fl)/Tp53 (fl/fl)/tdTomato(fl/fl) with inducible simultaneous knockout of Tp53 and Cdh1 was also generated in order to obtain organoids deficient in both Tp53 and E-cadherin (organoids derived from these mice referred to as Tp53−/−Cdh1−/− in this manuscript).

2.6.1. Mammary Organoid Generation

To generate mammary organoids form our mouse models, we adapted a protocol from Ewlad et al. [41]. For a detailed protocol refer to Luxenburger and Bougen-Zhukov et al., 2021 [42]. Mammary glands were harvested from virgin female mice and pooled in sterile PBS (+ primocin, (Invivogen, San Diego, CA, USA)) on ice, minced and then incubated (at 100 rpm, 37 °C) with a digestion solution (5% FBS, 2.5 µg/mL Gentamycin, 5 µg/mL insulin, 3 mg/mL dispase II, 1.5 mg/mL collagenase dissolved in Advanced DMEM/F12 media) for 30 min. Tissues were then resuspended in DMEM/F12 (+primocin), centrifuged and resuspended in 4 mL DNase solution (4 U/mL DNase I in DMEM/F12). Tubes were shaken vigorously by hand for 2 min, then 6 mL DMEM/F12 (+primocin) added per tube. Following this, samples were washed four times with DMEM/F12 (+primocin) to remove enzymes and to separate unwanted single cells from organoids. After a final spin at the supernatant was removed, and the pellet was resuspended in 80 µL of matrigel and seeded in 24 well plate.

2.6.2. Gastric Organoid Generation

Gastric organoids were generated using the same procedure as in Brew et al. [23]. Briefly, stomachs were harvested from mice, washed with PBS containing primocin and the keratinised region was removed. The remaining tissue was incubated in chelating buffer (25 mM EDTA, pH 8.0 to loosen glands) at 4 °C for 60–90 min with agitation. The glands were then separated out with vigorous shaking in fresh cold PBS. Large pieces of tissue were removed and glands were spun down at 200× g for 5 min at 4 °C. The supernatant was removed and the pelleted glands resuspended in 50 µL matrigel and plated into 24 well plates.
Once the matrigel was set, 500 µL of organoid media was added (for tissue specific formulations please see Table S1 in Supplementary materials) and plates incubated at 37 °C, 5% CO2. After glands had started to expand, they were passaged via incubation with 0.05% trypsin (gastric organoids; 10 min, 37 °C) or 0.25% trypsin (mammary organoids; 15 min, 37 °C) to create single cells, counted and seeded in 24 well plates at 1000 cells/well (gastric) and 3000 cells/well (mammary). For routine maintenance, gastric organoids were passaged every 6 days and mammary organoids every 7–9 days.

2.7. Drug Treatment of Organoids

Single cell suspensions were generated from gastric and mammary organoids cultures (as described above). After counting, cells were suspended in matrigel and cells were plated in 12.5 µL matrigel per well of 384 well plates at 200 (gastric) and 300 (mammary) cells per well. Once the matrigel was set (approximately 10 min), 20 µL of complete organoid media (tissue specific) was added per well. The expression of TdTom and/or knockout of Cdh1 (or Tp53/Cdh1) was induced with endoxifen by addition of 20 µL of 1 µM endoxifen/well-final concentration 0.5 µM the day after seeding (gastric) or three days after seeding (mammary). Then, 24 h (gastric) or 48 h (mammary) after induction, organoids were drugged with dasatinib by addition of 40 µL of 2× concentrated dasatinib with a final concentration of 5–20 µM (mammary) or 0.25–1 µM (gastric). DMSO (0.2%) was used as vehicle control. 48 h after addition of drug, organoids were imaged on the Cytation 5 imaging reader (Biotek): imaging was performed in brightfield and red fluorescence protein (RFP) channels; 4 regions/well, 11 stacks per region. Upon completion of imaging, images were stitched and stacked to produce one merged image per well. Organoid area was calculated in the Cytation software using images from the RFP channel.

2.8. Protein Extraction and Western Blotting

Mammary and gastric organoids (WT and Cdh1−/−) were seeded in 50 µL suspensions of matrigel. One (gastric) or two (mammary) days after seeding, organoids were induced with 0.5 µM endoxifen. On day 5 (gastric) or day 6 (mammary) post seeding, organoids were treated with dasatinib (0.25 µM) or DMSO (0.1%) vehicle for 24 h. On day 6, organoids were harvested using cell recovery solution (Corning) and incubated on ice (with agitation) for 30 min. Cells were then washed with 10 mL of TBS, spun down at 300 rpm (5 min, room temperature) and supernatant removed. The pellets were then frozen at −80 °C overnight. Each pellet was resuspended in 60 µL of lysis buffer (25 mM HEPES, 100 mM NaCl, 1 mM EDTA, 10% (v/v) glycerol, 1% (v/v) Triton-X-100) containing Complete Mini Protease Inhibitor tablets (Roche) and incubated on ice for 30 min, vigorously vortexing every 5 min. Tubes were then spun at 13,200 rpm for 10 min at 4 °C and supernatants transferred to fresh tube on ice. Protein was quantified using BCA protein Assay (Thermo Fisher Scientific, Waltham, MA, USA). Protein was diluted with 4× Laemmli buffer and denatured at 95 °C for 5 min. 20 µg of each sample was run on 12% SDS Page gels and transferred onto nitrocellulose membranes. Membranes were blocked for 1 h with 5% BSA-TBST and incubated over night at 4 °C with primary antibodies. Antibody concentrations: pAKT Ser473 (#4060, Cell Signaling, Danvers, MA, USA) at 1:1000, pan AKT at 1:1000 (#4685, Cell Signaling, Danvers, MA, USA), E-cadherin 1:1000 (#AF748, RnD Systems, Minneapolis, MN, USA), P53 1:1500 (#32532, Cell Signaling, Danvers, MA, USA) and B-actin 1:2500 (#A2066, Sigma Aldrich, St. Louis, MO, USA). Fluorescent secondary antibodies anti-rabbit (LI-COR #925-32211), or anti-goat (#925-32214, LI-COR, Lincoln, NE, USA), were both used at 1:10,000. Membranes were imaged on LI-COR Odyssey Imaging System (LI-COR, Lincoln, NE, USA).

3. Results

3.1. Differential Gene Expression Analysis Results

3.1.1. AKT3 Expression Is Significantly Inversely Correlated with CDH1 Expression in Gastric Tumour Datasets

Previous research in our laboratory demonstrated that CDH1-null cells have increased sensitivity to allosteric AKT inhibitors (ARQ-092, MK2206) compared to CDH1-expressing cells (in isogenic mammary and gastric cancer cell line pairs) [25]. This research also identified a strong negative correlation between CDH1 and AKT3 expression in the TCGA STAD dataset (Pearson correlation −0.439, p-value < 2.2 × 10⁻¹⁶), as well as a weak but non-significant positive correlation between CDH1 and AKT1 expression (Pearson correlation 0.081, p-value = 0.1). No correlation was found between AKT2 and CDH1. In order to confirm the relationships between CDH1 and AKT1/AKT3, we repeated this correlation analysis in a second gastric cancer dataset (GEO accession GSE652254). This analysis confirmed the inverse correlation between CDH1 and AKT3 (Pearson correlation −0.429, p-value = 6.3 × 10⁻¹⁵), and did not find a significant association between CDH1 and AKT1 (Pearson correlation 0.07, p-value = 0.23) or AKT2 (Pearson correlation 0.06, p-value = 0.32) expression, thus reinforcing the results observed in the TCGA STAD data set.

3.1.2. AKT3-Associated Genes Are Enriched for Extracellular Matrix Pathways

To further understand the activity of AKT3 in gastric cancer and develop strategies to preferentially target this isoform, we identified AKT3-associated genes in the TCGA and GEO datasets. AKT3-associated genes were identified by carrying out a differential expression analysis between samples grouped by moderate-to-high (top 66.6%) vs. low (bottom 33.3%) AKT3 expression. The same process was also carried out to identify AKT1-associated genes.
Filtering for significance (FDR adjusted p-value < 0.05) produced a list of 7453 AKT1-associated genes, and 6830 AKT3-associated genes. Further filtering for expression fold-change (up- or down-regulation of at least 2-fold) in the AKT3-associated list produced a list of 84 strongly AKT3-associated genes. Genes from the AKT1-associated list were then removed from the AKT3-associated list to identify AKT3-specific associations (Table S2). This resulted in a final list of 51 genes with a significant correlation (all of which were positive) with AKT3 expression (Table 1 and Table S3). In both the TCGA and GEO data sets, the gene with the strongest statistical association with AKT3 was discoidin domain receptor tyrosine kinase 2 (DDR2), a receptor tyrosine kinase that binds collagen and regulates cell differentiation, migration, proliferation and extracellular matrix remodelling [43]. DDR2 has also previously been implicated as a driver of peritoneal dissemination and its increased expression is associated with unfavourable clinical characteristics in gastric cancer, such as multiple tumour sites and poor prognosis [44,45]. Other highly correlated genes that have previously been implicated in gastric cancer included CDH11 [46], MSRB3 [47] and FSTL1 [48].
Next, we carried out a Reactome pathway enrichment analysis using the goseq package for R. Of the original 51 genes, 35 were represented in Reactome and were used to identify eight significantly enriched pathways with a Benjamini–Hochberg adjusted p-value < 0.05 (Table 2). These pathways included several overlapping ECM-related pathways: non-integrin membrane–ECM interactions, collagen degradation, degradation of the ECM and ECM organisation (Benjamini–Hochberg adjusted p-values of 0.045, 0.025, 0.0045, and 1.4 × 10⁻⁶, respectively). Together, the identification of these ECM pathways and the co-expression of AKT3 and DDR2 in E-cadherin-low gastric tumours suggest an active link between ECM remodelling and AKT3 signalling in DGC.

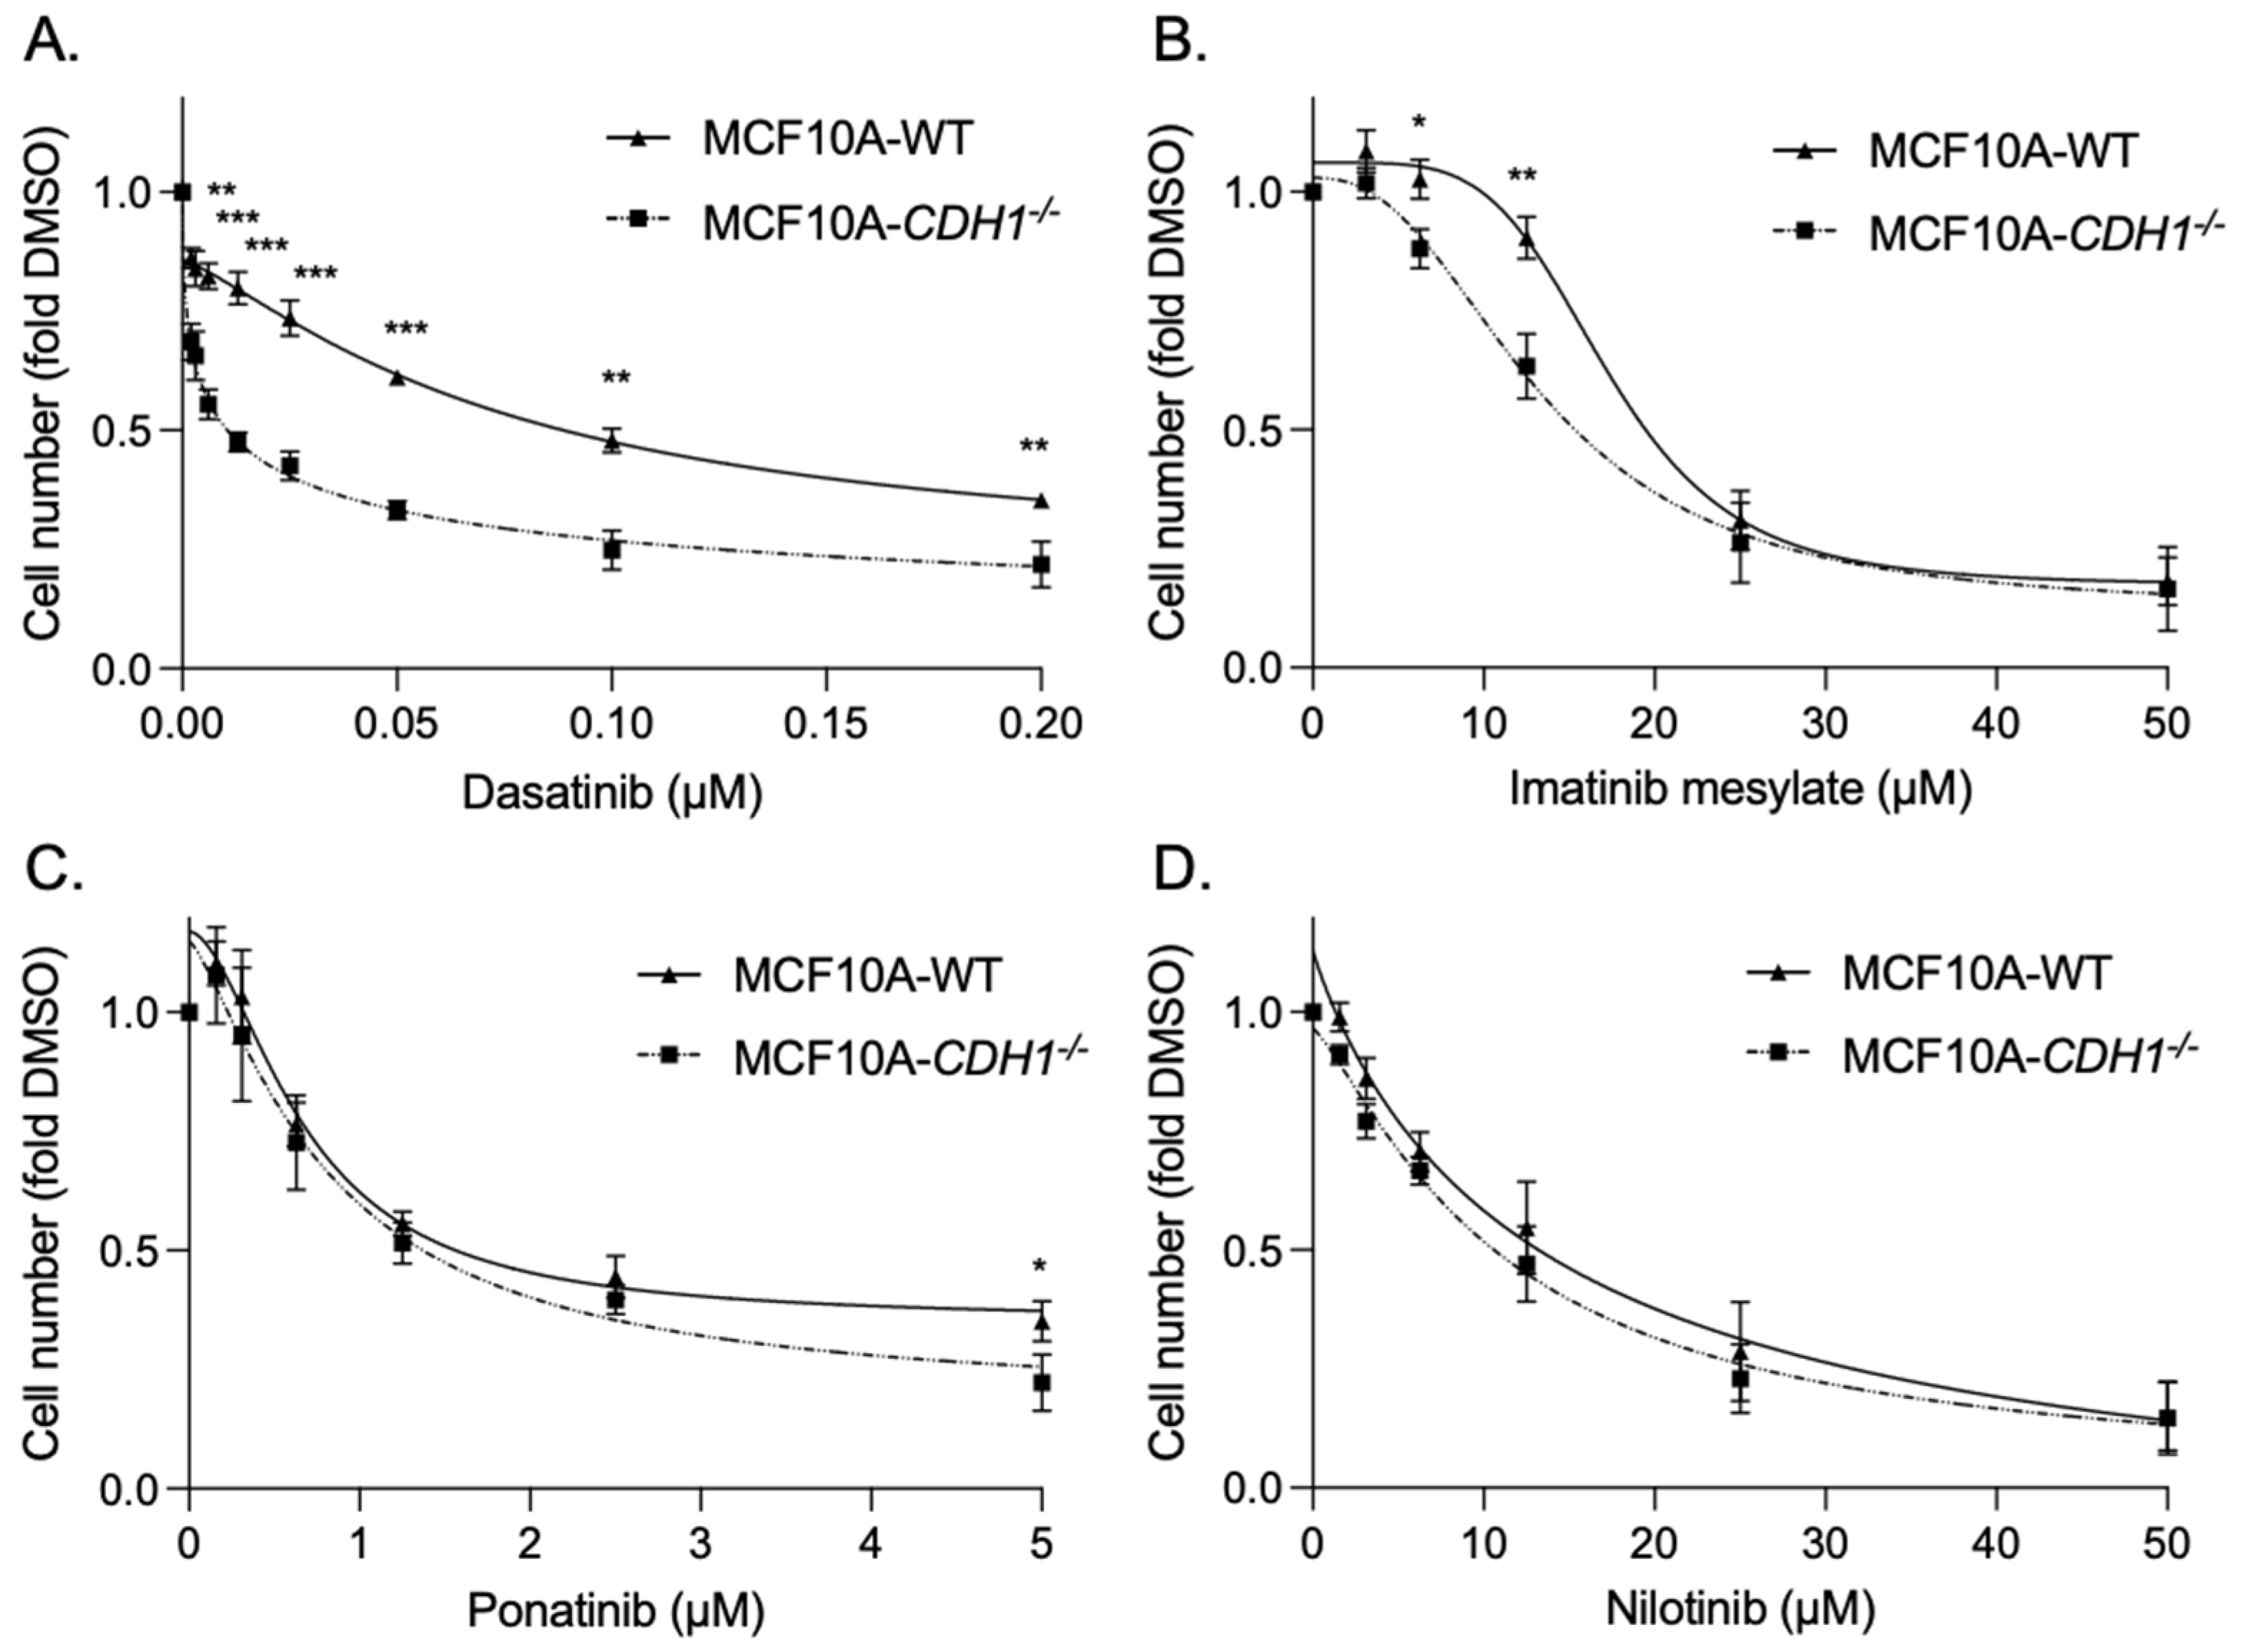
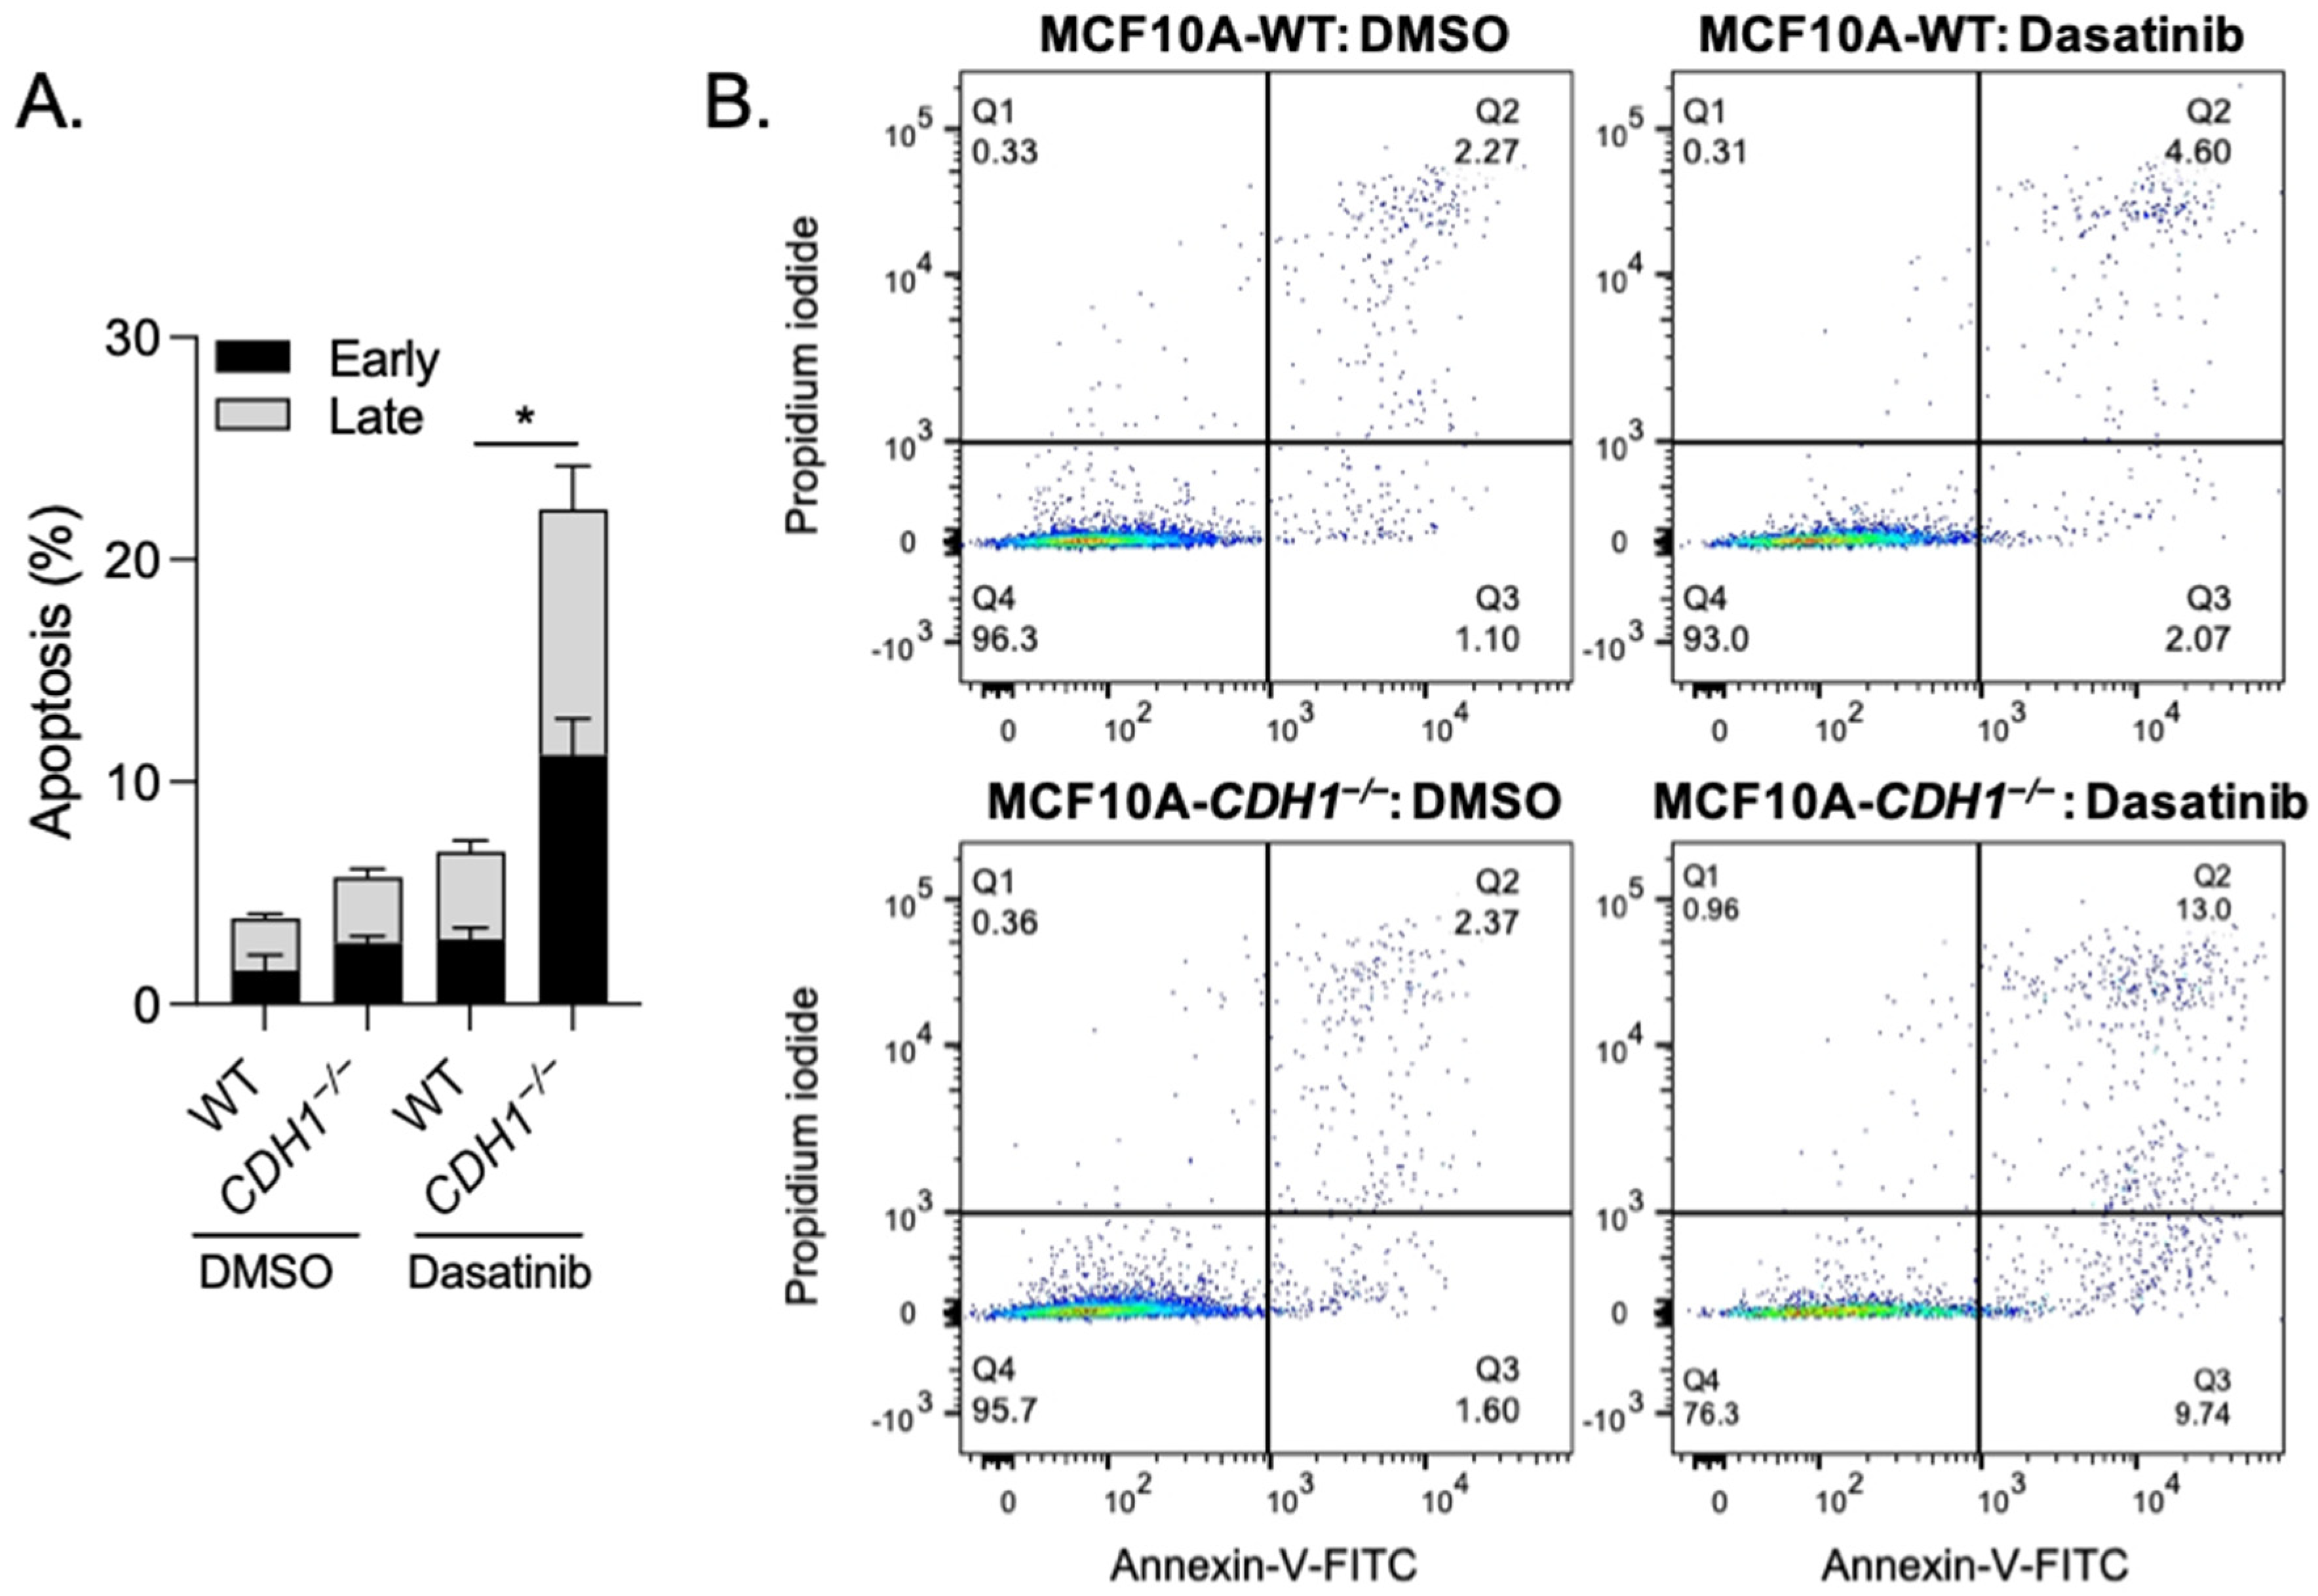
3.2. Breast Cells Lacking CDH1 Are More Sensitive to the Kinase Inhibitor Dasatinib Than Wild-Type Cells

The identification of DDR2 as associated with AKT3 suggested that inhibition of this collagen-activated kinase may provide a means to more specifically target the AKT3 isoform than is possible with pan AKT inhibitors. To assess kinase inhibitors with activity against DDR2, we first utilised a previously characterised pair of isogenic cell lines: MCF10A-WT (containing wild type CDH1) and MCF10A-CDH1−/− (containing a homozygous deletion in the CDH1 locus) [49]. We initially tested four small molecule inhibitors: imatinib, ponatinib, nilotinib and dasatinib. These four compounds were developed as inhibitors to BCR-ABL for the treatment of chronic myeloid leukaemia, but have since been found to have a number of novel kinase and non-kinase targets [50], including SRC and DDR2 [51,52].
After 48 h of treatment, MCF10A-CDH1−/− cells exhibited a greater to sensitivity to two of the inhibitors tested: dasatinib, at all concentrations tested (WT EC50 0.1 µM ± 0.0004 vs. CDH1−/− EC50 0.01 µM ± 0.0004, p = 0.00005), and to a lesser extent, imatinib (WT EC50 10.6 µM ± 1.0 vs. CDH1−/− EC50 15.8 µM ± 1.2, p = 0.04) identifying a vulnerability in CDH1-null cells to drugs which inhibit kinases including DDR2, SRC and BCR-ABL (Figure 1A,B). No significant difference in growth was seen after treatment with nilotinib and ponatinib (Figure 1C,D). MCF10A- CDH1−/− cells also exhibited a greater sensitivity to a commercially available selective DDR2 allosteric inhibitor—WRG-028 (WT EC50 13.7 µM ± 0.2 vs. CDH1−/− EC50 6.8 µM ± 0.1, p = 0.0009), indicating that the SL effect seen in CDH1−/− cells is at least in part due to the inhibition of DDR2 activity [53] (Figure S1). Interestingly, dasatinib exhibited an opposite effect in NCI-N87 gastric cancer cells deficient in E-cadherin (N87-CDH1−/−), with these cells having superior survival after treatment compared to WT cells (N87-WT) (Figure S2). This is presumably explained by genes that are upregulated in NCI-N87 cells following E-cadherin loss which can compensate for the vulnerability observed in the non-malignant MCF10A E-cadherin-deficient cells [54]. Ultimately the identification of these genes may inform the identification of dasatinib resistance pathways and elucidate the identification of robust drug combinations for the treatment of advanced DGC and LBC.
We next examined whether induction of apoptotic cell death could account for the significantly reduced MCF10A-CDH1−/− cell number after treatment with dasatinib. We measured apoptosis by flow cytometry analysis of Annexin-V-FITC/propidium iodide-stained cells after 48 h treatment with 0.2 µM dasatinib (or DMSO controls). Importantly, basal apoptosis levels between MCF10A-WT and CDH1−/− cells were not significantly different (Figure 2A). After dasatinib treatment, total apoptosis levels in MCF10A-WT cells was increased by 2.4-fold compared to DMSO controls (DMSO 2.8% vs. dasatinib 6.8%) (Figure 2A,B). However, in MCF10A-CDH1−/− cells, treatment with dasatinib significantly increased total apoptosis from 4.5% (in DMSO controls) to 20.0%, a fold change of 4.4. Increases in both early (Annexin-V-FITC single staining) and late apoptosis (double staining with Annexin-V-FITC/propidium iodide) equally accounted for the difference in total apoptosis between the two cell lines (Figure 2A). These results led us to conclude that dasatinib preferentially induces apoptosis in MCF10A-CDH1−/− cells and that the synthetic lethal effect observed is at least in part due to preferential cytotoxicity in cells lacking CDH1.

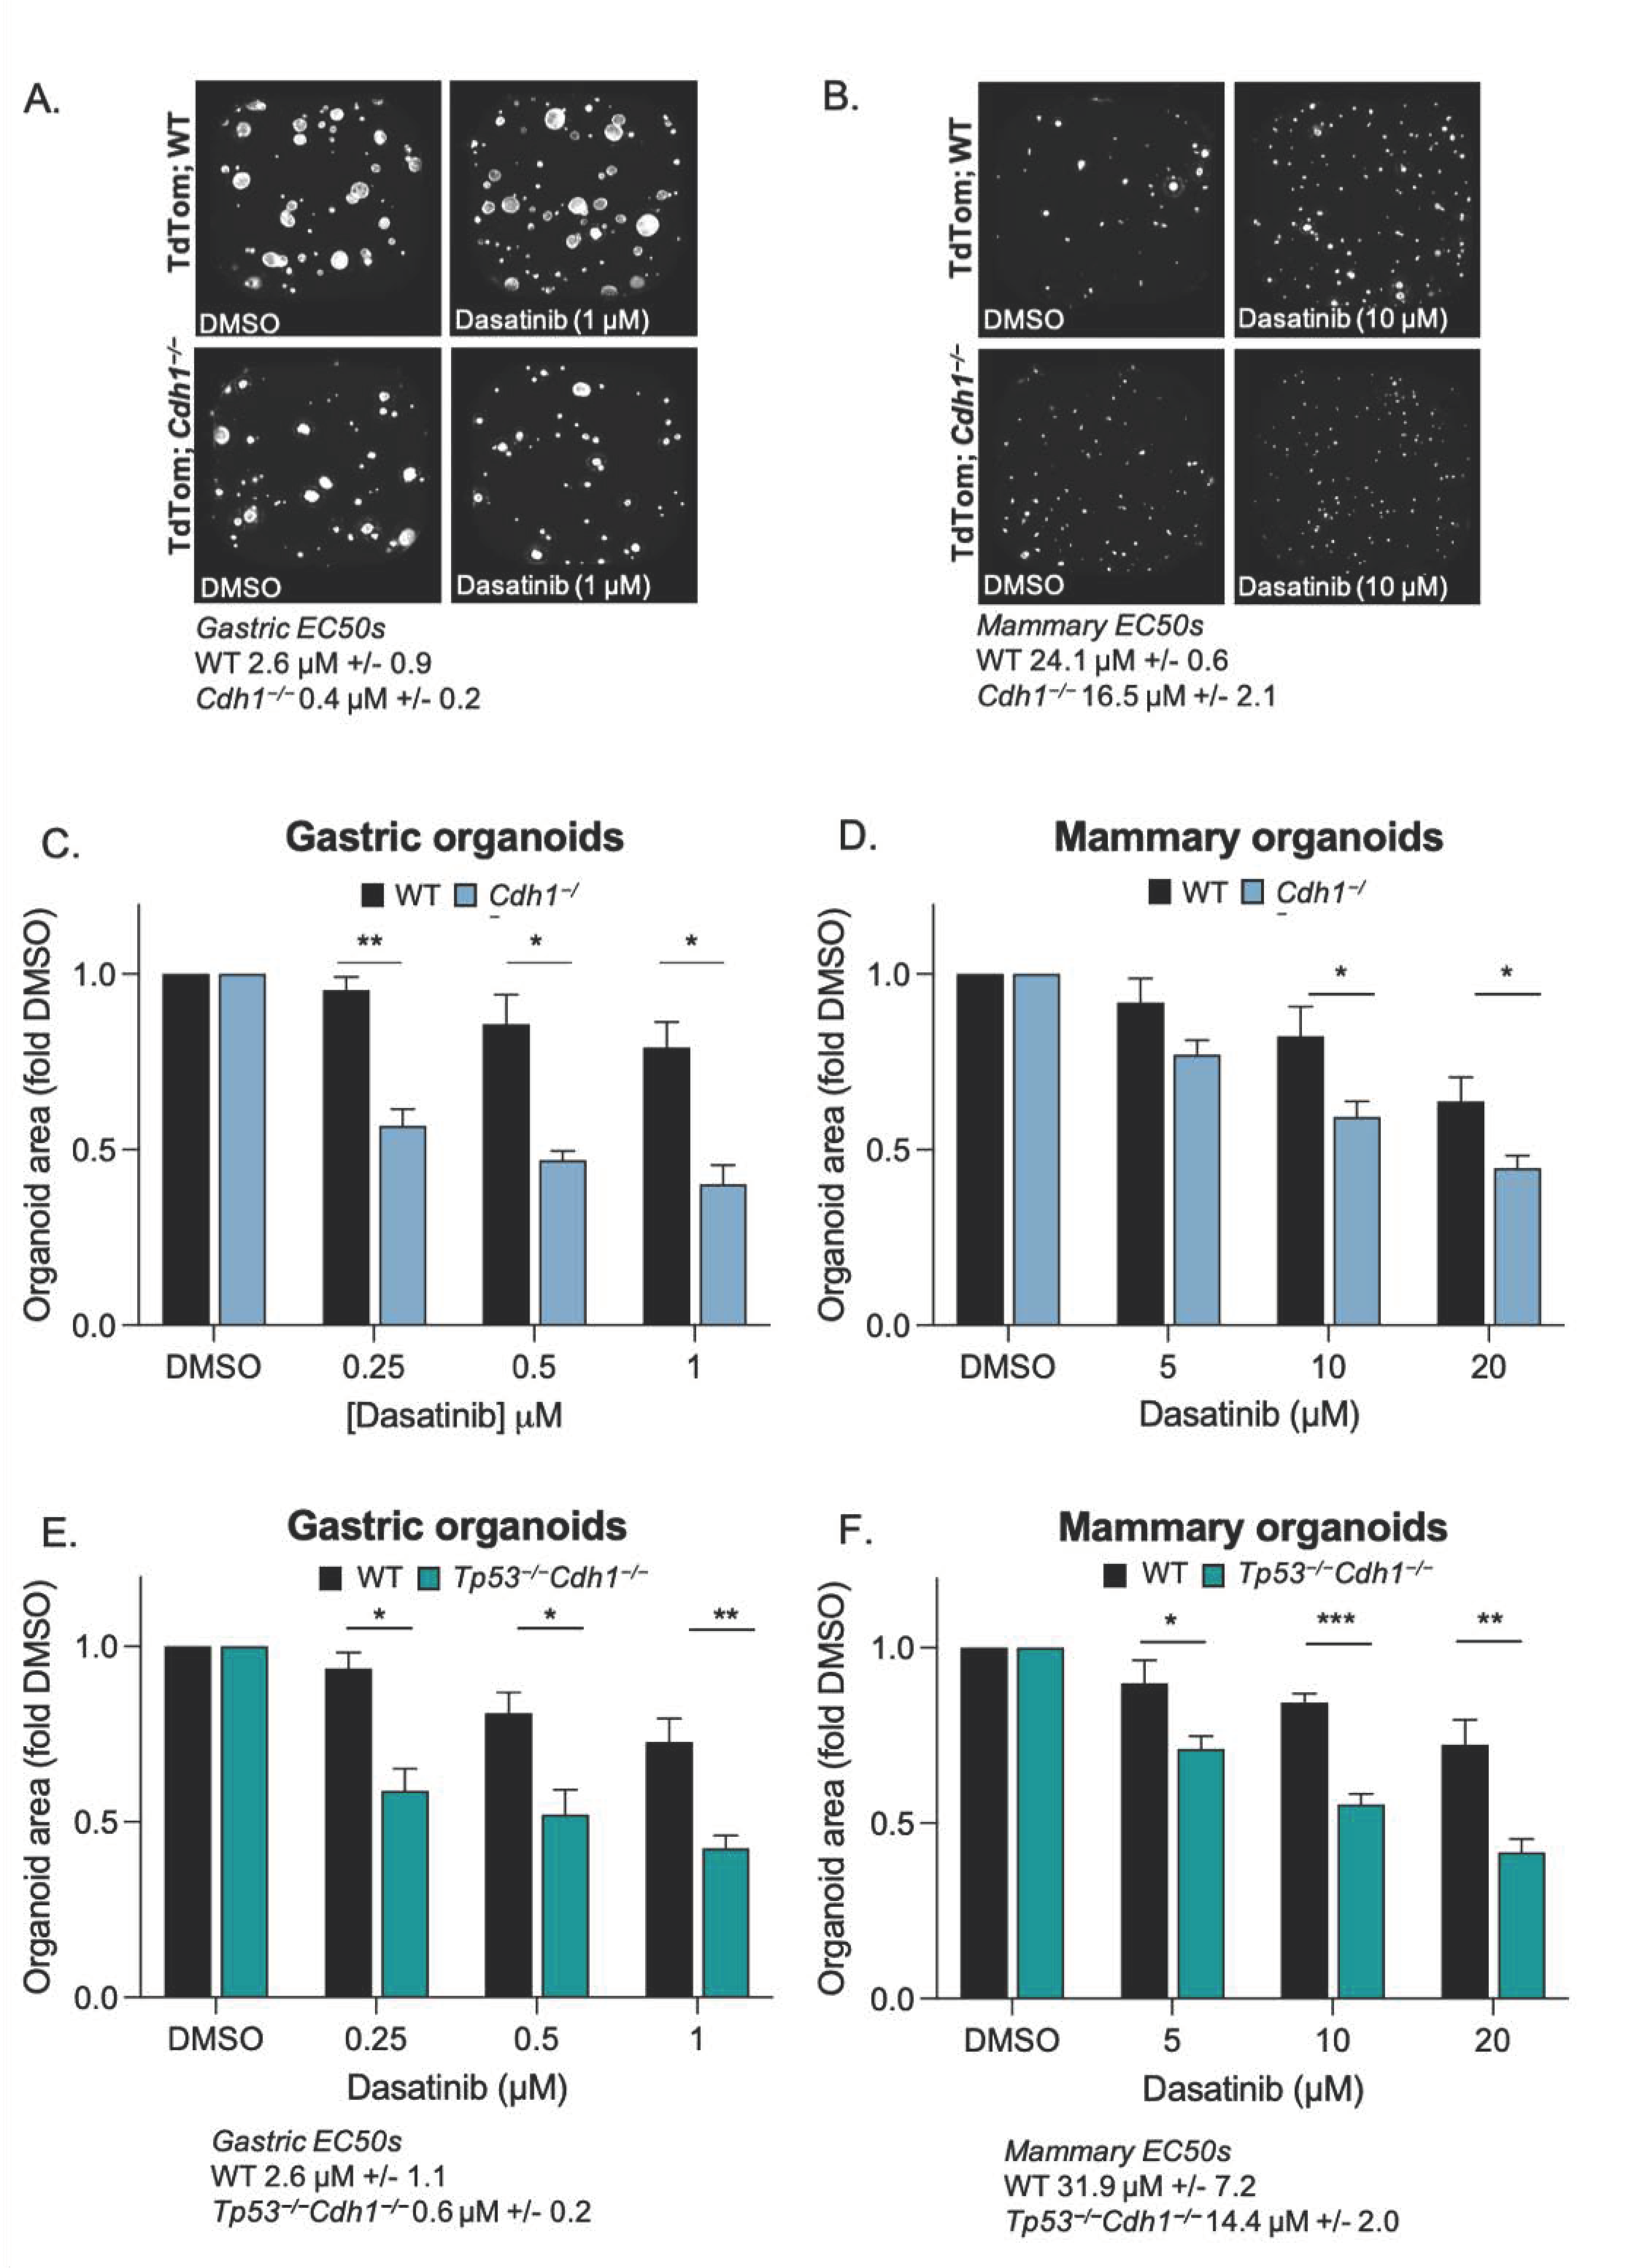
3.3. Conditional Knock-Out of Cdh1 Sensitises Gastric and Mammary Organoids to Dasatinib

To address the limitations of using a 2D model system for drug testing, especially considering DDR2 is activated by the extracellular ligand collagen, we tested dasatinib in mouse-derived mammary and gastric organoids. Organoids are 3D cellular cultures of stem cell origin, typically obtained through mechanical and enzymatic disruption of tissues and grown in gels made of complex protein mixtures (including ECM proteins such as collagen and laminin). In our organoid models, mammary and stomach glands were derived from transgenic mice containing a construct of CD44-Cre/Cdh1(fl/fl)/tdTomato (fl/fl). Upon treatment with endoxifen, Cre recombinase activity is induced, resulting in excision of exons 6 to 10 of the Cdh1 gene, abrogating E-cadherin activity. Simultaneously, a premature stop codon is removed from the tdTomato construct, leading to expression of the red fluorescent protein tdTomato. CD44-Cre/Cdh1(Wt/Wt)/tdTomato(fl/fl) mice were used as controls (referred to as WT), where induction with endoxifen results in tdTomato expression but does not affect Cdh1. An additional mouse strain containing a construct of CD44/Cre/ Cdh1(fl/fl)/Tp53(fl/fl)/tdTomato (fl/fl), which upon induction leads to the simultaneous knockout of E-cadherin and Tp53 expression in CD44-expressing cells was used to generate organoids that modelled more advanced DGC. Depletion of Tp53 and/or E-cadherin protein in our organoid models was confirmed by western blot for the mammary organoids (Figure 3A,B and Figure S5) and western blot/confocal microscopy for the gastric organoids [24]. Brightfield imaging clearly shows the distinct morphological changes induced by knockout of Cdh1 and Tp53 in mammary organoids (Figure 3C). WT mammary organoids exhibit a smooth rounded morphology, however, upon depletion of E-cadherin, these organoids tended to grow larger and display a more amorphous and irregular morphology. Following knockout of both Cdh1 and Tp53, the growth of mammary organoids accelerated markedly, and morphology became significantly more irregular, with the appearance of cellular projections from the main body of the organoids, suggestive of a more invasive phenotype. This is consistent with the effect of Tp53 knockout seen in other organoid models, where loss of Tp53 alone is sufficient to confer metastatic ability to mouse intestinal organoids in a spleen transplantation model [55].
The main measure of dasatinib activity in these organoid models was average area calculated 48 h after drugging. DMSO (vehicle) treated gastric and mammary WT and Cdh1−/− organoids displayed normal growth and no morphological evidence of cell death (Figure 4A,B). However, after 48 h treatment with 1 µM dasatinib, Cdh1−/− gastric organoids were 0.4-fold the size of DMSO controls, whereas the WT organoids were 0.8-fold smaller, a difference of 39% between WT and Cdh1−/− organoids at this concentration of drug (Figure 4C,D).
Interestingly, mammary organoids (WT and Cdh1−/−) were less sensitive than gastric organoids to dasatinib (i.e., mammary WT EC50 = 24.1 µM vs. gastric WT EC50 = 2.6 µM) (Figure 4B,D). Similar to gastric organoids, Cdh1−/− mammary organoids were more sensitive than WT to dasatinib, and after 48 h treatment with 10 µM dasatinib, the average total area of Cdh1−/− mammary organoids was 0.6-fold of DMSO controls vs. WT 0.8-fold of controls, a difference of 23% between WT and Cdh1−/− organoids at this concentration of drug (Figure 4B,D).
By way of comparison, we also tested the pan-AKT allosteric inhibitors MK2206 and ARQ-092 on these organoid models. After treatment with 3.1 µM MK2206, the average total area of Cdh1−/− gastric organoids was 0.5-fold of DMSO controls vs. WT 0.8-fold of controls, a difference of 27% between WT and Cdh1−/− organoids at this concentration of drug (Figure S3A). After treatment with 12.5 µM MK2206, the average total area of Cdh1−/− mammary organoids was 0.4-fold of DMSO controls vs. WT 0.8-fold of controls, a difference of 41% between WT and Cdh1−/− organoids (Figure S3B). The average total area of Cdh1−/− gastric organoids after treatment with 0.25 µM ARQ-092 was 0.6-fold of DMSO controls vs. WT 0.9-fold of controls, a difference of 34% between WT and Cdh1−/− organoids (Figure S3C). Similarly, after treatment with 2.5 µM ARQ-092, the average total area of Cdh1−/− mammary organoids was 0.4-fold of DMSO controls vs. WT 0.9-fold of controls, a difference of 44% between WT and Cdh1−/− organoids (Figure S3D). Similar to dasatinib treatment, gastric organoids exhibited a greater sensitivity to the AKT inhibitors than mammary organoids.
Next, we tested the effect of dasatinib on mammary and gastric organoids lacking both Cdh1 and Tp53 expression. These organoids were generated in order to more closely reflect the genetic complexity of advanced DGC and LBC which have Tp53 mutation frequencies of ~33% and ~7–18%, respectively [56,57,58]. The difference in the response of Tp53−/−Cdh1−/− gastric and mammary organoids to dasatinib was similar to that of Cdh1−/− organoids (Figure 4E,F). After treatment with 1 µM dasatinib, Tp53−/−Cdh1−/− gastric organoids were 0.4-fold the size of DMSO controls, whereas the WT organoids were 0.7-fold (Figure 4E). After treatment with 10 µM dasatinib, Tp53−/−Cdh1−/− mammary organoids were 0.55-fold the size of DMSO controls, whereas the WT organoids were 0.8-fold (Figure 4F). This indicates that the addition of the loss of Tp53 does not interfere with the observed synthetic lethal effect and that dasatinib may be an option not only for the chemoprevention of DGC and LBC in germline CDH1 mutation carriers, but also the treatment of a subset of advanced tumours harbouring both CDH1 and TP53 mutations.

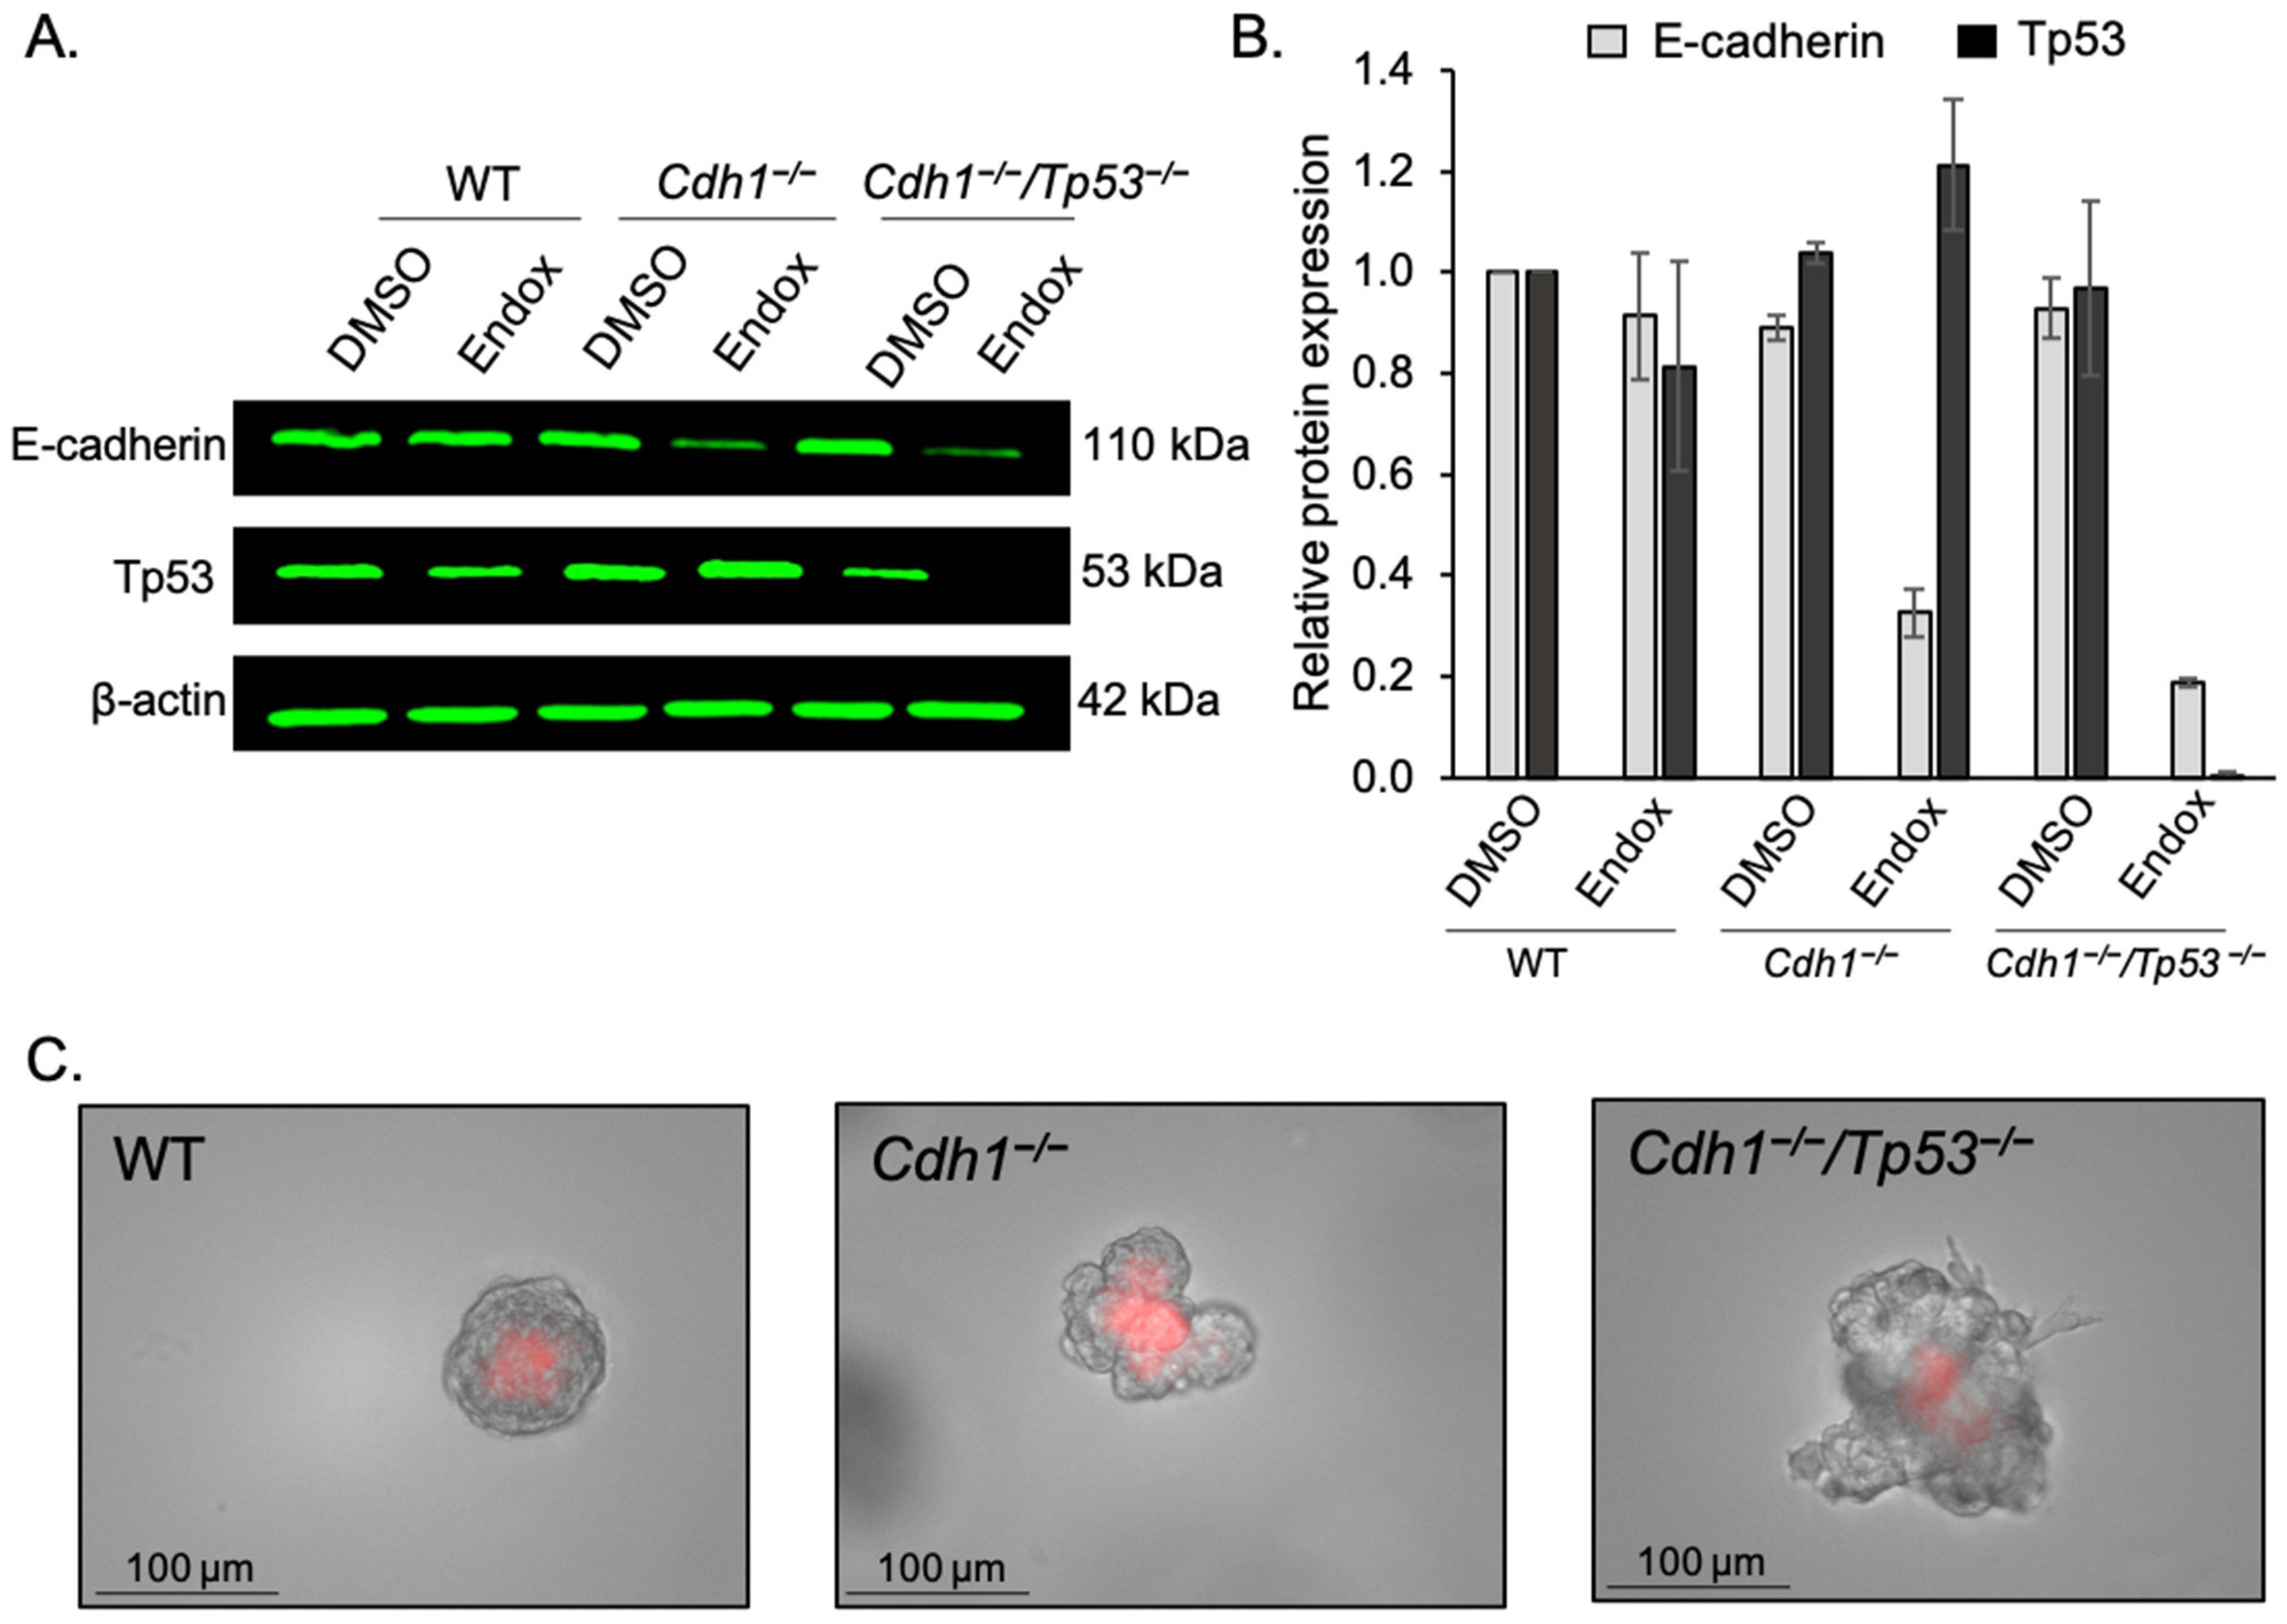
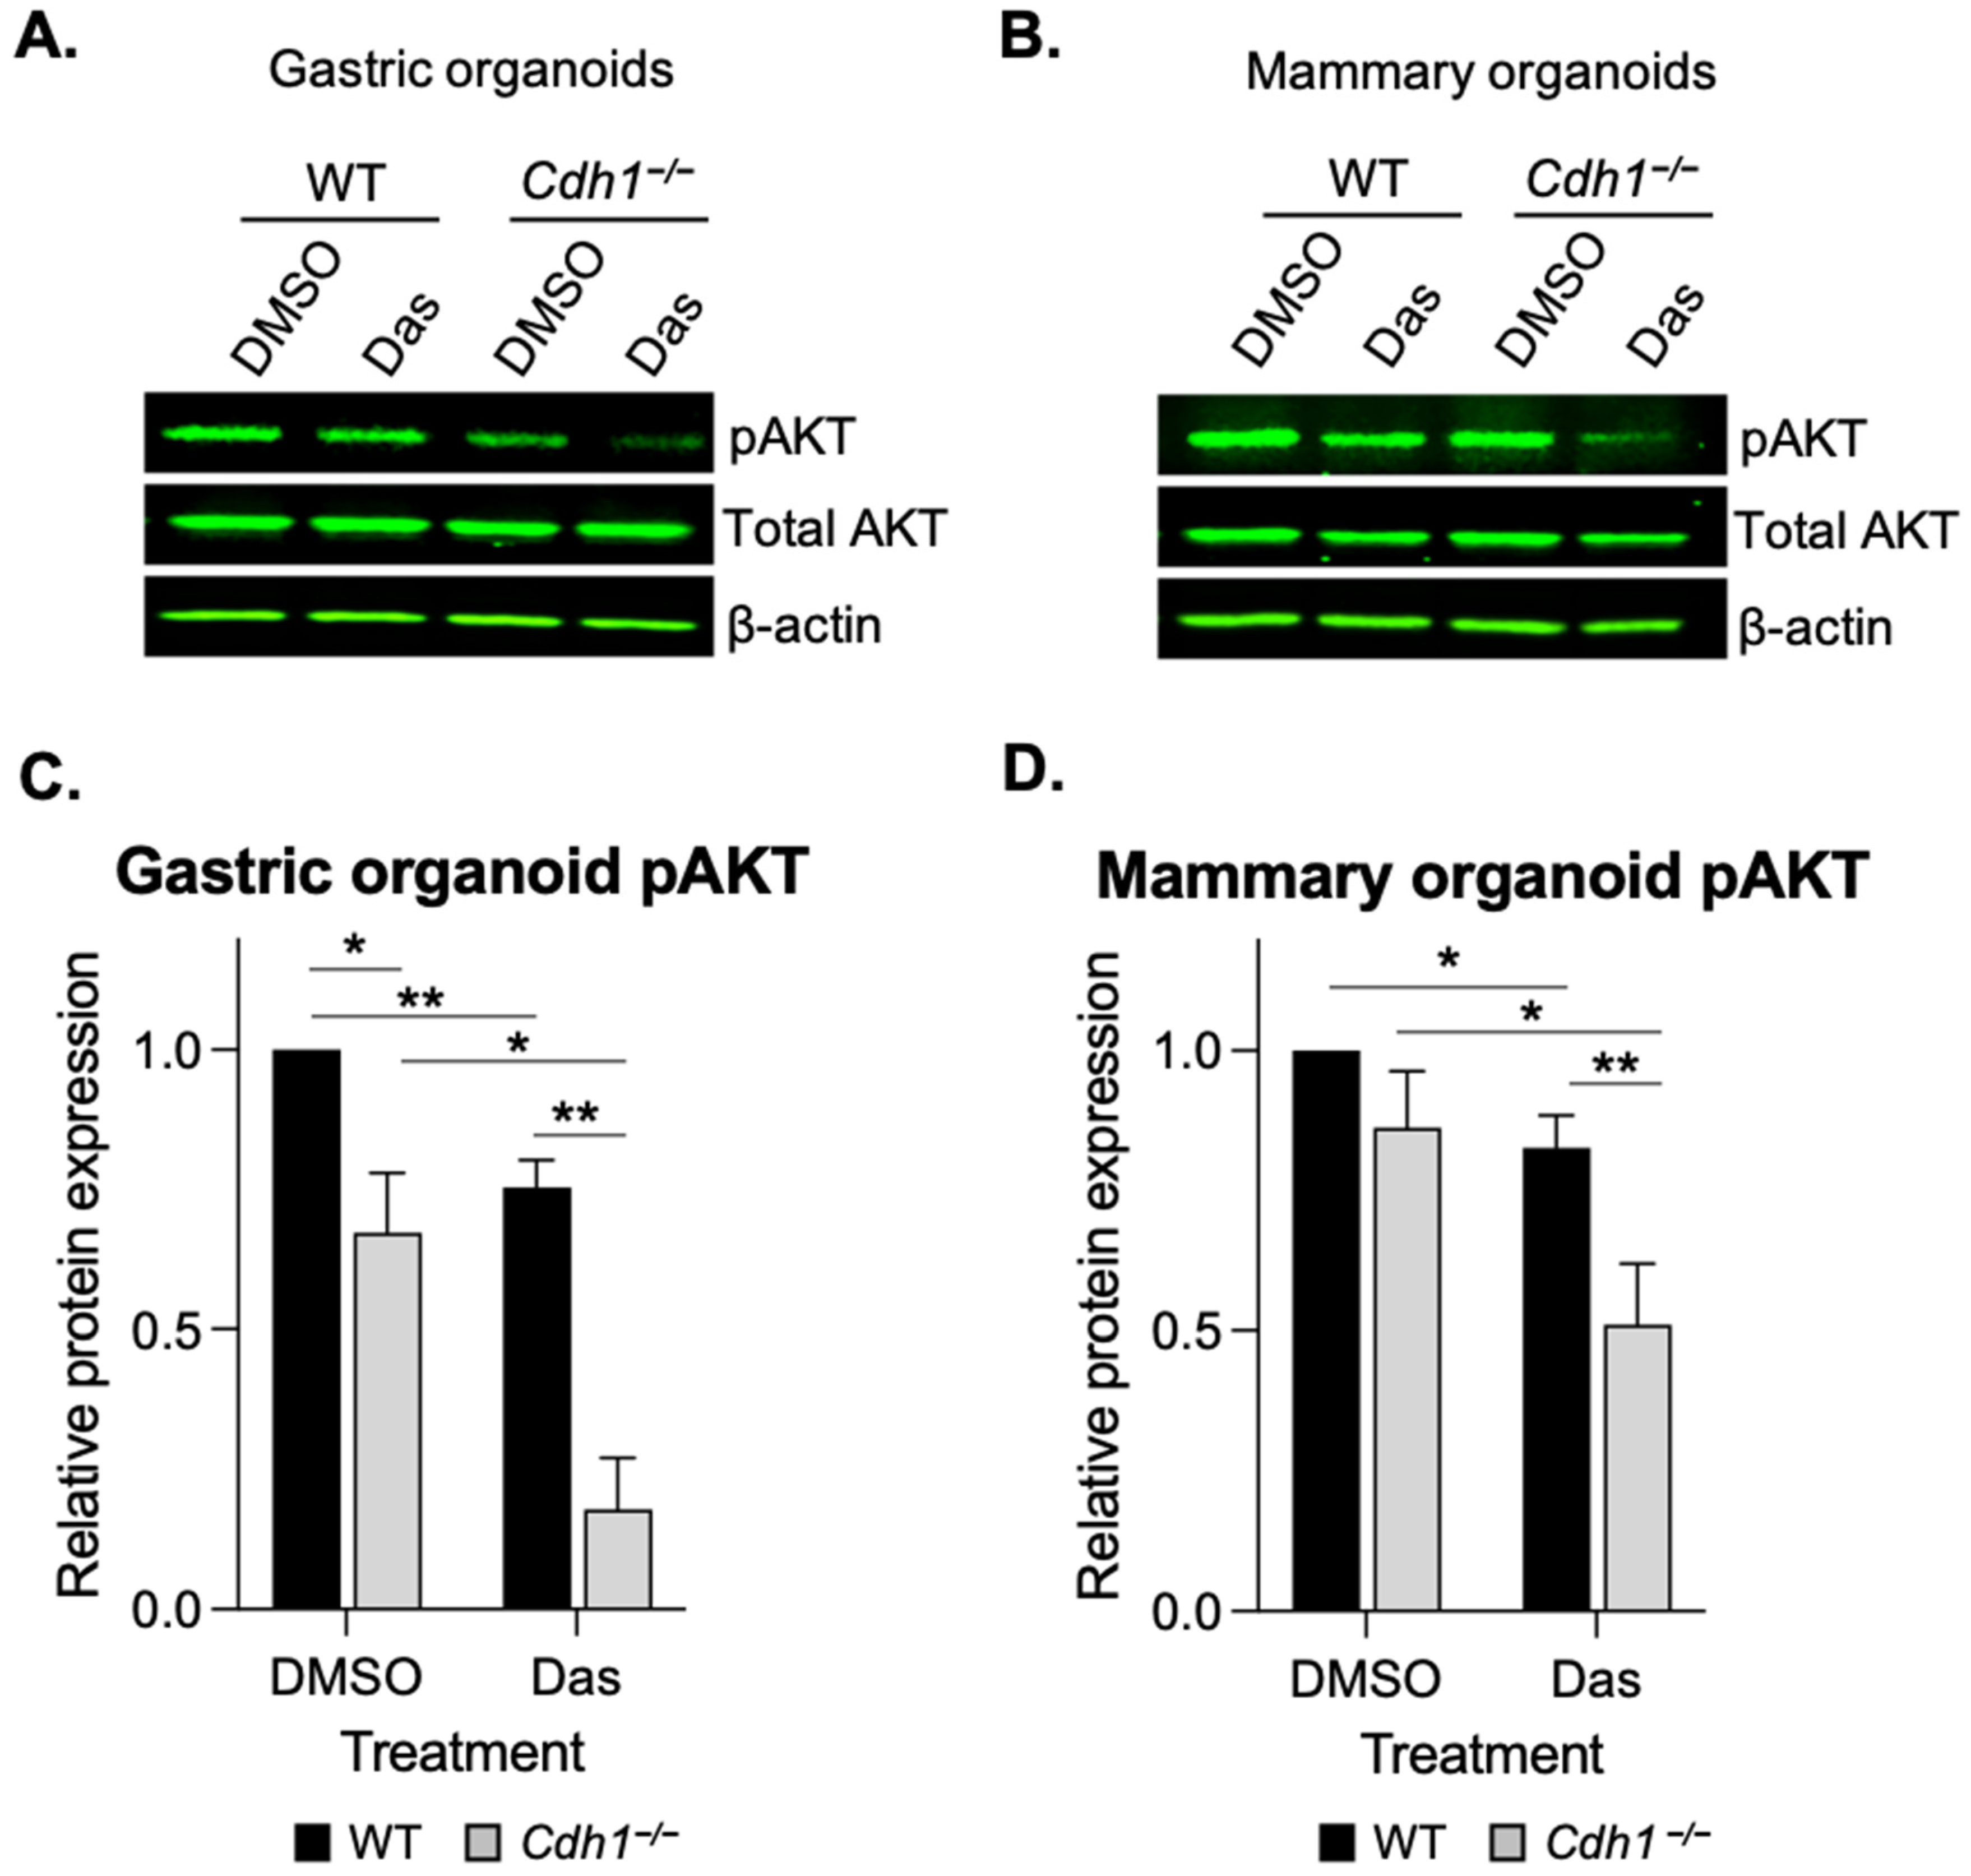
3.4. Dasatinib Inhibits AKT Phosphorylation in Cdh1-Deficient Organoids

To determine if the synthetic lethal relationship between E-cadherin and dasatinib treatment in organoids was at least in part due to drug-induced alterations in the pro-survival AKT cellular signalling pathway, we measured the levels of phosphorylated AKT (pAKT-Ser473) after dasatinib treatment in the WT and Cdh1−/− gastric and mammary organoids. Interestingly, levels of pAKT were significantly lower (19%) in DMSO treated Cdh1−/− gastric organoids compared with WT (Figure 5A,C and Figure S6). pAKT levels were reduced in both WT and Cdh1−/− gastric organoids after 24 h of dasatinib treatment, by 25% in WT and 63% in Cdh1−/− (Figure 6A,C). There was no significant difference in the levels of pAKT and total AKT in DMSO treated WT and Cdh1−/− mammary organoids (Figure 5B,D), however, after treatment with 0.25 µM dasatinib for 24 h, pAKT was preferentially reduced in Cdh1−/− mammary organoids (52% reduction vs. 17% reduction in WT organoids) (Figure 5B,D and Figure S7). Taken together, these results indicate that dasatinib inhibits AKT signalling within both WT/Cdh1−/− mammary and gastric organoids, however the effect is significantly more pronounced in Cdh1−/− organoids.

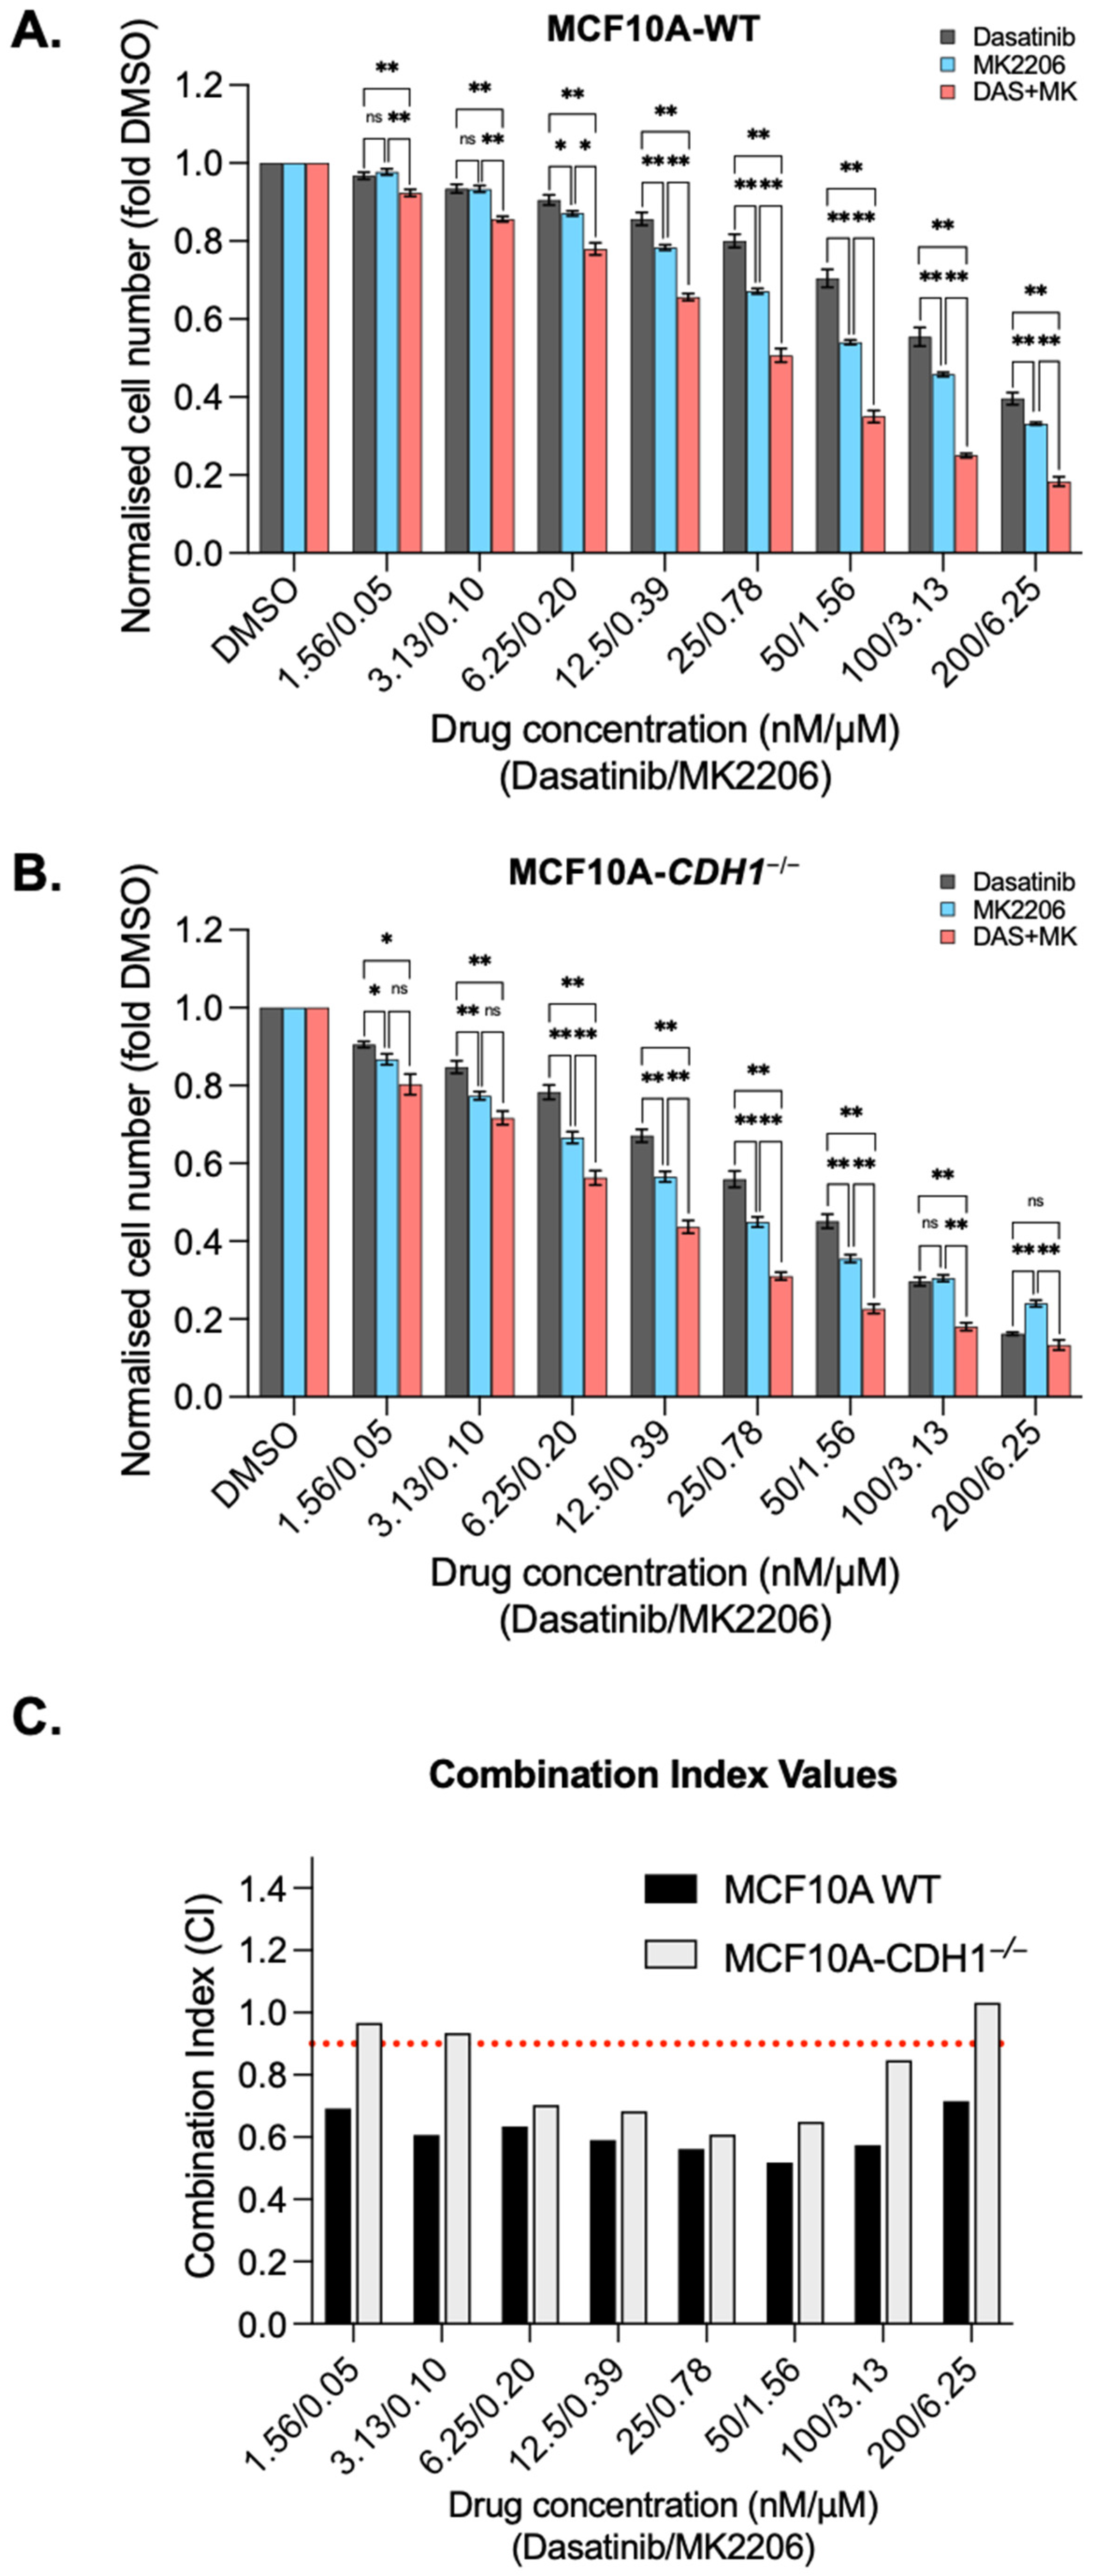
3.5. Dasatinib Is Synergistic with the Allosteric AKT Inhibitor MK2206 in MCF10A Cells

After establishing the synthetic lethal effects of dasatinib, it was next assessed in combination treatment with both the pan-AKT inhibitor MK2206 and the SRC family kinase inhibitor PP1, with the aim of evaluating these combinations for synergistic effects. Synergy could provide an opportunity to reduce doses in future clinical applications, potentially reducing the risk of dose limiting toxicities and improving longer term tolerability. Both MCF10A-WT and MCF10A-CDH1−/− cells exhibited greater sensitivity to combinations of dasatinib and MK2206 than the single agents (Figure 6A,B) at most concentrations tested. A combination index (CI) value was calculated at each treatment concentration for the combinations, with values less than 0.9 considered synergistic, and those above 1.1 antagonistic [59]. The CI values demonstrate that combination treatment of dasatinib/MK2206 is synergistic in both WT and CDH1−/− cells from 6.3 nM /0.2 µM (Dasatinib/MK2206) to 100 nM/3.1 µM treatments (Figure 6C).
Combination treatment with dasatinib and PP1 produced a significant inhibition of cell growth compared to the inhibition seen in either single agent in the highest four concentrations in WT cells and at the three highest concentrations in CDH1−/− cells (Figure S4A,B). However, the reduction in cell number seen with combination treatment was only synergistic in WT cells, with highly synergistic CI at the two highest combination concentrations tested (0.5 and 0.4, respectively). (Figure S4C). Interestingly, combination treatment with dasatinib/PP1 appeared to be markedly antagonistic in WT cells at mid-ranges, with CI values of 2.9 (at 6.25 nM /1.25 µM dasatinib/PP1) and 2.1 (at 12.5 nM/2.5 µM dasatinib/PP1) (Figure S4C). While significant reductions in CDH1−/− cell number were achieved at selected concentrations using this combination, due to the effect of the individual drugs in this cell line, this combination demonstrated an additive (CI 0.9–1.1) interaction at most concentrations tested. (Figure S4C). The difference in synergy between the two drug combinations tested may reflect the extent of overlap between the respective targets of each drug combination, with the synthetic lethal targets of dasatinib/PP1 likely to be more overlapped than dasatinib/MK2206. While there is potential for dasatinib-AKT inhibitor combinations to be useful clinically, the similar level of synergy in both WT and CDH1−/− cells suggests that this combination may not increase the available therapeutic index between normal cells and early CDH1-null cancers.

4. Discussion

We have previously shown that AKT3, but not AKT1 or AKT2, is upregulated in gastric cancers with low CDH1 expression and have identified an E-cadherin-AKT synthetic lethal relationship [25]. Since isoform-specific AKT inhibitors are not yet available, we have aimed to identify non-direct routes to specifically target AKT3 signalling in E-cadherin-deficient cells. Through differential expression and Reactome pathway analysis, we identified ECM remodelling pathways as potential upstream regulators of AKT3. The most strongly associated gene was the tyrosine kinase receptor DDR2, leading us to test the nanomolar range inhibitor dasatinib in our E-cadherin-null models [51].
In normal cells, DDR2 is a receptor for collagen (preferentially fibrillar collagens and the non-fibrillar collagens II and X [43,60]) and is involved in the transduction of cues from the binding of ECM collagens in order to activate signalling networks that support normal cellular function [43]. Functionally, DDR2 activity and downstream signalling has been associated with cell proliferation, survival, adhesion, spreading and differentiation [60]. Activated DDR2 has been shown to signal through a number of pathways including ERK, MAPK, PI3K and possibly FAK [61,62] Induction of EMT in a variety of model systems has been demonstrated to correlate with a switch from the expression of the more epithelial DDR1 to the more mesenchymal DDR2 [60,63]. In a human mammary epithelial cell line, the expression of EMT inducers, such as Snail, Slug and TGF-ß induced an “EMT core signature” which included an upregulation of DDR2 expression concomitant to a down regulation of DDR1 [64]. Of particular interest, DDR2 has been demonstrated to stabilise Snail1 protein in breast cells and a significant association Snail1, lack of E-cadherin and presence of DDR2 expression was observed in samples of human breast cancer [65]. Snail is a key regulator of EMT, and its expression represses E-cadherin [66]. Deregulation of DDR2 expression and/or signalling has been associated with a wide variety of cancers including lung cancer, breast cancer, lymphoma and leukaemia [60]. In addition, DDR2 has previously been implicated as a driver of gastric cancer dissemination [44]. As a plasma membrane bound receptor, DDR2 presents as an attractive therapeutic target for a variety of cancers, inflammatory conditions, as well as brain and renal disease [67].
As dasatinib is not exclusively an inhibitor of DDR2 (also exhibiting a well characterised inhibition of BCR-ABL and SRC) it is possible that a combination of dasatinib targets is contributing to the synthetic lethal effect seen in our E-cadherin-deficient models. Inhibition of SRC family kinases is of particular interest as we have previously seen a synthetic lethal effect with the SRC family inhibitors saracatinib, PP1 and PP2 in MCF10A cells lacking CDH1 [23,68]. SRC and DDR2 are intimately linked, with SRC associating with, and phosphorylating, DDR2 on tyrosine residues (in an activation loop) after collagen binding. This leads to DDR2 activity and additional association with the adaptor molecule Shc [69,70]. Shc proteins typically exert their effects via activation of MAPK and PI3K/AKT signalling pathways [71]. SRC can also directly interact with AKT and phosphorylate tyrosine residues [72] leading to optimal activation of AKT in vitro and in vivo [73]. Interestingly, dual inhibition of SRC and DDR2 with a novel small molecule drug has been shown to lead to superior growth inhibition (compared with inhibition of DDR2 alone) in lung cells harbouring DDR2 mutations [74].
In this study, treatment with dasatinib led to a reduction in phosphorylated AKT in both WT and Cdh1−/− organoids (mammary and gastric), but the inhibitory effect was significantly more pronounced in E-cadherin-deficient organoids. This indicates that inhibition of AKT signalling contributes to the synthetic lethal effect of dasatinib in our E-cadherin-deficient models, although other downstream pathways that are regulated by the SRC family, including FAK and MAPK signalling, are also likely to be involved.
When combined with dasatinib in MCF10A-WT and CDH1−/− cells, MK2206 exhibited synergy, indicating that the simultaneous targeting of SRC, DDR2 and AKT may be effective in specifically targeting E-cadherin-deficient cancer cells. However, because this synergy was also seen in WT cells, this particular drug combination may not increase the therapeutic window. To achieve clinical utility for HDGC chemoprevention, a combination which is more synergistic in CDH1-null cells compared to WT across all practical concentrations is likely to be necessary. We also tested dasatinib in combination with PP1, a reversible, ATP-competitive and selective inhibitor of the SRC family of protein tyrosine kinases. This combination was neither significantly synergistic nor antagonistic in CDH1−/− cells, suggesting that this drug combination will not be useful for targeting E-cadherin-deficient cancers. Since both dasatinib and PP1 inhibit SRC, this may indicate that future selection of combinations could benefit from combining drugs which target distinct vulnerabilities in CDH1−/− cells.
Dasatinib is currently approved for the treatment of imatinib-resistant or intolerant chronic myeloid leukaemia and Philadelphia-positive acute lymphoblastic leukaemia [75]. However, there are a number of clinical trials underway to evaluate it in solid tumours (clinicaltrials.gov accessed on 20 January 2022). Dasatinib causes several adverse events, such as anaemia, thrombocytopenia, pleural effusion/fluid retention, GI disorders, skin rashes, fatigue and diarrhoea [75]. Although these side effects are manageable, we anticipate that significantly less toxicity will be a requirement for chemoprevention strategies for E-cadherin-null cancers. This may be achieved simply through lower dose (enabled by the low clinical urgency that exists in a chemoprevention setting) or synergistic combinations.
Alternative strategies for drug delivery systems will also contribute to lessening treatment toxicity. In the context of LBC chemoprevention, transdermal delivery of treatments may be an effective approach. The breast is a promising tissue to benefit from transdermal therapies due to its embryonic origin as a skin appendage, well developed internal lymphatic and venous circulation to aid in drug circulation within the breast and the presence of fat layers to aid in localised drug accumulation [76,77,78]. To date, transdermal delivery of chemopreventative drugs (such as the tamoxifen metabolite 4-hydroxytamoxifen and chemotherapeutic agents (including dasatinib and docetaxel) have been extensively explored in murine models with promising results [79,80]. Additionally, human clinical studies have confirmed this mode of drug delivery leads to a sharp restriction in plasma levels of the drugs, which would most likely reduce systemic side effects, as well as having drug distribution within the breast equivalent to oral dosing [81,82]. One of the challenges with local transdermal delivery of drugs is the properties of the drugs themselves, with some drugs not readily permeating the skin. This may be overcome using different gel formulations, the binding of drugs to more soluble factors, or incorporation of the drugs into micellar nanostructures [79,80,83]. Comparable delivery systems that deliver and retain drugs in close proximity to the gastric mucosa could also be used to minimise systemic toxicity during chemoprevention. For example, release of drug only in the acidic environment of the stomach, combined with a gastro-retentive formulation to mitigate the effect of gastric emptying, would lead to increased drug delivery at the target site and reduce off-target effects during repeated drug administration.

5. Conclusions

We have identified that breast cells and mouse-derived organoids (mammary and gastric) that are deficient in E-cadherin have increased sensitivity to the multi-kinase inhibitor dasatinib. This effect is likely to be at least partly attributable to dasatinib’s inhibition of DDR2 and SRC, and indirect effects on AKT3 signalling. The identification of the synthetic lethal relationship between E-cadherin and dasatinib indicates that inhibition of the DDR2-SRC-AKT3 axis may be a novel strategy for the treatment of hereditary and sporadic cancers with mutations in the CDH1 gene.

Supplementary Materials

The following are available online at https://www.mdpi.com/article/10.3390/cancers14071609/s1, Table S1: Organoid media components, Table S2: Genes that were associated with both AKT1 and AKT3, Table S3: The 51 significantly AKT3 associated genes with a fold change in expression >2 between high and low AKT3 expressing samples in both the GEO and TCGA datasets. Figure S1. Treatment with the DDR2 inhibitor WRG-028 is synthetic lethal in E-cadherin deficient mammary epithelial cells. Figure S2. N87 gastric cells lacking CDH1 are less sensitive to dasatinib than WT cells. Figure S3. Mouse derived organoids containing Cdh1−/− cells are more sensitive to the growth inhibiting effects of allosteric AKT inhibitors. Figure S4. Combining dasatinib with the SRC inhibitor PP1 is synergistic in MCF10A cells at higher concentrations, Figure S5. Uncropped western blots: mammary organoid induction test, Figure S6. Uncropped western blots: gastric organoids +/− dasatinib, Figure S7. Uncropped western blots: mammary organoids +/− dasatinib.

Author Contributions

Conceptualization, N.B.-Z. and P.G.; methodology, N.B.-Z., L.D.-E., W.M., M.A.B. and P.G.; software, K.R., J.P. and M.A.B.; validation, L.D.-E., W.M., K.R., J.P. and T.G.; formal analysis, N.B.-Z., W.M., K.R. and J.P.; investigation, N.B.-Z. and P.G.; resources, P.G.; data curation, N.B.-Z.; writing—original draft preparation, N.B.-Z., K.R., M.A.B. and P.G.; writing—review and editing, N.B.-Z., L.D.-E., W.M., K.R., T.G., M.A.B. and P.G.; visualization, N.B.-Z. and P.G.; supervision, P.G.; project administration, P.G.; funding acquisition, P.G. All authors have read and agreed to the published version of the manuscript.

Funding

This research was funded by Health Research Council of New Zealand: grant number 17/610.

Institutional Review Board Statement

The study was conducted according to the guidelines of the Declaration of Helsinki, and approved by the Institutional Review Board (or Ethics Committee) of University of Otago (AUP-19-149).

Informed Consent Statement

Not applicable.

Data Availability Statement

The data presented in this study are available on request from the corresponding author.

Acknowledgments

Sincere thanks to Sarah Diermeier for her guidance and advice regarding mammary organoid generation.

Conflicts of Interest

The authors declare no conflict of interest.

References

  1. Blair, V.R.; McLeod, M.; Carneiro, F.; Coit, D.G.; D’Addario, J.L.; van Dieren, J.M.; Harris, K.L.; Hoogerbrugge, N.; Oliveira, C.; van der Post, R.S.; et al. Hereditary Diffuse Gastric Cancer: Updated Clinical Practice Guidelines. Lancet Oncol. 2020, 21, e386–e397. [Google Scholar] [CrossRef]
  2. Guilford, P.; Hopkins, J.; Harraway, J.; McLeod, M.; McLeod, N.; Harawira, P.; Taite, H.; Scoular, R.; Miller, A.; Reeve, A.E. E-Cadherin Germline Mutations in Familial Gastric Cancer. Nature 1998, 392, 402–405. [Google Scholar] [CrossRef]
  3. Hansford, S.; Kaurah, P.; Li-Chang, H.; Woo, M.; Senz, J.; Pinheiro, H.; Schrader, K.A.; Schaeffer, D.F.; Shumansky, K.; Zogopoulos, G.; et al. Hereditary Diffuse Gastric Cancer Syndrome: CDH1 Mutations and Beyond. JAMA Oncol. 2015, 1, 23–32. [Google Scholar] [CrossRef] [Green Version]
  4. Xicola, R.M.; Li, S.; Rodriguez, N.; Reinecke, P.; Karam, R.; Speare, V.; Black, M.H.; LaDuca, H.; Llor, X. Clinical Features and Cancer Risk in Families with Pathogenic CDH1 Variants Irrespective of Clinical Criteria. J. Med. Genet. 2019, 56, 838–843. [Google Scholar] [CrossRef] [Green Version]
  5. Roberts, M.E.; Ranola, J.M.O.; Marshall, M.L.; Susswein, L.R.; Graceffo, S.; Bohnert, K.; Tsai, G.; Klein, R.T.; Hruska, K.S.; Shirts, B.H. Comparison of CDH1 Penetrance Estimates in Clinically Ascertained Families vs Families Ascertained for Multiple Gastric Cancers. JAMA Oncol. 2019, 5, 1325–1331. [Google Scholar] [CrossRef] [PubMed]
  6. Pharoah, P.D.P.; Guilford, P.; Caldas, C. Incidence of Gastric Cancer and Breast Cancer in CDH1 (E-Cadherin) Mutation Carriers from Hereditary Diffuse Gastric Cancer Families. Gastroenterology 2001, 121, 1348–1353. [Google Scholar] [CrossRef]
  7. Becker, K.F.; Atkinson, M.J.; Reich, U.; Becker, I.; Nekarda, H.; Siewert, J.R.; Höfler, H. E-Cadherin Gene Mutations Provide Clues to Diffuse Type Gastric Carcinomas. Cancer Res. 1994, 54, 3845–3852. [Google Scholar] [PubMed]
  8. Vos, C.B.; Cleton-Jansen, A.M.; Berx, G.; de Leeuw, W.J.; ter Haar, N.T.; van Roy, F.; Cornelisse, C.J.; Peterse, J.L.; van de Vijver, M.J. E-Cadherin Inactivation in Lobular Carcinoma in Situ of the Breast: An Early Event in Tumorigenesis. Br. J. Cancer 1997, 76, 1131–1133. [Google Scholar] [CrossRef] [Green Version]
  9. Barroso-Sousa, R.; Metzger-Filho, O. Differences between Invasive Lobular and Invasive Ductal Carcinoma of the Breast: Results and Therapeutic Implications. Ther. Adv. Med. Oncol. 2016, 8, 261–266. [Google Scholar] [CrossRef] [Green Version]
  10. Choi, I.J.; Kim, C.G.; Lee, J.Y.; Kim, Y.-I.; Kook, M.-C.; Park, B.; Joo, J. Family History of Gastric Cancer and Helicobacter Pylori Treatment. N. Engl. J. Med. 2020, 382, 427–436. [Google Scholar] [CrossRef]
  11. King, T.A.; Pilewskie, M.; Muhsen, S.; Patil, S.; Mautner, S.K.; Park, A.; Oskar, S.; Guerini-Rocco, E.; Boafo, C.; Gooch, J.C.; et al. Lobular Carcinoma in Situ: A 29-Year Longitudinal Experience Evaluating Clinicopathologic Features and Breast Cancer Risk. J. Clin. Oncol. 2015, 33, 3945–3952. [Google Scholar] [CrossRef] [PubMed]
  12. van Nes, J.G.H.; Fontein, D.B.Y.; Hille, E.T.M.; Voskuil, D.W.; van Leeuwen, F.E.; de Haes, J.C.J.M.; Putter, H.; Seynaeve, C.; Nortier, J.W.R.; van de Velde, C.J.H. Quality of Life in Relation to Tamoxifen or Exemestane Treatment in Postmenopausal Breast Cancer Patients: A Tamoxifen Exemestane Adjuvant Multinational (TEAM) Trial Side Study. Breast Cancer Res. Treat. 2012, 134, 267–276. [Google Scholar] [CrossRef] [PubMed] [Green Version]
  13. Wills, S.M.; Zekman, R.; Bestul, D.; Kuwajerwala, N.; Decker, D. Tamoxifen Malabsorption after Roux-En-Y Gastric Bypass Surgery: Case Series and Review of the Literature. Pharmacotherapy 2010, 30, 217. [Google Scholar] [CrossRef]
  14. He, W.; Eriksson, M.; Eliasson, E.; Grassmann, F.; Bäcklund, M.; Gabrielson, M.; Hammarström, M.; Margolin, S.; Thorén, L.; Wengström, Y.; et al. CYP2D6 Genotype Predicts Tamoxifen Discontinuation and Drug Response: A Secondary Analysis of the KARISMA Trial. Ann. Oncol. 2021, 32, 1286–1293. [Google Scholar] [CrossRef] [PubMed]
  15. Al-Batran, S.-E.; Homann, N.; Pauligk, C.; Goetze, T.O.; Meiler, J.; Kasper, S.; Kopp, H.-G.; Mayer, F.; Haag, G.M.; Luley, K.; et al. Perioperative Chemotherapy with Fluorouracil plus Leucovorin, Oxaliplatin, and Docetaxel versus Fluorouracil or Capecitabine plus Cisplatin and Epirubicin for Locally Advanced, Resectable Gastric or Gastro-Oesophageal Junction Adenocarcinoma (FLOT4): A Randomised, Phase 2/3 Trial. Lancet 2019, 393, 1948–1957. [Google Scholar] [CrossRef]
  16. Bittoni, A.; Scartozzi, M.; Giampieri, R.; Faloppi, L.; Bianconi, M.; Mandolesi, A.; Del Prete, M.; Pistelli, M.; Cecchini, L.; Bearzi, I.; et al. Clinical Evidence for Three Distinct Gastric Cancer Subtypes: Time for a New Approach. PLoS ONE 2013, 8, e78544. [Google Scholar] [CrossRef] [Green Version]
  17. Park, S.H.; Sohn, T.S.; Lee, J.; Lim, D.H.; Hong, M.E.; Kim, K.-M.; Sohn, I.; Jung, S.H.; Choi, M.G.; Lee, J.H.; et al. Phase III Trial to Compare Adjuvant Chemotherapy With Capecitabine and Cisplatin Versus Concurrent Chemoradiotherapy in Gastric Cancer: Final Report of the Adjuvant Chemoradiotherapy in Stomach Tumors Trial, Including Survival and Subset Analyses. J. Clin. Oncol. 2015, 33, 3130–3136. [Google Scholar] [CrossRef] [Green Version]
  18. Schulz, C.; Kullmann, F.; Kunzmann, V.; Fuchs, M.; Geissler, M.; Vehling-Kaiser, U.; Stauder, H.; Wein, A.; Al-Batran, S.-E.; Kubin, T.; et al. NeoFLOT: Multicenter Phase II Study of Perioperative Chemotherapy in Resectable Adenocarcinoma of the Gastroesophageal Junction or Gastric Adenocarcinoma-Very Good Response Predominantly in Patients with Intestinal Type Tumors. Int. J. Cancer 2015, 137, 678–685. [Google Scholar] [CrossRef]
  19. Dessauvagie, B.; Thomas, A.; Thomas, C.; Robinson, C.; Combrink, M.; Budhavaram, V.; Kunjuraman, B.; Meehan, K.; Sterrett, G.; Harvey, J. Invasive Lobular Carcinoma of the Breast: Assessment of Proliferative Activity Using Automated Ki-67 Immunostaining. Pathology 2019, 51, 681–687. [Google Scholar] [CrossRef]
  20. Wilson, N.; Ironside, A.; Diana, A.; Oikonomidou, O. Lobular Breast Cancer: A Review. Front. Oncol. 2021, 10, 591399. [Google Scholar] [CrossRef]
  21. Delpech, Y.; Coutant, C.; Hsu, L.; Barranger, E.; Iwamoto, T.; Barcenas, C.H.; Hortobagyi, G.N.; Rouzier, R.; Esteva, F.J.; Pusztai, L. Clinical Benefit from Neoadjuvant Chemotherapy in Oestrogen Receptor-Positive Invasive Ductal and Lobular Carcinomas. Br. J. Cancer 2013, 108, 285–291. [Google Scholar] [CrossRef] [PubMed] [Green Version]
  22. Metzger Filho, O.; Giobbie-Hurder, A.; Mallon, E.; Gusterson, B.; Viale, G.; Winer, E.P.; Thürlimann, B.; Gelber, R.D.; Colleoni, M.; Ejlertsen, B.; et al. Relative Effectiveness of Letrozole Compared With Tamoxifen for Patients With Lobular Carcinoma in the BIG 1-98 Trial. J. Clin. Oncol. 2015, 33, 2772–2779. [Google Scholar] [CrossRef] [PubMed]
  23. Brew, T.; Bougen-Zhukov, N.; Mitchell, W.; Decourtye, L.; Schulpen, E.; Nouri, Y.; Godwin, T.; Guilford, P. Loss of E-Cadherin Leads to Druggable Vulnerabilities in Sphingolipid Metabolism and Vesicle Trafficking. Cancers 2022, 14, 102. [Google Scholar] [CrossRef]
  24. Decourtye-Espiard, L.; Bougen-Zhukov, N.; Godwin, T.; Brew, T.; Schulpen, E.; Black, M.A.; Guilford, P. E-Cadherin-Deficient Epithelial Cells Are Sensitive to HDAC Inhibitors. Cancers 2022, 14, 175. [Google Scholar] [CrossRef]
  25. Bougen-Zhukov, N.; Nouri, Y.; Godwin, T.; Taylor, M.; Hakkaart, C.; Single, A.; Brew, T.; Permina, E.; Chen, A.; Black, M.A.; et al. Allosteric AKT Inhibitors Target Synthetic Lethal Vulnerabilities in E-Cadherin-Deficient Cells. Cancers 2019, 11, 1359. [Google Scholar] [CrossRef] [PubMed] [Green Version]
  26. Nakatani, K.; Thompson, D.A.; Barthel, A.; Sakaue, H.; Liu, W.; Weigel, R.J.; Roth, R.A. Up-Regulation of Akt3 in Estrogen Receptor-Deficient Breast Cancers and Androgen-Independent Prostate Cancer Lines. J. Biol. Chem. 1999, 274, 21528–21532. [Google Scholar] [CrossRef] [Green Version]
  27. Hinz, N.; Jücker, M. Distinct Functions of AKT Isoforms in Breast Cancer: A Comprehensive Review. Cell Commun. Signal. 2019, 17, 154. [Google Scholar] [CrossRef] [PubMed] [Green Version]
  28. Buikhuisen, J.Y.; Gomez Barila, P.M.; Torang, A.; Dekker, D.; de Jong, J.H.; Cameron, K.; Vitale, S.; Stassi, G.; van Hooff, S.R.; Castro, M.A.A.; et al. AKT3 Expression in Mesenchymal Colorectal Cancer Cells Drives Growth and Is Associated with Epithelial-Mesenchymal Transition. Cancers 2021, 13, 801. [Google Scholar] [CrossRef]
  29. Lv, J.; Zhang, S.; Liu, Y.; Li, C.; Guo, T.; Zhang, S.; Li, Z.; Jiao, Z.; Sun, H.; Zhang, Y.; et al. NR2F1-AS1/MiR-190a/PHLDB2 Induces the Epithelial–Mesenchymal Transformation Process in Gastric Cancer by Promoting Phosphorylation of AKT3. Front. Cell Dev. Biol. 2021, 9, 688949. [Google Scholar] [CrossRef]
  30. Chin, Y.R.; Yoshida, T.; Marusyk, A.; Beck, A.H.; Polyak, K.; Toker, A. Targeting Akt3 Signaling in Triple-Negative Breast Cancer. Cancer Res. 2014, 74, 964–973. [Google Scholar] [CrossRef] [Green Version]
  31. Shrivastava, A.; Radziejewski, C.; Campbell, E.; Kovac, L.; McGlynn, M.; Ryan, T.E.; Davis, S.; Goldfarb, M.P.; Glass, D.J.; Lemke, G.; et al. An Orphan Receptor Tyrosine Kinase Family Whose Members Serve as Nonintegrin Collagen Receptors. Mol. Cell 1997, 1, 25–34. [Google Scholar] [CrossRef]
  32. The Cancer Genome Atlas Research Network. Comprehensive Molecular Characterization of Gastric Adenocarcinoma. Nature 2014, 513, 202–209. [Google Scholar] [CrossRef] [PubMed] [Green Version]
  33. Cristescu, R.; Lee, J.; Nebozhyn, M.; Kim, K.-M.; Ting, J.C.; Wong, S.S.; Liu, J.; Yue, Y.G.; Wang, J.; Yu, K.; et al. Molecular Analysis of Gastric Cancer Identifies Subtypes Associated with Distinct Clinical Outcomes. Nat. Med. 2015, 21, 449–456. [Google Scholar] [CrossRef]
  34. Law, C.W.; Chen, Y.; Shi, W.; Smyth, G.K. Voom: Precision Weights Unlock Linear Model Analysis Tools for RNA-Seq Read Counts. Genome Biol. 2014, 15, R29. [Google Scholar] [CrossRef] [Green Version]
  35. R Core Team. R: A Language and Environment for Statistical Computing; R Foundation for Statistical Computing: Vienna, Austria, 2019. [Google Scholar]
  36. Bolstad, B.M.; Irizarry, R.A.; Astrand, M.; Speed, T.P. A Comparison of Normalization Methods for High Density Oligonucleotide Array Data Based on Variance and Bias. Bioinformatics 2003, 19, 185–193. [Google Scholar] [CrossRef] [Green Version]
  37. Jassal, B.; Matthews, L.; Viteri, G.; Gong, C.; Lorente, P.; Fabregat, A.; Sidiropoulos, K.; Cook, J.; Gillespie, M.; Haw, R.; et al. The Reactome Pathway Knowledgebase. Nucleic Acids Res. 2020, 48, D498–D503. [Google Scholar] [CrossRef] [PubMed]
  38. Young, M.D.; Wakefield, M.J.; Smyth, G.K.; Oshlack, A. Gene Ontology Analysis for RNA-Seq: Accounting for Selection Bias. Genome Biol. 2010, 11, R14. [Google Scholar] [CrossRef] [Green Version]
  39. Single, A.; Beetham, H.; Telford, B.J.; Guilford, P.; Chen, A. A Comparison of Real-Time and Endpoint Cell Viability Assays for Improved Synthetic Lethal Drug Validation. J. Biomol. Screen. 2015, 20, 1286–1293. [Google Scholar] [CrossRef] [PubMed] [Green Version]
  40. Kühn, R.; Torres, R.M. Cre/LoxP Recombination System and Gene Targeting. Methods Mol. Biol. 2002, 180, 175–204. [Google Scholar] [CrossRef]
  41. Ewald, A.J. Isolation of Mouse Mammary Organoids for Long-Term Time-Lapse Imaging. Cold Spring Harb. Protoc. 2013, 2013, 130–133. [Google Scholar] [CrossRef]
  42. Luxenburger, A.; Bougen-Zhukov, N.; Fraser, M.G.; Beetham, H.; Harris, L.D.; Schmidt, D.; Cameron, S.A.; Guilford, P.J.; Evans, G.B. Discovery of AL-GDa62 as a Potential Synthetic Lethal Lead for the Treatment of Gastric Cancer. J. Med. Chem. 2021, 64, 18114–18142. [Google Scholar] [CrossRef]
  43. Leitinger, B. Discoidin Domain Receptor Functions in Physiological and Pathological Conditions. Int. Rev. Cell Mol. Biol. 2014, 310, 39–87. [Google Scholar] [CrossRef] [PubMed] [Green Version]
  44. Kurashige, J.; Hasegawa, T.; Niida, A.; Sugimachi, K.; Deng, N.; Mima, K.; Uchi, R.; Sawada, G.; Takahashi, Y.; Eguchi, H.; et al. Integrated Molecular Profiling of Human Gastric Cancer Identifies DDR2 as a Potential Regulator of Peritoneal Dissemination. Sci. Rep. 2016, 6, 22371. [Google Scholar] [CrossRef] [PubMed]
  45. Wang, Y.-G.; Xu, L.; Jia, R.-R.; Wu, Q.; Wang, T.; Wei, J.; Ma, J.-L.; Shi, M.; Li, Z.-S. DDR2 Induces Gastric Cancer Cell Activities via Activating MTORC2 Signaling and Is Associated with Clinicopathological Characteristics of Gastric Cancer. Dig. Dis. Sci. 2016, 61, 2272–2283. [Google Scholar] [CrossRef]
  46. Chen, P.-F.; Wang, F.; Nie, J.-Y.; Feng, J.-R.; Liu, J.; Zhou, R.; Wang, H.-L.; Zhao, Q. Co-Expression Network Analysis Identified CDH11 in Association with Progression and Prognosis in Gastric Cancer. OncoTargets Ther. 2018, 11, 6425–6436. [Google Scholar] [CrossRef] [PubMed] [Green Version]
  47. Zhang, S.; Zang, D.; Cheng, Y.; Li, Z.; Yang, B.; Guo, T.; Liu, Y.; Qu, X.; Che, X. Identification of Key Gene and Pathways for the Prediction of Peritoneal Metastasis of Gastric Cancer by Co-Expression Analysis. J. Cancer 2020, 11, 3041–3051. [Google Scholar] [CrossRef] [PubMed] [Green Version]
  48. Wu, M.; Ding, Y.; Wu, N.; Jiang, J.; Huang, Y.; Zhang, F.; Wang, H.; Zhou, Q.; Yang, Y.; Zhuo, W.; et al. FSTL1 Promotes Growth and Metastasis in Gastric Cancer by Activating AKT Related Pathway and Predicts Poor Survival. Am. J. Cancer Res. 2021, 11, 712–728. [Google Scholar] [PubMed]
  49. Chen, A.; Beetham, H.; Black, M.A.; Priya, R.; Telford, B.J.; Guest, J.; Wiggins, G.A.R.; Godwin, T.D.; Yap, A.S.; Guilford, P.J. E-Cadherin Loss Alters Cytoskeletal Organization and Adhesion in Non-Malignant Breast Cells but Is Insufficient to Induce an Epithelial-Mesenchymal Transition. BMC Cancer 2014, 14, 552. [Google Scholar] [CrossRef] [Green Version]
  50. Rix, U.; Hantschel, O.; Dürnberger, G.; Remsing Rix, L.L.; Planyavsky, M.; Fernbach, N.V.; Kaupe, I.; Bennett, K.L.; Valent, P.; Colinge, J.; et al. Chemical Proteomic Profiles of the BCR-ABL Inhibitors Imatinib, Nilotinib, and Dasatinib Reveal Novel Kinase and Nonkinase Targets. Blood 2007, 110, 4055–4063. [Google Scholar] [CrossRef]
  51. Day, E.; Waters, B.; Spiegel, K.; Alnadaf, T.; Manley, P.W.; Buchdunger, E.; Walker, C.; Jarai, G. Inhibition of Collagen-Induced Discoidin Domain Receptor 1 and 2 Activation by Imatinib, Nilotinib and Dasatinib. Eur. J. Pharmacol. 2008, 599, 44–53. [Google Scholar] [CrossRef]
  52. Canning, P.; Tan, L.; Chu, K.; Lee, S.W.; Gray, N.S.; Bullock, A.N. Structural Mechanisms Determining Inhibition of the Collagen Receptor DDR1 by Selective and Multi-Targeted Type II Kinase Inhibitors. J. Mol. Biol. 2014, 426, 2457–2470. [Google Scholar] [CrossRef] [PubMed] [Green Version]
  53. Grither, W.R.; Longmore, G.D. Inhibition of Tumor–Microenvironment Interaction and Tumor Invasion by Small-Molecule Allosteric Inhibitor of DDR2 Extracellular Domain. Proc. Natl. Acad. Sci. USA 2018, 115, E7786–E7794. [Google Scholar] [CrossRef] [PubMed] [Green Version]
  54. Godwin, T.D.; Kelly, S.T.; Brew, T.P.; Bougen-Zhukov, N.M.; Single, A.B.; Chen, A.; Stylianou, C.E.; Harris, L.D.; Currie, S.K.; Telford, B.J.; et al. E-Cadherin-Deficient Cells Have Synthetic Lethal Vulnerabilities in Plasma Membrane Organisation, Dynamics and Function. Gastric Cancer 2018, 22, 273–286. [Google Scholar] [CrossRef] [PubMed] [Green Version]
  55. Takeda, H.; Kataoka, S.; Nakayama, M.; Ali, M.A.E.; Oshima, H.; Yamamoto, D.; Park, J.-W.; Takegami, Y.; An, T.; Jenkins, N.A.; et al. CRISPR-Cas9–Mediated Gene Knockout in Intestinal Tumor Organoids Provides Functional Validation for Colorectal Cancer Driver Genes. Proc. Natl. Acad. Sci. USA 2019, 116, 15635–15644. [Google Scholar] [CrossRef] [Green Version]
  56. Ranzani, G.N.; Luinetti, O.; Padovan, L.S.; Calistri, D.; Renault, B.; Burrel, M.; Amadori, D.; Fiocca, R.; Solcia, E. P53 Gene Mutations and Protein Nuclear Accumulation Are Early Events in Intestinal Type Gastric Cancer but Late Events in Diffuse Type. Cancer Epidemiol. Biomark. Prev. 1995, 4, 223–231. [Google Scholar]
  57. Ciriello, G.; Gatza, M.L.; Beck, A.H.; Wilkerson, M.D.; Rhie, S.K.; Pastore, A.; Zhang, H.; McLellan, M.; Yau, C.; Kandoth, C.; et al. Comprehensive Molecular Portraits of Invasive Lobular Breast Cancer. Cell 2015, 163, 506–519. [Google Scholar] [CrossRef] [Green Version]
  58. McCart Reed, A.E.; Foong, S.; Kutasovic, J.R.; Nones, K.; Waddell, N.; Lakhani, S.R.; Simpson, P.T. The Genomic Landscape of Lobular Breast Cancer. Cancers 2021, 13, 1950. [Google Scholar] [CrossRef]
  59. Chou, T.-C. Theoretical Basis, Experimental Design, and Computerized Simulation of Synergism and Antagonism in Drug Combination Studies. Pharmacol. Rev. 2006, 58, 621–681. [Google Scholar] [CrossRef]
  60. Valiathan, R.R.; Marco, M.; Leitinger, B.; Kleer, C.G.; Fridman, R. Discoidin domain receptor tyrosine kinases: New players in cancer progression. Cancer Metastasis Rev. 2012, 31, 295–321. [Google Scholar] [CrossRef] [Green Version]
  61. Liang, Y.; Xia, W.; Zhang, T.; Chen, B.; Wang, H.; Song, X.; Zhang, Z.; Xu, L.; Dong, G.; Jiang, F. Upregulated Collagen COL10A1 Remodels the Extracellular Matrix and Promotes Malignant Progression in Lung Adenocarcinoma. Front. Oncol. 2020, 10, 573534. [Google Scholar] [CrossRef]
  62. Chen, L.; Kong, X.; Fang, Y.; Paunikar, S.; Wang, X.; Brown, J.A.L.; Bourke, E.; Li, X.; Wang, J. Recent Advances in the Role of Discoidin Domain Receptor Tyrosine Kinase 1 and Discoidin Domain Receptor Tyrosine Kinase 2 in Breast and Ovarian Cancer. Front. Cell Dev. Biol. 2021, 9, 47314. [Google Scholar] [CrossRef] [PubMed]
  63. Alves, F.; Vogel, W.; Mossie, K.; Millauer, B.; Höfler, H.; Ullrich, A. Distinct Structural Characteristics of Discoidin I Subfamily Receptor Tyrosine Kinases and Complementary Expression in Human Cancer. Oncogene 1995, 10, 609–618. [Google Scholar] [PubMed]
  64. Taube, J.H.; Herschkowitz, J.I.; Komurov, K.; Zhou, A.Y.; Gupta, S.; Yang, J.; Hartwell, K.; Onder, T.T.; Gupta, P.B.; Evans, K.W.; et al. Core Epithelial-to-Mesenchymal Transition Interactome Gene-Expression Signature Is Associated with Claudin-Low and Metaplastic Breast Cancer Subtypes. Proc. Natl. Acad. Sci. USA 2010, 107, 15449–15454. [Google Scholar] [CrossRef] [Green Version]
  65. Zhang, K.; Corsa, C.A.; Ponik, S.M.; Prior, J.L.; Piwnica-Worms, D.; Eliceiri, K.W.; Keely, P.J.; Longmore, G.D. The Collagen Receptor Discoidin Domain Receptor 2 Stabilizes Snail1 Protein to Facilitate Breast Cancer Metastasis. Nat. Cell Biol. 2013, 15, 677–687. [Google Scholar] [CrossRef] [PubMed]
  66. Cano, A.; Pérez-Moreno, M.A.; Rodrigo, I.; Locascio, A.; Blanco, M.J.; del Barrio, M.G.; Portillo, F.; Nieto, M.A. The Transcription Factor Snail Controls Epithelial-Mesenchymal Transitions by Repressing E-Cadherin Expression. Nat. Cell Biol. 2000, 2, 76–83. [Google Scholar] [CrossRef] [PubMed]
  67. Denny, W.A.; Flanagan, J.U. Inhibitors of Discoidin Domain Receptor (DDR) Kinases for Cancer and Inflammation. Biomolecules 2021, 11, 1671. [Google Scholar] [CrossRef]
  68. Telford, B.J.; Chen, A.; Beetham, H.; Frick, J.; Brew, T.P.; Gould, C.M.; Single, A.; Godwin, T.; Simpson, K.J.; Guilford, P. Synthetic Lethal Screens Identify Vulnerabilities in GPCR Signaling and Cytoskeletal Organization in E-Cadherin-Deficient Cells. Mol. Cancer Ther. 2015, 14, 1213–1223. [Google Scholar] [CrossRef] [Green Version]
  69. Ikeda, K.; Wang, L.-H.; Torres, R.; Zhao, H.; Olaso, E.; Eng, F.J.; Labrador, P.; Klein, R.; Lovett, D.; Yancopoulos, G.D.; et al. Discoidin Domain Receptor 2 Interacts with Src and Shc Following Its Activation by Type I Collagen. J. Biol. Chem. 2002, 277, 19206–19212. [Google Scholar] [CrossRef] [Green Version]
  70. Yang, K.; Kim, J.H.; Kim, H.J.; Park, I.-S.; Kim, I.Y.; Yang, B.-S. Tyrosine 740 Phosphorylation of Discoidin Domain Receptor 2 by Src Stimulates Intramolecular Autophosphorylation and Shc Signaling Complex Formation. J. Biol. Chem. 2005, 280, 39058–39066. [Google Scholar] [CrossRef] [Green Version]
  71. Ahmed, S.B.M.; Prigent, S.A. Insights into the Shc Family of Adaptor Proteins. J. Mol. Signal. 2017, 12, 2. [Google Scholar] [CrossRef] [Green Version]
  72. Jiang, T.; Qiu, Y. Interaction between Src and a C-Terminal Proline-Rich Motif of Akt Is Required for Akt Activation. J. Biol. Chem. 2003, 278, 15789–15793. [Google Scholar] [CrossRef] [PubMed] [Green Version]
  73. Chen, R.; Kim, O.; Yang, J.; Sato, K.; Eisenmann, K.M.; McCarthy, J.; Chen, H.; Qiu, Y. Regulation of Akt/PKB Activation by Tyrosine Phosphorylation. J. Biol. Chem. 2001, 276, 31858–31862. [Google Scholar] [CrossRef] [Green Version]
  74. Terai, H.; Tan, L.; Beauchamp, E.M.; Hatcher, J.M.; Liu, Q.; Meyerson, M.; Gray, N.S.; Hammerman, P.S. Characterization of DDR2 Inhibitors for the Treatment of DDR2 Mutated Nonsmall Cell Lung Cancer. ACS Chem. Biol. 2015, 10, 2687–2696. [Google Scholar] [CrossRef] [PubMed]
  75. Conchon, M.; Freitas, C.M.B.D.M.; Rego, M.A.D.C.; Braga Junior, J.W.R. Dasatinib—Clinical Trials and Management of Adverse Events in Imatinib Resistant/Intolerant Chronic Myeloid Leukemia. Rev. Bras. Hematol. Hemoter. 2011, 33, 131–139. [Google Scholar] [CrossRef] [PubMed] [Green Version]
  76. Ackerman, A.B. The Breast Is Not an Organ. Am. J. Dermatopathol. 2008, 30, 304. [Google Scholar] [CrossRef] [PubMed]
  77. Suami, H.; Pan, W.-R.; Mann, G.B.; Taylor, G.I. The Lymphatic Anatomy of the Breast and Its Implications for Sentinel Lymph Node Biopsy: A Human Cadaver Study. Ann. Surg. Oncol. 2008, 15, 863–871. [Google Scholar] [CrossRef] [Green Version]
  78. Lee, O.; Khan, S.A. Novel Routes for Administering Chemoprevention: Local Transdermal Therapy to the Breasts. Semin. Oncol. 2016, 43, 107–115. [Google Scholar] [CrossRef]
  79. Bathara, M.; Date, T.; Chaudhari, D.; Ghadi, R.; Kuche, K.; Jain, S. Exploring the Promising Potential of High Permeation Vesicle-Mediated Localized Transdermal Delivery of Docetaxel in Breast Cancer To Overcome the Limitations of Systemic Chemotherapy. Mol. Pharm. 2020, 17, 2473–2486. [Google Scholar] [CrossRef]
  80. Wang, H.; Zhang, Y.; Zeng, X.; Pei, W.; Fan, R.; Wang, Y.; Wang, X.; Li, J. A Combined Self-Assembled Drug Delivery for Effective Anti-Breast Cancer Therapy. Int. J. Nanomed. 2021, 16, 2373–2388. [Google Scholar] [CrossRef]
  81. Lee, O.; Ivancic, D.; Allu, S.; Shidfar, A.; Kenney, K.; Helenowski, I.; Sullivan, M.E.; Muzzio, M.; Scholtens, D.; Chatterton, R.T.; et al. Local Transdermal Therapy to the Breast for Breast Cancer Prevention and DCIS Therapy: Preclinical and Clinical Evaluation. Cancer Chemother. Pharmacol. 2015, 76, 1235–1246. [Google Scholar] [CrossRef]
  82. Lee, O.; Pilewskie, M.; Karlan, S.; Tull, M.B.; Benante, K.; Xu, Y.; Blanco, L.; Helenowski, I.; Kocherginsky, M.; Yadav, S.; et al. Local Transdermal Delivery of Telapristone Acetate Through Breast Skin, Compared With Oral Treatment: A Randomized Double-Blind, Placebo-Controlled Phase II Trial. Clin. Pharmacol. Ther. 2021, 109, 728–738. [Google Scholar] [CrossRef] [PubMed]
  83. Neupane, R.; Boddu, S.H.S.; Abou-Dahech, M.S.; Bachu, R.D.; Terrero, D.; Babu, R.J.; Tiwari, A.K. Transdermal Delivery of Chemotherapeutics: Strategies, Requirements, and Opportunities. Pharmaceutics 2021, 13, 960. [Google Scholar] [CrossRef] [PubMed]
Figure 1. Mammary epithelial cells lacking CDH1 expression are preferentially sensitive to the cytotoxic effects of dasatinib. (AD) Normalised MCF10a-WT and CDH1−/− cell counts 48 h after treatment with serial dilutions of dasatinib (A), imatinib mesylate (B), ponatinib (C) and nilotinib (D). Wild-type, black bars, CDH1−/− grey bars. Six fields per well at 4× magnification were captured using the Cytation 5 imager (Biotek). Nuclei were counted using Gen5 (Biotek) and normalised to the vehicle control for each cell line. (For all graphs, error bars = SEM; * p < 0.05, ** p < 0.01 and *** p <0.001; n ≥ 3 independent biological replicates; unpaired two-sided t-test).
Cancers 14 01609 g001
Figure 2. Dasatinib induces apoptosis in mammary cells lacking E-cadherin. (A) Total apoptosis (Annexin-V-FITC and propidium iodide positive cells) (early + late apoptosis) detected by flow cytometry after 72 h drug treatment. (B) Representative histograms of MCF10A-WT and CDH1−/− cells stained with Annexin-V-FITC and propidium iodide and analysed on BD Fortessa flow cytometer. Q4; live cells, Q3; early apoptotic cells and Q2; late apoptotic cells. (For bar graph, error bars = SEM; * p < 0.05; n ≥ 3 independent biological replicates; unpaired two-sided t-test).
Cancers 14 01609 g002
Figure 3. Characterisation of mammary organoids. (A) Endoxifen (endox) mediated knockout of E-cadherin and/or Tp53 in mammary organoids was detected utilizing western blotting. (B) Relative expression of E-cadherin and Tp53 protein in WT, Cdh1−/− and Cdh1−/−Tp53−/− mammary organoids. (C) 20× Brightfield and RFP channel images of mammary organoids induced with endoxifen.
Cancers 14 01609 g003
Figure 4. Mouse-derived organoids containing Cdh1−/− cells are more sensitive to the growth inhibiting effects of dasatinib. Representative photos of WT and Cdh1−/− gastric (A) and mammary (B) organoids after 48 h treatment with DMSO or dasatinib. Bar graphs showing relative area of DMSO or dasatinib treated gastric (C) or mammary (D) organoids. Bar graphs showing relative area of DMSO or dasatinib treated WT or Tp53−/−Cdh1−/− gastric (E) and mammary (F) organoids. (For all graphs, error bars = SEM; * p < 0.05, ** p < 0.01 and *** p <0.001; n ≥ 3 independent biological replicates; unpaired two-sided t-test).
Cancers 14 01609 g004
Figure 5. Dasatinib preferentially inhibits pAKT in mouse derived organoids lacking Cdh1−/−. (A,B) Western blots of pAKT-Ser473 and total AKT levels in gastric (A) and mammary (B) organoids treated with DMSO or dasatinib (0.5 µM) for 24 h. (C,D) Relative expression of pAKT gastric (C) and mammary (D) organoids. (For all graphs, error bars = SEM; * p < 0.05, ** p < 0.01; n ≥ 3 independent biological replicates; unpaired two-sided t-test).
Cancers 14 01609 g005
Figure 6. Combining dasatinib with the allosteric AKT inhibitor MK2206 is synergistic in MCF10A cells. Normalised MCF10A-WT (A) and CDH1−/− (B) cell counts 48 h after treatment with serial dilutions of dasatinib, MK2206 or a combination of dasatinib and MK2206. (C) Combination index (CI) values for MCF10A-WT and CDH1−/− cells treated with combination of dasatinib and MK2206. Values below 0.9 indicate the drug combination is synergistic at that concentration. For all graphs, error bars = SEM; ns: p > 0.05, * p < 0.05, ** p < 0.01; n ≥ 3 independent biological replicates; unpaired two-sided t-test).
Cancers 14 01609 g006
Table 1. Top 20 AKT3-associated genes after significance and fold-change filtering (FDR adjusted p-value < 0.05 and at least 2-fold up- or down-regulation) in the TCGA and GEO datasets. Expression fold change (FC) and FDR-adjusted p-value are shown per gene, for each data set. Genes are sorted based on the average rank of the adjusted p-value across the two data sets. The full list of 51 AKT3-specific genes is provided in Table S3.
GeneTCGA FCGEO FCTCGA Adj p-ValueGEO Adj p-Value
DDR25.132.046.84 × 10−512.89 × 10⁻³⁵
CDH113.142.331.99 × 10−431.26 × 10⁻³¹
AOC34.652.452.91 × 10−431.57 × 10⁻³⁰
MSRB34.122.069.74 × 10−436.82 × 10⁻³⁰
FSTL12.612.079.96 × 10−434.76 × 10⁻²⁹
DPYSL34.282.074.95 × 10−421.46 × 10⁻²⁸
COL8A15.332.028.41 × 10−429.60 × 10⁻²⁸
TIMP33.162.169.55 × 10−401.96 × 10⁻²⁷
CCDC805.292.289.89 × 10−395.48 × 10⁻²⁷
LTBP13.002.101.54 × 10−384.74 × 10⁻²⁶
PDLIM34.402.502.10 × 10−381.85 × 10⁻²⁵
C1S2.872.373.61 × 10−362.66 × 10⁻²⁵
GREM16.272.359.83 × 10−363.64 × 10⁻²⁵
GLT8D22.782.182.28 × 10−351.88 × 10⁻²⁴
GAS15.253.112.37 × 10−352.77 × 10⁻²⁴
TNS13.672.355.32 × 10−355.75 × 10⁻²⁴
KCNMA17.313.773.20 × 10−341.16 × 10⁻²³
MYLK4.592.613.98 × 10−341.31 × 10⁻²³
C1R2.762.146.15 × 10−342.33 × 10⁻²³
ADAMTS12.752.081.82 × 10−333.75 × 10⁻²³
Table 2. Reactome pathways significantly enriched (Benjamini–Hochberg-adjusted p-value < 0.05) within a list of 35 AKT3-associated genes. Shown from left to right are Reactome pathway name, Benjamini–Hochberg-adjusted p-value, symbols for genes differentially expressed in the dataset by pathway, the number of genes differentially expressed in the dataset by pathway and the total number of genes within the Reactome database for each pathway.
Reactome PathwayAdj p-ValueDifferentially Expressed Genes in PathwayNo. of Differentially Expressed Genes in PathwayTotal No. of Genes in Pathway
Extracellular matrix organization1.40 × 10−6COL6A3, COL8A1, COL15A1, FBLN1, FN1, TNC, LTBP1, MMP2, DDR2, ASPN, SDC2, ADAMTS112289
Regulation of IGF transport and uptake by IGFBPs1.00 × 10−4FSTL1, FN1, TNC, IGFBP5, LTBP1, MMP2, SDC27120
Smooth Muscle Contraction1.00 × 10−4MYH11, MYLK, ACTA2, ACTG2, CALD1538
Post-translational protein phosphorylation0.00058FSTL1, FN1, TNC, IGFBP5, LTBP1, SDC26103
Muscle contraction0.0022MYH11, MYLK, PLN, ACTA2, ACTG2, VIM, CALD17194
Degradation of the extracellular matrix0.0045COL6A3, COL8A1, COL15A1, FN1, MMP2, ADAMTS16133
Collagen degradation0.025COL6A3, COL8A1, COL15A1, MMP2459
Non-integrin membrane-ECM interactions0.045FN1, TNC, DDR2, SDC2459
Publisher’s Note: MDPI stays neutral with regard to jurisdictional claims in published maps and institutional affiliations.

