
Lipid Status of A2780 Ovarian Cancer Cells after Treatment with Ruthenium Complex Modified with Carbon Dot Nanocarriers: A Multimodal SR-FTIR Spectroscopy and MALDI TOF Mass Spectrometry Study

 , ,
, ,  , and
, and
Abstract
:Simple Summary
Abstract
1. Introduction
2. Materials and Methods
2.1. Materials
2.2. Determination of the Cytotoxicity of RuCN, CDs, N-CDs, and RuCN/(N-)CDs
2.3. Determination of the Lipophilicity of (N-)CDs
2.4. Extraction of Cellular Lipids for MALDI TOF MS Analysis
2.5. Matrix-Assisted Laser Desorption/Ionization Mass Spectrometry (MALDI TOF MS)
2.6. Preparation of the Cells for Synchrotron Radiation Fourier Transform Infrared (SR-FTIR) Spectroscopy
2.7. SR-FTIR Spectroscopy
2.8. Data Processing and Statistical Evaluation
3. Results and Discussion
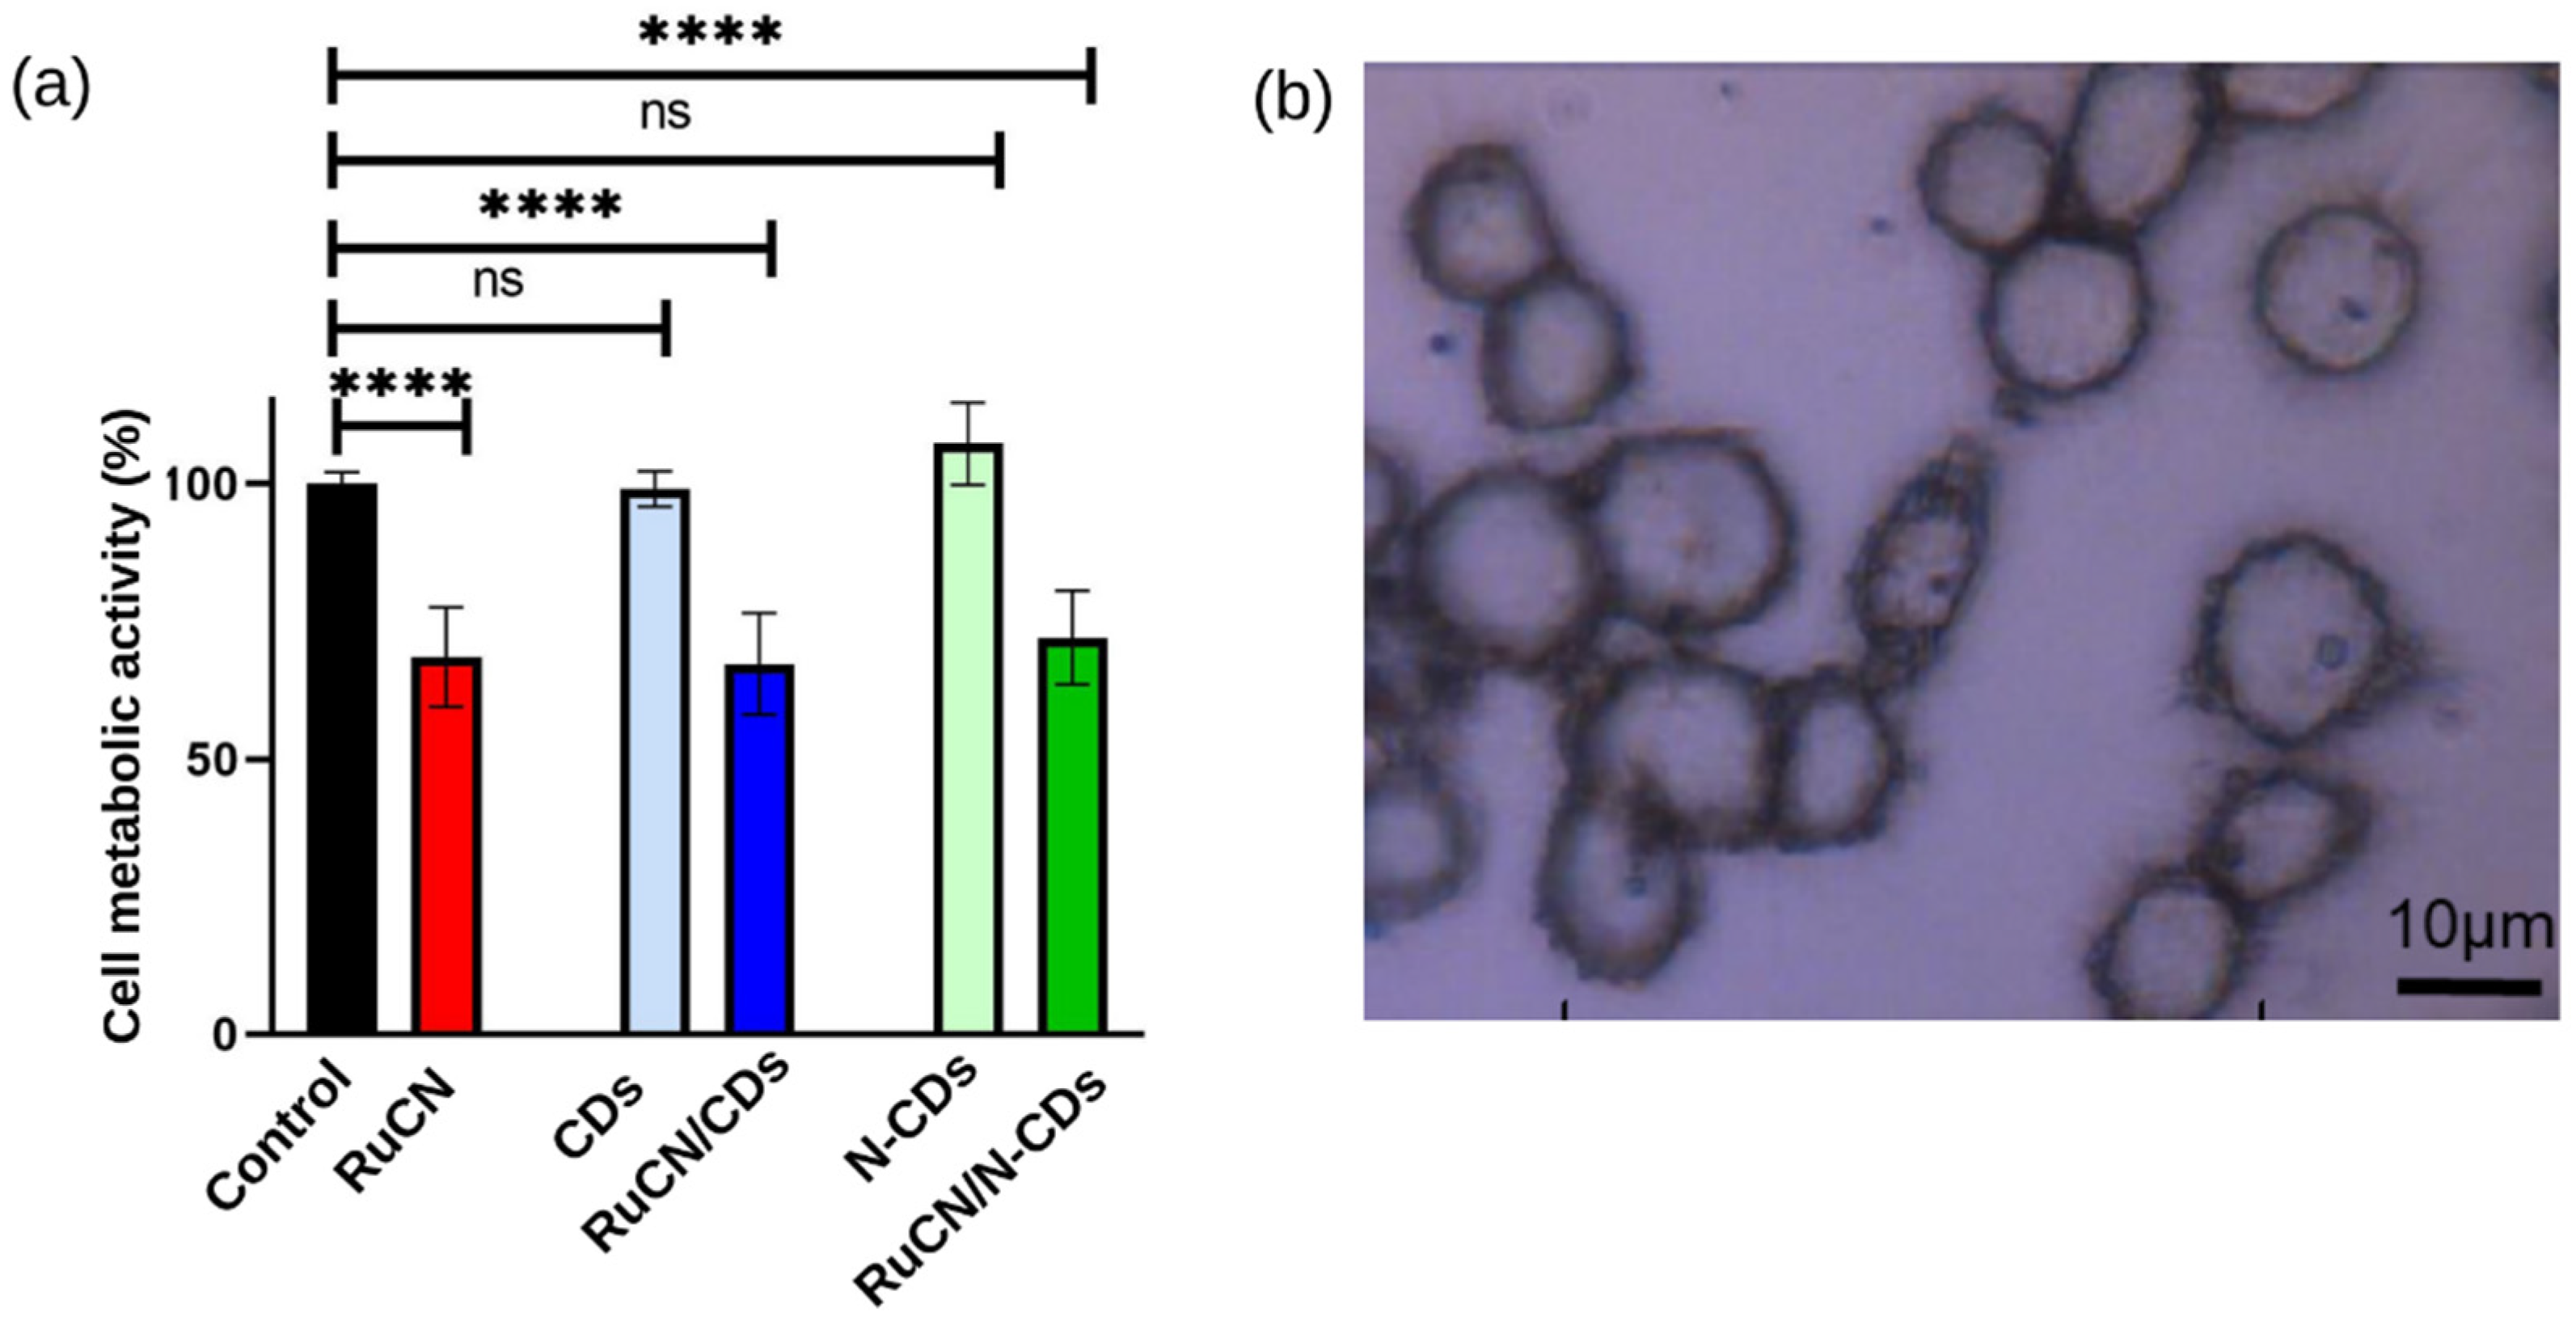
3.1. Evaluation of Anticancer and Physicochemical Properties of the Ru Complex and Drug Carriers (CDs and N-CDs)
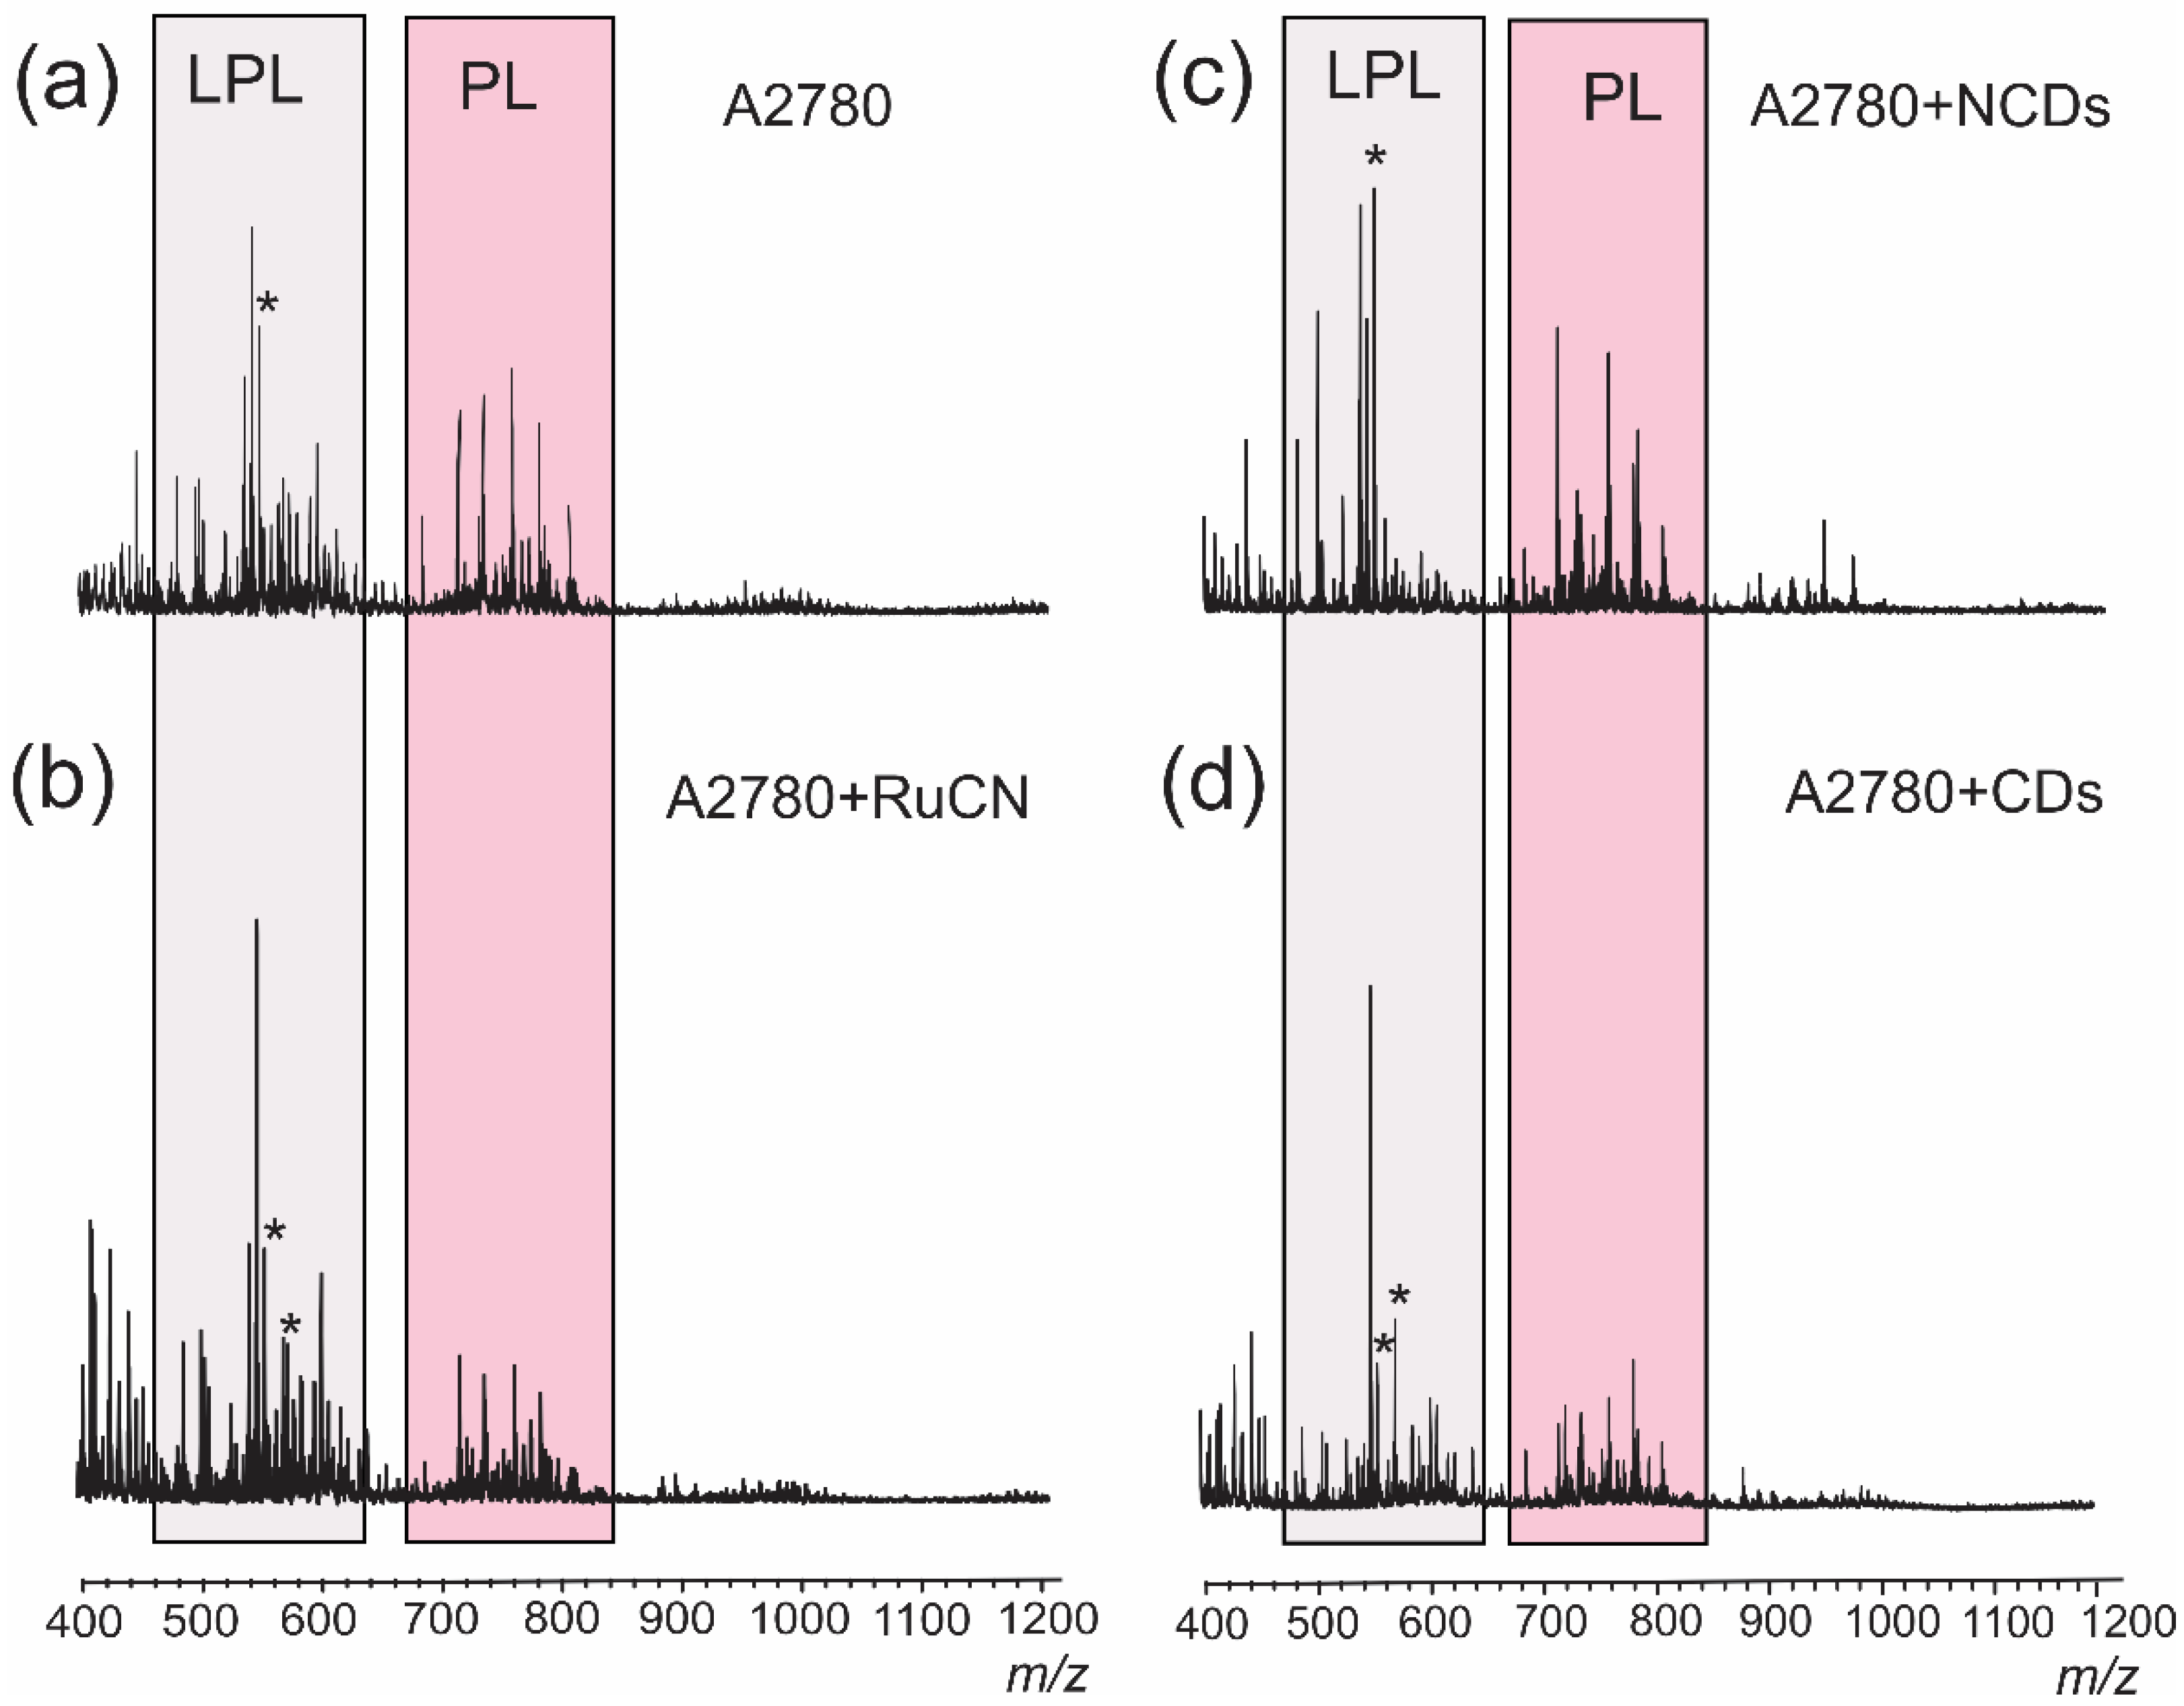
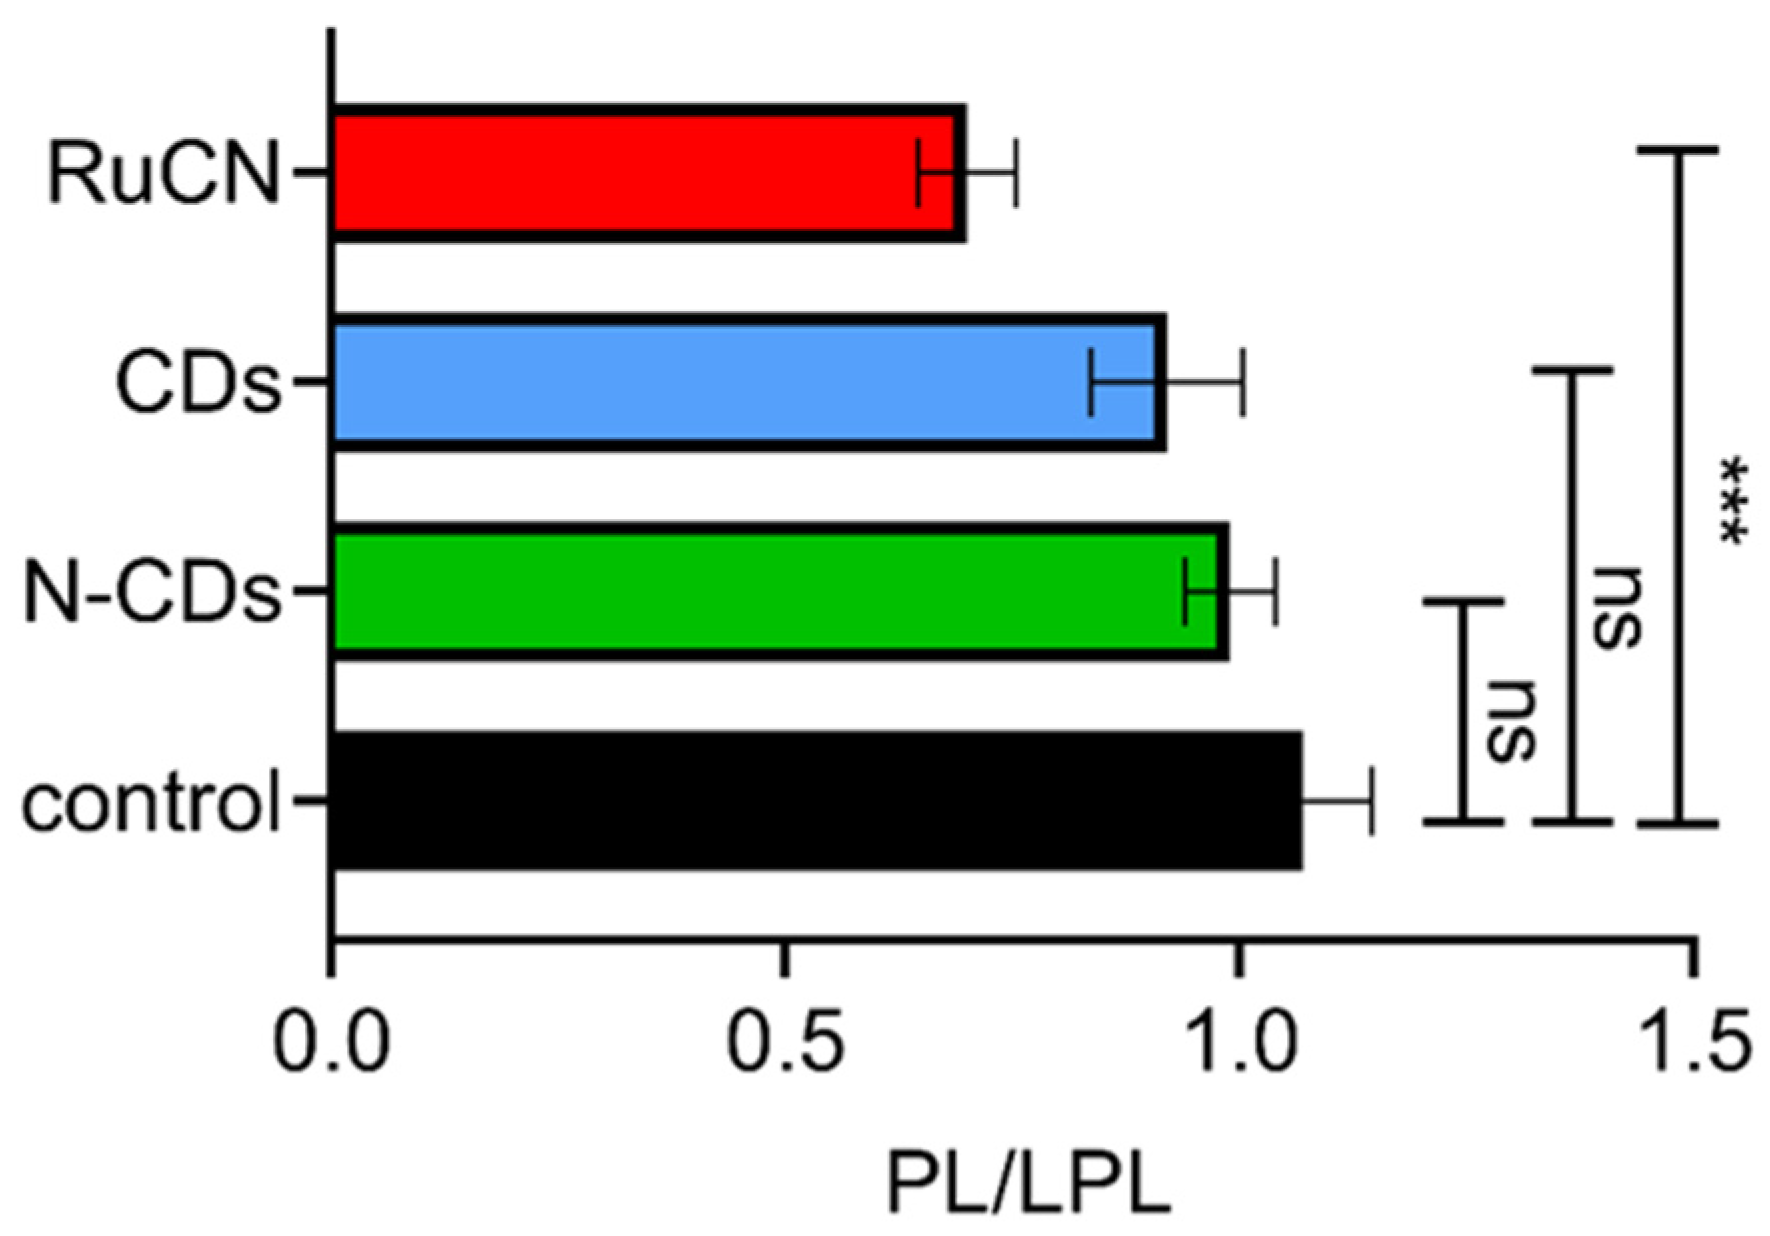
3.2. MALDI TOF MS Analysis
3.3. SR-FTIR Spectroscopy Analysis
3.3.1. Oxidative Stress Checking after the Treatments
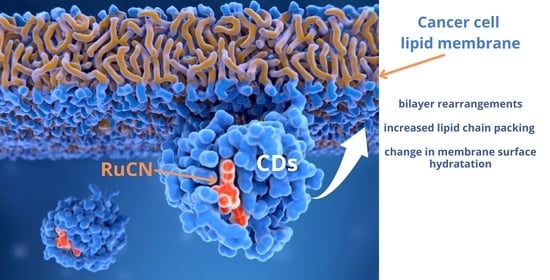
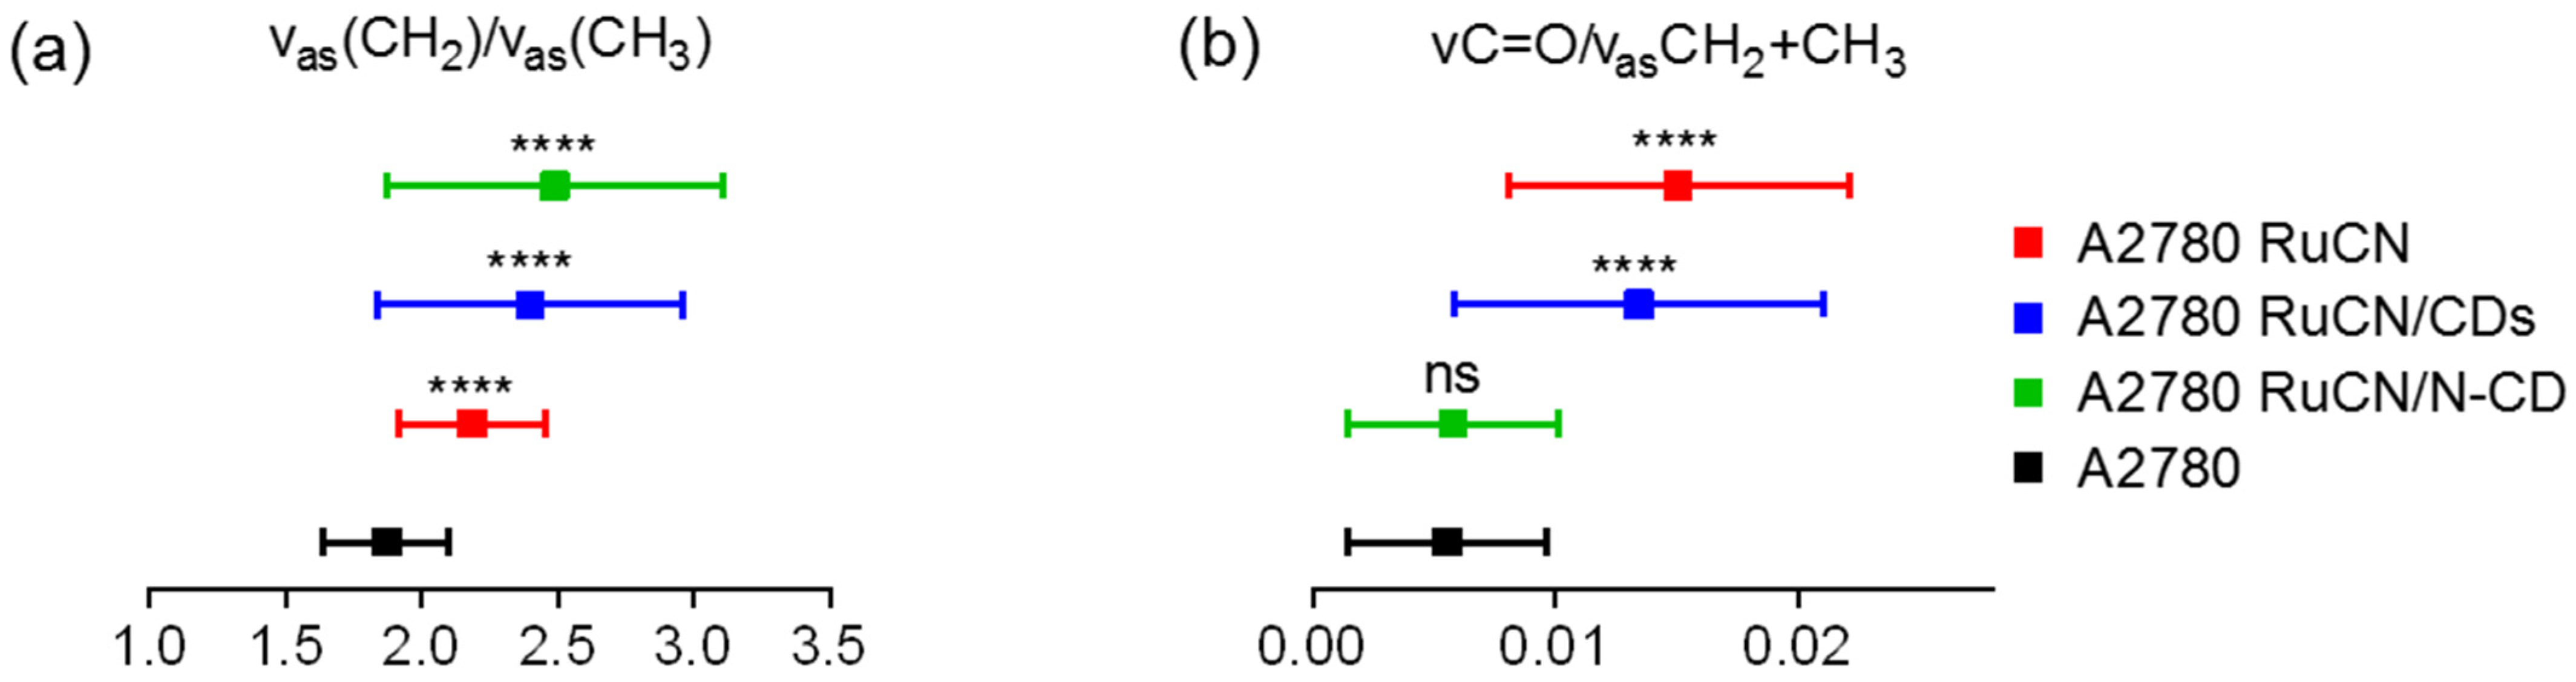
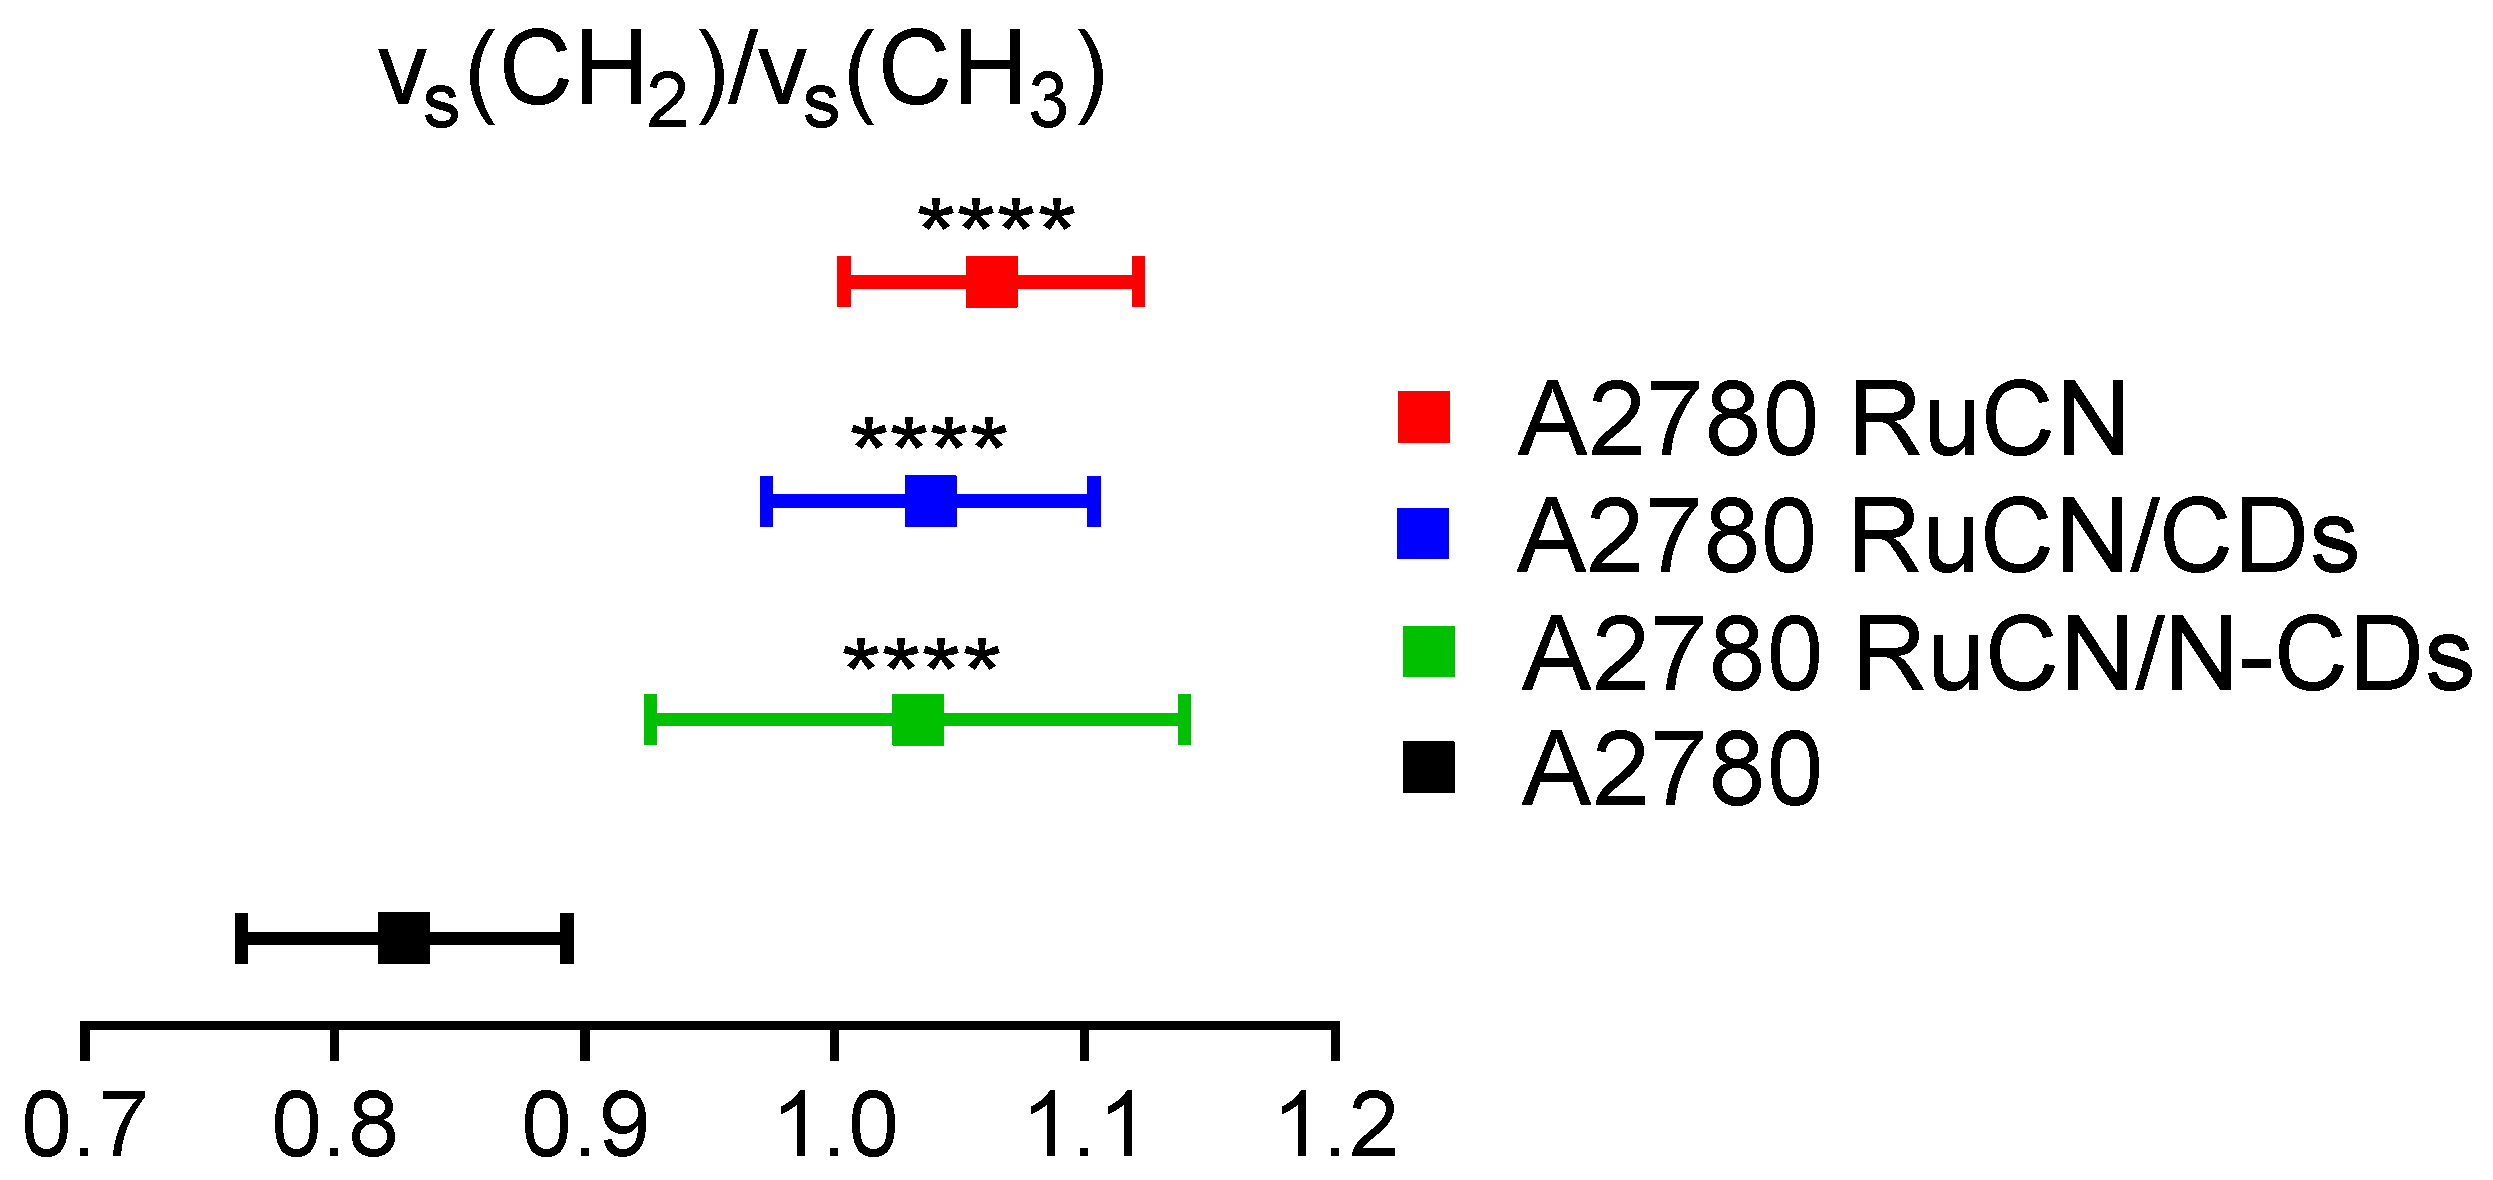
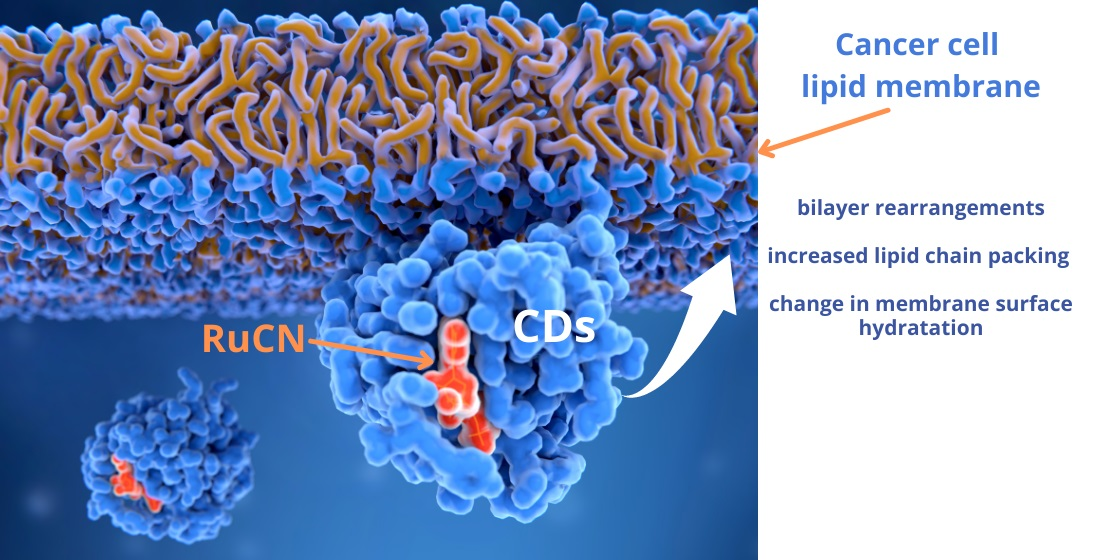
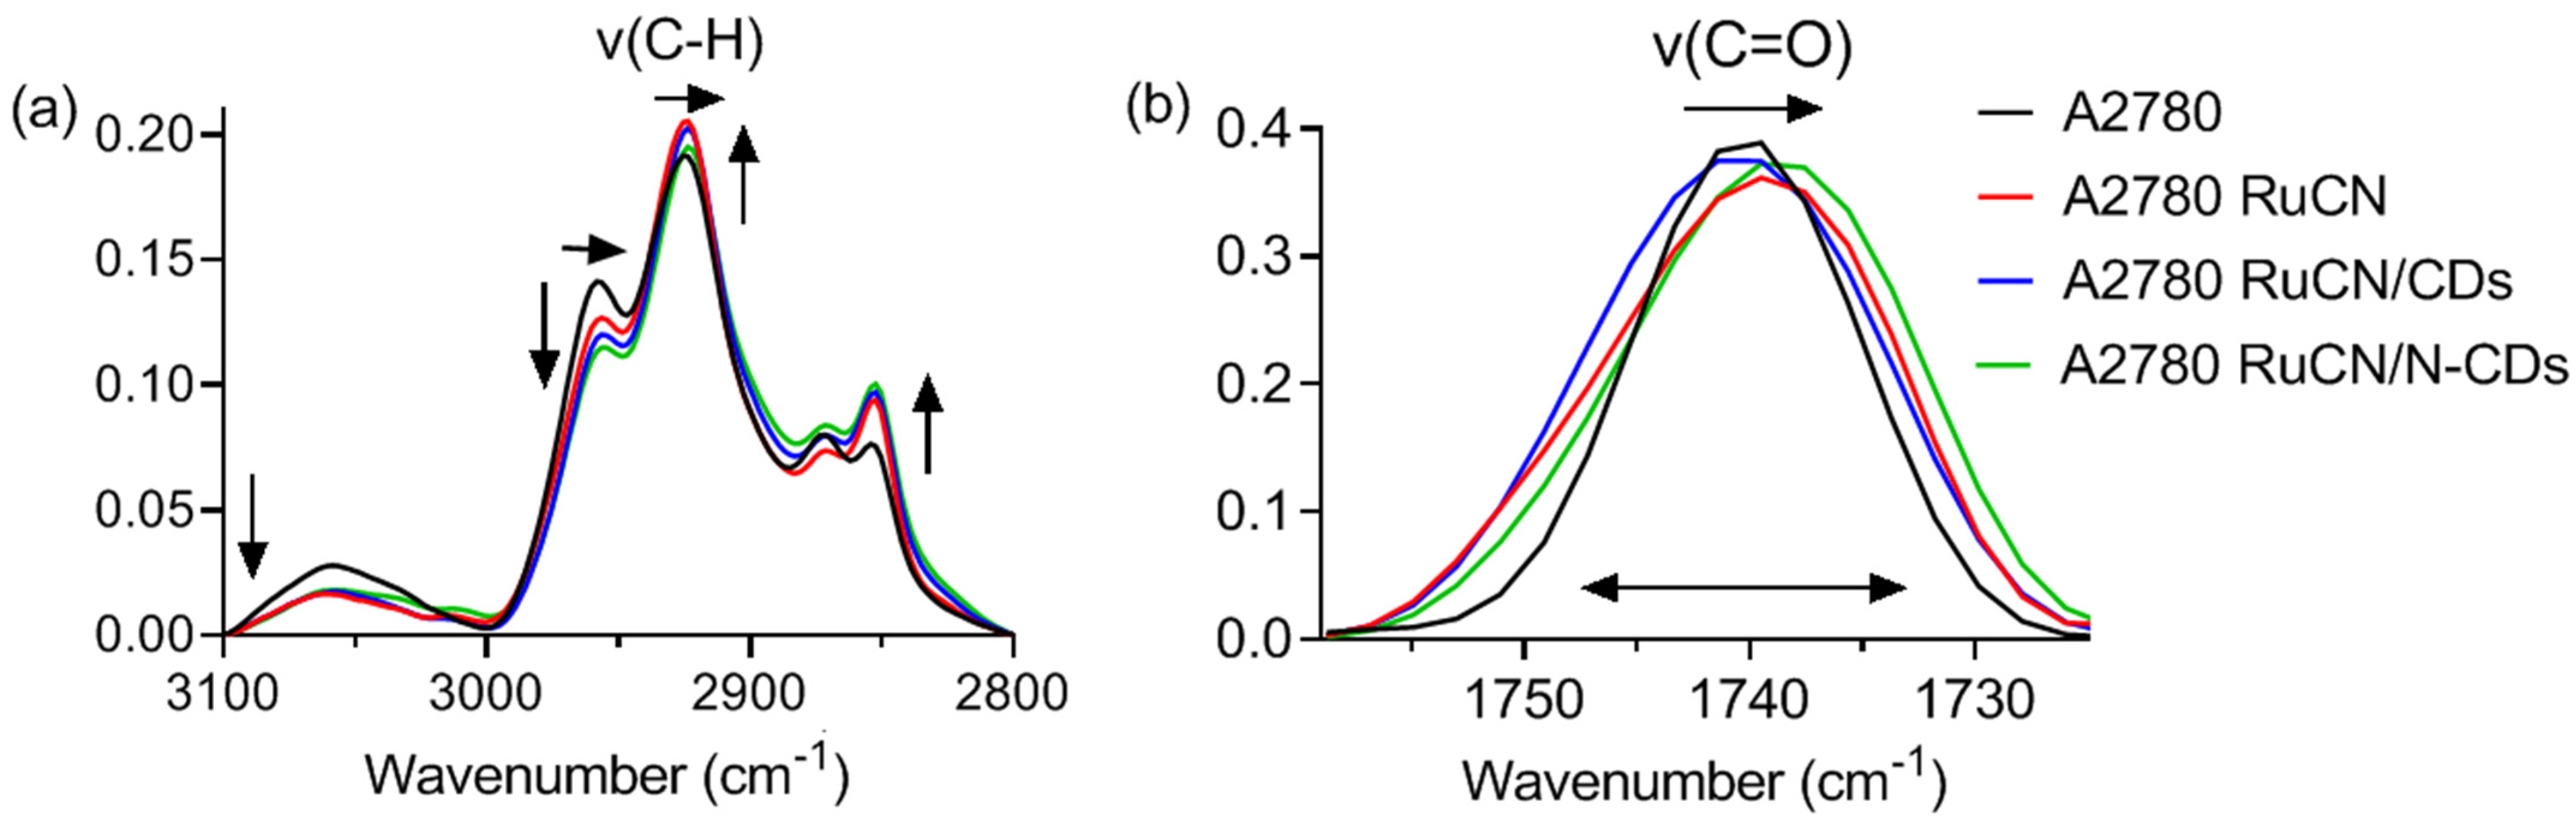
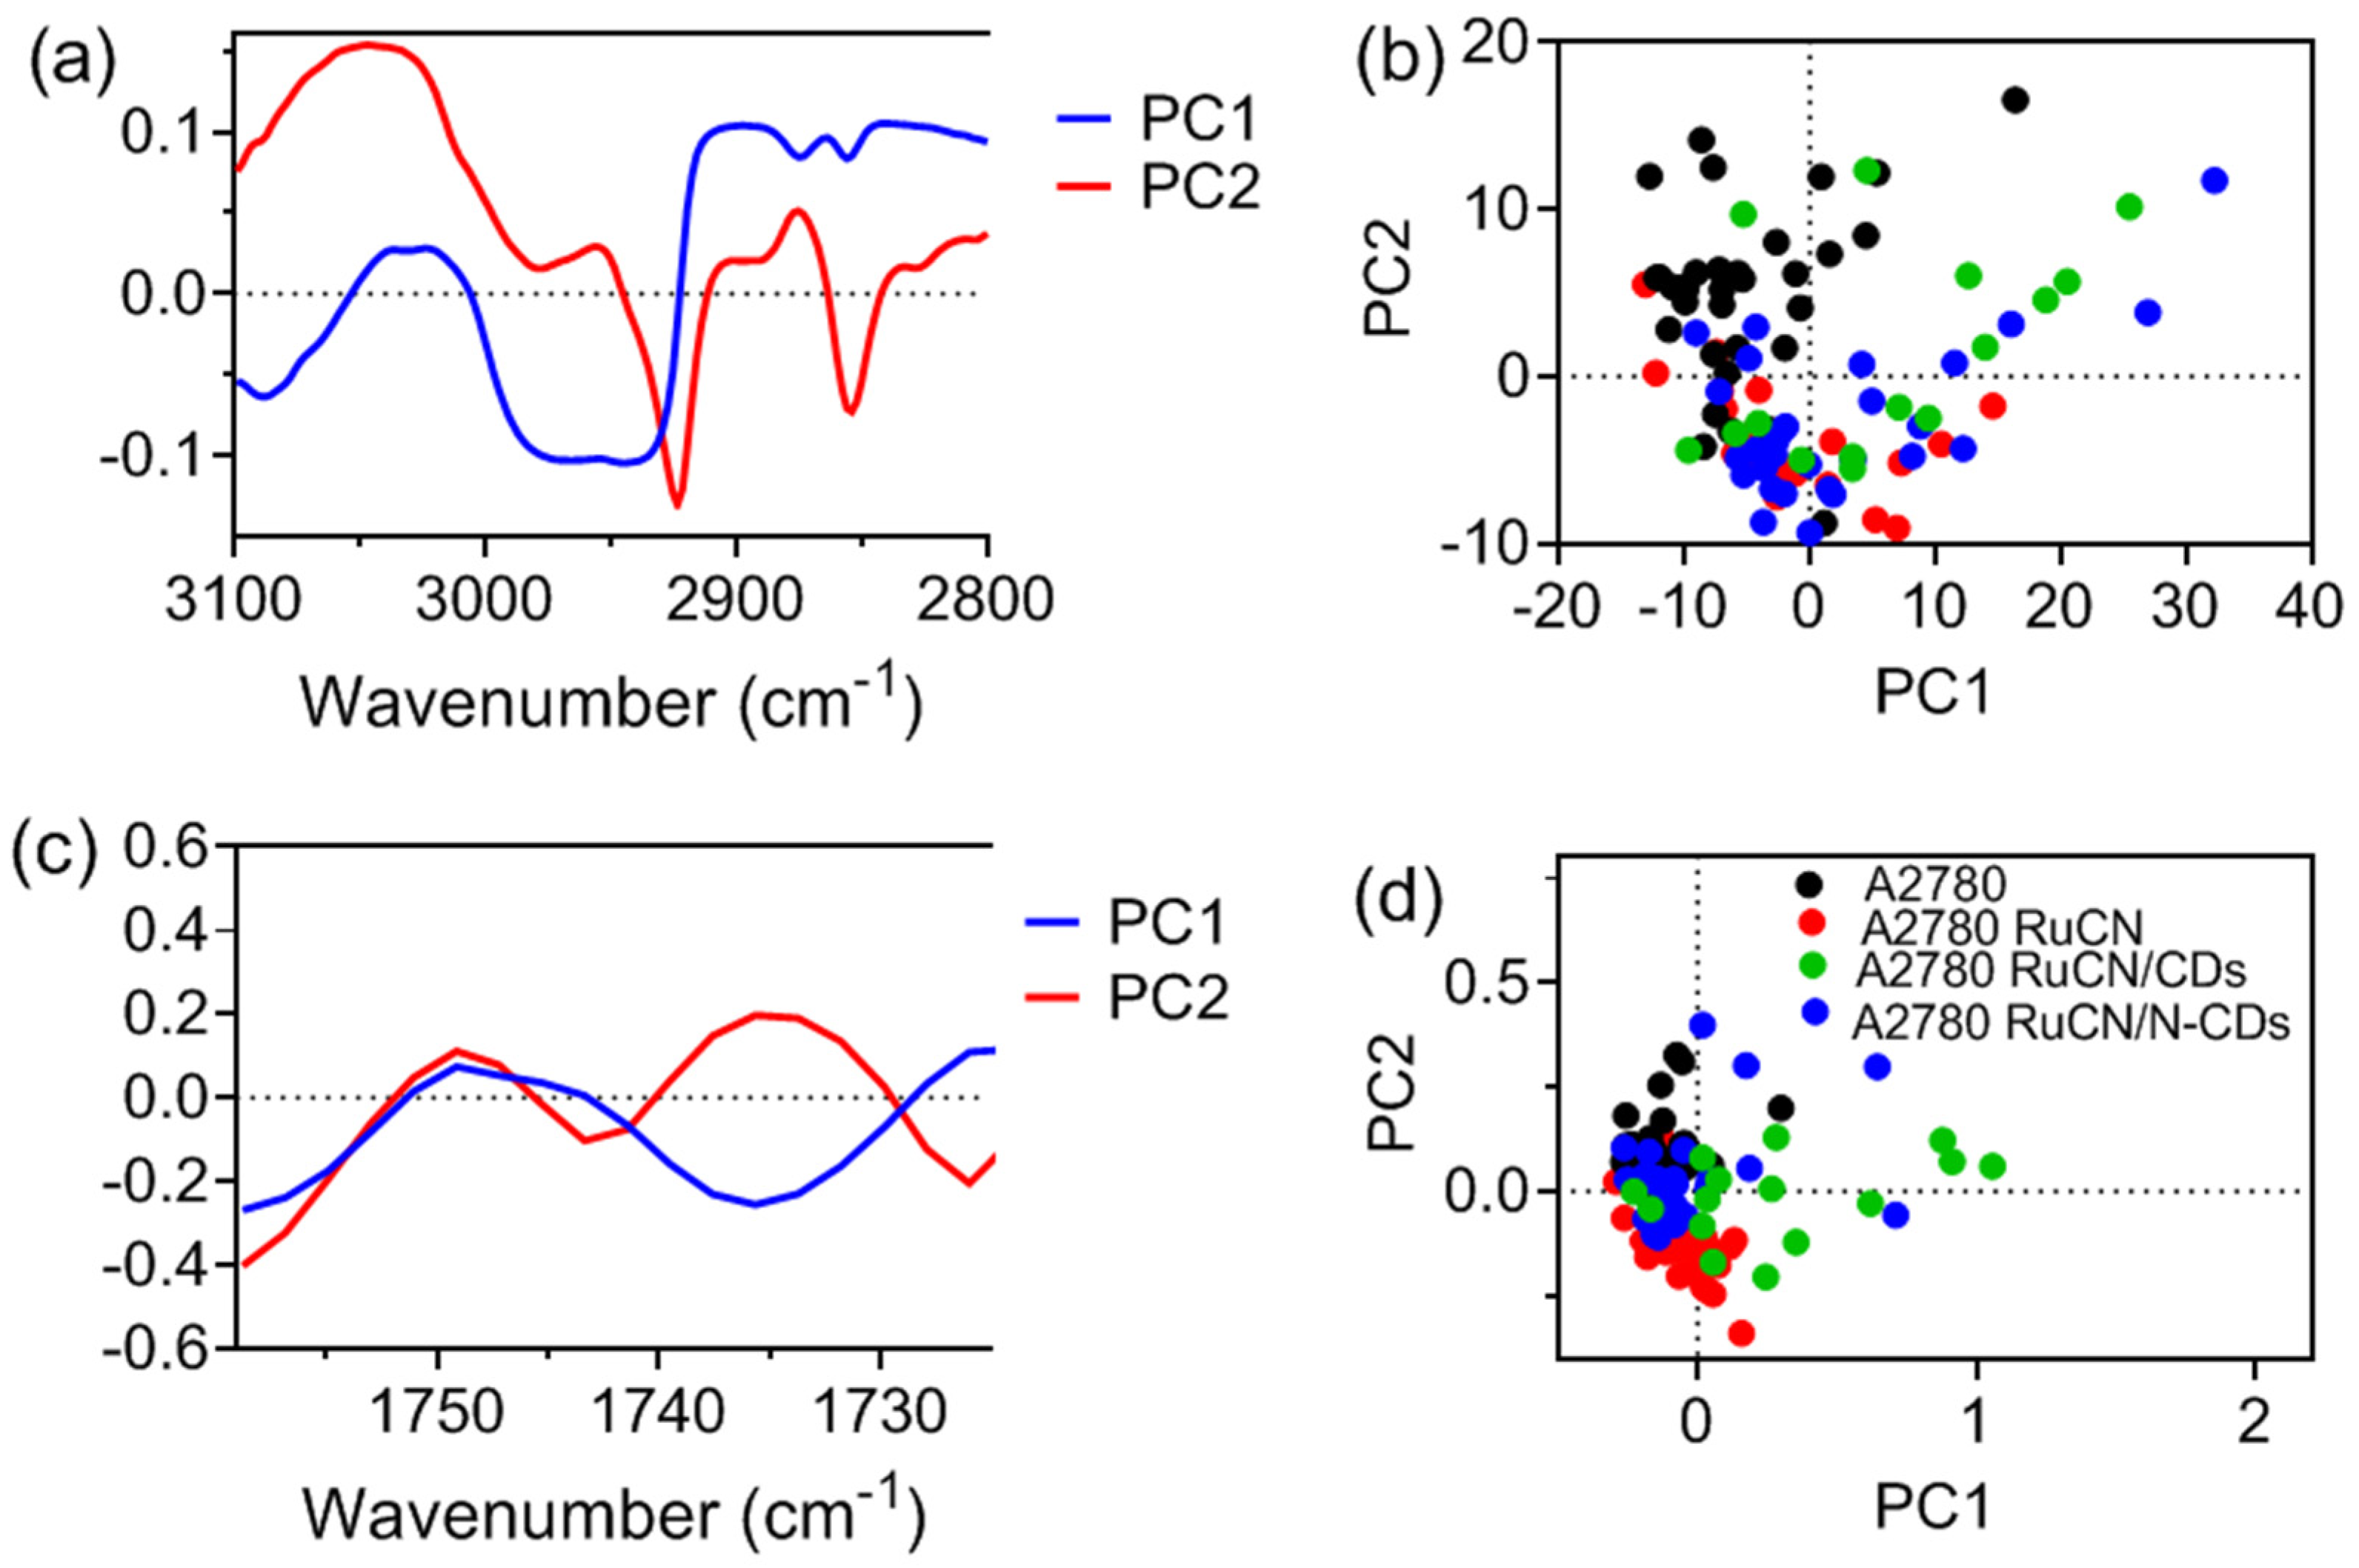
3.3.2. Impact of RuCN and RuCN/(N)CDs on the Structural and Dynamic Properties of the Cancer Cell Lipids
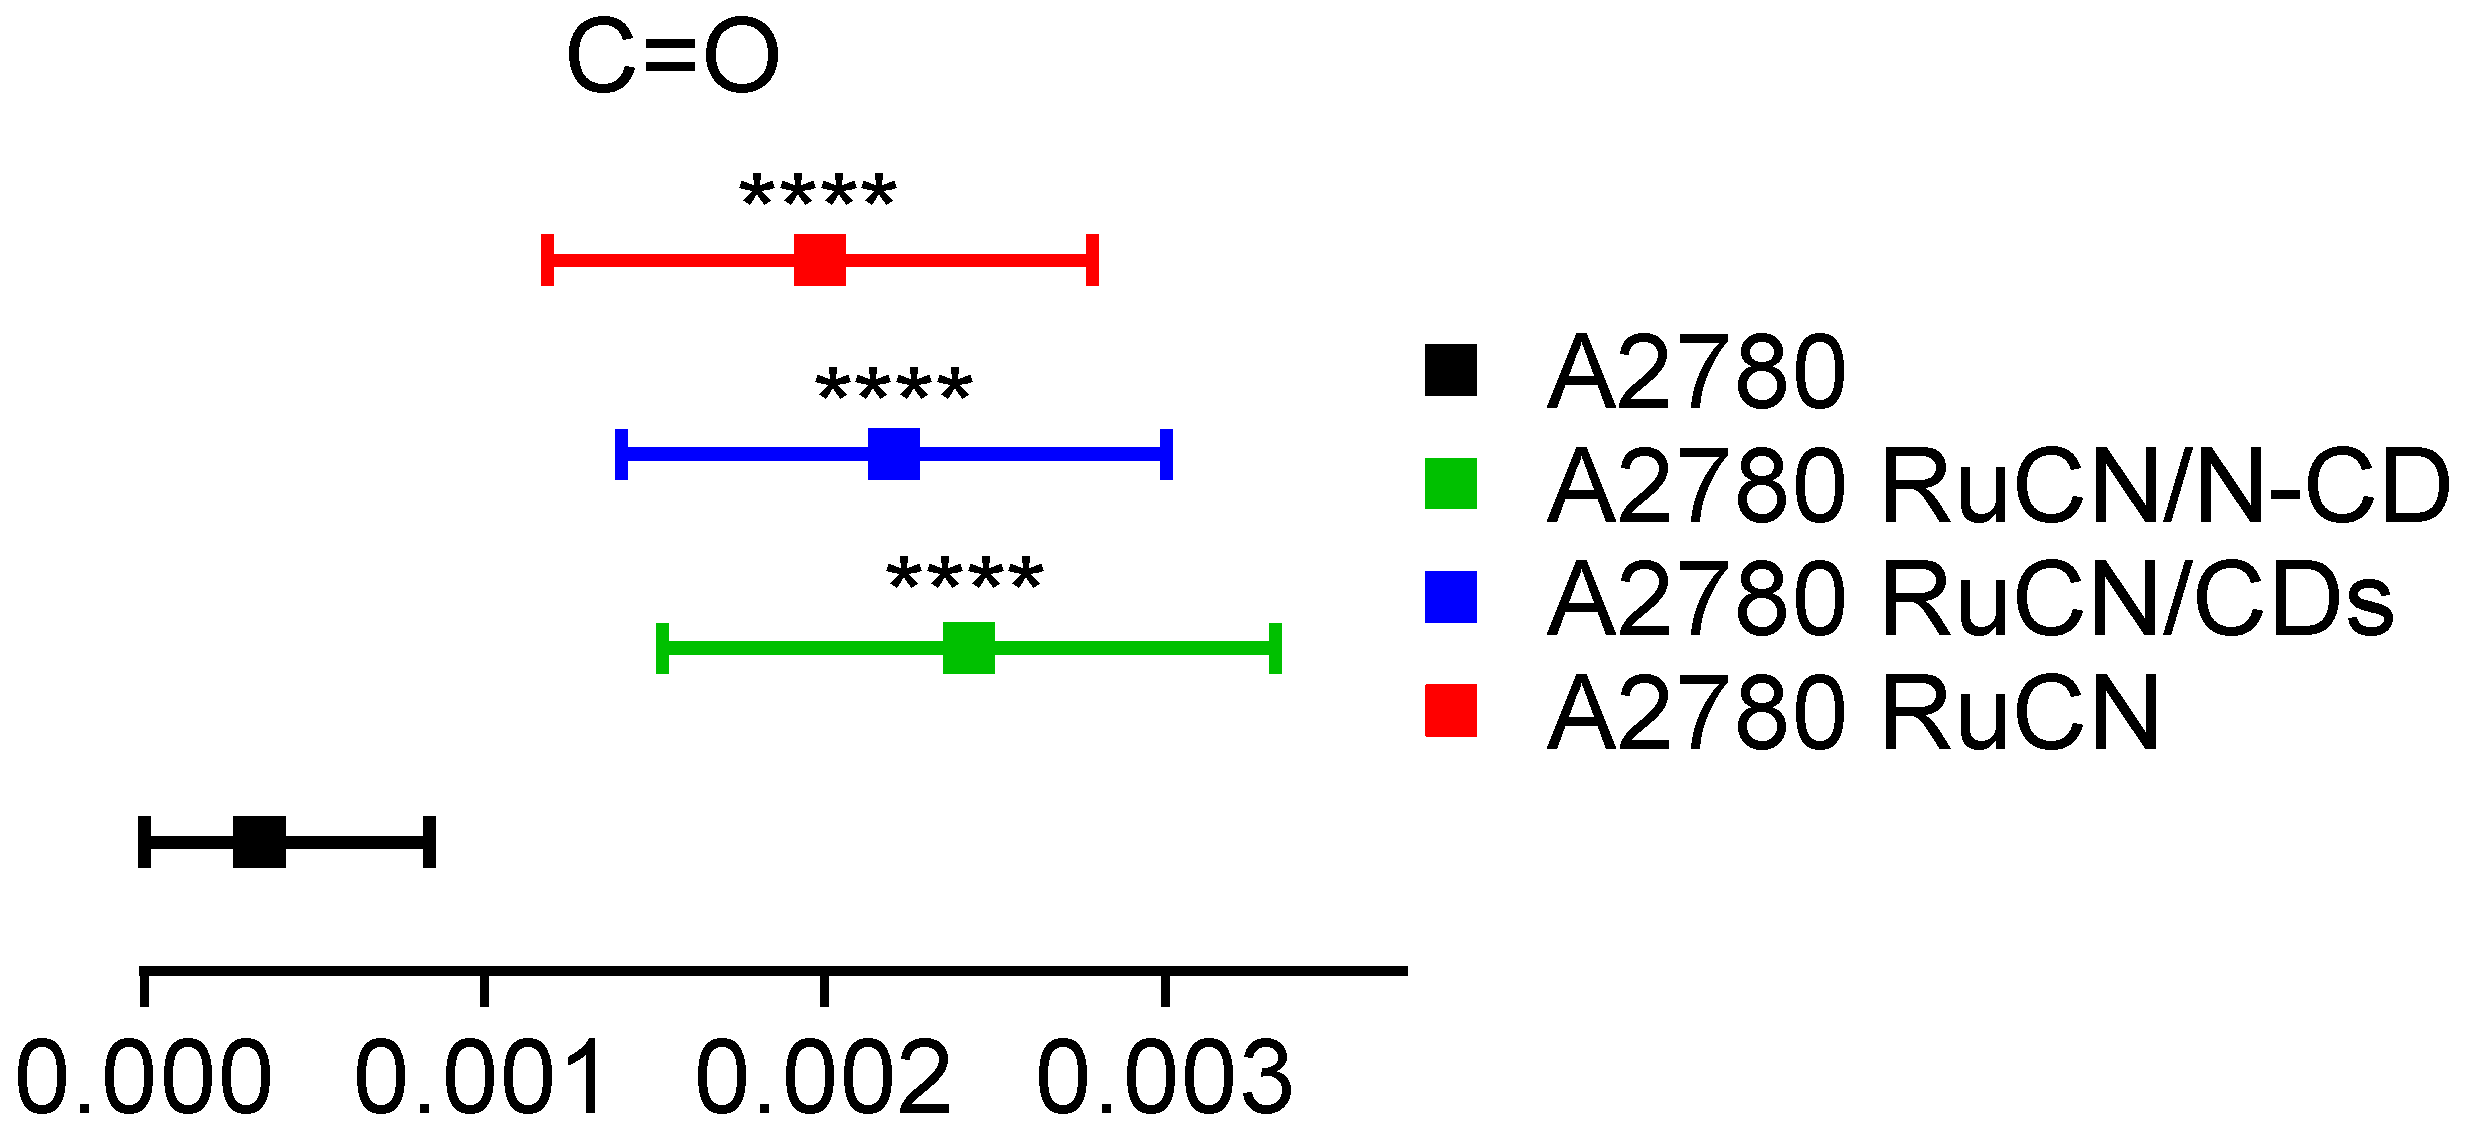
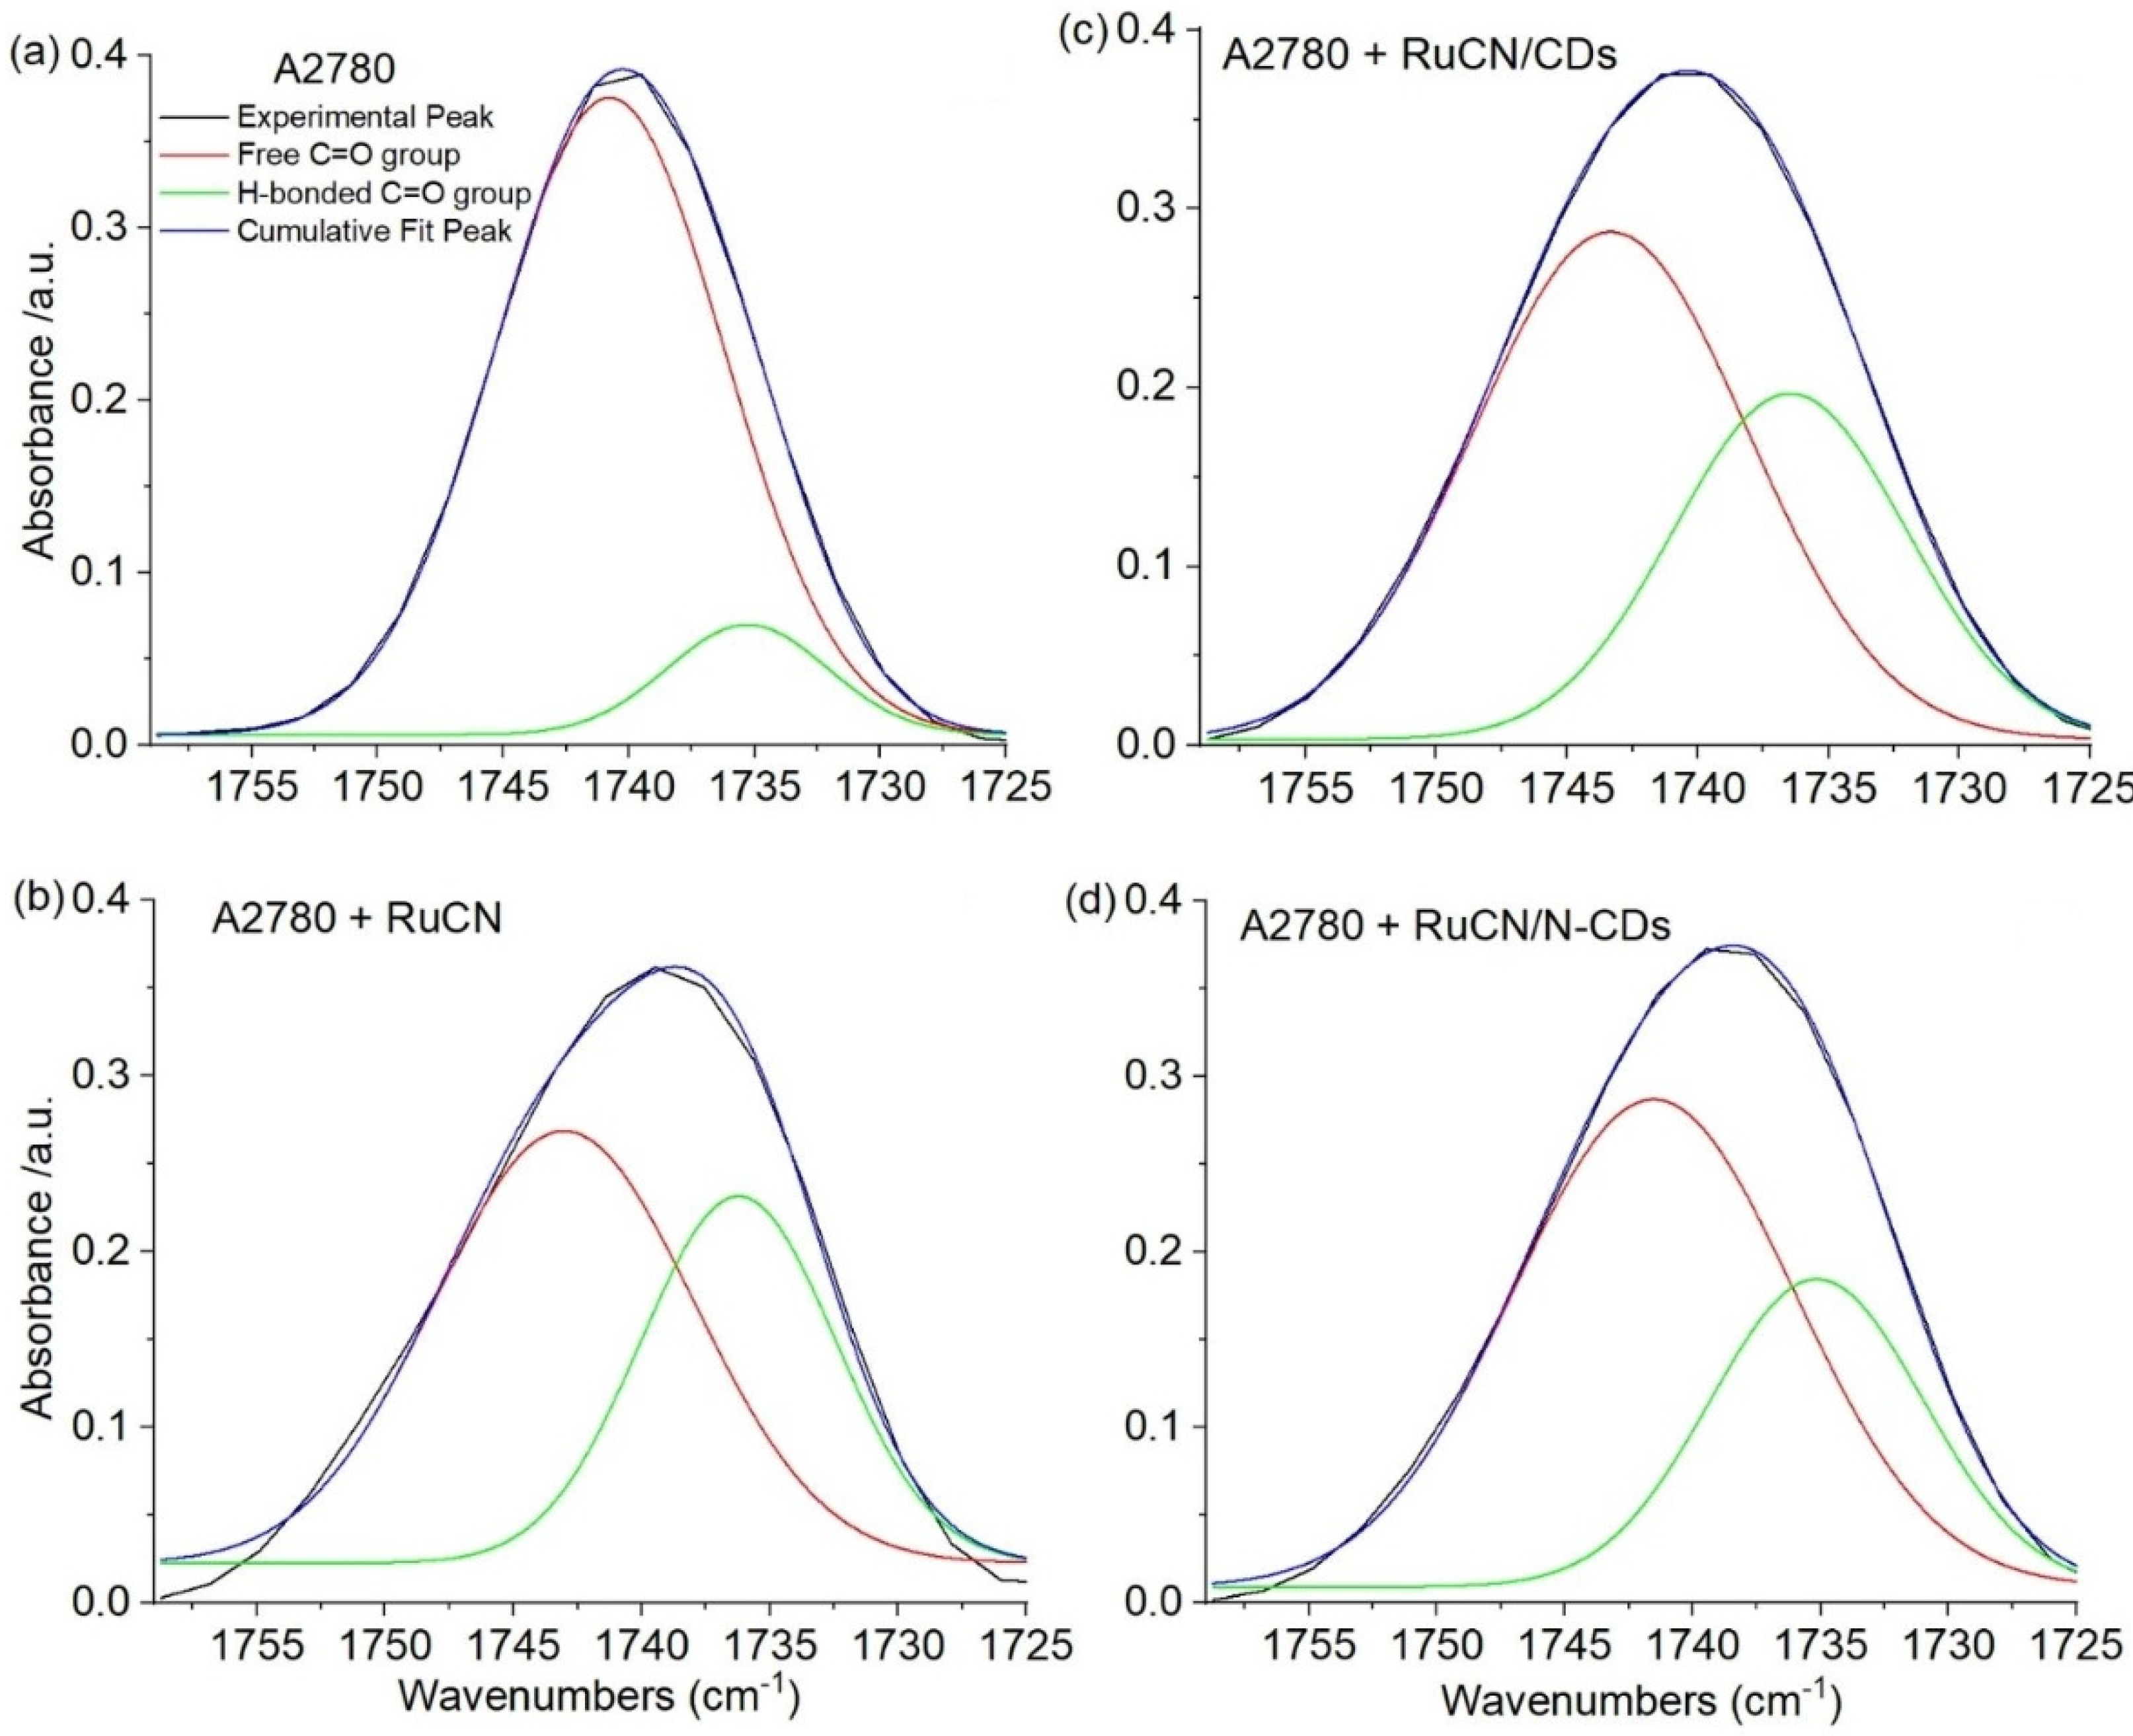
3.3.3. Impact of Various Anticancer Treatments on the Membrane Surface Hydration
4. Conclusions
Supplementary Materials
Author Contributions
Funding
Institutional Review Board Statement
Informed Consent Statement
Data Availability Statement
Acknowledgments
Conflicts of Interest
References
- Casares, D.; Escribá, P.V.; Rosselló, C.A. Membrane Lipid Composition: Effect on Membrane and Organelle Structure, Function and Compartmentalization and Therapeutic Avenues. Int. J. Mol. Sci. 2019, 20, 2167. [Google Scholar] [CrossRef] [Green Version]
- Nunes, C.; Brezesinski, G.; Pereira-Leite, C.; Lima, J.L.F.C.; Reis, S.; Lúcio, M. NSAIDs Interactions with Membranes: A Biophysical Approach. Langmuir 2011, 27, 10847–10858. [Google Scholar] [CrossRef]
- van Spriel, A.B.; van den Bogaart, G.; Cambi, A. Editorial: Membrane Domains as New Drug Targets. Front. Physiol. 2015, 6, 172. [Google Scholar] [CrossRef] [Green Version]
- Li, H.; Zhao, T.; Sun, Z. Analytical Techniques and Methods for Study of Drug-Lipid Membrane Interactions. Rev. Anal. Chem. 2018, 37, 1–23. [Google Scholar] [CrossRef]
- Lee, S.Y.; Kim, C.Y.; Nam, T.-G. Ruthenium Complexes as Anticancer Agents: A Brief History and Perspectives. Drug Des. Dev. Ther. 2020, 14, 5375–5392. [Google Scholar] [CrossRef]
- Lin, K.; Zhao, Z.-Z.; Bo, H.-B.; Hao, X.-J.; Wang, J.-Q. Applications of Ruthenium Complex in Tumor Diagnosis and Therapy. Front. Pharmacol. 2018, 9, 1323. [Google Scholar] [CrossRef] [Green Version]
- Bergamo, A.; Riedel, T.; Dyson, P.J.; Sava, G. Preclinical Combination Therapy of the Investigational Drug NAMI-A(+) with Doxorubicin for Mammary Cancer. Investig. New Drugs 2015, 33, 53–63. [Google Scholar] [CrossRef]
- Zein, R.; Sharrouf, W.; Selting, K. Physical Properties of Nanoparticles That Result in Improved Cancer Targeting. J. Oncol. 2020, 2020, e5194780. [Google Scholar] [CrossRef]
- Edis, Z.; Wang, J.; Waqas, M.K.; Ijaz, M.; Ijaz, M. Nanocarriers-Mediated Drug Delivery Systems for Anticancer Agents: An Overview and Perspectives. IJN 2021, 16, 1313–1330. [Google Scholar] [CrossRef]
- Nešić, M.; Žakula, J.; Korićanac, L.; Stepić, M.; Radoičić, M.; Popović, I.; Šaponjić, Z.; Petković, M. Light Controlled Metallo-Drug Delivery System Based on the TiO2-Nanoparticles and Ru-Complex. J. Photochem. Photobiol. A Chem. 2017, 347, 55–66. [Google Scholar] [CrossRef]
- Tomaz, A.I.; Jakusch, T.; Morais, T.S.; Marques, F.; de Almeida, R.F.M.; Mendes, F.; Enyedy, É.A.; Santos, I.; Pessoa, J.C.; Kiss, T.; et al. [RuII(H5-C5H5)(Bipy)(PPh3)]+, a Promising Large Spectrum Antitumor Agent: Cytotoxic Activity and Interaction with Human Serum Albumin. J. Inorg. Biochem. 2012, 117, 261–269. [Google Scholar] [CrossRef]
- Côrte-Real, L.; Teixeira, R.G.; Gírio, P.; Comsa, E.; Moreno, A.; Nasr, R.; Baubichon-Cortay, H.; Avecilla, F.; Marques, F.; Robalo, M.P.; et al. Methyl-Cyclopentadienyl Ruthenium Compounds with 2,2′-Bipyridine Derivatives Display Strong Anticancer Activity and Multidrug Resistance Potential. Inorg. Chem. 2018, 57, 4629–4639. [Google Scholar] [CrossRef] [Green Version]
- Côrte-Real, L.; Mendes, F.; Coimbra, J.; Morais, T.S.; Tomaz, A.I.; Valente, A.; Garcia, M.H.; Santos, I.; Bicho, M.; Marques, F. Anticancer Activity of Structurally Related Ruthenium(II) Cyclopentadienyl Complexes. J. Biol. Inorg. Chem. 2014, 19, 853–867. [Google Scholar] [CrossRef]
- Adrita, S.H.; Tasnim, K.N.; Ryu, J.H.; Sharker, S.M. Nanotheranostic Carbon Dots as an Emerging Platform for Cancer Therapy. J. Nanotheranostics 2020, 1, 6. [Google Scholar] [CrossRef]
- Zeng, Q.; Shao, D.; He, X.; Ren, Z.; Ji, W.; Shan, C.; Qu, S.; Li, J.; Chen, L.; Li, Q. Carbon Dots as a Trackable Drug Delivery Carrier for Localized Cancer Therapy in Vivo. J. Mater. Chem. B 2016, 4, 5119–5126. [Google Scholar] [CrossRef]
- Feng, T.; Zhao, Y. Preparation of Responsive Carbon Dots for Anticancer Drug Delivery. In Pharmaceutical Nanotechnology: Basic Protocols; Weissig, V., Elbayoumi, T., Eds.; Methods in Molecular Biology; Springer: New York, NY, USA, 2019; pp. 227–234. ISBN 978-1-4939-9516-5. [Google Scholar]
- Zhang, M.; Ping, Y.; Zhou, N.; Su, Y.; Shao, M.; Chi, C. PH-Sensitive N-Doped Carbon Dots–Heparin and Doxorubicin Drug Delivery System: Preparation and Anticancer Research. RSC Adv. 2017, 7, 9347–9356. [Google Scholar] [CrossRef] [Green Version]
- Saravanan, A.; Maruthapandi, M.; Das, P.; Ganguly, S.; Margel, S.; Luong, J.H.T.; Gedanken, A. Applications of N-Doped Carbon Dots as Antimicrobial Agents, Antibiotic Carriers, and Selective Fluorescent Probes for Nitro Explosives. ACS Appl. Bio Mater. 2020, 3, 8023–8031. [Google Scholar] [CrossRef]
- Zhang, Y.; Luo, G.; Li, M.; Guo, P.; Xiao, Y.; Ji, H.; Hao, Y. Global Patterns and Trends in Ovarian Cancer Incidence: Age, Period and Birth Cohort Analysis. BMC Cancer 2019, 19, 984. [Google Scholar] [CrossRef]
- Lyttle, B.; Bernardi, L.; Pavone, M.E. Ovarian Cancer in Endometriosis: Clinical and Molecular Aspects. Minerva Ginecol. 2014, 66, 155–164. [Google Scholar]
- Hallas-Potts, A.; Dawson, J.C.; Herrington, C.S. Ovarian Cancer Cell Lines Derived from Non-Serous Carcinomas Migrate and Invade More Aggressively than Those Derived from High-Grade Serous Carcinomas. Sci. Rep. 2019, 9, 5515. [Google Scholar] [CrossRef]
- Houdová, D.; Soto, J.; Castro, R.; Rodrigues, J.; Soledad Pino-González, M.; Petković, M.; Bandosz, T.J.; Algarra, M. Chemically Heterogeneous Carbon Dots Enhanced Cholesterol Detection by MALDI TOF Mass Spectrometry. J. Colloid Interface Sci. 2021, 591, 373–383. [Google Scholar] [CrossRef] [PubMed]
- Algarra, M.; Campos, B.B.; Radotić, K.; Mutavdžić, D.; Bandosz, T.; Jiménez-Jiménez, J.; Rodriguez-Castellón, E.; da Silva, J.C.G.E. Luminescent Carbon Nanoparticles: Effects of Chemical Functionalization, and Evaluation of Ag+ Sensing Properties. J. Mater. Chem. A 2014, 2, 8342–8351. [Google Scholar] [CrossRef]
- Bruce, M.; Windsor, N. Cyclopentadienyl-Ruthenium and -Osmium Chemistry. IV. Convenient High-Yield Synthesis of Some Cyclopentadienyl Ruthenium or Osmium Tertiary Phosphine Halide Complexes. Aust. J. Chem. 1977, 30, 1601–1604. [Google Scholar] [CrossRef]
- Waring, M.J. Lipophilicity in Drug Discovery. Expert Opin. Drug Discov. 2010, 5, 235–248. [Google Scholar] [CrossRef]
- Bligh, E.G.; Dyer, W.J. A Rapid Method of Total Lipid Extraction and Purification. Can. J. Biochem. Physiol. 1959, 37, 911–917. [Google Scholar] [CrossRef]
- Demšar, J.; Curk, T.; Erjavec, A.; Gorup, Č.; Hočevar, T.; Milutinovič, M.; Možina, M.; Polajnar, M.; Toplak, M.; Starič, A.; et al. Orange: Data Mining Toolbox in Python. J. Mach. Learn. Res. 2013, 14, 2349–2353. [Google Scholar]
- Siegel, R.; Naishadham, D.; Jemal, A. Cancer Statistics, 2012. CA Cancer J. Clin. 2012, 62, 10–29. [Google Scholar] [CrossRef] [Green Version]
- Matulonis, U.A.; Sood, A.K.; Fallowfield, L.; Howitt, B.E.; Sehouli, J.; Karlan, B.Y. Ovarian Cancer. Nat. Rev. Dis. Primers 2016, 2, 16061. [Google Scholar] [CrossRef]
- Berns, E.M.J.J.; Bowtell, D.D. The Changing View of High-Grade Serous Ovarian Cancer. Cancer Res. 2012, 72, 2701–2704. [Google Scholar] [CrossRef] [Green Version]
- Nazarenus, M.; Zhang, Q.; Soliman, M.G.; del Pino, P.; Pelaz, B.; Carregal-Romero, S.; Rejman, J.; Rothen-Rutishauser, B.; Clift, M.J.D.; Zellner, R.; et al. In Vitro Interaction of Colloidal Nanoparticles with Mammalian Cells: What Have We Learned Thus Far? Beilstein J. Nanotechnol. 2014, 5, 1477–1490. [Google Scholar] [CrossRef]
- Forest, V.; Cottier, M.; Pourchez, J. Electrostatic Interactions Favor the Binding of Positive Nanoparticles on Cells: A Reductive Theory. Nano Today 2015, 10, 677–680. [Google Scholar] [CrossRef] [Green Version]
- Fröhlich, E. The Role of Surface Charge in Cellular Uptake and Cytotoxicity of Medical Nanoparticles. Int. J. Nanomed. 2012, 7, 5577–5591. [Google Scholar] [CrossRef] [PubMed] [Green Version]
- Sakai, N.; Matsui, Y.; Nakayama, A.; Tsuda, A.; Yoneda, M. Functional-Dependent and Size-Dependent Uptake of Nanoparticles in PC12. J. Phys. Conf. Ser. 2011, 304, 12049. [Google Scholar] [CrossRef]
- Wilhelm, C.; Billotey, C.; Roger, J.; Pons, J.N.; Bacri, J.-C.; Gazeau, F. Intracellular Uptake of Anionic Superparamagnetic Nanoparticles as a Function of Their Surface Coating. Biomaterials 2003, 24, 1001–1011. [Google Scholar] [CrossRef]
- Petković, M.; Schiller, J.; Müller, M.; Benard, S.; Reichl, S.; Arnold, K.; Arnhold, J. Detection of Individual Phospholipids in Lipid Mixtures by Matrix-Assisted Laser Desorption/Ionization Time-of-Flight Mass Spectrometry: Phosphatidylcholine Prevents the Detection of Further Species. Anal. Biochem. 2001, 289, 202–216. [Google Scholar] [CrossRef]
- Leßig, J.; Schiller, J.; Arnhold, J.; Fuchs, B. Hypochlorous Acid-Mediated Generation of Glycerophosphocholine from Unsaturated Plasmalogen Glycerophosphocholine Lipids. J. Lipid Res. 2007, 48, 1316–1324. [Google Scholar] [CrossRef] [Green Version]
- Casey, D.; Charalambous, K.; Gee, A.; Law, R.V.; Ces, O. Amphiphilic Drug Interactions with Model Cellular Membranes Are Influenced by Lipid Chain-Melting Temperature. J. R. Soc. Interface 2014, 11, 20131062. [Google Scholar] [CrossRef]
- Baciu, M.; Sebai, S.C.; Ces, O.; Mulet, X.; Clarke, J.A.; Shearman, G.C.; Law, R.V.; Templer, R.H.; Plisson, C.; Parker, C.A.; et al. Degradative Transport of Cationic Amphiphilic Drugs across Phospholipid Bilayers. Philos. Trans. A Math. Phys. Eng. Sci. 2006, 364, 2597–2614. [Google Scholar] [CrossRef]
- Britt, H.M.; García-Herrero, C.A.; Denny, P.W.; Mosely, J.A.; Sanderson, J.M. Lytic Reactions of Drugs with Lipid Membranes. Chem. Sci. 2018, 10, 674–680. [Google Scholar] [CrossRef] [Green Version]
- Kreuzer, M.; Dučić, T.; Hawlina, M.; Andjelic, S. Synchrotron-Based FTIR Microspectroscopy of Protein Aggregation and Lipids Peroxidation Changes in Human Cataractous Lens Epithelial Cells. Sci. Rep. 2020, 10, 15489. [Google Scholar] [CrossRef]
- Muik, B.; Lendl, B.; Molina-Díaz, A.; Valcarcel, M.; Cañada, M. Two-Dimensional Correlation Spectroscopy and Multivariate Curve Resolution for the Study of Lipid Oxidation in Edible Oils Monitored by FTIR and FT-Raman Spectroscopy. Anal. Chim. Acta 2007, 593, 54–67. [Google Scholar] [CrossRef] [PubMed]
- Fong, C.W. Free Radical Anticancer Drugs and Oxidative Stress: ORAC and CellROX-Colorectal Cancer Cells by Quantum Chemical Determinations; Eigenenergy: Adelaide, Australia, 2018. [Google Scholar]
- Conklin, K.A. Chemotherapy-Associated Oxidative Stress: Impact on Chemotherapeutic Effectiveness. Integr. Cancer Ther. 2004, 3, 294–300. [Google Scholar] [CrossRef]
- D’Sousa Costa, C.O.; Araujo Neto, J.H.; Baliza, I.R.S.; Dias, R.B.; de Valverde, L.F.; Vidal, M.T.A.; Sales, C.B.S.; Rocha, C.A.G.; Moreira, D.R.M.; Soares, M.B.P.; et al. Novel Piplartine-Containing Ruthenium Complexes: Synthesis, Cell Growth Inhibition, Apoptosis Induction and ROS Production on HCT116 Cells. Oncotarget 2017, 8, 104367–104392. [Google Scholar] [CrossRef] [PubMed]
- Costa, M.S.; Gonçalves, Y.G.; Borges, B.C.; Silva, M.J.B.; Amstalden, M.K.; Costa, T.R.; Antunes, L.M.G.; Rodrigues, R.S.; de Rodrigues, V.M.; de Faria Franca, E.; et al. Ruthenium (II) Complex Cis-[RuII(Ŋ2-O2CC7H7O2)(Dppm)2]PF6-Hmxbato Induces ROS-Mediated Apoptosis in Lung Tumor Cells Producing Selective Cytotoxicity. Sci. Rep. 2020, 10, 15410. [Google Scholar] [CrossRef] [PubMed]
- Valko, M.; Morris, H.; Cronin, M.T.D. Metals, Toxicity and Oxidative Stress. Curr. Med. Chem. 2005, 12, 1161–1208. [Google Scholar] [CrossRef] [Green Version]
- Ayala, A.; Muñoz, M.F.; Argüelles, S. Lipid Peroxidation: Production, Metabolism, and Signaling Mechanisms of Malondialdehyde and 4-Hydroxy-2-Nonenal. Oxidative Med. Cell. Longev. 2014, 2014, e360438. [Google Scholar] [CrossRef] [PubMed]
- Güler, G.; Gärtner, R.M.; Ziegler, C.; Mäntele, W. Lipid-Protein Interactions in the Regulated Betaine Symporter BetP Probed by Infrared Spectroscopy. J. Biol. Chem. 2016, 291, 4295–4307. [Google Scholar] [CrossRef] [Green Version]
- Saeed, A.; Raouf, G.A.; Nafee, S.S.; Shaheen, S.A.; Al-Hadeethi, Y. Effects of Very Low Dose Fast Neutrons on Cell Membrane And Secondary Protein Structure in Rat Erythrocytes. PLoS ONE 2015, 10, e0139854. [Google Scholar] [CrossRef]
- Kreuzer, M.; Stamenković, S.; Chen, S.; Andjus, P.; Dučić, T. Lipids Status and Copper in a Single Astrocyte of the Rat Model for Amyotrophic Lateral Sclerosis: Correlative Synchrotron-Based X-ray and Infrared Imaging. J. Biophotonics 2020, 13, e202000069. [Google Scholar] [CrossRef]
- Palaniappan, P.L.R.M.; Vijayasundaram, V. The FT-IR Study of the Brain Tissue of Labeo Rohita Due to Arsenic Intoxication. Microchem. J. 2009, 91, 118–124. [Google Scholar] [CrossRef]
- Nir, S.; Van Der Andersen, M. Waals Interactions between Cell Surfaces. J. Membr. Biol. 1977, 31, 1–18. [Google Scholar] [CrossRef]
- Blume, A.; Huebner, W.; Messner, G. Fourier Transform Infrared Spectroscopy of 13C:O Labeled Phospholipids Hydrogen Bonding to Carbonyl Groups. Biochemistry 1988, 27, 8239–8249. [Google Scholar] [CrossRef]
- Cyboran-Mikołajczyk, S.; Żyłka, R.; Jurkiewicz, P.; Pruchnik, H.; Oszmiański, J.; Hof, M.; Kleszczyńska, H. Interaction of Procyanidin B3 with Membrane Lipids—Fluorescence, DSC and FTIR Studies. Biochim. Biophys. Acta (BBA) Biomembr. 2017, 1859, 1362–1371. [Google Scholar] [CrossRef]


| Structural Formula | Electrical Charge Zeta Potential | Mean Size | Lipophilicity log Ko/w | |
|---|---|---|---|---|
| Ru Complex | 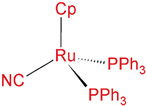 Ph-C6H5, Cp-η5-C5H5 | neutral | μm-sized | >+3 * |
| CDs |  | −6.6 mV | 7–8 nm | −0.84 |
| N-CDs |  | 7.8 mV | 7.8 nm | −1.73 |
| Signal Position (m/z) | Signal Assignment | Signal Position (m/z) | Signal Assignment |
|---|---|---|---|
| 449.4 | [LPA (16:0) + 2H + K]+ | 686.9 | [PA (16:0; 16:0) + K]+ |
| 483.3 | [LPA (18:0) + H + 2Na]+ | 715 | [PE (16:0; 18:2) + H]+ |
| 498.3 | [LPE (16:0) – H + 2Na]+ | 735.5 | [PA (16:0; 20:4) + 2H + K]+ |
| 501.2 | [LPE (18:0) + Na]+ | 760.6 | [PC (16:0; 18:1) + H]+ |
| 504.3 | [LPE (20:4) + H]+ | 767.5 | [PG (16:0; 16:0) + 2Na]+ |
| 538.9 | nonidentified | 773.5 | [PG (16:0; 18:0) + H + Na]+ |
| 544.3 | [LPC (18:1) + Na]+ | 782.6 | [PC (16:0; 18:1) + Na]+ or [PC (16:0; 20:4) + H]+ |
| 551 * | Matrix-oligomer | 786.6 | [PC (18:0; 18:2) + H]+ |
| 567 * | Matrix-oligomer | 808.6 | [PC (18:1; 20:4) + H]+ or [PC (18:2; 18:2) + H]+ |
| 570.4 | [LPC (22:5) + H]+ or [LPS (18:0) + 2Na]+ | 881.4 | ([PI (16:0; 20:4) + Na]+) |
| 590–650 | Fragmentation product of PE | 953.6 | ([PI (43:6) + H]+) or [PI (21:0; 22:6) + H]+ |
| 592.3 | [LPC (22:5) + Na]+ or [LPS (18:0) − H + 3Na]+ | 979.7 | [PI (44:0) + H]+ or [PI (22:0; 22:0)) + H]+ |
| Band Assignment | Band Position (cm−1) |
|---|---|
| ν(C=O) | 1760–1725 |
| νs(CH2) | 2862–2842 |
| νs(CH3) | 2882–2862 |
| νas(CH2) | 2945–2900 |
| νas(CH3) | 2980–2945 |
| ν(C=C–H) | 3100–3000 |
| Percentage of H-Bonded C=O Groups | |
|---|---|
| A2780 | 15.69% |
| A2780 + RuCN | 46.28% |
| A2780 + RuCN/CDs | 40.68% |
| A2780 + RuCN/N-CDs | 39.14% |
Publisher’s Note: MDPI stays neutral with regard to jurisdictional claims in published maps and institutional affiliations. |
© 2022 by the authors. Licensee MDPI, Basel, Switzerland. This article is an open access article distributed under the terms and conditions of the Creative Commons Attribution (CC BY) license (https://creativecommons.org/licenses/by/4.0/).
Share and Cite
Nešić, M.D.; Dučić, T.; Algarra, M.; Popović, I.; Stepić, M.; Gonçalves, M.; Petković, M. Lipid Status of A2780 Ovarian Cancer Cells after Treatment with Ruthenium Complex Modified with Carbon Dot Nanocarriers: A Multimodal SR-FTIR Spectroscopy and MALDI TOF Mass Spectrometry Study. Cancers 2022, 14, 1182. https://doi.org/10.3390/cancers14051182
Nešić MD, Dučić T, Algarra M, Popović I, Stepić M, Gonçalves M, Petković M. Lipid Status of A2780 Ovarian Cancer Cells after Treatment with Ruthenium Complex Modified with Carbon Dot Nanocarriers: A Multimodal SR-FTIR Spectroscopy and MALDI TOF Mass Spectrometry Study. Cancers. 2022; 14(5):1182. https://doi.org/10.3390/cancers14051182
Chicago/Turabian StyleNešić, Maja D., Tanja Dučić, Manuel Algarra, Iva Popović, Milutin Stepić, Mara Gonçalves, and Marijana Petković. 2022. "Lipid Status of A2780 Ovarian Cancer Cells after Treatment with Ruthenium Complex Modified with Carbon Dot Nanocarriers: A Multimodal SR-FTIR Spectroscopy and MALDI TOF Mass Spectrometry Study" Cancers 14, no. 5: 1182. https://doi.org/10.3390/cancers14051182
APA StyleNešić, M. D., Dučić, T., Algarra, M., Popović, I., Stepić, M., Gonçalves, M., & Petković, M. (2022). Lipid Status of A2780 Ovarian Cancer Cells after Treatment with Ruthenium Complex Modified with Carbon Dot Nanocarriers: A Multimodal SR-FTIR Spectroscopy and MALDI TOF Mass Spectrometry Study. Cancers, 14(5), 1182. https://doi.org/10.3390/cancers14051182