
Predicting Response to Neoadjuvant Therapy in Oesophageal Adenocarcinoma

Simple Summary
Abstract
1. Introduction
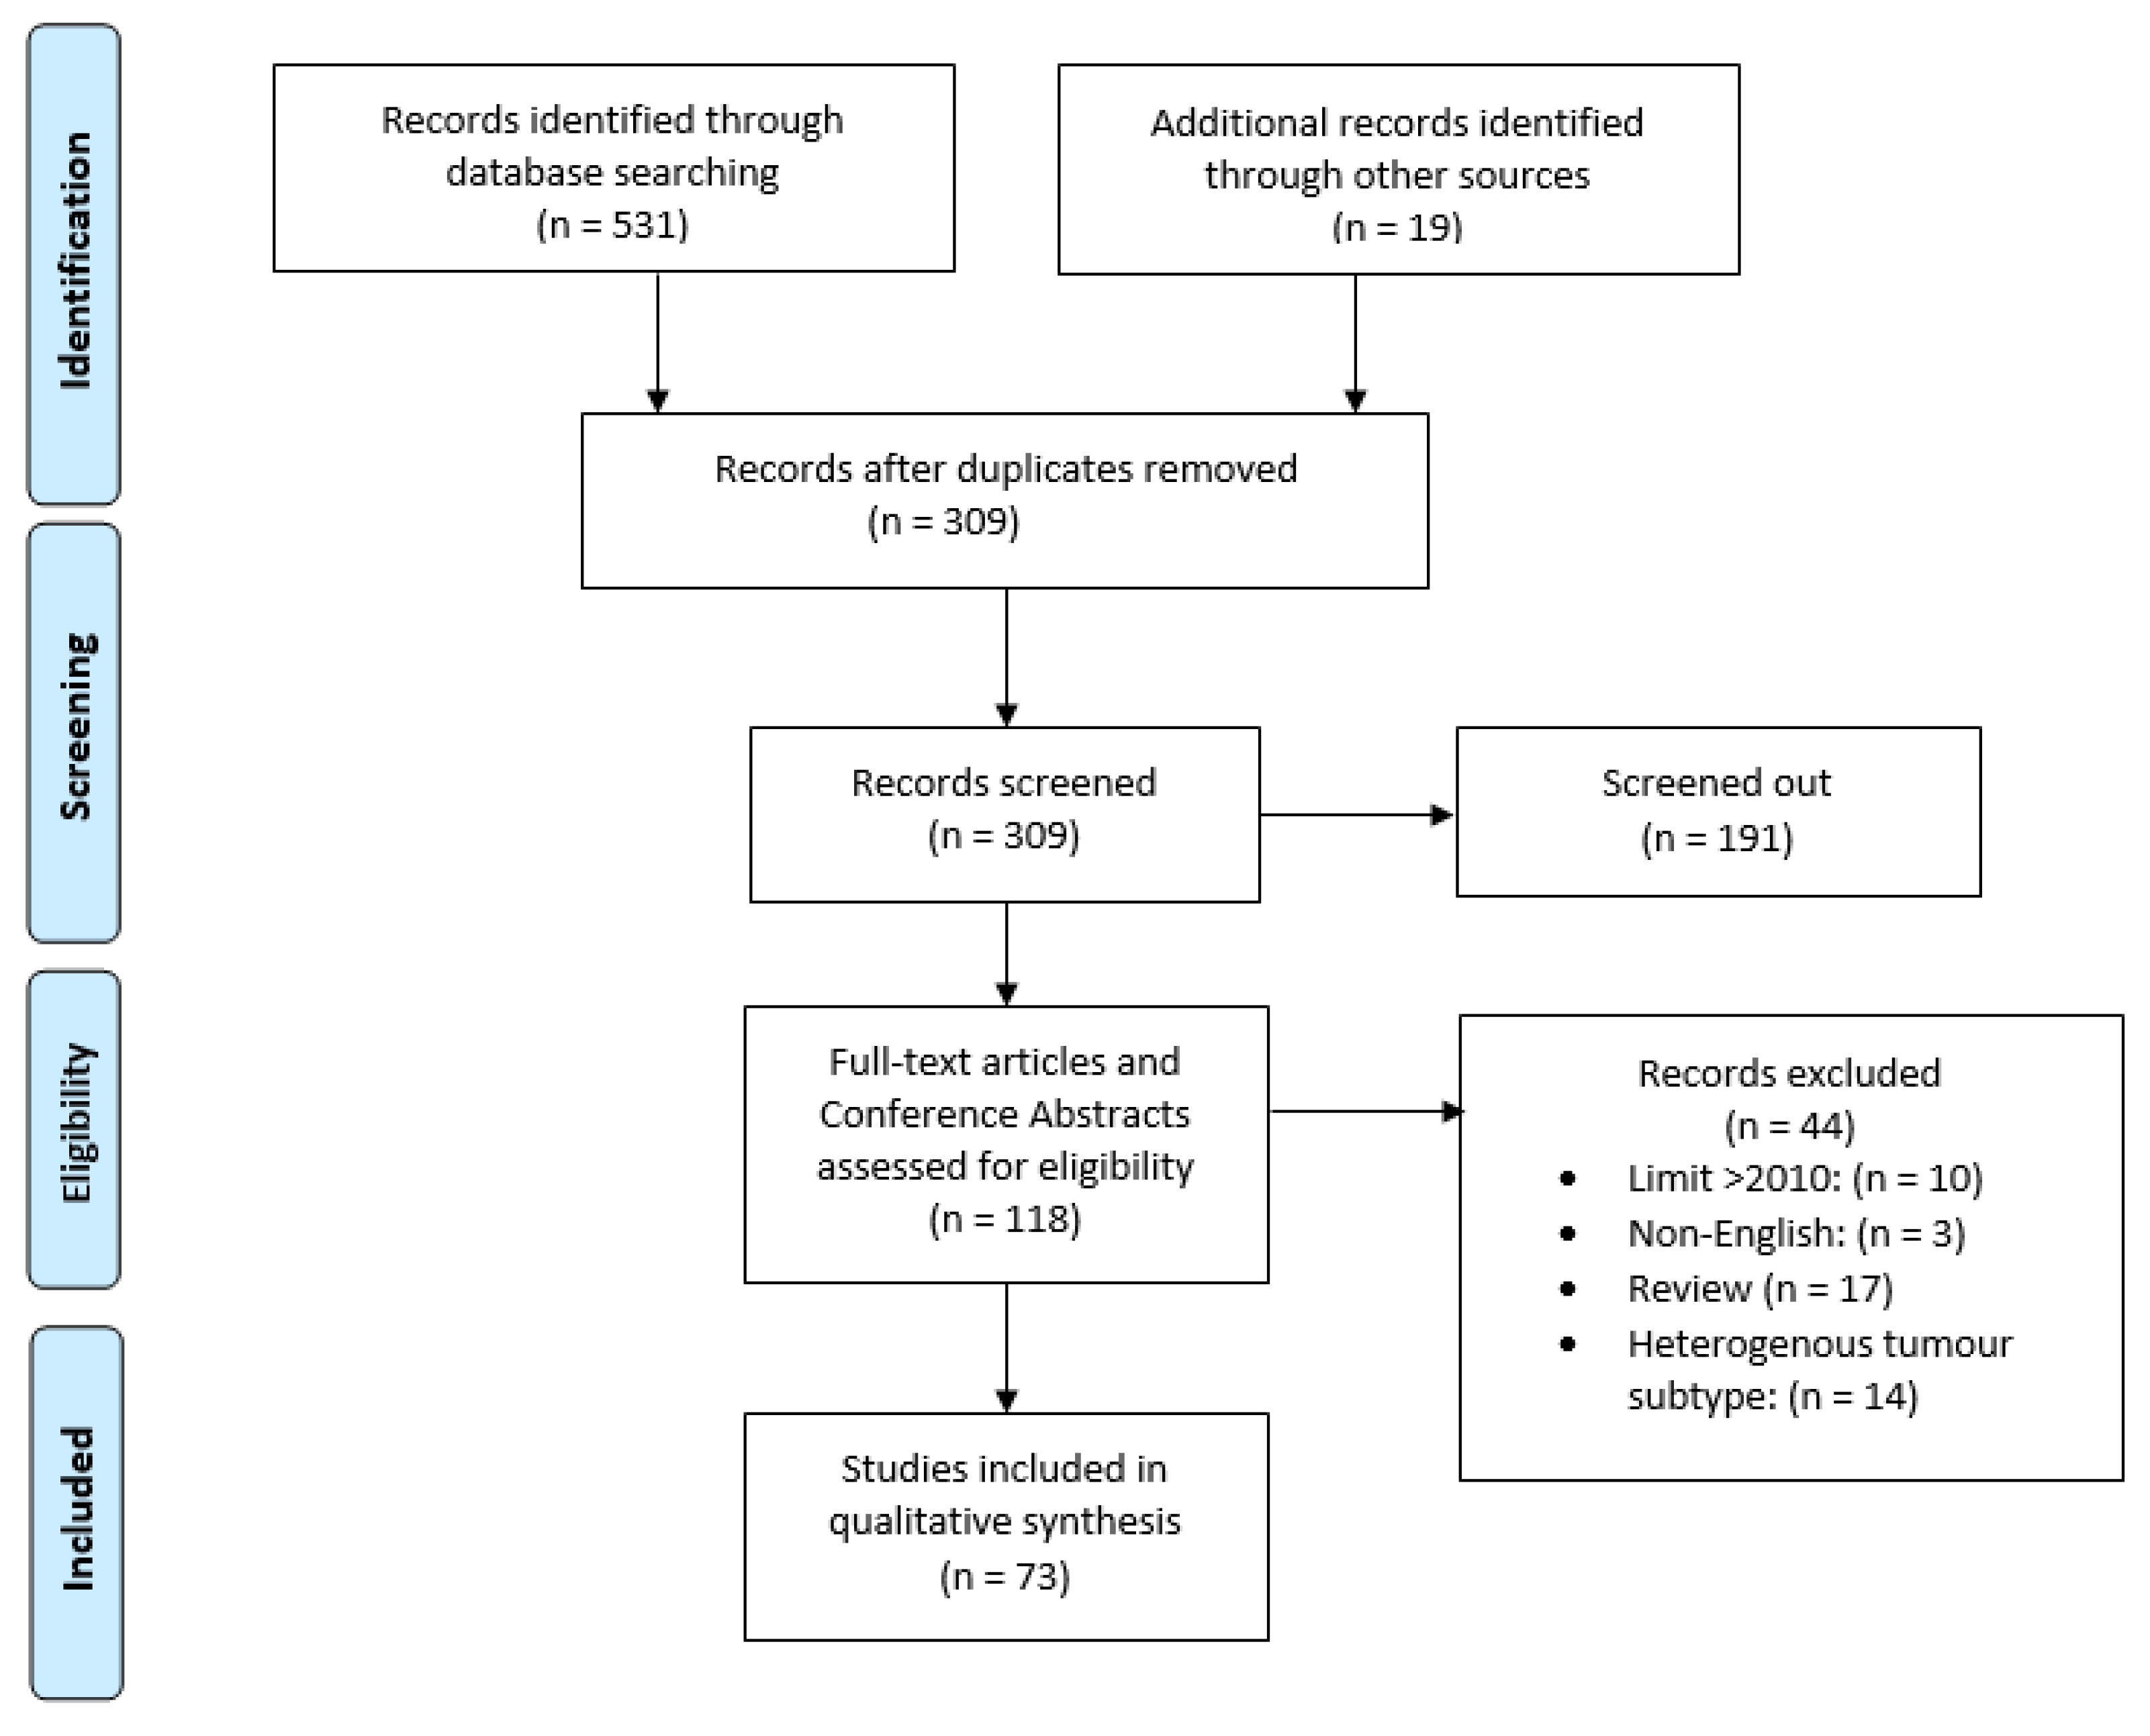
2. Materials and Methods
3. Results
4. Discussion
4.1. Imaging Markers
4.1.1. Computed Tomography
4.1.2. Fluorodeoxyglucose-Positron Emission Tomography
4.1.3. Magnetic Resonance Imaging
4.2. Epigenetic Biomarkers
4.2.1. MicroRNA
4.2.2. MiRNA Panels
4.2.3. DNA Methylation
4.3. Genetic Biomarkers
4.3.1. Genes
4.3.2. Gene Panel
4.3.3. Alleles
4.3.4. Copy Number Alterations
4.4. Protein Expression
4.4.1. Growth and Proliferation
4.4.2. Metabolic Dysregulation
4.4.3. Anti-Apoptosis
4.4.4. Loss of DNA Repair and Cell Cycle Regulation
4.4.5. Molecular Panels
4.5. Immunologic Biomarkers
4.5.1. Immune Cells
4.5.2. Immune Markers
4.5.3. Immune Panels
4.6. Blood and Serum Markers
4.6.1. Circulating Tumour Markers
4.6.2. Plasma and Serum Markers
4.7. Miscellaneous Markers
4.7.1. Adipocytes and Leptin
4.7.2. Cancer Stem Cells
4.7.3. Tumour Proportions
4.7.4. Organoid Cultures
4.8. Limitations
5. Conclusions
5.1. Minimise Heterogeneity Where Possible
- OAC and OSCC should be treated as different entities; future studies should either focus on a specific histological subtype or provide unpooled subtype analyses.
- Tumour locations, such as oesophageal, gastro-oesophageal and gastric should similarly be differentiated.
- TRG classification systems should aim for standardisation across the literature along with a definition of a ‘good’ and ‘bad’ response to allow for more valid comparisons between studies. To reduce the effect of interobserver variability with TRG between institutions, consider comparing Mandard’s TRG1-2 to 4-5 for detecting biomarkers.
- Consistency with NAT regimen between patients.
5.2. Clinical Validation
- All preclinical studies should aim to include an internal validation cohort.
- All studies are recommended to pursue external validation.
5.3. Future Research Directions
- Biomarker panels may provide better-combined predictive potential than singular biomarkers, just as multimodality imaging has improved predictive value of imaging.
- Development of artificial neuronal networks for multi-molecular biomarker panel assessment.
- Use of organoid cultures to identify biomarkers of interest.
- Investigation into the predictive potential of the biomarker NNMT in OAC.
- Implementation of robust predictive models that integrate data from different diagnostic streams (e.g. radiological and pathological response indicators).
Author Contributions
Funding
Acknowledgments
Conflicts of Interest
Appendix A

Appendix B

| Year | Biomarker | Tumour Type and No. of Patients | NAT Regimen | TRG (GR v BR) | Study Type | Findings | Reference |
|---|---|---|---|---|---|---|---|
| CT | |||||||
| 2011 | 3D-CT | 33 OAC; 6 OSCC | CROSS | Mandard (1–2 vs. 3–5) | Prospective | The 14-day tumour volume change was not statistically significant between response groups in terms of TRG. AUC-ROC = 0.71. CT volumetry not recommended for response assessment. | Van Heijl [18] |
| FDG-PET(-CT) | |||||||
| 2010 | PET * | - | MAGIC (ECX) | Mandard | Prospective | Preliminary results of FDG-PET measured metabolic response could predict histopathological response. | Bain [20] |
| 2011 | PET | 119 OAC; 26 OSCC | CROSS | Mandard (1–2 vs. 3–5) | Prospective | AUC-ROC = 0.71 in OAC patients, very similar to the AUC-ROC overall. NPV = 75% at 0% cut-off. If 20% or 30% cut-off used, half of patients were incorrectly identified by PET to be non-responders. No association between reduced SUV and NAT response but accuracy and NPV was too low to be clinically useful. | Van Heijl [21] |
| 2012 | PET-CT | 38 OAC; 8 OSCC; 2 Other | Oxaliplatin +5FU | Mandard (1–3 vs. 4–5) | Prospective | Subgroup analysis of OAC demonstrates PET/CT metabolic response significantly associated with histopathological pathological response. Low sensitivity (55%). | Gillies [22] |
| 2012 | PET-CT | 66 OAC | MAGIC (ECF/ECX) | Schneider (1–2 vs. 3–4) | Retrospective | NAT responders identified at a 79% true negative, and 75% true positive rate at a >67% SUV change cut-off. True negative of 100% and 33% true positive at a >33% cut-off. FDG-PET not accurate enough to predict NAT responders. AUC-ROC = 0.810. | Kauppi [23] |
| 2013 | PET Radiomics | 18 OAC 2 OSCC | CALBG 9781 | Mandard | Retrospective | Various PET tumour features including: SUV intensity distribution, texture and geometry were extracted. Decline in mean SUV, skewness and certain texture features demonstrated AUC-ROC = 0.76+. | Tan [25] |
| 2014 | PET-CT * | 6 OAC; 13 OSCC | - | - | Prospective (registered) | FDG-PET-CT measuring SUV change (SUV) did not significantly predict response. Tumour liver ratio % change was associated with response (p = 0.01). | Dash [24] |
| 2016 | PET Radiomics | 217 OAC | Oxaliplatin/Doxetaxel + 5FU | pCR | Retrospective | FDG-PET-based intratumoral uptake heterogeneity as a biomarker provides incremental increase in response prediction (AUC-ROC = 0.72) compared to clinical prediction model (AUC-ROC = 0.67). | Van Rossum [26] |
| 2017 | PET-CT * | - | - | - | Preclinical | 18F-FAZA PET/CT in OAC xenograft models predicted worse radiotherapy response. (Sensitivity = 92.3%, specificity = 71.4%). | Elodie [110] |
| MRI studies | |||||||
| 2016 | DCE-MRI | 21 OAC; 3 OSCC; 1 other | CROSS | Mandard (1–2 vs. 3–5) and pCR | Prospective | AUC changes are promising in predictive potential. AUC change during vs. pre-NAT was most predictive of GR (sensitivity = 92%, specificity = 77%, PPV = 79% and NPV = 91%, at a 22.7% threshold). | Heethuis [30] |
| 2014 | DWI-MRI | 11 OAC; 1 OSCC | CALBG 9781 | Mandard (1–2 vs. 3–5) | Prospective | No significant difference in mean ADC between response groups. Sample size may be too low to detect a significant correlation. Mean tumour ADC with manual measurement has good interobserver reproducibility with an intraclass correlation coefficient (ICC) of 0.69 (95% CI, 0.36 to 0.85; p= 0.001). Interobserver reproducibility by semi-automated volumetric measurement method was better with an ICC of 0.96 (95% CI, 0.91 to 0.98; p = 0.001). | Kwee [29] |
| 2015 | DWI-MRI | 15 OAC; 5 OSCC | CROSS | Mandard (1–2 vs. 3–5) and pCR | Prospective | ADC compared during vs. baseline was significantly higher in pCR patients as well as GR patients—c-statistic = 0.90. Predictive of poor pathologic response at threshold of 21% (sensitivity = 82%, specificity = 100%, PPV = 100% and NPV = 80%). | Van Rossum [27] |
| 2020 | DWI-MRI | 16 OAC; 8 OSCC | CROSS | Mandard (pCR) | Prospective | DWI-MRI during the 2nd week on starting neoadjuvant chemoradiotherapy is most predictive for pCR. ROC-AUC = 0.87 in second week and increased to 0.97 after several outlier patients excluded. | Borggreve [28] |
| 2018 | DWI-MRI and DCE-MRI | 28 OAC; 4 OSCC | CROSS | Mandard (1–2 vs. 3–5) and pCR | Prospective | DWI-MRI ADC change post- vs. pre-NAT yields c-statistic of 0.75. DCE-MRI AUC change during vs. pre-NAT demonstrated a c-statistic of 0.79 for pCR. When combined, the complementary c-statistic increased to 0.89. | Heethuis [31] |
| 2018 | FDG-PET-CT and DWI-MRI | 17 OAC; 3 OSCC | CALBG 9781 | Mandard (pCR) | Prospective | Relative changes of ADC mean and 25th and 10th percentiles from baseline to interim completely discriminated pCR vs. non-pCR with c-statistic = 1. High inter-reader reliability. On FDG-PET-CT, changes in SUVmax showed no significant difference between NAT response groups but change in total lesion glycolysis (TLG) during vs. pre-NAT did with a c-statistic of 0.947. | Fang [32] |
| 2020 | FDG-PET and DWI-MRI | 57 OAC; 11 OSCC; 1 other | CROSS, CALBG 9781 | Chirieac (1–2 vs. 3–5) and pCR | Prospective | Combining ADC findings from DWI-MRI during NAT, SUV from FDG-PET and histology to discriminate pCR yields c-statistic of 0.84. (individually ADC during = 0.82, SUV mean post = 0.79). | Borggreve [33] |
| 2021 | DWI-MRI and DCE-MRI and FDG-PET-CT | 200 patients; >130 OAC | - | - | Prospective | ClinicalTrial.gov Identifier: NCT03474341. Pride study. Recruitment phase. Aims to develop multimodal model to predict probability of pCR by combining DWI-MRI, DCE-MRI and FDG-PET-CT by comparing scans before, during and after NAT. | Borggreve [35] |
| Year | Biomarker | Tumour Type and No. of Patients | NAT Regimen | TRG (GR v BR) | Study Type | Findings | Reference |
|---|---|---|---|---|---|---|---|
| MiRNA | |||||||
| 2012 | MiRNA-31 | 19 OAC (discovery cohort) | Cisplatin + 5FU + 40.5 Gy | Mandard (1–2 vs. 3–5) | Preclinical (with discovery cohort). | MiRNA-31 potentially affects DNA repair genes (PARP1, SMUG1, MLH1 and MMS19). Downregulated MiRNA-31 may contribute to radioresistance; overexpression did not enhance radiosensitivity. | Lynam-Lennon [41] |
| 2013 | MiRNA-192 and 194 | 16 OAC (discovery cohort); 42 OAC; 28 SCC | Cisplatin + 5FU + 40 Gy | Cologne (1–2 vs. 3–4) | Retrospective (with discovery cohort). | Pre-NAT intra-tumoural miRNA-192 and 194 was higher in OSCC and OAC, though not statistically verified. Only miRNA-192 was linked to higher TRG in OSCC patients. | Odenthal [43] |
| 2015 | MiRNA-330-5p | 18 OAC (discovery cohort) | Cisplatin + 5FU + RTx | Mandard (1–2 vs. 4–5) | Preclinical (with discovery cohort). | miRNA-330-mediated changes to E2F1/p-AKT pathway did not significantly alter chemosensitivity. Silencing of miR-330-5p enhanced, albeit subtly, cellular resistance to clinically relevant doses of radiation. | Bibby [38] |
| 2016 | MiRNA-187 | 18 OAC (discovery cohort) | Cisplatin + 5FU + 40 Gy | Mandard (1–2 vs. 3–5) | Preclinical (with discovery cohort). | There are 67 differentially altered miRNA identified. Low Mir-187 was found in patients with poor NAT response. In vitro, miR-187 modulates radiation and cisplatin sensitivity and alters variety of pathways, including C3 serum levels (increased in poor responders). Supports C3 increase as predictive marker. | Lynam-Lennon [39] |
| 2017 | MiRNA-17-5p | 18 OAC (discovery cohort). | Cisplatin + 5FU + 40 Gy | Mandard (1,2 vs. 3–5) | Preclinical (with discovery cohort). | In vitro, miR-17-5p significantly sensitises radioresistant cells to radiation and promotes repression of genes with miR-17-5p binding sites. In vivo, miR-17-5p is significantly decreased with poor NAT responders. Subpopulation of cells had low miR-17-5p, high ALDH activity and increased radioresistance. | Lynam-Lennon [40] |
| 2018 | MiRNA ratios | 31 OAC | Cisplatin + 5FU + RTx | AJCC (0 vs. 1–3) | Retrospective | Predictive performance of miRNA ratios were analysed and miR-4521/miR-340-5p found to perform best (sensitivity = 95%; specificity = 89%). miR-101-3p/miR-451a and miR-1433p/miR-451a both had a sensitivity of 91% and specificity of 89%. | Chiam [42] |
| miRNA panels | |||||||
| 2014 | MiRNA panel | 10 OAC; (discovery) 43 OAC; (model) 65 OAC; (validation) | CALBG 9781 | pCR | Retrospective | MiRNA profile (mir-505 *, mir-99b, mir-451 and mir-145 *). Probability of pCR plot produced, which classifies patients with very high (80%) and very low (10%) probability of pCR. MiRNA expression profile score correlated to probability plot and is a validated means of determining probability of pCR. MEP score AUC-ROC = 0.78 (model cohort), 0.71 (validation cohort) and 0.72 (combined cohort). When combined with clinical variables, the MEP score ROC-AUCs increased to 0.89, 0.77 and 0.81, respectively. | Skinner [44] |
| 2015 | MiRNA panel | 50 OAC; | EOX, FLOT + 40–55 Gy | Cologne (1–2 vs. 3–4) | Retrospective | Based on the divergent miRNA pattern, miR-21, miR-192, miR-222, miR-302c, miR-381 and miR-549 were selected for further validation. MiRNA profile differs depending on NAT response, but failed to show significance in expanded patient cohort. | Odenthal [45] |
| DNA methylation | |||||||
| 2019 | TFAP2E * | 60 OAC | 5FU based CTx | - | Retrospective | Higher mean TFAP2E methylation in patients without histopathological response to 5-FU-based chemotherapy (34% vs. 22%, p < 0.0001). AUC-ROC = 0.790 at 26.85% cut-off value of methylation. | Slotta-Huspenina [46] |
| Year | Biomarker | Tumour Type and No. of Patients | NAT Regimen | TRG (GR vs. BR) | Study Type | Findings | Reference |
|---|---|---|---|---|---|---|---|
| Genes | |||||||
| 2010 | Ephrin B3 Receptor | 47 OAC | Cisplatin + 5FU + folinic acid | Becker (1–2 vs. 3) | Retrospective | The 86 differentially expressed genes involved in cell cycle regulation, gene expression, tumour suppression, signal transduction, cytoskeleton and transcription identified on microarray. Ephrin B3 receptor had strongest difference in expression rate. | Schauer [50] |
| 2017 | CCL28 and DKK3 | 29 OAC | CROSS (93%) | Nil TRG (pCR) | Retrospective | CCL28 overexpression and DKK3 underexpression discriminates pCR from non-pCR (p < 0.01). CCL28 was overexpressed by a factor of 2.28 in pCR specimens, while DKK3 was underexpressed by 15% compared to non-pCR. Inhibition of DKK3 may reduce chemoresistance. | McLaren [49] |
| Gene Panel | |||||||
| 2019 | Gene Panel * | 56 OAC | - | Mandard (1–2 vs. 4–5) | Retrospective | Pilot study—Apoptosis and cell cycling genes upregulated in responders. Cytokine signalling and immune response genes upregulated in non-responders. The 26 differentially expressed genes were used to create an artificial neuronal network to predict NAT response. Accuracy = 73%, sensitivity = 80% and specificity = 70%. | Lloyd [52] |
| Alleles | |||||||
| 2011 | ABCB1 gene polymorphism C345T | 146 OAC; 116 OSCC | Cisplatin + 5FU + 36 Gy | Cologne (1–2 vs. 3–4) | Retrospective | Although 3 polymorphisms (TT, CT, CC) were associated with lymph node status and metastases, it was not predictive for response of the primary tumor to NAT. | Narumiya [55] |
| 2012 | ERCC1-SNP | 153 OAC | Cisplatin + 5FU + 36 Gy | Schneider (1–2 vs. 3–4) | Retrospective | ERCC1 polymorphism (SNP rs11615) CT was predictive of response to NAT (p < 0.001). Heterozygosity suggested therapy response in 66.1% of all pts with major response. | Metzger [54] |
| 2016 | ERCC1-SNP * | 56 OAC; 29 OSCC | Cisplatin+ 5FU + 40 Gy | Schneider (1–2 vs. 3–4) | Prospective | ERCC1-SNP with mRNA ERCC1, DPYD and ERBB2 associated with minor response to chemoradiation. Homozygous ERCC1-SNP (CC, TT) had similar minor response (70% and 75%). Heterozygous ERCC1-SNP (CT) not reported. | Bollschweiler [57] |
| 2018 | VDR polymorphisms | 36 OAC; 16 other | - | Schneider (1–2 vs. 3–4) | Retrospective | Blood and tissue samples were assessed for Vit D levels, gene expression and polymorphisms in VDR (FokI, BsmI, ApaI, TaqI), CYP24A1 and CYP27B1. Biallelic BsmI(bb) mutation and homozygous ApaI genes (AA) were associated with reduced response to NAT. Homozygous mutant ApaI gene (aa) was exclusive to responders of NAT in OAC. | Singhal [56] |
| 2014 | TP53 | 20 OAC; 16 SCC | Cisplatin + 5FU | Complete v. partial response | Retrospective | Significant difference in response to NAT based on TP53 marker status—normal vs. mutated (p < 0.0001). Did not specify associations between good and bad response. | Kandioler [60] |
| 2018 | TP53 | 103 OAC; 78 OSCC | Cisplatin+ 5FU | Chirieac | Prospective | 5FU and cisplatin response hypothesised to be dependent on normal TP53. TP53 mutation rate (77.9%) higher than what was expected in patients with oesophageal cancer. Results of clinical validation of predictive effect have yet to be presented. | Kappel-Latif [61] |
| Genomic Copy Number Alterations | |||||||
| 2019 | Genomic gains * | 52 OAC | - | pCR | Retrospective | Genomic gains in chromosome 14q11 and 19p13 were significantly associated with pCR. First biomarker study with independent validation with a focus on genomic gains. | Qian [62] |
| Year | Biomarker | Tumour Type and No. of Patients | NAT Regimen | TRG (GR vs. BR) | Study Type | Findings | Reference |
|---|---|---|---|---|---|---|---|
| Growth and Proliferation | |||||||
| 2014 | EGFR | 86 OAC | Cisplatin + 5FU + folinic acid | Becker (1 vs. 2-3) | Retrospective | EGFR overexpression and copy number gains associated with resistance to cisplatin-based neoadjuvant chemotherapy (p < 0.0001). | Aichler [63] |
| 2015 | NF-kB, SHH and Gli-1 | 64 OAC | 5FU + taxane +/− platin + 50.4 Gy | Becker (0 vs. 1–3) AND Rohatgi (0 v 1–2 vs. 3) | Retrospective | This study validates the IHC-based assay as having good predictive value in OAC. High average AUC-ROC of 0.96 and 0.85, respectively, in two independent labs. PPV between labs was 88% and 82%; NPV at both labs was 83%. Interobserver concordance was 97%. | Rosen [66] |
| 2022 | Hedgehog pathway components | 78 OAC/OSCC/GOJ (estimate) | - | - | Prospective | ClinicalTrials.gov Identifier: NCT04018872. Phase II Clinical Trial. Trial evaluating effectiveness of itraconazole in inhibiting hedgehog and AKT signalling pathway. Hedgehog pathway markers used to determine response to therapy. | |
| Metabolic Dysregulation | |||||||
| 2013 | Mitochondrial respiratory chain proteins | 23 OAC; (discovery cohort) 46 OAC; (validation cohort) | Cisplatin + 5-FU | Becker (1 vs. 2-3) | Retrospective | Reduced expression of mitochondrial respiratory chain proteins (COX7A2, COX6B1, COX6C and complex I-MLRQ) lowers threshold for cell death and is associated with increased response to treatment with cisplatin. | Aichler [68] |
| 2013 | Thioredoxin interacting protein | 27 OAC; 20 Gastric; 41 GOJ; | MAGIC or platin + 5FU | Mandard (1–3 vs. 4–5) | Prospective | No significant difference in thioredoxin interacting protein between TRG1-3 and TRG4-5 in surgery-only or neoadjuvant chemotherapy group (p = 0.169). | Woolston [71] |
| 2014 | Mitochondrial function | 23 OAC; | Cisplatin + 5FU + RTx | Mandard (1–2 vs. 3–5) | Preclinical | Alterations in mitochondrial function and energy metabolism observed in vitro, such as increased oxidative phosphorylation rates and higher ATP5B. Glycolytic markers (GAPDH, PKM2) and HSP60 were all increased in the tumour epithelium vs. stromal compartment of OAC biopsies. Proliferative differences in the two tissue compartments may exist. | Lynam-Lennon [67] |
| Anti-apoptosis | |||||||
| 2015 | BIRC3 | 32 OAC; 33 OSCC (unpooled internal validation cohort) | cisplatin + docetaxel + 5FU + 50 Gy | Mandard (1–3 vs. 4–5) | Preclinical (with internal validation). | TAK1 inhibitor suppresses BIRC3 expression, which increased chemo- and radiosensitivity in OA cell lines. BIRC3 appears to be an important mediator of resistance. In patients, median expression of BIRC3 was (p < 0.0001) higher in OAC than in the more sensitive OSCC. BIRC3 expression significantly discriminated NAT sensitivity patients with OAC (AUC-ROC = 0.8074). | Piro [72] |
| 2017 | SCCA1 | 90 OAC | Platin based | Mandard (1–2 vs. 5) | Retrospective | SCCA-1 confers resistance to induced apoptosis by different mechanisms. SCCA-1 and SCCA-2 expression significantly downregulated in OAC overall. SCCA expression is significantly associated to reduced NAT sensitivity. In addition, SCCA expression has greater distribution in higher TRG OACs. | Fassan [74] |
| 2018 | Autophagy markers (LC3B and p62) | 127 OAC | paclitaxel (in vitro) 5FU + cisplatin +/− paclitaxel | Becker (1–2 vs. 3) | Preclinical | High p62 cytoplasmic expression alone, or in combination with low LC3B was associated with NAT non-response. LC3B or p62 demonstrated no independent prognostic value post-NAT. Issues with biopsy specimens prevented tissue response prediction from being conducted. | Adams [73] |
| 2019 | SCCA1 | 56 OAC | Mandard—not specified | Preclinical study (with external validation). | OE19 cells overexpressed SCCA1 200 times more and were more resistant to docetaxel treatment. SCCA1 induces PD-L1 expression in human monocytes. OE33 cells overexpressing SCCA1 were more resistant to cell death than the control OE19 cells after treatment with epirubicin, docetaxel and cisplatin. SCCA1 increased immune activation markers. | Turato [75] | |
| Loss of DNA repair, cell cycle regulation | |||||||
| 2010 | ERCC1 | 88 OAC; 13 OSCC; 2 other | MAGIC or cisplatin + 5FU | Mandard (1–3 vs. 4–5) | Retrospective | ERCC1-positive tumours were associated with poor histopathological response to chemotherapy (p = 0.006). Nuclear expression of p53 was also explored—no correlation with TRG response (p = 0.706). | Fareed [84] |
| 2017 | p53, SOX2 and CD44 proteins | 77 OAC (primary cohort) 70 (validation cohort) | CROSS | Mandard (1–2 vs. 3–4) | Retrospective | Aberrant p53 and SOX2 combined were significantly associated with response to NAT. Aberrant p53 expression by itself demonstrated borderline significance for predicting therapy response. CD44 expression demonstrated no significant association with NAT response in primary cohort. Primary cohort—combined markers: sensitivity = 64%, specificity = 75%, PPV = 74% and NPV = 64%. | Van Olphen [69] |
| 2018 | Axl * | - | - | - | Preclinical (without validation) | CKD9 inhibitor increases radiosensitivity of cells to prolonged DNA damage in vitro by enhancing G2/M arrest and apoptosis. Axl found as candidate biomarker for CDK-9 inhibition—Axl mRNA, and protein significantly reduced (52%) with CDK-9 use with radiation (p < 0.006). | Veeranki [111] |
| Molecular Panel | |||||||
| 2010 | TS, MRP-1, ERCC1 and P-gp | 40 OAC | 5-FU + cisplatin +/− paclitaxel | Becker (1–2 vs. 3) | Retrospective | High TS or MRP-1 protein expression was correlated to tumour non-response to NAT (p = 0.001 and p = 0.036, respectively). For ERCC-1 and P-gp, no association between pretherapeutic protein expression and response was found. | Langer [85] |
| 2015 | Panel | 53 OAC | - | pCR | Retrospective | Molecular biomarker panel (NF-kB, TGF-B, COX-2, Her-2/neu, p53, B-catenin, E-cadherin and MMP-1) was highly heterogeneous between pCR patients with no correlation to NAT response. | Bronson [86] |
| Year | Biomarker | Tumour Type and No. of Patients | NAT Regimen | TRG (GR vs. BR) | Study Type | Findings | Reference |
|---|---|---|---|---|---|---|---|
| Immune Cells | |||||||
| 2020 | NLR | 215 OAC and GOJ | Cisplatin + 5FU + docetaxel | pCR | Retrospective | Secondary outcome demonstrated that mean baseline NLR was significantly lower in patients who had pCR (p = 0.009). If NLR < 1.9, likely to have pCR. | Al Lawati [88] |
| 2020 | NLR | 136 OAC | Cisplatin + 5FU, minority—MAGIC | Mandard (1–2 vs. 3–5) | Retrospective | Pre-treatment NLR was significantly associated with a pathological response. A total of 73.5% of patients in this study had raised NLR (>2.25) and were almost 6x more likely to have a poor response to NAT. NLR had c-statistic = 0.71. | Powell [89] |
| 2020 | NLR | 77 OAC; 16 OSCC; | Platin + taxane or 5FU + 50.4 Gy | pCR | Retrospective | NLR changes with concurrent chemotherapy are associated with response to treatment. High NLR in week 2 of NAT makes pCR less likely (OR: 0.65; p = 0.0076). Increasing time-dependent NLR was significantly associated with non-pCR. | Sherry [90] |
| Immune Markers | |||||||
| 2018 | LIF | 26 OAC | CROSS; MAGIC | Mandard (1–2 vs. 3–5) | Preclinical (with validation) | LIF was significantly elevated in in vitro radioresistant OAC cells (p = 0.007). Circulating LIF in pre-treatment patients was high in poor responders (p = 0.037), LIF mRNA expression in tumour biopsies was not significant between response groups. Radiation increased LIF secretion in vitro. | Buckley [92] |
| 2019 | Complement C3 * | 13 OAC | - | Mandard | Retrospective and preclinical study | C3 is expressed in OAC and is significantly increased in pre-treatment OAC biopsies that have poor response to NAT (p < 0.05). In vitro, radioresistant cells have increased C3 mRNA (p < 0.01) | Cannon [93] |
| 2019 | ADAM12 | 86 OAC | CROSS | Mandard (1–2 vs. 3–4) | Preclinical | CAF induces Il-6 secretion and drives epidermal-to-mesothelial transition in vitro which confers chemoradioresistance and increased migratory capacity. Il-6 inhibition resensitised cells to therapy. Since Il-6 is non-specific, ADAM12 was found in an 86 patient cohort as a more specific marker of stromal CAFs. High serum ADAM12 was correlated with poor response to NAT (CROSS). | Ebbing [91] |
| 2020 | HER2, Grb7 | 40 HER2+ OAC | CROSS + trastuzumab + pertuzumab | - | Prospective | TRAP Phase II Feasibility Study—Grb7 positive patients demonstrated significantly better treatment response and is potentially predictive of response. | Stroes [112] |
| 2024 | PD-L1 | 56 OAC (estimate) | CROSS + durvalumab +/− tremelimumab | - | Prospective | Clinicaltrials.gov Identifier: NCT04159974. Phase II clinical trial—recruitment phase. Trial evaluating safety and efficacy of standard neoadjuvant chemoradiotherapy with immunotherapy and evaluating predictive biomarkers for response to immune checkpoint inhibition. | |
| 2024 | ADAM12 | 48 OAC (estimate) | CROSS + tocilizumab | Mandard | Prospective | ClinicalTrials.gov Identifier: NCT04554771. Phase II clinical trial—recruitment phase. ADAM12, a marker of stromal activation, will be used to assess whether stroma-targeting therapy (tocilizumab) increases efficacy of chemoradiotherapy. | |
| Immune Signatures | |||||||
| 2020 | Immunogenetic signature * | 31 OAC | CROSS | - | Retrospective | Identified 5 differentially mutated genes after comparing response in pre-treatment samples (EPHA5, ZNF217, RELN, PALB2 and MYO18A). Combined with 4 gene immune panel: TIM3, LAG3, IDO1 and CXCL9, which were all upregulated in responders. A risk stratification model was produced with these 9 genes to generate a c-statistic of 0.96 in NAT response prediction. | Ghatak [94] |
| Year | Biomarker | Tumour Type and No. of Patients | NAT Regimen | TRG (GR vs. BR) | Study Type | Findings | Reference |
|---|---|---|---|---|---|---|---|
| Circulating tumour markers | |||||||
| 2019 | CEA and CA19-9 | 102 OAC | Cisplatin+5FU or paclitaxel+36–50 Gy | Mandard | Retrospective | Concurrent elevation of CEA and CA19-9 was associated with early treatment failure (OR = 10.4; p = 0.002). Sensitivity = 0.4 (95%CI: 0.19–0.64) and specificity was 0.94 (95% CI: 0.83–0.99). PPV = 0.73 (95% CI: 0.44–0.90). | van der Kaaij [96] |
| 2019 | ctDNA | 16 OAC | CROSS | - | Prospective | ‘Proof-of-concept’ study with two patients who had pCR had baseline negative plasma ctDNA and remained disease free 500 days post-operation. Four patients selected for longitudinal plasma sequencing for ctDNA demonstrated correlation with NAT response, sometimes weeks in advance. | Egyud [95] |
| 2019 | CTC * | 1 OAC | - | - | Prospective | Baseline CTC does not correlate with treatment response. CTCs’ reduction during NAT may predict responsive but unable to draw conclusions off sample size of 1. No comparison to pCR. | Seyedin [97] |
| 2021 | CTC, miRNA | 200 OAC | CROSS, CALBG 9781 | - | Retrospective | ClinicalTrials.gov Identifier: NCT02812680. Case-control study. Recruitment Phase. Aim: To assess the use of miRNA and CTCs as biomarkers of cancer and predictive markers for neoadjuvant therapy. | |
| Plasma and Serum | |||||||
| 2010 | Plasma proteins | 4 OAC; 1 OSCC | MAGIC (ECF) | - | Preclinical | Apolipoprotein A1, Serum Amyloid A and Transthyretin demonstrated significant changes (p < 0.05) after NAT-treated xenografts, and later confirmed in clinical samples. | Kelly [98] |
| 2013 | Serum albumin | 211 OAC; 32 OSCC; 3 AS | MAGIC (ECF/ECX) | Mandard (1–3 vs. 4–5) | Retrospective | Malnutrition is common preoperatively, and is inversely associated with systemic inflammatory response. Hypoalbuminaemia before chemo correlates with lack of pathological response to NAT. | Noble [100] |
| 2015 | Fibrinogen and platelet count | 56 OAC; 28 OSCC | 74 CTx + 8 CRTx + 2 RTx | Mandard (1–2 vs. 3–5) | Retrospective | Significantly higher PFR (plasma fibrinogen), CRP and PBPC (peripheral blood platelet count) levels were observed in patients with good TRG. Only PFR was an independent factor influencing tumour regression. | Ilhan-Mutlu [99] |
| Year | Biomarker | Tumour Type and No. of Patients | NAT Regimen | TRG (GR vs. BR) | Study Type | Findings | Reference |
|---|---|---|---|---|---|---|---|
| 2014 | ALDH1 labeling indices | 160 OAC; 7 OSCC | 5FU + Platin or taxane + 50 Gy | Chireac (pCR) | Retrospective and preclinical study | Low ALDH-1 labelling indices are predictive of pCR (p < 0.001; OR = 0.432), 3-fold cross-validation led to c-statistic = 0.798. High ALDH-1 has significant association with non-pCR (p < 0.001; OR = 3.782) and 3-fold cross-validation led to c-statistic = 0.960. In vitro studies suggest that high ALDH-1 labelling index is associated with therapy resistance. | Ajani [107] |
| 2014 | Tumour leptin | 9 GOJ; 5 OAC; (discovery cohort) 154 OAC | MAGIC | Mandard (1–3 vs. 4–5) | Preclinical (with discovery cohort) | Gene enrichment analysis was done to identify overrepresented pathways within a cohort of 520 differentially expressed genes in radiological non-responders vs. responders. Higher leptin protein expression was associated with lack of histological response to neoadjuvant chemotherapy (p = 0.007). Higher leptin protein expression was associated with resistance to cisplatin (p = 0.008) | Bain [103] |
| 2016 | Adipose tissue | 10 OAC | - | - | Preclinical | Anaphase bridge levels are influenced by obesity and radiosensitivity status in oesophageal adenocarcinoma. Anaphase bridges were used as a marker of genomic instability. A total of 3x more anaphase bridge in radioresistant OAC cells. Level of anaphase bridges in OE33R cells were correlated with visceral obesity status (by waist circumference and visceral fat area). Validated using spindle assemply complex genes (MAD2L2, BUB1B) in patient tumour specimens (46 viscerally obese and 41 non obese). MAD2L2 expression higher in viscerally obese. | Mongan [104] |
| 2016 | Tumour proportion | 140 OAC and OSCC | 5FU + cisplatin | Mandard (1–3 vs. 4–5) | RCT | Proportion of tumour cells per tumour area (PoT) was measured to predict chemotherapy response. PoT between 40% and 70% received survival benefit from NAT. High pre-treatment PoT related to lack of primary tumour regression (TRG4-5). | Hale [108] |
| 2021 | Molecular markers | 40 OAC/GOJ (estimate) | CROSS | - | Prospective | ClinicalTrials.gov Identifier: NCT03429816. Organoid cultures will be used to correlate in vivo to in vitro response to neoadjuvant chemotherapy. Molecular subtypes with histological response will be correlated to identify biomarkers. |
Appendix C
| OVID Search Strategy | ||
|---|---|---|
| 1 | ((Biomarker* or Marker*) and (tumo*, biochemical, biologic*, cancer*, carcinogen*, neoplasm*, oncolog*, metabol* or predict*)).mp | 1,847,563 |
| 2 | ((MRI or magnetic resonance imag*) and (predict* or response)).mp | 281,623 |
| 3 | (Neoadjuvant*, Neoadjuvant Treatment*, Neoadjuvant Therap*, Neoadjuvant Chemotherapy, Neoadjuvant Chemoradiotherapy, Preoperative Chemotherapy, Pre-operative Chemotherapy, Preoperative Chemoradiotherapy, Pre-operative Chemoradiotherapy, NAT or NAC).mp | 180,001 |
| 4 | (Esophageal Adenocarcinoma, oesophageal Adenocarcinoma, Adenocarcinoma of the esophagus, Adenocarcinoma of the oesophagus, Gastroesophageal Junction Adenocarcinoma, Adenocarcinoma of the Gastroesophageal Junction, GOJ Adenocarcinoma, EGJ Adenocarcinoma, Esophagogastric Junction Adenocarcinoma, oesophagogastric Junction Adenocarcinoma, esophagogastric adenocarcinoma, oesophagogastric adenocarcinoma, oesophago-gastric adenocarcinoma or esophago-gastric adenocarcinoma).mp | 22,262 |
| 5 | 1 OR 2 AND 3 AND 4 | 407 |
| PubMed Search Strategy | ||
| 1 | (((((Biomarker*[Text Word] or Marker*)[Text Word] and (tumo*[Text Word], biochemical[Text Word], biologic*[Text Word], cancer*[Text Word], carcinogen*[Text Word], neoplasm*[Text Word], oncolog*[Text Word], metabol*[Text Word] or predict*))[Text Word]) | |
| 2 | (((MRI[Text Word] OR magnetic resonance imag*)[Text Word] AND (predict*[Text Word] OR response))[Text Word])) | |
| 3 | ((Neoadjuvant*[Text Word], Neoadjuvant Treatment*[Text Word], Neoadjuvant Therap*[Text Word], Neoadjuvant Chemotherapy[Text Word], Neoadjuvant Chemoradiotherapy[Text Word], Preoperative Chemotherapy[Text Word], Pre-operative Chemotherapy[Text Word], Preoperative Chemoradiotherapy[Text Word], Pre-operative Chemoradiotherapy[Text Word], NAT[Text Word] or NAC)[Text Word])) | |
| 4 | ((esophageal Adenocarcinoma[Text Word], oesophageal Adenocarcinoma[Text Word], Adenocarcinoma of the esophagus[Text Word], Adenocarcinoma of the oesophagus[Text Word], Gastroesophageal Junction Adenocarcinoma[Text Word], Adenocarcinoma of the Gastroesophageal Junction[Text Word], GOJ Adenocarcinoma[Text Word], EGJ Adenocarcinoma[Text Word], Esophagogastric Junction Adenocarcinoma[Text Word], oesophagogastric Junction Adenocarcinoma[Text Word] OR esophagogastric adenocarcinoma[Text Word], oesophagogastric adenocarcinoma[Text Word], oesophago-gastric adenocarcinoma[Text Word] or esophago-gastric adenocarcinoma)[Text Word]) | |
| 5 | 1 OR 2 AND 3 AND 4 | 119 |
| ClinicalTrials.gov Search Strategy | ||
| Search terms: neoadjuvant therapy, oesophageal adenocarcinoma, adenocarcinoma of the esophagus, neoadjuvant, esophageal, etc. Applied filters: recruiting, not yet recruiting, active not recruiting, completed, enrolling by invitation and suspended. | 5 of 50 included | |
| Records Identified through Database Searching | 531 | |
| Inclusion Criteria | Exclusion Criteria |
|---|---|
|
|
| CROSS [5] | 2 mg/mL/min Carboplatin + 50 mg/m2 Paclitaxel + 41.4 Gy Radiotherapy |
| MAGIC (ECF/ECX) [6] | 50 mg/m2 Epirubicin + 60 mg/m2 Cisplatin + (200 mg/m2 5-Fluorouracil (5FU) OR 1250 mg/m2 Capecitabine) |
| FLOT [10] | 2600 mg/m2 5-Fluorouracil (5FU) + 200 mg/m2 Leucovorin + 85 mg/m2 Oxaliplatin + 50 mg/m2 Docetaxel |
| CALBG 9781 [11] | 100 mg/m2 Cisplatin + 1000 mg/m2/d 5-Fluorouracil (5FU) + 50.4 Gy Radiotherapy |
| Mandard [9] | Becker [12] | Schneider [15] | Chireac [14] | Cologne [13] |
|---|---|---|---|---|
| 1. Complete regression. | 1a. No residual tumour/tumour bed + chemotherapy effect. | 1. <1% Residual tumour cells without LN involvement. | 1. No residual tumour. | 1. >50% vital residual tumour cells (VRTC). |
| 2. Sparse residual tumour cells + fibrosis. | 1b. <10% Residual tumour/tumour bed + chemotherapy effect. | 2. <1% Residual tumour cells with LN involvement. | 2. <50% residual tumour cells. | 2. 10–50% VRTC. |
| 3. More residual tumour cells but still more fibrosis. | 2. 10–50% Residual tumour/tumour bed + chemotherapy effect. | 3. >1% Residual tumour cells without LN involvement. | 3. >50% residual tumour cells, no response. | 3. near complete regression with <10% VRTC. |
| 4. More residual tumour cells than fibrosis. | 3. >50% Residual tumour/tumour bed + chemotherapy effect. | 4. >1% Residual tumour cells with LN involvement. | 4. Complete regression. | |
| 5. No regression signs |
References
- Domper Arnal, M.J.; Ferrández Arenas, Á.; Lanas Arbeloa, Á. Esophageal cancer: Risk factors, screening and endoscopic treatment in Western and Eastern countries. World J. Gastroenterol. 2015, 21, 7933–7943. [Google Scholar] [CrossRef]
- Smyth, E.C.; Lagergren, J.; Fitzgerald, R.C.; Lordick, F.; Shah, M.A.; Lagergren, P.; Cunningham, D. Oesophageal cancer. Nat. Rev. Dis. Primers 2017, 3, 17048. [Google Scholar] [CrossRef]
- Cook, M.B.; Corley, D.A.; Murray, L.J.; Liao, L.M.; Kamangar, F.; Ye, W.; Gammon, M.D.; Risch, H.A.; Casson, A.G.; Freedman, N.D.; et al. Gastroesophageal Reflux in Relation to Adenocarcinomas of the Esophagus: A Pooled Analysis from the Barrett’s and Esophageal Adenocarcinoma Consortium (BEACON). PLoS ONE 2014, 9, e103508. [Google Scholar] [CrossRef] [PubMed]
- Kim, J.; Bowlby, R.; Mungall, A.J.; Robertson, A.G.; Odze, R.D.; Cherniack, A.D.; Shih, J.; Pedamallu, C.S.; Cibulskis, C.; Dunford, A.; et al. Integrated genomic characterization of oesophageal carcinoma. Nature 2017, 541, 169–175. [Google Scholar]
- Shapiro, J.; van Lanschot, J.J.B.; Hulshof, M.C.C.M.; van Hagen, P.; van Berge Henegouwen, M.I.; Wijnhoven, B.P.L.; van Laarhoven, H.W.M.; Nieuwenhuijzen, G.A.P.; Hospers, G.A.P.; Bonenkamp, J.J.; et al. Neoadjuvant chemoradiotherapy plus surgery versus surgery alone for oesophageal or junctional cancer (CROSS): Long-term results of a randomised controlled trial. Lancet Oncol. 2015, 16, 1090–1098. [Google Scholar] [CrossRef]
- Cunningham, D.; Allum, W.H.; Stenning, S.P.; Thompson, J.N.; Van de Velde, C.J.H.; Nicolson, M.; Scarffe, J.H.; Lofts, F.J.; Falk, S.J.; Iveson, T.J.; et al. Perioperative Chemotherapy versus Surgery Alone for Resectable Gastroesophageal Cancer. N. Engl. J. Med. 2006, 355, 11–20. [Google Scholar] [CrossRef]
- Depypere, L.; Thomas, M.; Moons, J.; Coosemans, W.; Lerut, T.; Prenen, H.; Haustermans, K.; Van Veer, H.; Nafteux, P. Analysis of patients scheduled for neoadjuvant therapy followed by surgery for esophageal cancer, who never made it to esophagectomy. World J. Surg. Oncol. 2019, 17, 89. [Google Scholar] [CrossRef]
- Noble, F.; Lloyd, M.A.; Turkington, R.; Griffiths, E.; O’Donovan, M.; O’Neill, J.R.; Mercer, S.; Parsons, S.L.; Fitzgerald, R.C.; Underwood, T.J.; et al. Multicentre cohort study to define and validate pathological assessment of response to neoadjuvant therapy in oesophagogastric adenocarcinoma. Br. J. Surg. 2017, 104, 1816–1828. [Google Scholar] [CrossRef]
- Mandard, A.-M.; Dalibard, F.; Mandard, J.-C.; Marnay, J.; Henry-Amar, M.; Petiot, J.-F.; Roussel, A.; Jacob, J.-H.; Segol, P.; Samama, G.; et al. Pathologic assessment of tumor regression after preoperative chemoradiotherapy of esophageal carcinoma: Clinicopathologic correlations. Cancer 1994, 73, 2680–2686. [Google Scholar] [CrossRef]
- Al-Batran, S.-E.; Homann, N.; Pauligk, C.; Goetze, T.O.; Meiler, J.; Kasper, S.; Kopp, H.-G.; Mayer, F.; Haag, G.M.; Luley, K.; et al. Perioperative chemotherapy with fluorouracil plus leucovorin, oxaliplatin, and docetaxel versus fluorouracil or capecitabine plus cisplatin and epirubicin for locally advanced, resectable gastric or gastro-oesophageal junction adenocarcinoma (FLOT4): A randomised, phase 2/3 trial. Lancet 2019, 393, 1948–1957. [Google Scholar]
- Tepper, J.; Krasna, M.J.; Niedzwiecki, D.; Hollis, D.; Reed, C.E.; Goldberg, R.; Kiel, K.; Willett, C.; Sugarbaker, D.; Mayer, R. Phase III trial of trimodality therapy with cisplatin, fluorouracil, radiotherapy, and surgery compared with surgery alone for esophageal cancer: CALGB 9781. J. Clin. Oncol. 2008, 26, 1086–1092. [Google Scholar] [CrossRef] [PubMed]
- Becker, K.; Mueller, J.D.; Schulmacher, C.; Ott, K.; Fink, U.; Busch, R.; Bottcher, K.; Siewert, J.R.; Hofler, H. Histomorphology and grading of regression in gastric carcinoma treated with neoadjuvant chemotherapy. Cancer 2003, 98, 1521–1530. [Google Scholar] [CrossRef]
- Baldus, S.E.; Monig, S.P.; Schroder, W.; Metzger, R.; Lang, S.; Zirbes, T.K.; Thiele, J.; Muller, R.P.; Dienes, H.P.; Holscher, A.H.; et al. Regression of oesophageal carcinomas after neoadjuvant radiochemotherapy: Criteria of the histopathological evaluation. Pathologe 2004, 25, 421–427. [Google Scholar] [CrossRef] [PubMed]
- Lucian, R.C.; Stephen, G.S.; Jaffer, A.A.; Ritsuko, R.K.; Arlene, M.C.; Jeffrey, S.M.; Jack, A.R.; Asif, R.; Stanley, R.H.; Tsung-Teh, W. Posttherapy pathologic stage predicts survival in patients with esophageal carcinoma receiving preoperative chemoradiation. Cancer 2005, 103, 1347–1355. [Google Scholar]
- Paul, M.S. Histomorphologic Tumor Regression and Lymph Node Metastases Determine Prognosis Following Neoadjuvant Radiochemotherapy for Esophageal Cancer: Implications for Response Classification. Ann. Surg. 2005, 242, 684–692. [Google Scholar]
- de Gouw, D.J.J.M.; Klarenbeek, B.R.; Driessen, M.; Bouwense, S.A.W.; van Workum, F.; Fütterer, J.J.; Rovers, M.M.; ten Broek, R.P.G.; Rosman, C. Detecting Pathological Complete Response in Esophageal Cancer after Neoadjuvant Therapy Based on Imaging Techniques: A Diagnostic Systematic Review and Meta-Analysis. J. Thorac. Oncol. 2019, 14, 1156–1171. [Google Scholar] [CrossRef]
- Kwee, R.M. Prediction of tumor response to neoadjuvant therapy in patients with esophageal cancer with use of 18F FDG PET: A systematic review. Radiology 2010, 254, 707–717. [Google Scholar] [CrossRef]
- Van Heijl, M.; Phoa, S.S.K.S.; Van Berge Henegouwen, M.I.; Omloo, J.M.T.; Mearadji, B.M.; Sloof, G.W.; Bossuyt, P.M.M.; Hulshof, M.C.C.M.; Richel, D.J.; Bergman, J.J.G.H.M.; et al. Accuracy and reproducibility of 3D-CT measurements for early response assessment of chemoradiotherapy in patients with oesophageal cancer. Eur. J. Surg. Oncol. 2011, 37, 1064–1071. [Google Scholar] [CrossRef]
- Larue, R.T.H.M.; Klaassen, R.; Jochems, A.; Leijenaar, R.T.H.; Hulshof, M.C.C.M.; van Berge Henegouwen, M.I.; Schreurs, W.M.J.; Sosef, M.N.; van Elmpt, W.; van Laarhoven, H.W.M.; et al. Pre-treatment CT radiomics to predict 3-year overall survival following chemoradiotherapy of esophageal cancer. Acta Oncol. 2018, 57, 1475–1481. [Google Scholar] [CrossRef]
- Bain, G.; Murray, G.; Denison, A.; Brooks, M.; Collie-Duguid, E.; McKiddie, F.; Gilbert, F.; El-Omar, E.; Park, K.; McAteer, D.; et al. Aberdeen microarray and pet in optimising oesophagogastric cancer response-1 (AMPETOOR-1). Preliminary results. In Proceedings of the 12th World Congress on Gastrointestinal Cancer, ESMO Conference, Barcelona, Spain, 30 June–3 July 2021; Volume 21 (Suppl. 16), p. 43. [Google Scholar]
- van Heijl, M.; Omloo, J.M.; van Berge Henegouwen, M.I.; Hoekstra, O.S.; Boellaard, R.; Bossuyt, P.M.; Busch, O.R.; Tilanus, H.W.; Hulshof, M.C.; van der Gaast, A.; et al. Fluorodeoxyglucose positron emission tomography for evaluating early response during neoadjuvant chemoradiotherapy in patients with potentially curable esophageal cancer. Ann. Surg. 2011, 253, 56–63. [Google Scholar] [CrossRef]
- Gillies, R.S.; Middleton, M.R.; Blesing, C.; Patel, K.; Warner, N.; Marshall, R.E.K.; Maynard, N.D.; Bradley, K.M.; Gleeson, F.V. Metabolic response at repeat PET/CT predicts pathological response to neoadjuvant chemotherapy in oesophageal cancer. Eur. Radiol. 2012, 22, 2035. [Google Scholar] [CrossRef] [PubMed]
- Kauppi, J.T.; Oksala, N.; Salo, J.A.; Helin, H.; Karhumäki, L.; Kemppainen, J.; Sihvo, E.I.; Räsänen, J.V. Locally advanced esophageal adenocarcinoma: Response to neoadjuvant chemotherapy and survival predicted by [18F]FDG-PET/CT. Acta Oncol. 2012, 51, 636–644. [Google Scholar] [CrossRef] [PubMed]
- Dash, N.; Ravella, V.; Pal, S.; Sahni, P.; Mohanti, B.K.; Kumar, R. Role of PET/CT in assessment of metabolic response of neoadjuvant chemoradiotherapy in patients with carcinoma of esophagus. Dis. Esophagus 2014, 27, 55A–56A. [Google Scholar]
- Tan, S.; Kligerman, S.; Chen, W.; Lu, M.; Kim, G.; Feigenberg, S.; D’Souza, W.D.; Suntharalingam, M.; Lu, W. Spatial-Temporal [18F]FDG-PET Features for Predicting Pathologic Response of Esophageal Cancer to Neoadjuvant Chemoradiation Therapy. Int. J. Radiat. Oncol. Biol. Phys. 2013, 85, 1375–1382. [Google Scholar] [CrossRef]
- van Rossum, P.S.N.; Fried, D.V.; Zhang, L.; Hofstetter, W.L.; van Vulpen, M.; Meijer, G.J.; Court, L.E.; Lin, S.H. The Incremental Value of Subjective and Quantitative Assessment of FDG PET for the Prediction of Pathologic Complete Response to Preoperative Chemoradiotherapy in Esophageal Cancer. J. Nucl. Med. 2016, 57, 691. [Google Scholar] [CrossRef]
- Van Rossum, P.S.N.; Van Lier, A.L.H.M.W.; Van Vulpen, M.; Reerink, O.; Lagendijk, J.J.W.; Lin, S.H.; Van Hillegersberg, R.; Ruurda, J.P.; Meijer, G.J.; Lips, I.M. Diffusion-weighted magnetic resonance imaging for the prediction of pathologic response to neoadjuvant chemoradiotherapy in esophageal cancer. Radiother. Oncol. 2015, 115, 163–170. [Google Scholar] [CrossRef]
- Borggreve, A.S.; Heethuis, S.E.; Boekhoff, M.R.; Goense, L.; van Rossum, P.S.N.; Brosens, L.A.A.; van Lier, A.; van Hillegersberg, R.; Lagendijk, J.J.W.; Mook, S.; et al. Optimal timing for prediction of pathologic complete response to neoadjuvant chemoradiotherapy with diffusion-weighted MRI in patients with esophageal cancer. Eur. Radiol. 2020, 30, 1896–1907. [Google Scholar] [CrossRef]
- Kwee, R.M.; Dik, A.K.; Sosef, M.N.; Berendsen, R.C.; Sassen, S.; Lammering, G.; Clarijs, R.; Oostenbrug, L.E.; Blom, R.L.; Vliegen, R.F. Interobserver reproducibility of diffusion-weighted MRI in monitoring tumor response to neoadjuvant therapy in esophageal cancer. PLoS ONE 2014, 9, e92211. [Google Scholar]
- Heethuis, S.E.; van Rossum, P.S.N.; Lips, I.M.; Goense, L.; Voncken, F.E.; Reerink, O.; van Hillegersberg, R.; Ruurda, J.P.; Philippens, M.E.; van Vulpen, M.; et al. Dynamic contrast-enhanced MRI for treatment response assessment in patients with oesophageal cancer receiving neoadjuvant chemoradiotherapy. Radiother. Oncol. 2016, 120, 128–135. [Google Scholar] [CrossRef]
- Heethuis, S.E.; Goense, L.; van Rossum, P.S.N.; Borggreve, A.S.; Mook, S.; Voncken, F.E.M.; Bartels-Rutten, A.; Aleman, B.M.P.; van Hillegersberg, R.; Ruurda, J.P.; et al. DW-MRI and DCE-MRI are of complementary value in predicting pathologic response to neoadjuvant chemoradiotherapy for esophageal cancer. Acta Oncol. 2018, 57, 1201–1208. [Google Scholar] [CrossRef]
- Fang, P.; Musall, B.C.; Son, J.B.; Moreno, A.C.; Hobbs, B.P.; Carter, B.W.; Fellman, B.M.; Mawlawi, O.; Ma, J.; Lin, S.H. Multimodal Imaging of Pathologic Response to Chemoradiation in Esophageal Cancer. Int. J. Radiat. Oncol. Biol. Phys. 2018, 102, 996–1001. [Google Scholar] [CrossRef] [PubMed]
- Borggreve, A.S.; Goense, L.; van Rossum, P.S.N.; Heethuis, S.E.; van Hillegersberg, R.; Lagendijk, J.J.W.; Lam, M.G.E.H.; van Lier, A.L.H.M.W.; Mook, S.; Ruurda, J.P.; et al. Preoperative Prediction of Pathologic Response to Neoadjuvant Chemoradiotherapy in Patients With Esophageal Cancer Using 18F-FDG PET/CT and DW-MRI: A Prospective Multicenter Study. Int. J. Radiat. Oncol. Biol. Phys. 2020, 106, 998–1009. [Google Scholar] [CrossRef] [PubMed]
- Padhani, A.R.; Liu, G.; Koh, D.M.; Chenevert, T.L.; Thoeny, H.C.; Takahara, T.; Dzik-Jurasz, A.; Ross, B.D.; Van Cauteren, M.; Collins, D.; et al. Diffusion-weighted magnetic resonance imaging as a cancer biomarker: Consensus and recommendations. Neoplasia 2009, 11, 102–125. [Google Scholar] [CrossRef] [PubMed]
- Borggreve, A.S.; Mook, S.; Verheij, M.; Mul, V.E.M.; Bergman, J.J.; Bartels-Rutten, A.; Ter Beek, L.C.; Beets-Tan, R.G.H.; Bennink, R.J.; Van Berge Henegouwen, M.I.; et al. Preoperative image-guided identification of response to neoadjuvant chemoradiotherapy in esophageal cancer (PRIDE): A multicenter observational study. BMC Cancer 2018, 18, 1006. [Google Scholar] [CrossRef]
- Allis, C.D.; Jenuwein, T. The molecular hallmarks of epigenetic control. Nat. Rev. Genet. 2016, 17, 487–500. [Google Scholar] [CrossRef]
- Argyle, S.D.; Bibby, B.A.S.; Lynam-Lennon, N.; Reynolds, J.V.; Cawthorne, C.J.; Maher, S.G. Investigating the role of microRNA-187 as a modulator of chemoradiation sensitivity in oesophageal adenocarcinoma. In Proceedings of the 24th Biennial Congress of the European Association for Cancer Research, EACR 2016, Manchester, UK, 9–12 July 2016; pp. S2158–S2159sz. [Google Scholar]
- Bibby, B.A.; Reynolds, J.V.; Maher, S.G. MicroRNA-330-5p as a Putative Modulator of Neoadjuvant Chemoradiotherapy Sensitivity in Oesophageal Adenocarcinoma. PLoS ONE 2015, 10, e0134180. [Google Scholar] [CrossRef]
- Lynam-Lennon, N.; Bibby, B.A.; Mongan, A.M.; Marignol, L.; Paxton, C.N.; Geiersbach, K.; Bronner, M.P.; O’Sullivan, J.; Reynolds, J.; Maher, S.G. Low miR-187 expression promotes resistance to chemoradiation therapy in vitro and correlates with treatment failure in patients with esophageal adenocarcinoma. Mol. Med. 2016, 22, 388–397. [Google Scholar] [CrossRef]
- Lynam-Lennon, N.; Heavey, S.; Sommerville, G.; Bibby, B.A.; Ffrench, B.; Quinn, J.; Gasch, C.; O’Leary, J.J.; Gallagher, M.F.; Reynolds, J.V.; et al. MicroRNA-17 is downregulated in esophageal adenocarcinoma cancer stem-like cells and promotes a radioresistant phenotype. Oncotarget 2017, 8, 11400–11413. [Google Scholar] [CrossRef]
- Lynam-Lennon, N.; Reynolds, J.V.; Marignol, L.; Sheils, O.M.; Pidgeon, G.P.; Maher, S.G. MicroRNA-31 modulates tumour sensitivity to radiation in oesophageal adenocarcinoma. J. Mol. Med. 2012, 90, 1449–1458. [Google Scholar] [CrossRef]
- Chiam, K.; Mayne, G.C.; Watson, D.I.; Woodman, R.J.; Bright, T.F.; Michael, M.Z.; Karapetis, C.S.; Irvine, T.; Phillips, W.A.; Hummel, R.; et al. Identification of microRNA Biomarkers of Response to Neoadjuvant Chemoradiotherapy in Esophageal Adenocarcinoma Using Next Generation Sequencing. Ann. Surg. Oncol. 2018, 25, 2731–2738. [Google Scholar] [CrossRef]
- Odenthal, M.; Bollschweiler, E.; Grimminger, P.P.; Schroder, W.; Brabender, J.; Drebber, U.; Holscher, A.H.; Metzger, R.; Vallbohmer, D. MicroRNA profiling in locally advanced esophageal cancer indicates a high potential of miR-192 in prediction of multimodality therapy response. Int. J. Cancer 2013, 133, 2454–2463. [Google Scholar] [CrossRef]
- Skinner, H.D.; Lee, J.H.; Bhutani, M.S.; Weston, B.; Hofstetter, W.; Komaki, R.; Shiozaki, H.; Wadhwa, R.; Sudo, K.; Elimova, E.; et al. A validated miRNA profile predicts response to therapy in esophageal adenocarcinoma. Cancer 2014, 120, 3635–3641. [Google Scholar] [CrossRef] [PubMed]
- Odenthal, M.; Hee, J.; Gockel, I.; Sisic, L.; Schmitz, J.; Stoecklein, N.H.; Driemel, C.; Mohlendick, B.; Schmidt, T.; Knoefel, W.T.; et al. Serum microRNA profiles as prognostic/predictive markers in the multimodality therapy of locally advanced adenocarcinomas of the gastroesophageal junction. Int. J. Cancer 2015, 137, 230–237. [Google Scholar] [CrossRef] [PubMed]
- Slotta-Huspenina, J.; Tanzer, M.; Schellnegger, R.; Langer, R.; Horst, D.; Feith, M.; Schmid, R.; Weichert, W.; Quante, M. Prediction of response to 5-FU based neoadjuvant chemotherapy in Esophageal adenocarcinoma by TFAP2E DNA methylation analysis. Mod. Pathol. 2019, 99, 578–775. [Google Scholar]
- Lin, D.-C.; Dinh, H.Q.; Xie, J.-J.; Mayakonda, A.; Silva, T.C.; Jiang, Y.-Y.; Ding, L.-W.; He, J.-Z.; Xu, X.-E.; Hao, J.-J.; et al. Identification of distinct mutational patterns and new driver genes in oesophageal squamous cell carcinomas and adenocarcinomas. Gut 2018, 67, 1769. [Google Scholar] [CrossRef] [PubMed]
- van Hagen, P.; Hulshof, M.C.C.M.; van Lanschot, J.J.B.; Steyerberg, E.W.; Henegouwen, M.I.v.B.; Wijnhoven, B.P.L.; Richel, D.J.; Nieuwenhuijzen, G.A.P.; Hospers, G.A.P.; Bonenkamp, J.J.; et al. Preoperative Chemoradiotherapy for Esophageal or Junctional Cancer. N. Engl. J. Med. 2012, 366, 2074–2084. [Google Scholar] [CrossRef] [PubMed]
- McLaren, P.J.; Barnes, A.P.; Terrell, W.Z.; Vaccaro, G.M.; Wiedrick, J.; Hunter, J.G.; Dolan, J.P. Specific gene expression profiles are associated with a pathologic complete response to neoadjuvant therapy in esophageal adenocarcinoma. Am. J. Surg. 2017, 213, 915–920. [Google Scholar] [CrossRef]
- Schauer, M.; Janssen, K.P.; Rimkus, C.; Raggi, M.; Feith, M.; Friess, H.; Theisen, J. Microarray-based response prediction in esophageal adenocarcinoma. Clin. Cancer Res. 2010, 16, 330–337. [Google Scholar] [CrossRef]
- Peters, C.J.; Rees, J.R.E.; Hardwick, R.H.; Hardwick, J.S.; Vowler, S.L.; Ong, C.A.J.; Zhang, C.; Save, V.; O’Donovan, M.; Rassl, D.; et al. A 4-Gene Signature Predicts Survival of Patients With Resected Adenocarcinoma of the Esophagus, Junction, and Gastric Cardia. Gastroenterology 2010, 139, 1995–2004. [Google Scholar] [CrossRef]
- Lloyd, M.; Izadi, F.; Walker, R.; Hayden, A.; Harrington, J.; Grace, B.; Horne, J.; Machado, M.; Fesenko, I.; Rahman, S.; et al. Predicting Response to Neoadjuvant Therapy in Oesophageal Adenocarcinoma Pre-Treatment Biopsies. In Proceedings of the BASO-The Association for Cancer Surgery Annual Scientific Meeting, London, UK, 16–18 November 2019; Volume 45, p. 2212. [Google Scholar]
- Ute, W.-E.; Ralf, M.; Elfriede, B.; Stephan, E.B.; Rolf, P.M.; Hans, P.D.; Arnulf, H.H.; Paul, M.S. TaqMan® low-density arrays and analysis by artificial neuronal networks predict response to neoadjuvant chemoradiation in esophageal cancer. Pharmacogenomics 2010, 11, 55–64. [Google Scholar]
- Metzger, R.; Warnecke-Eberz, U.; Alakus, H.; Kütting, F.; Brabender, J.; Vallböhmer, D.; Grimminger, P.P.; Mönig, S.P.; Drebber, U.; Hölscher, A.H.; et al. Neoadjuvant radiochemotherapy in adenocarcinoma of the esophagus: ERCC1 gene polymorphisms for prediction of response and prognosis. J. Gastrointest. Surg. 2012, 16, 26–34, discussion 34. [Google Scholar] [CrossRef] [PubMed]
- Narumiya, K.; Metzger, R.; Bollschweiler, E.; Alakus, H.; Brabender, J.; Drebber, U.; Holscher, A.H.; Warnecke-Eberz, U. Impact of ABCB1 C3435T polymorphism on lymph node regression in multimodality treatment of locally advanced esophageal cancer. Pharmacogenomics 2011, 12, 205–214. [Google Scholar] [CrossRef] [PubMed]
- Singhal, S.; Kapoor, H.; Subramanian, S.; Agrawal, D.K.; Mittal, S.K. Polymorphisms of Genes Related to Function and Metabolism of Vitamin D in Esophageal Adenocarcinoma. J. Gastrointest. Cancer 2019, 50, 867–878. [Google Scholar] [CrossRef] [PubMed]
- Bollschweiler, E.; Holscher, A.H.; Herbold, T.; Metzger, R.; Alakus, H.; Schmidt, H.; Drebber, U.; Warnecke-Eberz, U. Molecular markers for the prediction of minor response to neoadjuvant chemoradiation in esophageal cancer results of the prospective Cologne Esophageal Response Prediction (CERP) study. Ann. Surg. 2016, 264, 839–846. [Google Scholar] [CrossRef] [PubMed]
- Dasari, S.; Tchounwou, P.B. Cisplatin in cancer therapy: Molecular mechanisms of action. Eur J. Pharmacol. 2014, 740, 364–378. [Google Scholar] [CrossRef] [PubMed]
- Zhang, N.; Yin, Y.; Xu, S.-J.; Chen, W.-S. 5-Fluorouracil: Mechanisms of resistance and reversal strategies. Molecules 2008, 13, 1551–1569. [Google Scholar] [CrossRef]
- Kandioler, D.; Schoppmann, S.F.; Zwrtek, R.; Kappel, S.; Wolf, B.; Mittlbock, M.; Kuhrer, I.; Hejna, M.; Pluschnig, U.; Ba-Ssalamah, A.; et al. The biomarker TP53 divides patients with neoadjuvantly treated esophageal cancer into 2 subgroups with markedly different outcomes. A p53 Research Group study. J. Thorac. Cardiovasc. Surg. 2014, 148, 2280–2286. [Google Scholar] [CrossRef]
- Kappel-Latif, S.; Zacherl, J.; Hejna, M.; Westerhoff, M.; Tamandl, D.; Ba-Ssalamah, A.; Mittlbock, M.; Wolf, B.; Wrba, F.; Kuhrer, I.; et al. Pancho trial (p53-adapted neoadjuvant chemotherapy for resectable esophageal cancer) completed-mutation rate of the marker higher than expected. Eur. Surg. Acta Chir. Austriaca 2018, 50, 160–166. [Google Scholar] [CrossRef]
- Qian, D.C.; Lefferts, J.A.; Zaki, B.I.; Mishyn, P.; Brickley, E.B.; Xue, Y.; Lisovsky, M. Prediction of pathologic complete response to neoadjuvant therapy for esophageal adenocarcinoma using copy number alterations. Cancer Res. 2019, 79 (Suppl. 13), 1657. [Google Scholar]
- Aichler, M.; Motschmann, M.; Jütting, U.; Luber, B.; Becker, K.; Ott, K.; Lordick, F.; Langer, R.; Feith, M.; Siewert, J.R.; et al. Epidermal growth factor receptor (EGFR) is an independent adverse prognostic factor in esophageal adenocarcinoma patients treated with cisplatin-based neoadjuvant chemotherapy. Oncotarget 2014, 5, 6620–6632. [Google Scholar] [CrossRef][Green Version]
- Ma, X.; Sheng, T.; Zhang, Y.; Zhang, X.; He, J.; Huang, S.; Chen, K.; Sultz, J.; Adegboyega, P.A.; Zhang, H.; et al. Hedgehog signaling is activated in subsets of esophageal cancers. Int. J. Cancer 2006, 118, 139–148. [Google Scholar] [CrossRef] [PubMed]
- Ajani, J.A.; Wang, X.; Hayashi, Y.; Maru, D.; Welsh, J.; Hofstetter, W.L.; Lee, J.H.; Bhutani, M.S.; Suzuki, A.; Berry, D.A.; et al. Validated biomarker signatures that predict pathologic response to preoperative chemoradiation therapy (CTRT) with high specificity and desirable sensitivity levels in patients with esophageal cancer (EC). J. Clin. Oncol. 2011, 29, 4027. [Google Scholar] [CrossRef]
- Rosen, D.G.; Shan, W.; Lassen, N.; Johnson, C.; Oelschlager, K.; Bierman-Harrar, Y.; Kesler, K.A.; Maetzold, D.; Badve, S.; Cook, R.W.; et al. Prospective prediction of resistance to neoadjuvant therapy in patients with locoregional esophageal adenocarcinoma. Gastrointest. Cancer Targets Ther. 2015, 2015, 53–59. [Google Scholar]
- Lynam-Lennon, N.; Maher, S.G.; Maguire, A.; Phelan, J.; Muldoon, C.; Reynolds, J.V.; O’Sullivan, J. Altered mitochondrial function and energy metabolism is associated with a radioresistant phenotype in oesophageal adenocarcinoma. PLoS ONE 2014, 9, e100738. [Google Scholar] [CrossRef] [PubMed]
- Aichler, M.; Elsner, M.; Ludyga, N.; Feuchtinger, A.; Zangen, V.; Maier, S.K.; Balluff, B.; Schone, C.; Hierber, L.; Braselmann, H.; et al. Clinical response to chemotherapy in oesophageal adenocarcinoma patients is linked to defects in mitochondria. J. Pathol. 2013, 230, 410–419. [Google Scholar] [CrossRef]
- van Olphen, S.H.; Biermann, K.; Shapiro, J.; Wijnhoven, B.P.; Toxopeus, E.L.; van der Gaast, A.; Stoop, H.A.; van Lanschot, J.J.; Spaander, M.C.; Bruno, M.J.; et al. P53 and SOX2 Protein Expression Predicts Esophageal Adenocarcinoma in Response to Neoadjuvant Chemoradiotherapy. Ann. Surg. 2017, 265, 347–355. [Google Scholar] [CrossRef]
- Reuter, S.; Gupta, S.C.; Chaturvedi, M.M.; Aggarwal, B.B. Oxidative stress, inflammation, and cancer: How are they linked? Free Radic Biol. Med. 2010, 49, 1603–1616. [Google Scholar] [CrossRef]
- Woolston, C.M.; Madhusudan, S.; Soomro, I.N.; Lobo, D.N.; Reece-Smith, A.M.; Parsons, S.L.; Martin, S.G. Thioredoxin interacting protein and its association with clinical outcome in gastro-oesophageal adenocarcinoma. Redox Biol. 2013, 1, 285–291. [Google Scholar] [CrossRef][Green Version]
- Piro, G.; Giacopuzzi, S.; Bencivenga, M.; Carbone, C.; Verlato, G.; Frizziero, M.; Zanotto, M.; Mina, M.M.; Merz, V.; Santoro, R.; et al. TAK1-regulated expression of BIRC3 predicts resistance to preoperative chemoradiotherapy in oesophageal adenocarcinoma patients. Br. J. Cancer 2015, 113, 878–885. [Google Scholar] [CrossRef]
- Adams, O.; Janser, F.A.; Dislich, B.; Berezowska, S.; Humbert, M.; Seiler, C.A.; Kroell, D.; Slotta-Huspenina, J.; Feith, M.; Ott, K.; et al. A specific expression profile of LC3B and p62 is associated with nonresponse to neoadjuvant chemotherapy in esophageal adenocarcinomas. PLoS ONE 2018, 13, e0197610. [Google Scholar] [CrossRef]
- Fassan, M.; Realdon, S.; Vianello, L.; Quarta, S.; Ruol, A.; Castoro, C.; Scarpa, M.; Zaninotto, G.; Guzzardo, V.; Chiarion Sileni, V.; et al. Squamous cell carcinoma antigen (SCCA) is up-regulated during Barrett’s carcinogenesis and predicts esophageal adenocarcinoma resistance to neoadjuvant chemotherapy. Oncotarget 2017, 8, 24372–24379. [Google Scholar] [CrossRef] [PubMed][Green Version]
- Turato, C.; Kotsafti, A.; Cappon, A.; Quarta, S.; Biasiolo, A.; Cavallin, F.; Trevellin, E.; Guzzardo, V.; Fassan, M.; Chiarion-Sileni, V.; et al. Squamous cell carcinoma antigen 1 is associated to poor prognosis in esophageal cancer through immune surveillance impairment and reduced chemosensitivity. Cancer Sci. 2019, 110, 1552–1563. [Google Scholar] [CrossRef] [PubMed]
- Sheshadri, N.; Catanzaro, J.M.; Bott, A.J.; Sun, Y.; Ullman, E.; Chen, E.I.; Pan, J.-A.; Wu, S.; Crawford, H.C.; Zhang, J.; et al. SCCA1/SERPINB3 promotes oncogenesis and epithelial-mesenchymal transition via the unfolded protein response and IL6 signaling. Cancer Res. 2014, 74, 6318–6329. [Google Scholar] [CrossRef] [PubMed]
- Pozzi, V.; Salvolini, E.; Lucarini, G.; Salvucci, A.; Campagna, R.; Rubini, C.; Sartini, D.; Emanuelli, M. Cancer stem cell enrichment is associated with enhancement of nicotinamide N-methyltransferase expression. IUBMB Life 2020, 72, 1415–1425. [Google Scholar] [CrossRef] [PubMed]
- Okamoto, H.; Ishikawa, A.; Yoshitake, Y.; Kodama, N.; Nishimuta, M.; Fukuwatari, T.; Shibata, K. Diurnal variations in human urinary excretion of nicotinamide catabolites: Effects of stress on the metabolism of nicotinamide. Am. J. Clin. Nutr. 2003, 77, 406–410. [Google Scholar] [CrossRef] [PubMed]
- Zhang, J. Are poly(ADP-ribosyl)ation by PARP-1 and deacetylation by Sir2 linked? BioEssays 2003, 25, 808–814. [Google Scholar] [CrossRef]
- Campagna, R.; Salvolini, E.; Pompei, V.; Pozzi, V.; Salvucci, A.; Molinelli, E.; Brisigotti, V.; Sartini, D.; Campanati, A.; Offidani, A.; et al. Nicotinamide N-methyltransferase gene silencing enhances chemosensitivity of melanoma cell lines. Pigment Cell Melanoma Res. 2021, 34, 1039–1048. [Google Scholar] [CrossRef]
- Cui, Y.; Yang, D.; Wang, W.; Zhang, L.; Liu, H.; Ma, S.; Guo, W.; Yao, M.; Zhang, K.; Li, W.; et al. Nicotinamide N-methyltransferase decreases 5-fluorouracil sensitivity in human esophageal squamous cell carcinoma through metabolic reprogramming and promoting the Warburg effect. Mol. Carcinog. 2020, 59, 940–954. [Google Scholar] [CrossRef]
- Lim, B.-H.; Cho, B.-I.; Kim, Y.N.; Kim, J.W.; Park, S.-T.; Lee, C.-W. Overexpression of nicotinamide N-methyltransferase in gastric cancer tissues and its potential post-translational modification. Exp. Mol. Med. 2006, 38, 455–465. [Google Scholar] [CrossRef]
- Seta, R.; Mascitti, M.; Campagna, R.; Sartini, D.; Fumarola, S.; Santarelli, A.; Giuliani, M.; Cecati, M.; Muzio, L.L.; Emanuelli, M. Overexpression of nicotinamide N-methyltransferase in HSC-2 OSCC cell line: Effect on apoptosis and cell proliferation. Clin. Oral Investig. 2019, 23, 829–838. [Google Scholar] [CrossRef]
- Fareed, K.R.; Al-Attar, A.; Soomro, I.N.; Kaye, P.V.; Patel, J.; Lobo, D.N.; Parsons, S.L.; Madhusudan, S. Tumour regression and ERCC1 nuclear protein expression predict clinical outcome in patients with gastro-oesophageal cancer treated with neoadjuvant chemotherapy. Br. J. Cancer 2010, 102, 1600–1607. [Google Scholar] [CrossRef] [PubMed]
- Langer, R.; Ott, K.; Feith, M.; Lordick, F.; Specht, K.; Becker, K.; Hofler, H. High pretherapeutic thymidylate synthetase and MRP-1 protein levels are associated with nonresponse to neoadjuvant chemotherapy in oesophageal adenocarcinoma patients. J. Surg. Oncol. 2010, 102, 503–508. [Google Scholar] [CrossRef]
- Bronson, N.W.; Diggs, B.S.; Bakis, G.; Gatter, K.M.; Sheppard, B.C.; Hunter, J.G.; Dolan, J.P. Molecular Marker Expression Is Highly Heterogeneous in Esophageal Adenocarcinoma and Does Not Predict a Response to Neoadjuvant Therapy. J. Gastrointest. Surg. 2015, 19, 2105–2110. [Google Scholar] [CrossRef]
- Huang, T.-X.; Fu, L. The immune landscape of esophageal cancer. Cancer Commun. 2019, 39, 79. [Google Scholar] [CrossRef] [PubMed]
- Al Lawati, Y.; Cools-Lartigue, J.; Ramirez-GarciaLuna, J.L.; Molina-Franjola, J.C.; Pham, D.; Skothos, E.; Mueller, C.; Spicer, J.; Ferri, L. Dynamic Alteration of Neutrophil-to-Lymphocyte Ratio over Treatment Trajectory is Associated with Survival in Esophageal Adenocarcinoma. Ann. Surg. Oncol. 2020, 27, 4413–4419. [Google Scholar] [CrossRef] [PubMed]
- Powell, A.; Chin, C.; Coxon, A.H.; Chalishazar, A.; Christian, A.; Roberts, S.A.; Lewis, W.G. Neutrophil to lymphocyte ratio as a predictor of response to neoadjuvant chemotherapy and survival in oesophageal adenocarcinoma. BJS Open 2020, 4, 416–423. [Google Scholar] [CrossRef] [PubMed]
- Sherry, A.D.; Newman, N.B.; Anderson, J.L.; Osmundson, E.C. Systemic inflammatory dynamics during chemoradiotherapy predict response, relapse, metastasis, and survival in esophageal carcinoma. J. Surg. Oncol. 2020, 121, 303–312. [Google Scholar] [CrossRef]
- Ebbing, E.A.; van der Zalm, A.P.; Steins, A.; Creemers, A.; Hermsen, S.; Rentenaar, R.; Klein, M.; Waasdorp, C.; Hooijer, G.K.J.; Meijer, S.L.; et al. Stromal-derived interleukin 6 drives epithelial-to-mesenchymal transition and therapy resistance in esophageal adenocarcinoma. Proc. Natl. Acad. Sci. USA 2019, 116, 2237–2242. [Google Scholar] [CrossRef]
- Buckley, A.M.; Lynam-Lennon, N.; Kennedy, S.A.; Dunne, M.R.; Aird, J.J.; Foley, E.K.; Clarke, N.; Ravi, N.; O’Toole, D.; Reynolds, J.V.; et al. Leukaemia inhibitory factor is associated with treatment resistance in oesophageal adenocarcinoma. Oncotarget 2018, 9, 33634–33647. [Google Scholar] [CrossRef]
- Cannon, A.; Lavin, D.; Byrne, R.; Santiago, R.M.; Reynolds, J.V.; O’Sullivan, J.; Robinson, M.; Lynam-Lennon, N. A Novel Role for the Complement Cascade in Chemoradiation Therapy Resistant Oesophageal Adenocarcinoma. In Proceedings of the 17th European Meeting on Complement in Human Disease (EMCHD 2019), Madri, Spain, 13–17 September 2019; Volume 2114, p. 2475. [Google Scholar]
- Ghatak, S.; Omstead, A.N.; Jobe, B.A.; Kreft, R.; Gorbunova, A.; Salvitti, M.; Kelly, R.J.; Zaidi, A.H.; Goel, A. A novel gene signature for predicting response to chemoradiotherapy in locally advanced esophageal adenocarcinoma. J. Clin. Oncol. 2020, 38, 4571. [Google Scholar] [CrossRef]
- Egyud, M.; Tejani, M.; Pennathur, A.; Luketich, J.; Sridhar, P.; Yamada, E.; Stahlberg, A.; Filges, S.; Krzyzanowski, P.; Jackson, J.; et al. Detection of Circulating Tumor DNA in Plasma: A Potential Biomarker for Esophageal Adenocarcinoma. Ann. Thorac. Surg. 2019, 108, 343–349. [Google Scholar] [CrossRef] [PubMed]
- Van Der Kaaij, R.T.; Voncken, F.E.M.; Van Dieren, J.M.; Snaebjornsson, P.; Korse, C.M.; Grootscholten, C.; Aleman, B.M.P.; Van Sandick, J.W. Elevated pretreatment CEA and CA19-9 levels are related to early treatment failure in esophageal adenocarcinoma. Am. J. Clin. Oncol. Cancer Clin. Trials 2019, 42, 345–350. [Google Scholar] [CrossRef] [PubMed]
- Seyedin, S.N.; Callaghan, C.M.; Poellmann, M.; Bu, J.; Wang, A.Z.; Hong, S.; Caster, J.M. Assessing Changes in Circulating Tumor Cells (CTCs) during Preoperative Chemoradiotherapy for Gastrointestinal Malignancies Using a Nanotechnology-Based CTC Capture System. Int. J. Radiat. Oncol. Biol. Phys. 2019, 105, S113–S114. [Google Scholar] [CrossRef]
- Kelly, P.; Appleyard, V.; Murray, K.; Paulin, F.; Lamont, D.; Baker, L.; Suttie, S.; Exon, D.; Thompson, A. Detection of oesophageal cancer biomarkers by plasma proteomic profiling of human cell line xenografts in response to chemotherapy. Br. J. Cancer 2010, 103, 232–238. [Google Scholar] [CrossRef] [PubMed]
- Ilhan-Mutlu, A.; Starlinger, P.; Perkmann, T.; Schoppmann, S.F.; Preusser, M.; Birner, P. Plasma fibrinogen and blood platelet counts are associated with response to neoadjuvant therapy in esophageal cancer. Biomark. Med. 2015, 9, 327–335. [Google Scholar] [CrossRef]
- Noble, F.; Hopkins, J.; Curtis, N.; Kelly, J.J.; Bailey, I.S.; Byrne, J.P.; Bateman, A.C.; Bateman, A.R.; Underwood, T.J. The role of systemic inflammatory and nutritional blood-borne markers in predicting response to neoadjuvant chemotherapy and survival in oesophagogastric cancer. Med. Oncol. 2013, 30, 596. [Google Scholar] [CrossRef]
- Yang, C.; Chen, F.; Wang, S.; Xiong, B. Circulating Tumor Cells in Gastrointestinal Cancers: Current Status and Future Perspectives. Front. Oncol. 2019, 9, 1427. [Google Scholar] [CrossRef]
- Bratman, S.V.; Yang, S.Y.C.; Iafolla, M.A.J.; Liu, Z.; Hansen, A.R.; Bedard, P.L.; Lheureux, S.; Spreafico, A.; Razak, A.A.; Shchegrova, S.; et al. Personalized circulating tumor DNA analysis as a predictive biomarker in solid tumor patients treated with pembrolizumab. Nat. Cancer 2020, 1, 873–881. [Google Scholar] [CrossRef]
- Bain, G.H.; Collie-Duguid, E.; Murray, G.I.; Gilbert, F.J.; Denison, A.; McKiddie, F.; Ahearn, T.; Fleming, I.; Leeds, J.; Phull, P.; et al. Tumour expression of leptin is associated with chemotherapy resistance and therapy-independent prognosis in gastro-oesophageal adenocarcinomas. Br. J. Cancer 2014, 110, 1525–1534. [Google Scholar] [CrossRef]
- Mongan, A.M.; Lynam-Lennon, N.; Casey, R.; Maher, S.; Pidgeon, G.; Reynolds, J.V.; O’Sullivan, J. Visceral obesity stimulates anaphase bridge formation and spindle assembly checkpoint dysregulation in radioresistant oesophageal adenocarcinoma. Clin. Transl. Oncol. 2016, 18, 632–640. [Google Scholar] [CrossRef]
- Wang, J.; Myles, B.; Wei, C.; Chang, J.Y.; Hofstetter, W.L.; Ajani, J.A.; Swisher, S.G.; Cox, J.D.; Komaki, R.; Liao, Z.; et al. Obesity and outcomes in patients treated with chemoradiotherapy for esophageal carcinoma. Dis. Esophagus 2014, 27, 168–175. [Google Scholar] [CrossRef] [PubMed][Green Version]
- Tomita, H.; Tanaka, K.; Tanaka, T.; Hara, A. Aldehyde dehydrogenase 1A1 in stem cells and cancer. Oncotarget 2016, 7, 11018–11032. [Google Scholar] [CrossRef] [PubMed]
- Ajani, J.A.; Wang, X.; Song, S.; Suzuki, A.; Taketa, T.; Sudo, K.; Wadhwa, R.; Hofstetter, W.L.; Komaki, R.; Maru, D.M.; et al. ALDH-1 expression levels predict response or resistance to preoperative chemoradiation in resectable esophageal cancer patients. Mol. Oncol. 2014, 8, 142–149. [Google Scholar] [CrossRef] [PubMed]
- Hale, M.D.; Nankivell, M.; Hutchins, G.G.; Stenning, S.P.; Langley, R.E.; Mueller, W.; West, N.P.; Wright, A.I.; Treanor, D.; Hewitt, L.C.; et al. Biopsy proportion of tumour predicts pathological tumour response and benefit from chemotherapy in resectable oesophageal carcinoma—Results from the UK MRC OE02 trial. Oncotarget 2016, 7, 77565–77575. [Google Scholar] [CrossRef] [PubMed]
- Jane, M.Y.; Michael, J.S. How to critically appraise an article. Nat. Clin. Pract. Gastroenterol. Hepatol. 2009, 6, 82–91. [Google Scholar]
- Elodie, M.; De Elly, V.; Benedicte, D.; Christian, V.; Ken, K.; De Filip, V.; Ingeborg, G.; Boudewijn, B.; De Olivier, W.; Wim, C.; et al. Hypoxia imaging using 18F-FAZA PET/CT to predict radioresistance and guide hypoxic modification with nimorazole in esophageal adenocarcinoma xenografts. In Proceedings of the 19th World Congress on Gastrointestinal Cancer, ESMO 2017, Barcelona, Spain, 28 June–1 July 2017; Volume 2028 (Suppl. 2013), pp. iii2013–iii2015. [Google Scholar]
- Veeranki, O.L.; Dokey, R.; Mejia, A.; Tong, Z.; Zhang, J.; Qiao, Y.; Singh, P.K.; Katkhuda, R.; Mino, B.; Tailor, R.; et al. Targeting cyclin-dependent kinase 9 enhances sensitization to ionizing radiation in esophageal adenocarcinoma and identifies AXL as a novel downstream target. In Proceedings of the Association for Cancer Surgery Annual Scientific Conference and the NCRI Cancer Conference 2017, Liverpool, UK, 5–8 November 2017; Volume 2044 (Suppl. 2011), p. S2024. [Google Scholar]
- Stroes, C.I.; Schokker, S.; Creemers, A.; Molenaar, R.J.; Hulshof, M.; van der Woude, S.O.; Bennink, R.J.; Mathôt, R.A.A.; Krishnadath, K.K.; Punt, C.J.A.; et al. Phase II Feasibility and Biomarker Study of Neoadjuvant Trastuzumab and Pertuzumab With Chemoradiotherapy for Resectable Human Epidermal Growth Factor Receptor 2-Positive Esophageal Adenocarcinoma: TRAP Study. J. Clin. Oncol. 2020, 38, 462–471. [Google Scholar] [CrossRef] [PubMed]
Publisher’s Note: MDPI stays neutral with regard to jurisdictional claims in published maps and institutional affiliations. |
© 2022 by the authors. Licensee MDPI, Basel, Switzerland. This article is an open access article distributed under the terms and conditions of the Creative Commons Attribution (CC BY) license (https://creativecommons.org/licenses/by/4.0/).
Share and Cite
Jiang, W.; de Jong, J.M.; van Hillegersberg, R.; Read, M. Predicting Response to Neoadjuvant Therapy in Oesophageal Adenocarcinoma. Cancers 2022, 14, 996. https://doi.org/10.3390/cancers14040996
Jiang W, de Jong JM, van Hillegersberg R, Read M. Predicting Response to Neoadjuvant Therapy in Oesophageal Adenocarcinoma. Cancers. 2022; 14(4):996. https://doi.org/10.3390/cancers14040996
Chicago/Turabian StyleJiang, William, Jelske M. de Jong, Richard van Hillegersberg, and Matthew Read. 2022. "Predicting Response to Neoadjuvant Therapy in Oesophageal Adenocarcinoma" Cancers 14, no. 4: 996. https://doi.org/10.3390/cancers14040996
APA StyleJiang, W., de Jong, J. M., van Hillegersberg, R., & Read, M. (2022). Predicting Response to Neoadjuvant Therapy in Oesophageal Adenocarcinoma. Cancers, 14(4), 996. https://doi.org/10.3390/cancers14040996