
Development of High-Resolution Dedicated PET-Based Radiomics Machine Learning Model to Predict Axillary Lymph Node Status in Early-Stage Breast Cancer

 ,
,
Abstract
Simple Summary
Abstract
1. Introduction
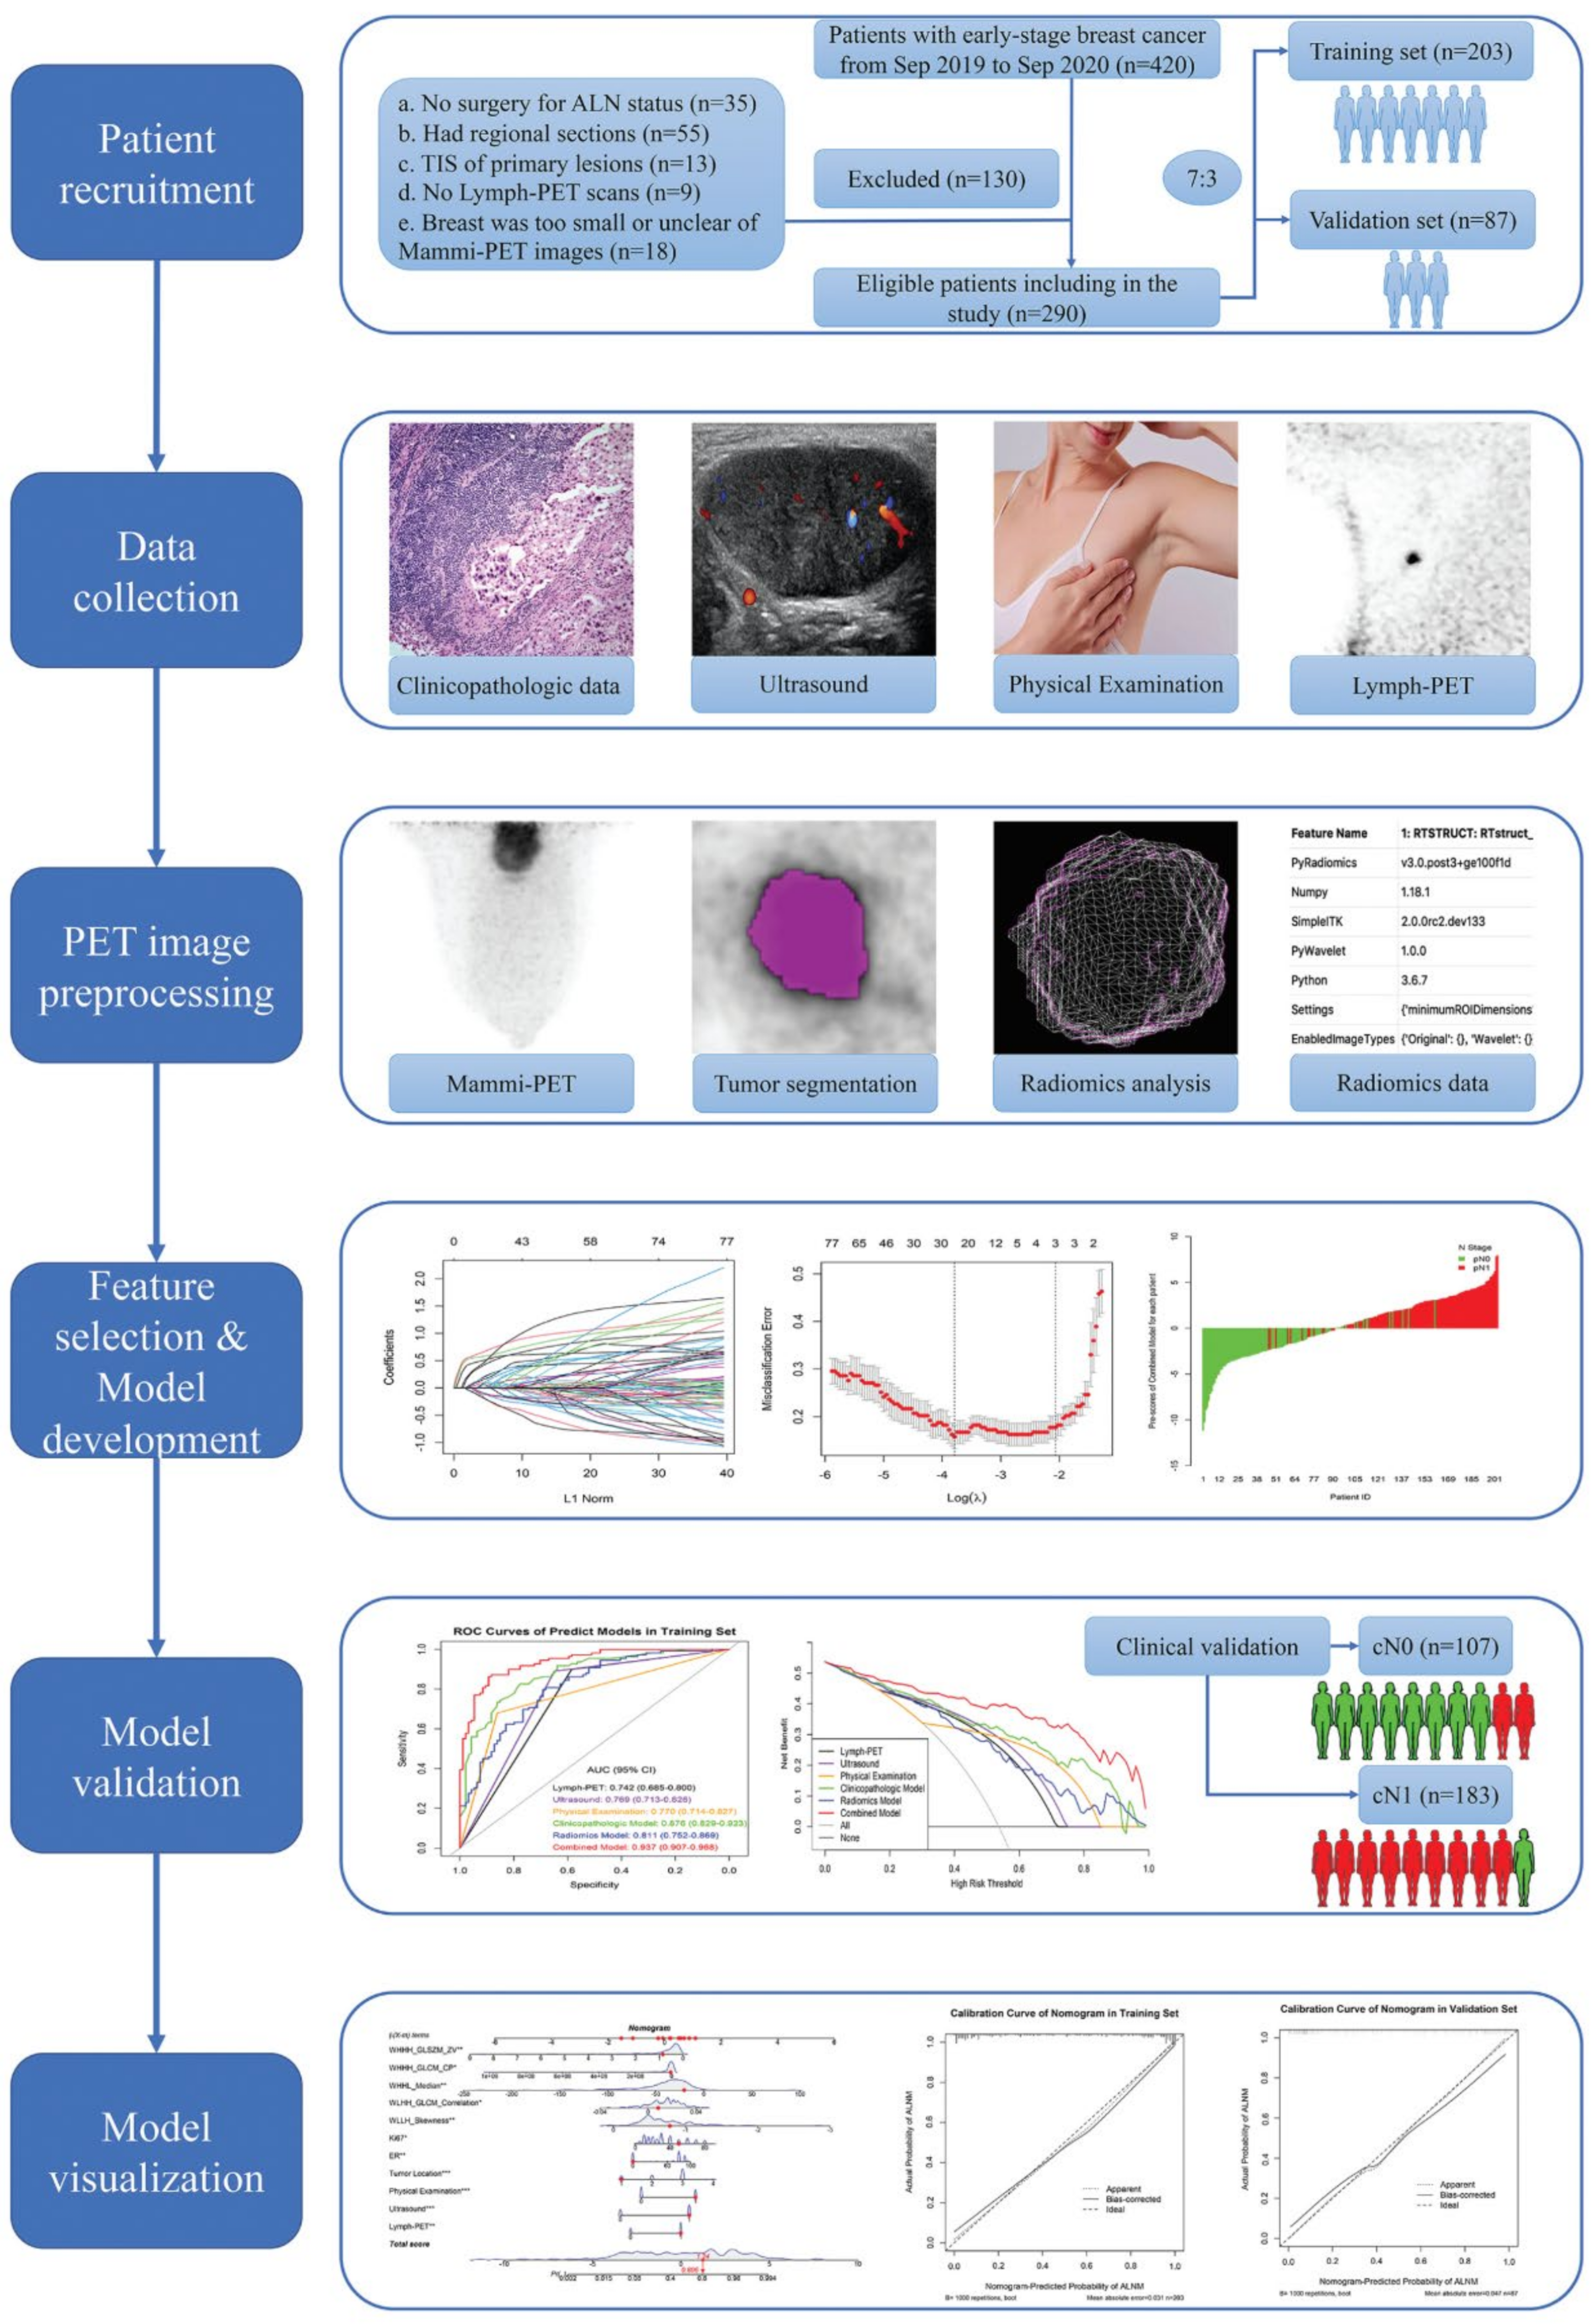
2. Methods
2.1. Patients
2.2. Conventional Examination and Evaluation
2.3. Surgery Procedure and Pathological Evaluation
2.4. D-PET Examination and Evaluation
2.5. Tumor Segmentation
2.6. Quantitative Radiomics Feature Extraction
2.7. Model Development and Validation
2.8. Nomogram Development and Validation
2.9. Statistical Analysis
3. Results
3.1. Demographic and Clinicopathological Characteristics
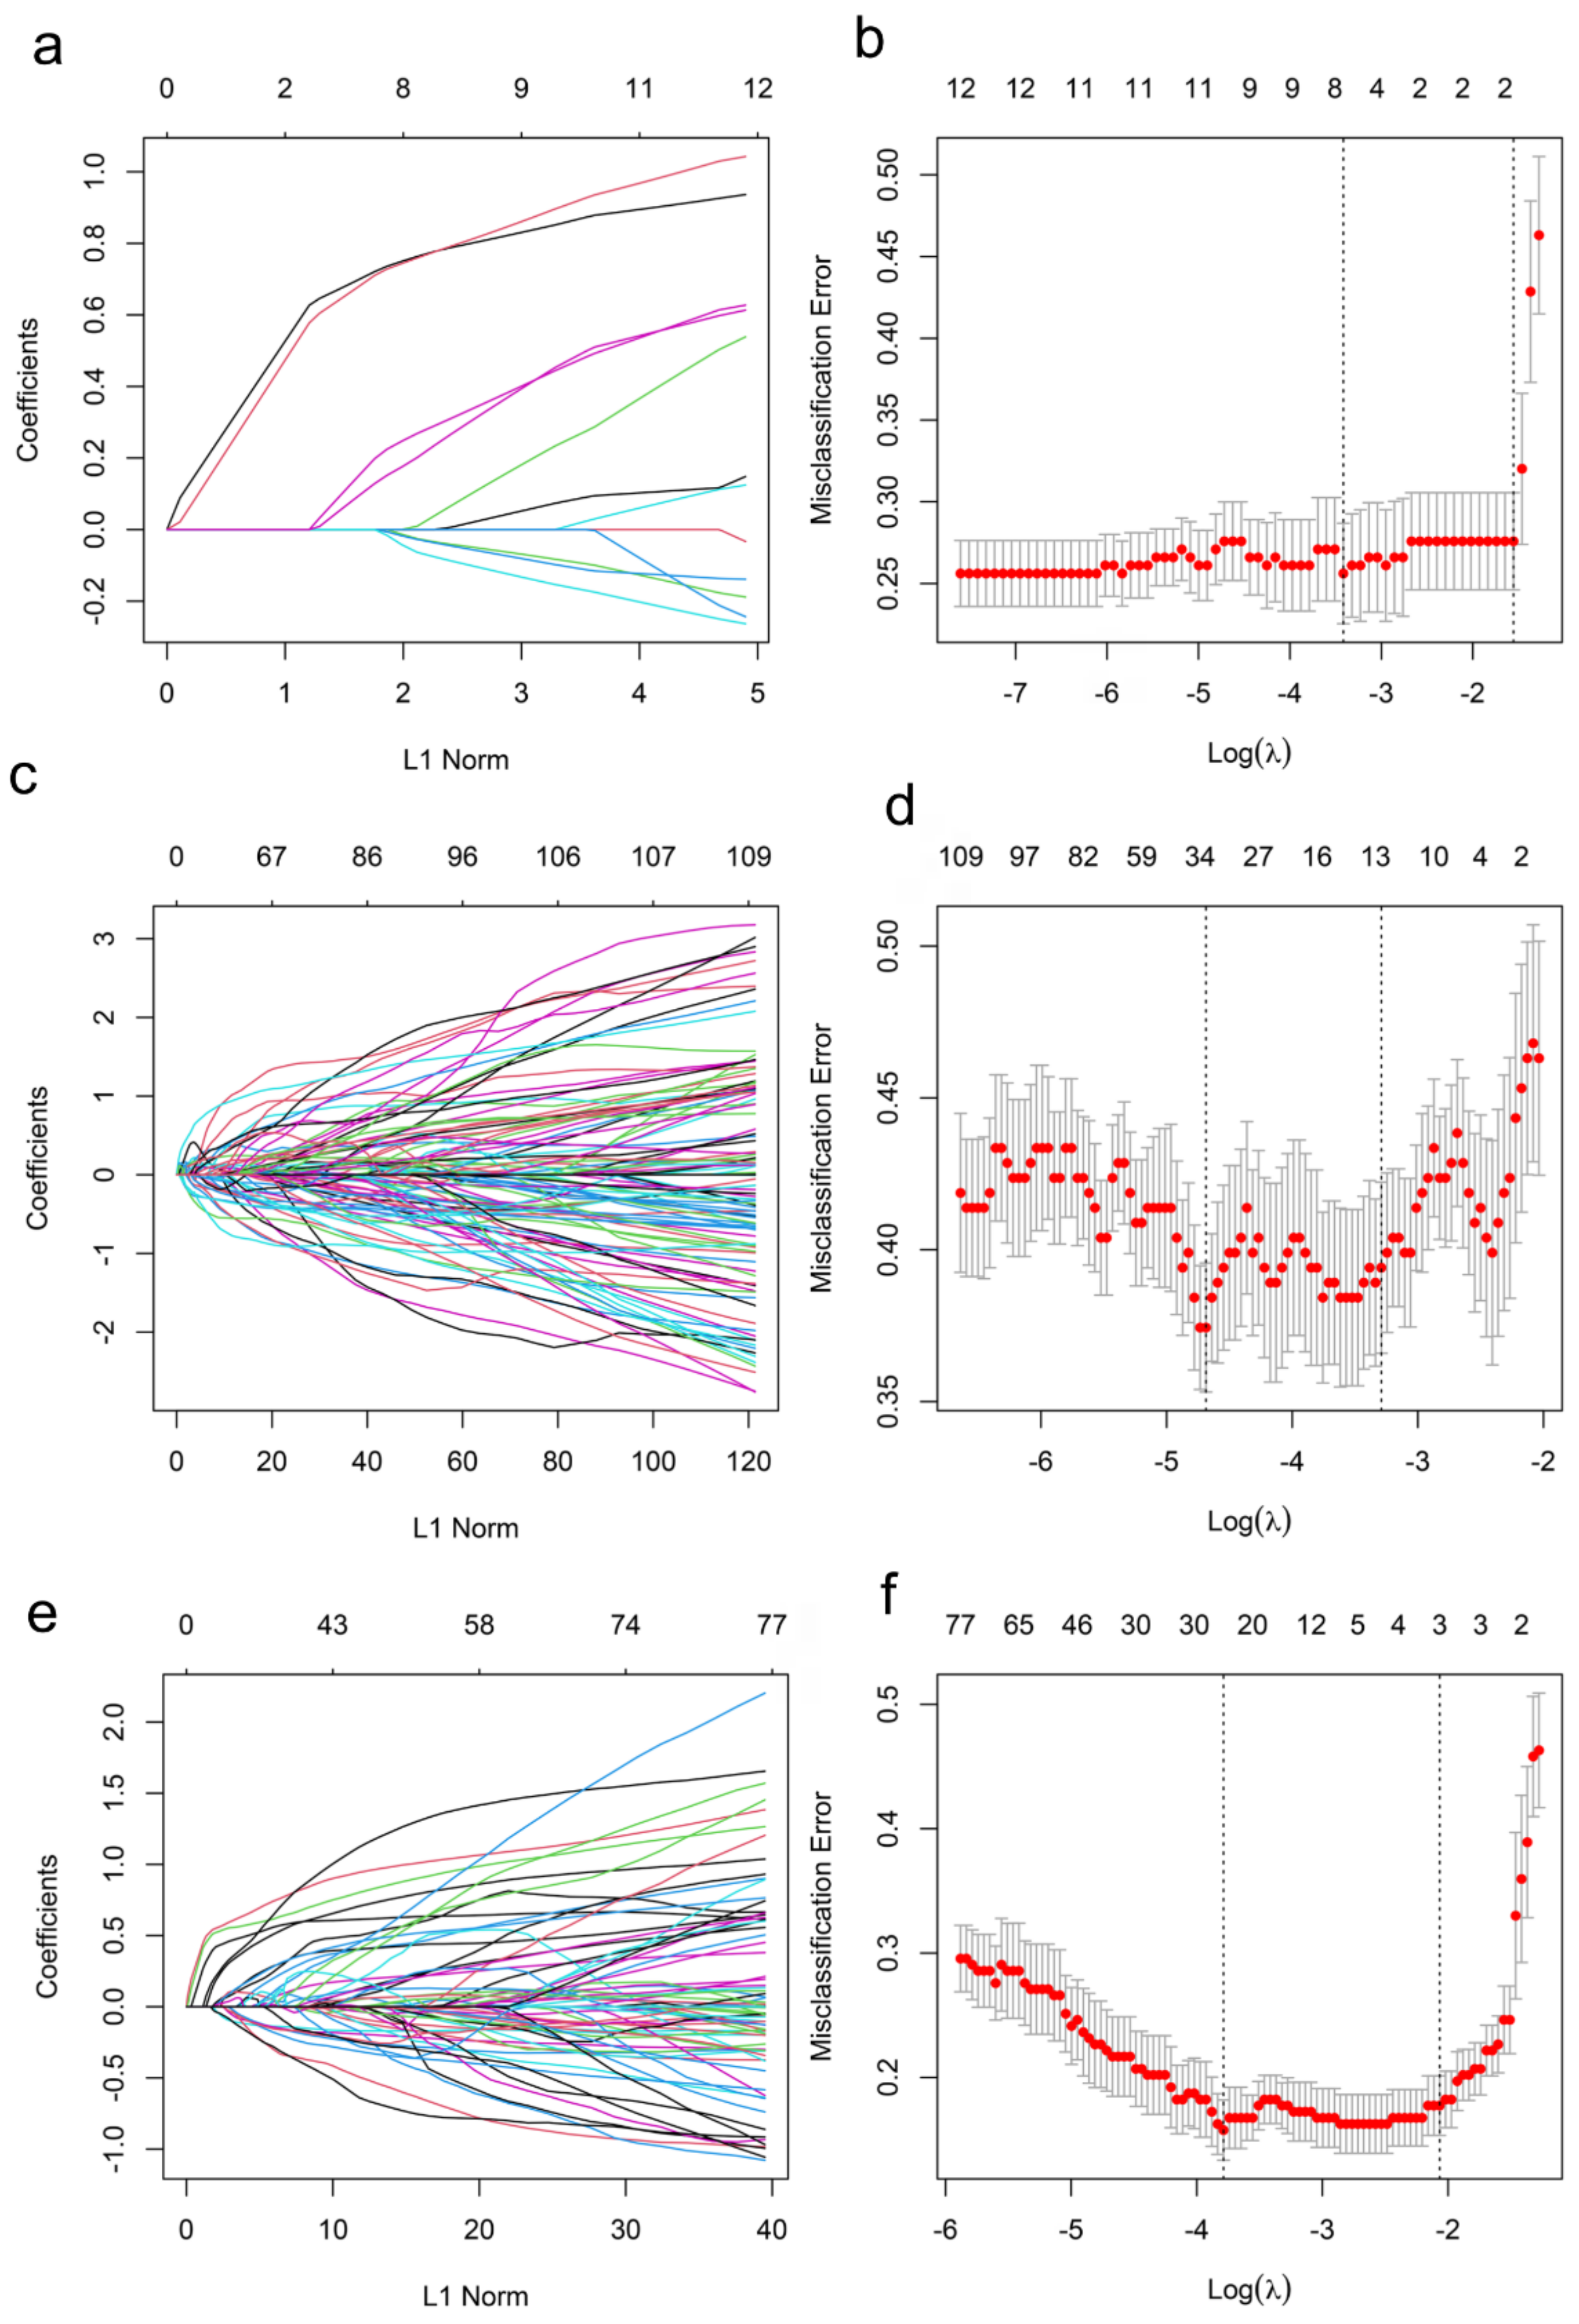
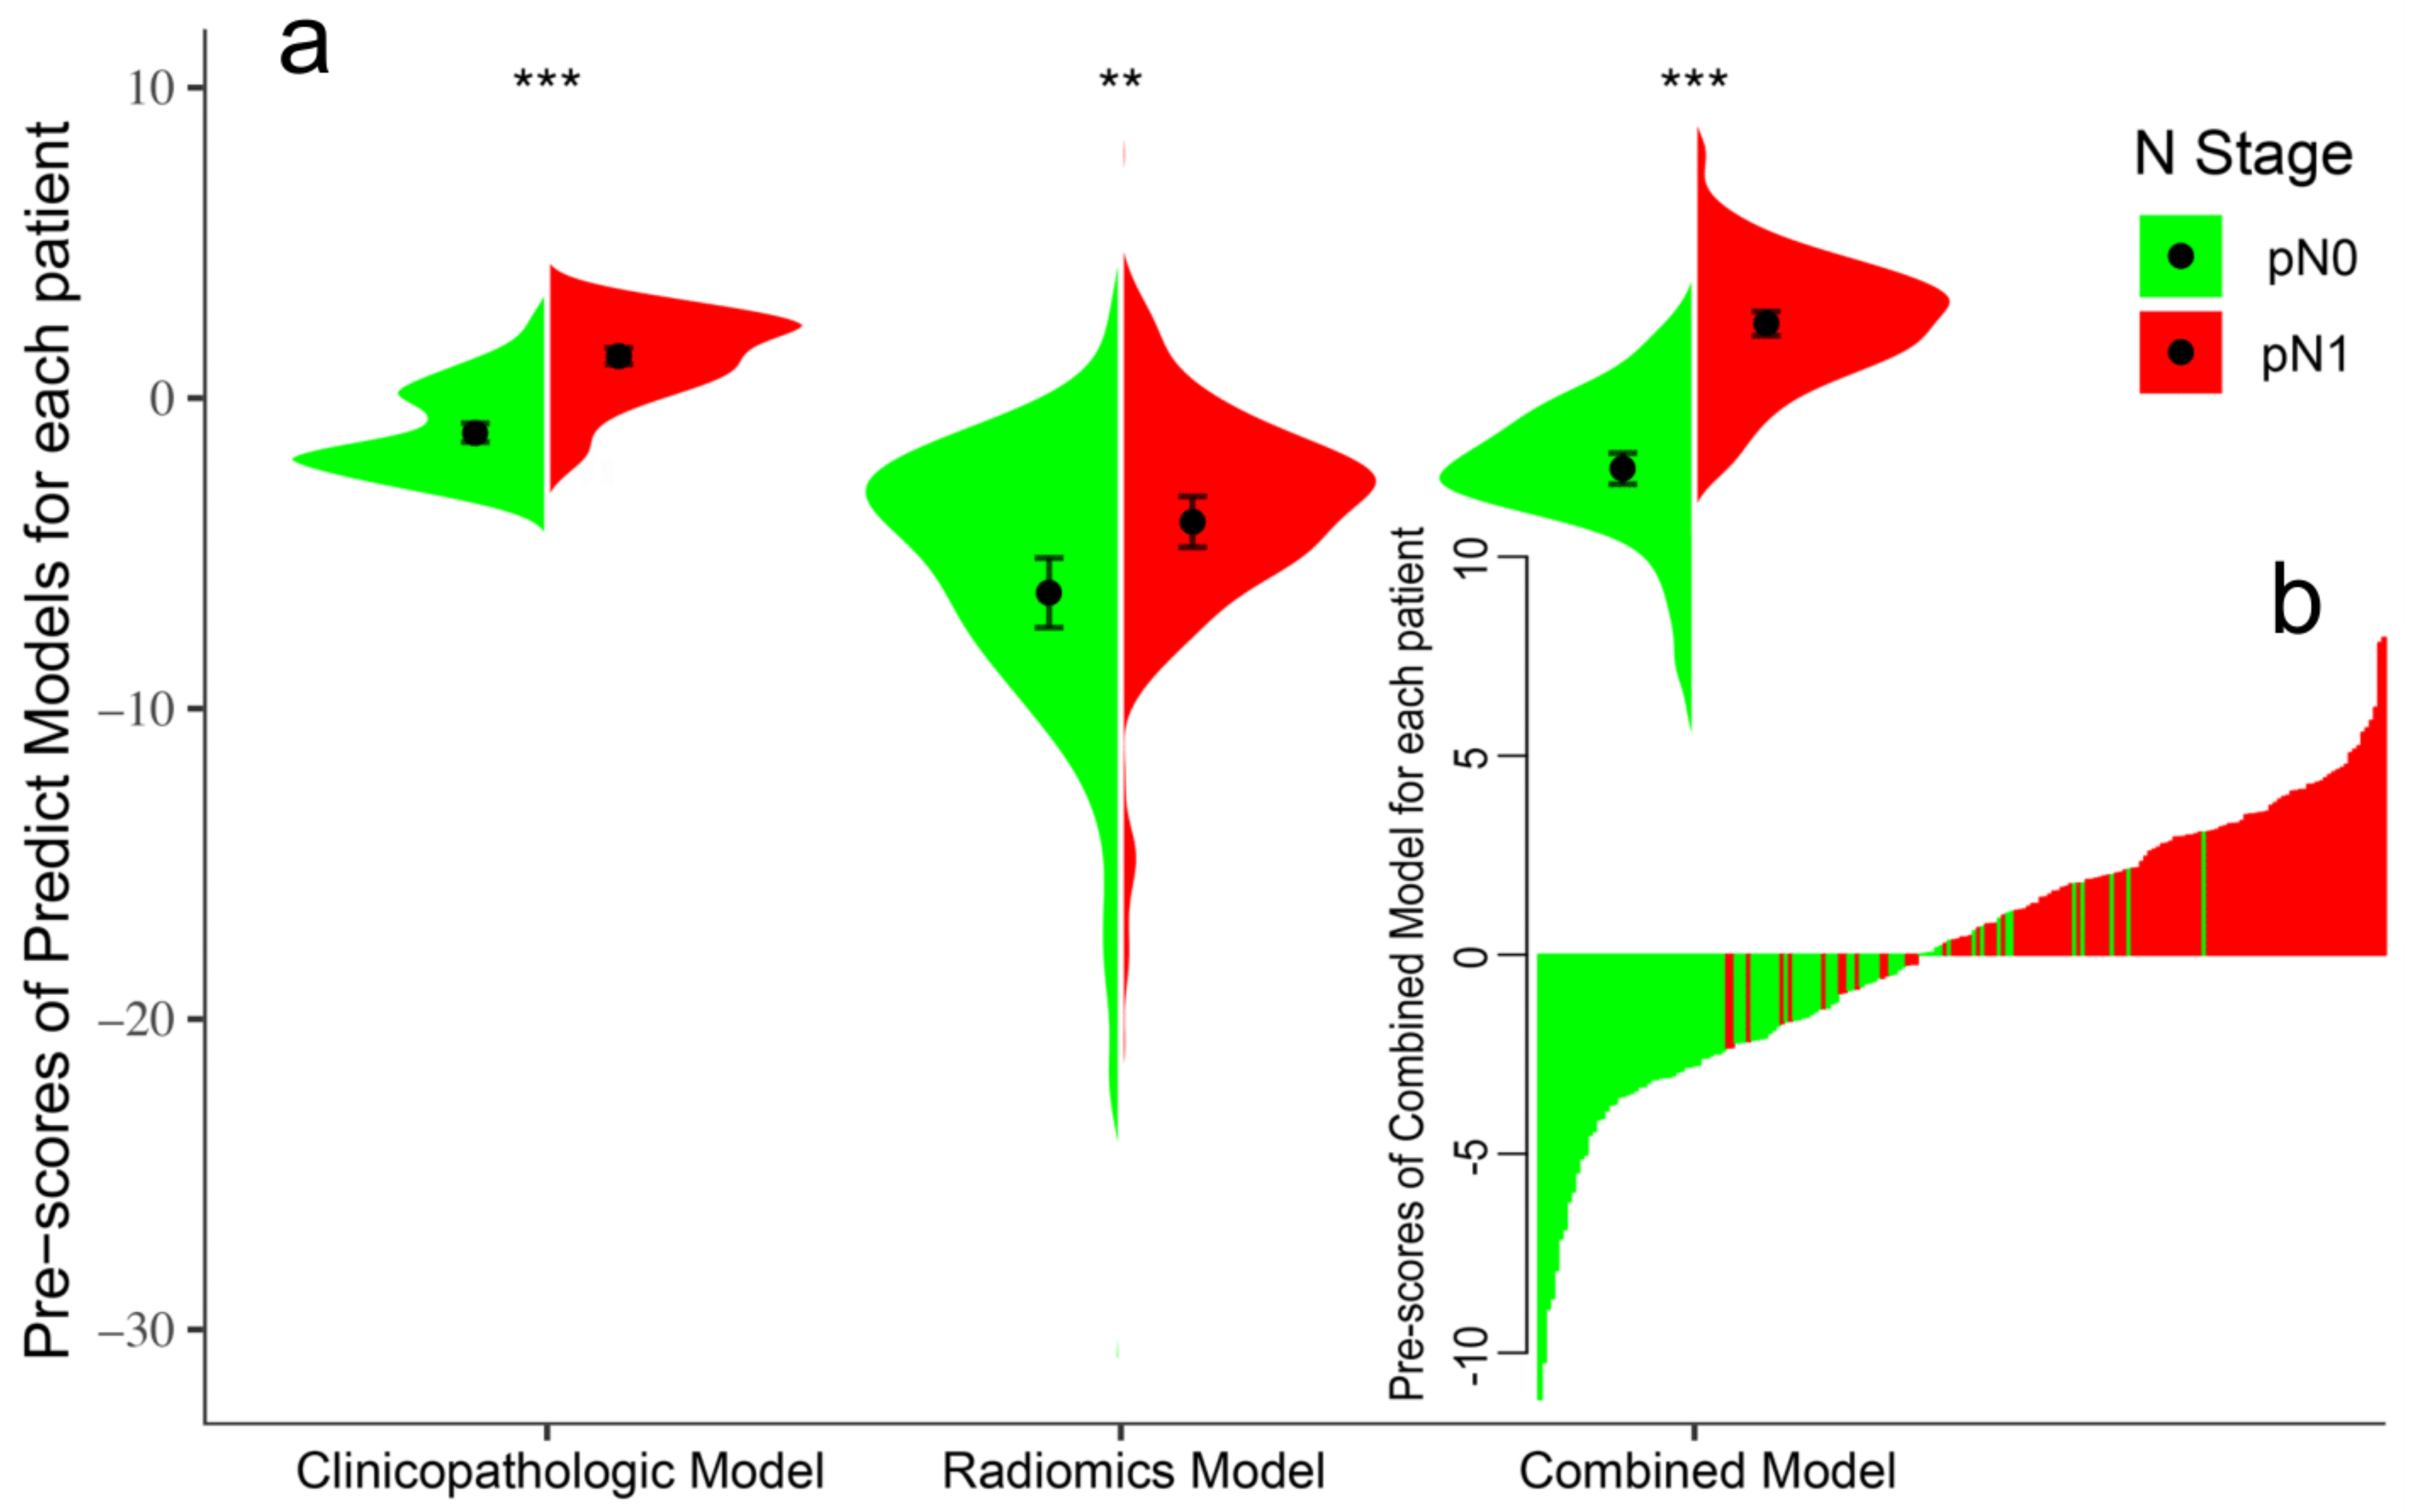
3.2. Feature Selection and Model Development
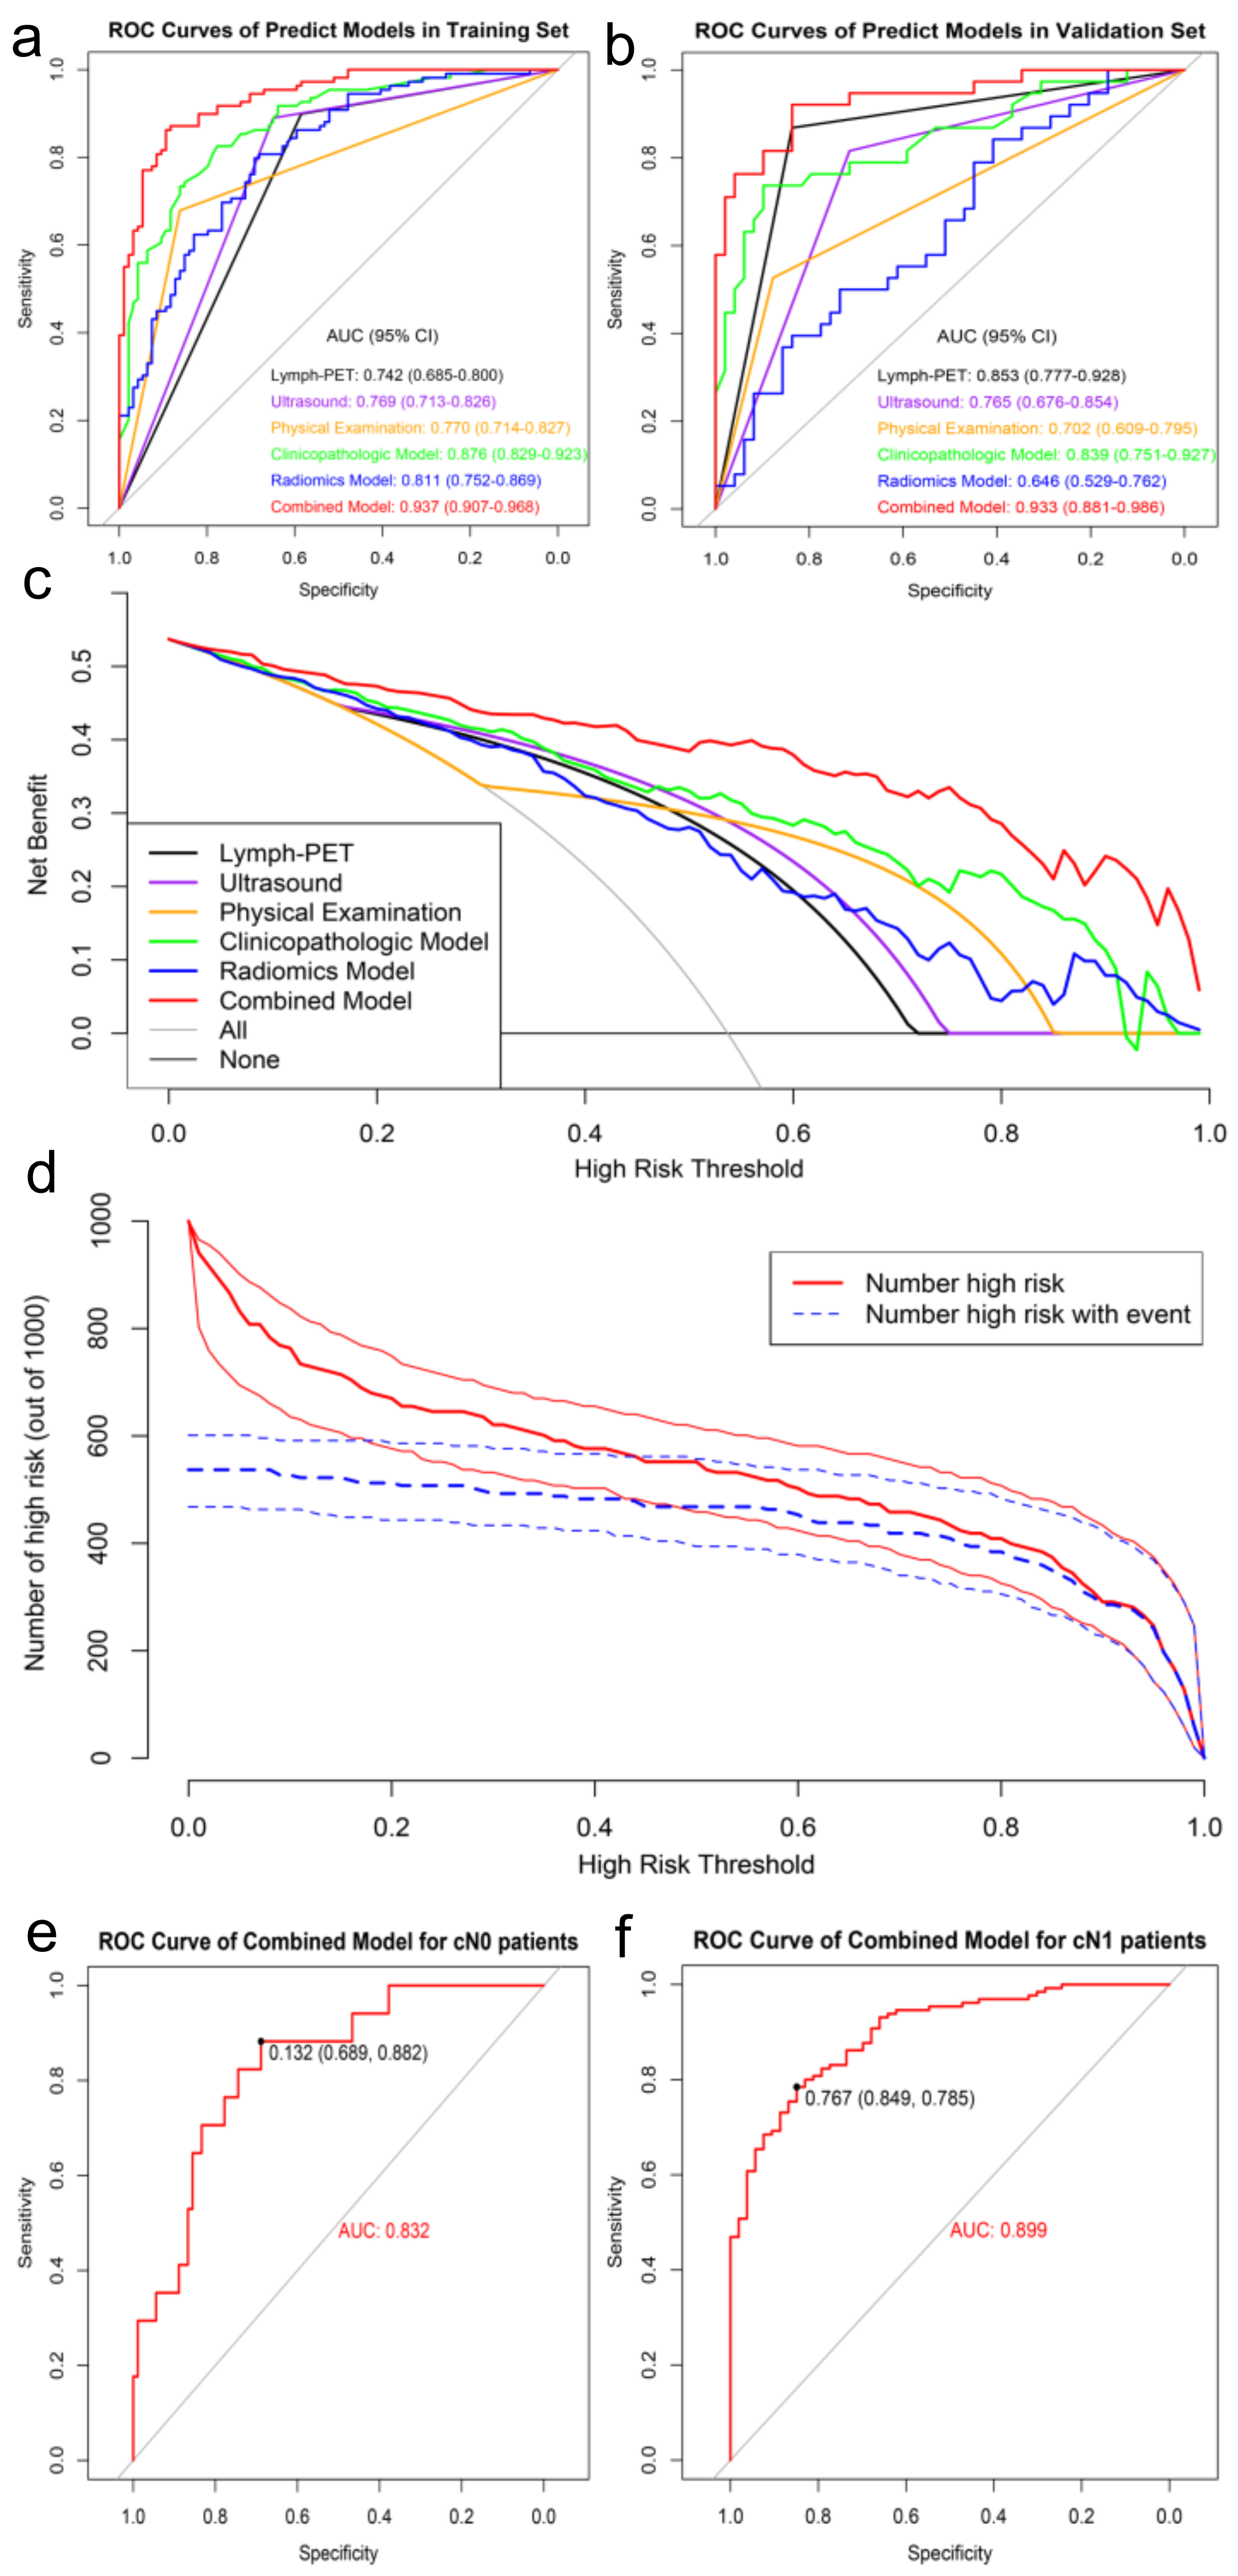
3.3. Model Performance and Clinical Utility
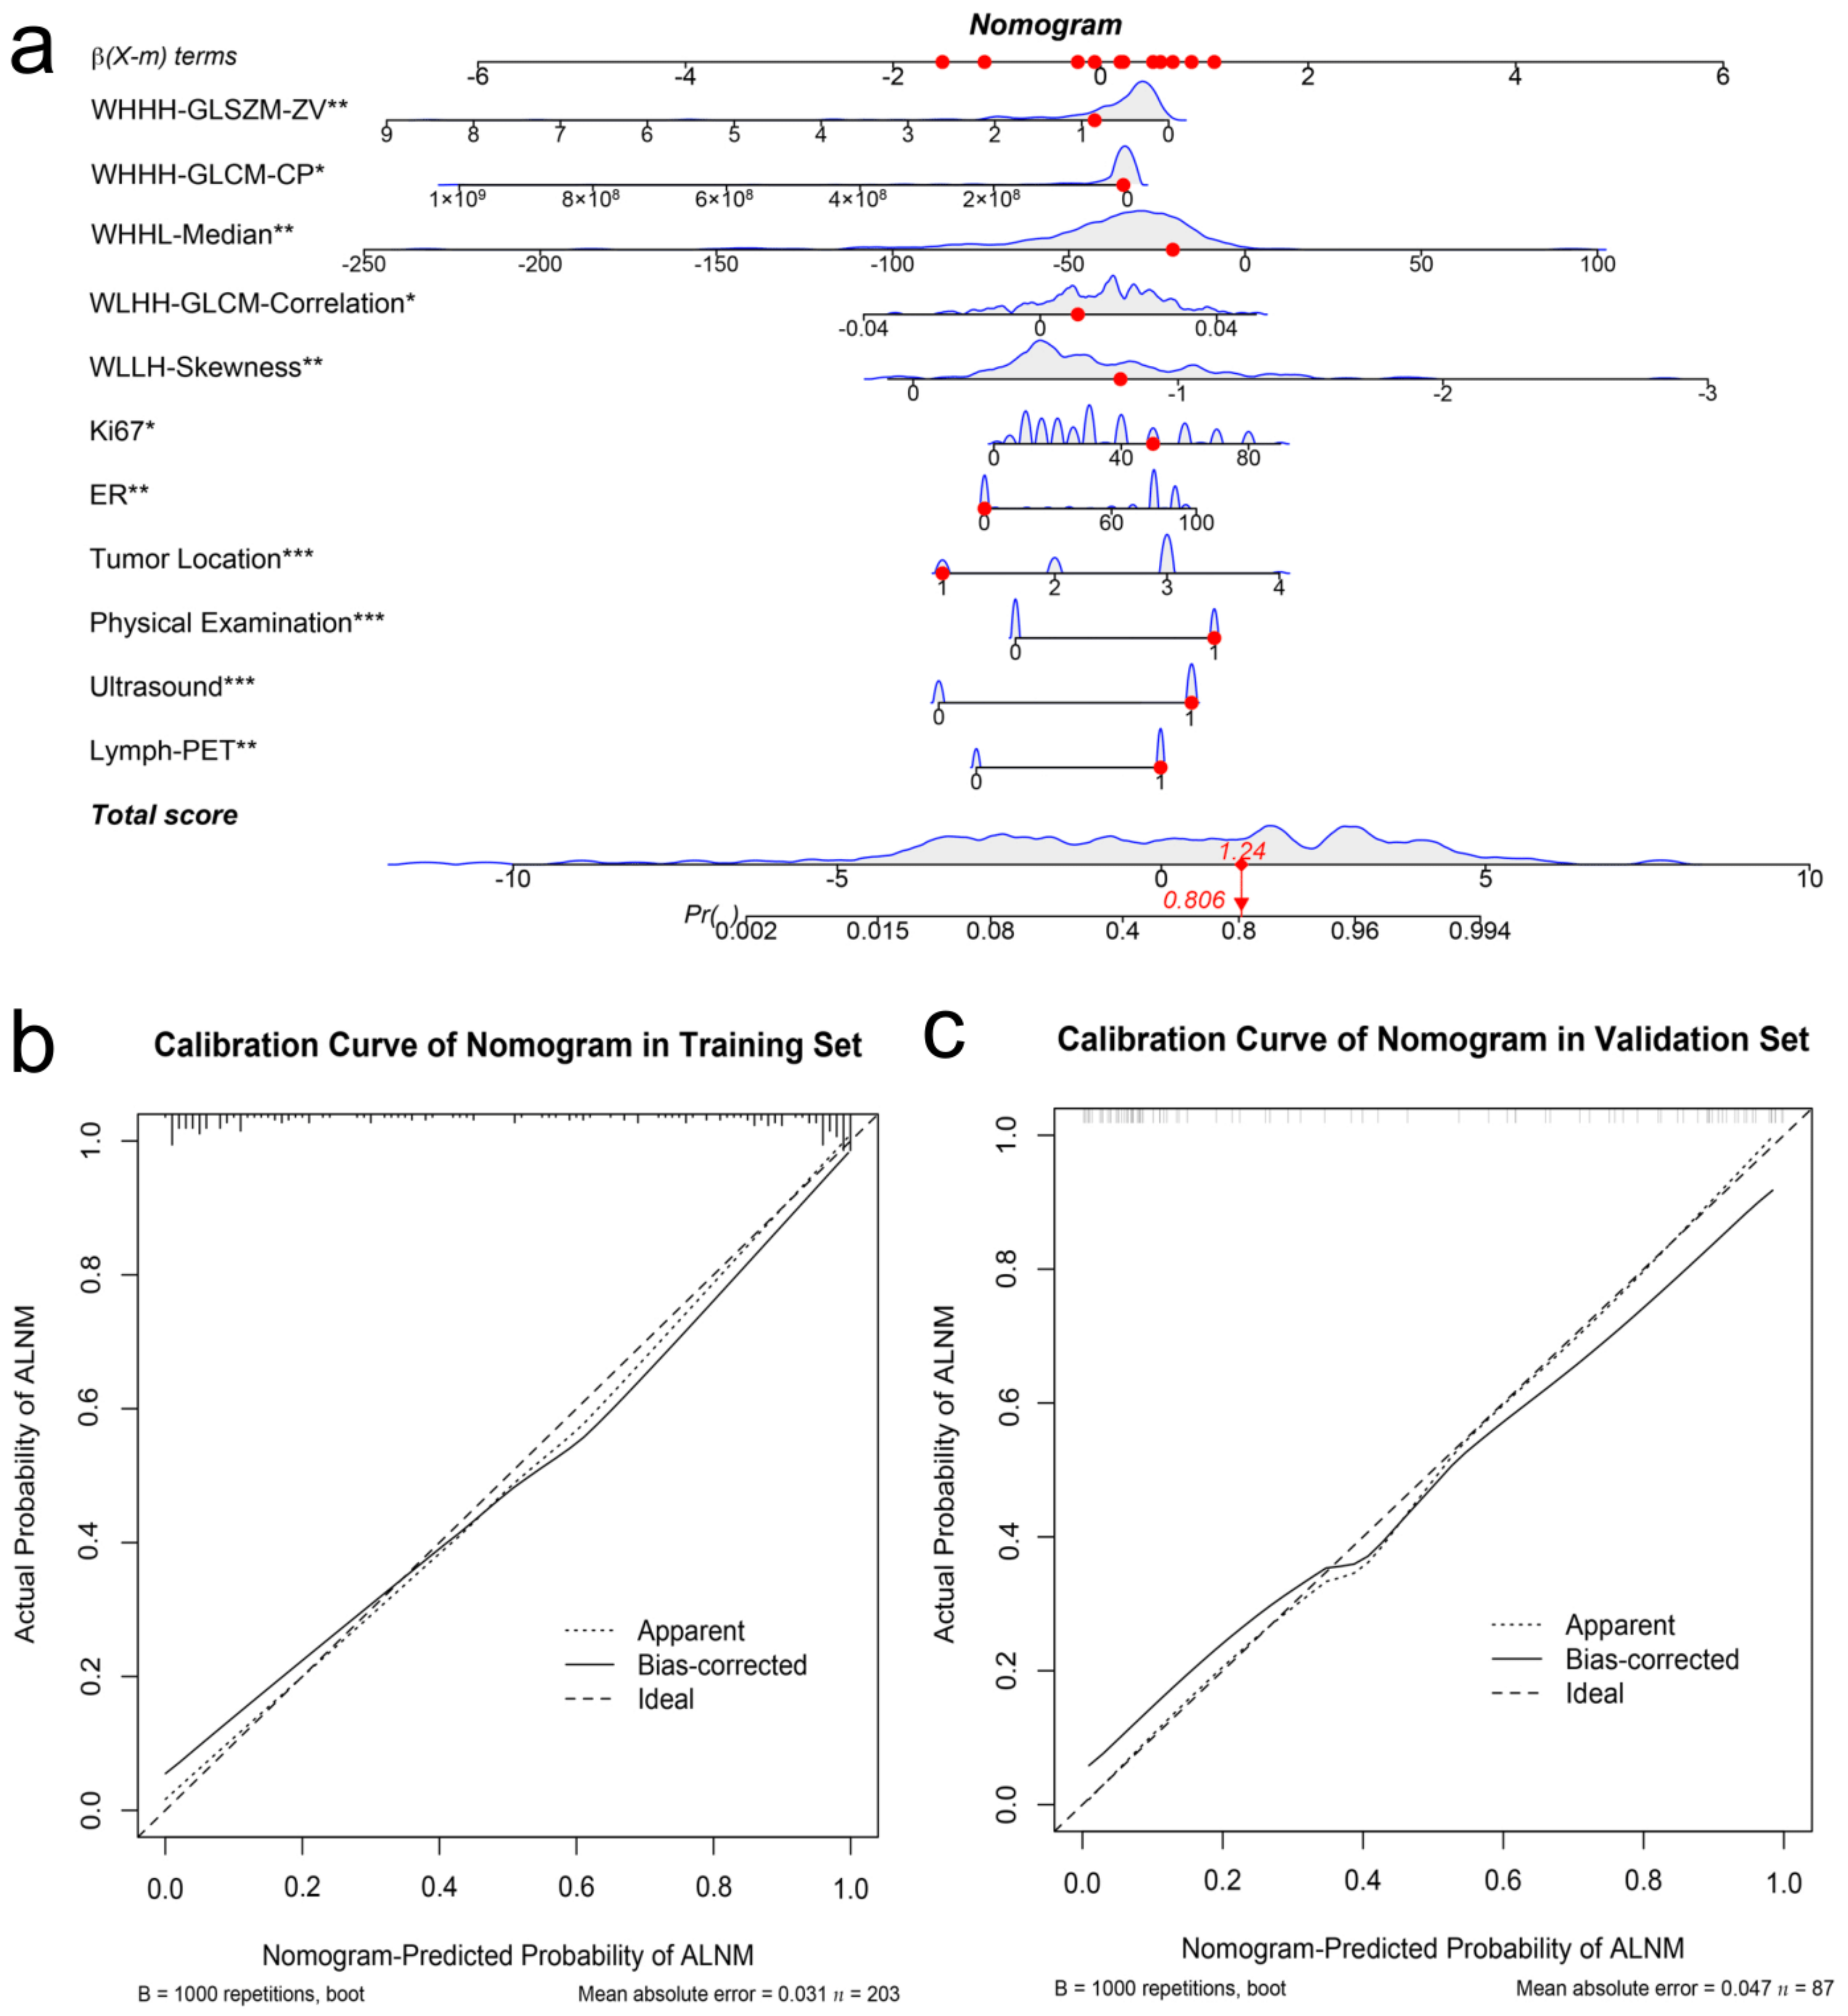
3.4. Nomogram Development and Validation
4. Discussion
5. Conclusions
Supplementary Materials
Author Contributions
Funding
Institutional Review Board Statement
Informed Consent Statement
Data Availability Statement
Conflicts of Interest
Abbreviations
References
- Banerjee, M.; George, J.; Song, E.Y.; Roy, A.; Hryniuk, W. Tree-Based Model for Breast Cancer Prognostication. J. Clin. Oncol. 2004, 22, 2567–2575. [Google Scholar] [CrossRef] [PubMed][Green Version]
- Veronesi, U.; Paganelli, G.; Viale, G.; Luini, A.; Zurrida, S.; Galimberti, V.; Intra, M.; Veronesi, P.; Robertson, C.; Maisonneuve, P.; et al. A Randomized Comparison of Sentinel-Node Biopsy with Routine Axillary Dissection in Breast Cancer. N. Engl. J. Med. 2003, 349, 546–553. [Google Scholar] [CrossRef] [PubMed]
- Esserman, L.; Gallant, E.; Alvarado, M. Less is More: The Evolving Surgical Approach to Breast Cancer. Am. Soc. Clin. Oncol. Educ. Book 2016, 35, e5–e10. [Google Scholar] [CrossRef] [PubMed]
- Moliner, L.; González, A.J.; Soriano, A.; Sánchez, F.; Correcher, C.; Orero, A.; Carles, M.; Vidal, L.F.; Barberá, J.; Caballero, L.; et al. Design and evaluation of the MAMMI dedicated breast PET. Med. Phys. 2012, 39, 5393–5404. [Google Scholar] [CrossRef]
- Jones, E.F.; Ray, K.M.; Li, W.; Seo, Y.; Franc, B.L.; Chien, A.J.; Esserman, L.J.; Pampaloni, M.H.; Joe, B.N.; Hylton, N.M. Dedicated Breast Positron Emission Tomography for the Evaluation of Early Response to Neoadjuvant Chemotherapy in Breast Cancer. Clin. Breast Cancer 2016, 17, e155–e159. [Google Scholar] [CrossRef]
- Hathi, D.K.; Li, W.; Seo, Y.; Flavell, R.R.; Kornak, J.; Franc, B.L.; Joe, B.N.; Esserman, L.J.; Hylton, N.M.; Jones, E.F. Evaluation of primary breast cancers using dedicated breast PET and whole-body PET. Sci. Rep. 2020, 10, 21930. [Google Scholar] [CrossRef]
- Mayerhoefer, M.E.; Materka, A.; Langs, G.; Häggström, I.; Szczypiński, P.; Gibbs, P.; Cook, G. Introduction to Radiomics. J. Nucl. Med. 2020, 61, 488–495. [Google Scholar] [CrossRef]
- Giuliano, A.E.; Edge, S.B.; Hortobagyi, G.N. Eighth Edition of the AJCC Cancer Staging Manual: Breast Cancer. Ann. Surg. Oncol. 2018, 25, 1783–1785. [Google Scholar] [CrossRef]
- Collins, G.S.; Reitsma, J.B.; Altman, D.G.; Moons, K.G. Transparent Reporting of a multivariable prediction model for Individual Prognosis Or Diagnosis (TRIPOD): The TRIPOD Statement. Ann. Intern. Med. 2015, 162, 55–63. [Google Scholar] [CrossRef]
- Wolff, A.; Hammond, M.E.H.; Hicks, D.G.; Dowsett, M.; McShane, L.M.; Allison, K.H.; Allred, D.C.; Bartlett, J.M.; Bilous, M.; Fitzgibbons, P.; et al. Recommendations for Human Epidermal Growth Factor Receptor 2 Testing in Breast Cancer: American Society of Clinical Oncology/College of American Pathologists Clinical Practice Guideline Update. Arch. Pathol. Lab. Med. 2013, 138, 241–256. [Google Scholar] [CrossRef]
- Cheng, J.; Li, J.; Liu, G.; Shui, R.; Chen, S.; Yang, B.; Shao, Z. Diagnostic performance of a novel high-resolution dedicated axillary PET system in the assessment of regional nodal spread of disease in early breast cancer. Quant. Imaging Med. Surg. 2022, 12, 1109. [Google Scholar] [CrossRef] [PubMed]
- Werner-Wasik, M.; Nelson, A.D.; Choi, W.; Arai, Y.; Faulhaber, P.F.; Kang, P.; Almeida, F.D.; Xiao, Y.; Ohri, N.; Brockway, K.D.; et al. What is the Best Way to Contour Lung Tumors on PET Scans? Multiobserver Validation of a Gradient-Based Method Using a NSCLC Digital PET Phantom. Int. J. Radiat. Oncol. 2011, 82, 1164–1171. [Google Scholar] [CrossRef] [PubMed]
- Fedorov, A.; Beichel, R.; Kalpathy-Cramer, J.; Finet, J.; Fillion-Robin, J.-C.; Pujol, S.; Bauer, C.; Jennings, D.; Fennessy, F.; Sonka, M.; et al. 3D Slicer as an image computing platform for the Quantitative Imaging Network. Magn. Reson. Imaging 2012, 30, 1323–1341. [Google Scholar] [CrossRef] [PubMed]
- Van Griethuysen, J.J.M.; Fedorov, A.; Parmar, C.; Hosny, A.; Aucoin, N.; Narayan, V.; Beets-Tan, R.G.H.; Fillion-Robin, J.-C.; Pieper, S.; Aerts, H.J.W.L. Computational Radiomics System to Decode the Radiographic Phenotype. Cancer Res. 2017, 77, e104–e107. [Google Scholar] [CrossRef] [PubMed]
- Zwanenburg, A.; Vallières, M.; Abdalah, M.A.; Aerts, H.J.W.L.; Andrearczyk, V.; Apte, A.; Ashrafinia, S.; Bakas, S.; Beukinga, R.J.; Boellaard, R.; et al. The Image Biomarker Standardization Initiative: Standardized Quantitative Radiomics for High-Throughput Image-based Phenotyping. Radiology 2020, 295, 328–338. [Google Scholar] [CrossRef]
- Tibshirani, R. Regression Shrinkage and Selection Via the Lasso. J. R. Stat. Soc. Ser. B Methodol. 1996, 58, 267–288. [Google Scholar] [CrossRef]
- Sauerbrei, W.; Royston, P.; Binder, H. Selection of important variables and determination of functional form for continuous predictors in multivariable model building. Stat. Med. 2007, 26, 5512–5528. [Google Scholar] [CrossRef] [PubMed]
- Kerr, K.F.; Brown, M.D.; Zhu, K.; Janes, H. Assessing the Clinical Impact of Risk Prediction Models With Decision Curves: Guidance for Correct Interpretation and Appropriate Use. J. Clin. Oncol. 2016, 34, 2534–2540. [Google Scholar] [CrossRef] [PubMed]
- Balachandran, V.P.; Gonen, M.; Smith, J.J.; DeMatteo, R.P. Nomograms in oncology: More than meets the eye. Lancet Oncol. 2015, 16, e173–e180. [Google Scholar] [CrossRef]
- Lee, B.; Lim, A.K.; Krell, J.; Satchithananda, K.; Coombes, R.C.; Lewis, J.S.; Stebbing, J. The efficacy of axillary ultrasound in the detection of nodal metastasis in breast cancer. AJR Am. J. Roentgenol. 2013, 200, W314–W320. [Google Scholar] [CrossRef]
- Alvarez, S.; Añorbe, E.; Alcorta, P.; López, F.; Alonso, I.; Cortés, J. Role of Sonography in the Diagnosis of Axillary Lymph Node Metastases in Breast Cancer: A Systematic Review. Am. J. Roentgenol. 2006, 186, 1342–1348. [Google Scholar] [CrossRef] [PubMed]
- Houssami, N.; Ciatto, S.; Turner, R.M.; Cody, H.S., III; Macaskill, P. Preoperative ultrasound-guided needle biopsy of axillary nodes in invasive breast cancer: Meta-analysis of its accuracy and utility in staging the axilla. Ann. Surg. 2011, 254, 243–251. [Google Scholar] [CrossRef] [PubMed]
- Shetty, M.K.; Carpenter, W.S. Sonographic evaluation of isolated abnormal axillary lymph nodes identified on mammograms. J. Ultrasound Med. 2004, 23, 63–71. [Google Scholar] [CrossRef] [PubMed]
- Van Nijnatten, T.; Ploumen, E.; Schipper, R.; Goorts, B.; Andriessen, E.; Vanwetswinkel, S.; Schavemaker, M.; Nelemans, P.; de Vries, B.; Beets-Tan, R.; et al. Routine use of standard breast MRI compared to axillary ultrasound for differentiating between no, limited and advanced axillary nodal disease in newly diagnosed breast cancer patients. Eur. J. Radiol. 2016, 85, 2288–2294. [Google Scholar] [CrossRef]
- Li, L.; Ren, S.; Zhang, Y.; Guan, Y.; Zhao, J.; Liu, J.; Wang, Q.; Chen, G.; Chen, H.; Xiang, J.; et al. Risk factors for predicting the occult nodal metastasis in T1–2N0M0 NSCLC patients staged by PET/CT: Potential value in the clinic. Lung Cancer 2013, 81, 213–217. [Google Scholar] [CrossRef]
- Li, K.; Sun, H.; Lu, Z.; Xin, J.; Zhang, L.; Guo, Y.; Guo, Q. Value of [18F]FDG PET radiomic features and VEGF expression in predicting pelvic lymphatic metastasis and their potential relationship in early-stage cervical squamous cell carcinoma. Eur. J. Radiol. 2018, 106, 160–166. [Google Scholar] [CrossRef]
- Zhang, C.; Shi, Z.; Kalendralis, P.; Whybra, P.; Parkinson, C.; Berbee, M.; Spezi, E.; Roberts, A.; Christian, A.; Lewis, W.; et al. Prediction of lymph node metastases using pre-treatment PET radiomics of the primary tumour in esophageal adenocarcinoma: An external validation study. Br. J. Radiol. 2021, 94, 20201042. [Google Scholar] [CrossRef]
- Önner, H.; Coskun, N.; Erol, M.; Karanis, M.I.E. Association of 18F-FDG PET/CT textural features with immunohistochemical characteristics in invasive ductal breast cancer. Rev. Esp. Med. Nucl. Imagen Mol. Engl. Ed. 2021, 41, 11–16. [Google Scholar] [CrossRef]
- Song, B.-I. A machine learning-based radiomics model for the prediction of axillary lymph-node metastasis in breast cancer. Breast Cancer 2021, 28, 664–671. [Google Scholar] [CrossRef]
- O’Connor, M.K.; Tran, T.D.; Swanson, T.N.; Ellingson, L.R.; Hunt, K.N.; Whaley, D.H. Improved visualization of breast tissue on a dedicated breast PET system through ergonomic redesign of the imaging table. EJNMMI Res. 2017, 7, 100. [Google Scholar] [CrossRef]
- Hatt, M.; Majdoub, M.; Vallières, M.; Tixier, F.; Le Rest, C.C.; Groheux, D.; Hindié, E.; Martineau, A.; Pradier, O.; Hustinx, R.; et al. 18F-FDG PET Uptake Characterization Through Texture Analysis: Investigating the Complementary Nature of Heterogeneity and Functional Tumor Volume in a Multi–Cancer Site Patient Cohort. J. Nucl. Med. 2014, 56, 38–44. [Google Scholar] [CrossRef] [PubMed]
- Soret, M.; Bacharach, S.L.; Buvat, I. Partial-Volume Effect in PET Tumor Imaging. J. Nucl. Med. 2007, 48, 932–945. [Google Scholar] [CrossRef] [PubMed]
- Berg, W.A.; Madsen, K.S.; Schilling, K.; Tartar, M.; Pisano, E.D.; Larsen, L.H.; Narayanan, D.; Ozonoff, A.; Miller, J.P.; Kalinyak, J.E. Breast Cancer: Comparative Effectiveness of Positron Emission Mammography and MR Imaging in Presurgical Planning for the Ipsilateral Breast. Radiology 2011, 258, 59–72. [Google Scholar] [CrossRef] [PubMed]
- Mao, N.; Dai, Y.; Lin, F.; Ma, H.; Duan, S.; Xie, H.; Zhao, W.; Hong, N. Radiomics Nomogram of DCE-MRI for the Prediction of Axillary Lymph Node Metastasis in Breast Cancer. Front. Oncol. 2020, 10, 541849. [Google Scholar] [CrossRef]
- Yu, Y.; Tan, Y.; Xie, C.; Hu, Q.; Ouyang, J.; Chen, Y.; Gu, Y.; Li, A.; Lu, N.; He, Z.; et al. Development and Validation of a Preoperative Magnetic Resonance Imaging Radiomics–Based Signature to Predict Axillary Lymph Node Metastasis and Disease-Free Survival in Patients With Early-Stage Breast Cancer. JAMA Netw. Open 2020, 3, e2028086. [Google Scholar] [CrossRef]
- Zhou, L.-Q.; Wu, X.-L.; Huang, S.-Y.; Wu, G.-G.; Ye, H.-R.; Wei, Q.; Bao, L.-Y.; Deng, Y.-B.; Li, X.-R.; Cui, X.-W.; et al. Lymph Node Metastasis Prediction from Primary Breast Cancer US Images Using Deep Learning. Radiology 2020, 294, 19–28. [Google Scholar] [CrossRef]
- Zheng, X.; Yao, Z.; Huang, Y.; Yu, Y.; Wang, Y.; Liu, Y.; Mao, R.; Li, F.; Xiao, Y.; Wang, Y.; et al. Deep learning radiomics can predict axillary lymph node status in early-stage breast cancer. Nat. Commun. 2020, 11, 1236. [Google Scholar] [CrossRef]
- Zong, Q.; Deng, J.; Ge, W.; Chen, J.; Xu, D. Establishment of Simple Nomograms for Predicting Axillary Lymph Node Involvement in Early Breast Cancer. Cancer Manag. Res. 2020, 12, 2025–2035. [Google Scholar] [CrossRef]
- Lee, Y.-W.; Huang, C.-S.; Shih, C.-C.; Chang, R.-F. Axillary lymph node metastasis status prediction of early-stage breast cancer using convolutional neural networks. Comput. Biol. Med. 2020, 130, 104206. [Google Scholar] [CrossRef]
- Moorman, A.M.; Rutgers, E.J.T.; Kouwenhoven, E.A. Omitting SLNB in Breast Cancer: Is a Nomogram the Answer? Ann. Surg. Oncol. 2021. [Google Scholar] [CrossRef]
- Chen, W.; Wang, C.; Fu, F.; Yang, B.; Chen, C.; Sun, Y. A Model to Predict the Risk of Lymph Node Metastasis in Breast Cancer Based on Clinicopathological Characteristics. Cancer Manag. Res. 2020, 12, 10439–10447. [Google Scholar] [CrossRef] [PubMed]
- Dihge, L.; Ohlsson, M.; Edén, P.; Bendahl, P.-O.; Rydén, L. Artificial neural network models to predict nodal status in clinically node-negative breast cancer. BMC Cancer 2019, 19, 610. [Google Scholar] [CrossRef] [PubMed]


| Characteristics | Training Set (n = 203) | p | Validation Set (n = 87) | p | ||
|---|---|---|---|---|---|---|
| pN0 (n = 94) | pN1 (n = 109) | pN0 (n = 49) | pN1 (n = 38) | |||
| Age (y) | 53.04 ± 9.02 # | 49.29 ± 11.21 # | 0.01 | 49.31 ± 10.56 # | 48.89 ± 11.55 # | 0.86 |
| Weight (Kg) | 60.07 ± 9.28 # | 57.21 ± 7.40 # | 0.02 | 61.64 ± 7.01 # | 59.29 ± 8.59 # | 0.16 |
| Tumor Side | 0.30 | 0.37 | ||||
| Left breast | 44 (46.81) | 59 (54.13) | 21 (42.86) | 20 (52.63) | ||
| Right breast | 50 (53.19) | 50 (45.87) | 28 (57.14) | 18 (47.37) | ||
| Tumor Location | 0.11 | 0.80 | ||||
| Central | 21 (22.34) | 18 (16.52) | 3 (6.12) | 4 (10.53) | ||
| Medial | 24 (25.54) | 22 (20.18) | 17 (34.70) | 8 (21.05) | ||
| Lateral | 48 (51.06) | 66 (60.55) | 26 (53.06) | 24 (63.16) | ||
| Diffuse | 1 (1.06) | 3 (2.75) | 3 (6.12) | 2 (5.26) | ||
| LD (mm) | 23.40 ± 11.05 # | 32.92 ± 17.09 # | <0.01 | 20.81 ± 10.60 # | 29.41 ± 14.32 # | <0.01 |
| SD (mm) | 14.52 ± 6.20 # | 18.47 ± 8.87 # | <0.01 | 15.38 ± 7.21 # | 22.88 ± 12.16 # | <0.01 |
| ER | 80.00 (0.00, 90.00) * | 80.00 (0.00, 80.00) * | 0.23 | 80.00 (0.00, 80.00) * | 80.00 (0.00, 90.00) * | 0.72 |
| PR | 60.00 (0.00, 80.00) * | 10.00 (0.00, 80.00) * | 0.01 | 60.00 (0.00, 80.00) * | 22.50 (0.00, 80.00) * | 0.51 |
| HER-2 | 0.87 | 0.01 | ||||
| Negative | 64 (68.09) | 73 (66.97) | 41 (83.67) | 22 (57.89) | ||
| Positive | 30 (31.91) | 36 (33.03) | 8 (16.33) | 16 (42.11) | ||
| Ki-67 | 20.00 (10.00, 40.00) * | 30.00 (25.00, 50.00) * | <0.01 | 30.00 (12.50, 62.50) * | 30.00 (20.00, 50.00) * | 0.66 |
| Lymph-PET | <0.01 | <0.01 | ||||
| Negative | 55 (58.51) | 11 (10.09) | 41 (83.67) | 5 (13.16) | ||
| Positive | 39 (41.49) | 98 (89.91) | 8 (16.33) | 33 (86.84) | ||
| US | <0.01 | <0.01 | ||||
| Negative | 61 (64.89) | 12 (11.01) | 35 (71.43) | 7 (18.42) | ||
| Positive | 33 (35.11) | 97 (88.99) | 14 (28.57) | 31 (81.58) | ||
| PE | <0.01 | <0.01 | ||||
| Negative | 81 (86.17) | 35 (32.11) | 43 (87.76) | 18 (47.37) | ||
| Positive | 13 (13.83) | 74 (67.89) | 6 (12.24) | 20 (52.63) | ||
| pN0 (n = 94) | pN1 (n = 109) | p | |
|---|---|---|---|
| Clinicopathologic Model | −1.66 (−2.28, 0.07) | 1.68 (0.41, 2.42) | <0.01 |
| Radiomics Model | −4.54 (−8.48, −2.72) | −3.39 (−5.37, −1.59) | <0.01 |
| Combined Model | −2.19 (−3.42, −0.68) | 2.64 (1.13, 3.77) | <0.01 |
| Training Set | AUC (95% CI) | SEN (%) | SPE (%) | ACC (%) | PPV (%) | NPV (%) |
|---|---|---|---|---|---|---|
| Lymph-PET | 0.74 (0.68–0.80) | 89.91 | 58.51 | 75.37 | 71.53 | 83.33 |
| US | 0.77 (0.71–0.83) | 88.99 | 64.89 | 77.83 | 74.62 | 83.56 |
| PE | 0.77 (0.71–0.83) | 67.89 | 86.17 | 76.35 | 85.06 | 69.83 |
| Clinicopathologic Model | 0.88 (0.83–0.92) | 82.57 | 77.66 | 80.30 | 81.08 | 79.35 |
| Radiomics Model | 0.81 (0.75–0.87) | 79.82 | 69.14 | 74.88 | 75.00 | 74.71 |
| Combined Model | 0.94 (0.91–0.97) | 86.24 | 89.36 | 87.68 | 90.38 | 84.85 |
| Validation Set | AUC (95% CI) | SEN (%) | SPE (%) | ACC (%) | PPV (%) | NPV (%) |
| Lymph-PET | 0.85 (0.78–0.93) | 86.84 | 83.67 | 85.06 | 80.49 | 89.13 |
| US | 0.77 (0.68–0.85) | 81.58 | 71.43 | 75.86 | 68.89 | 83.33 |
| PE | 0.70 (0.61–0.79) | 52.63 | 87.76 | 72.41 | 76.92 | 70.49 |
| Clinicopathologic Model | 0.84 (0.75–0.93) | 73.68 | 89.80 | 82.76 | 84.85 | 81.48 |
| Radiomics Model | 0.65 (0.53–0.76) | 84.21 | 40.82 | 59.78 | 52.46 | 76.92 |
| Combined Model | 0.93 (0.88–0.99) | 92.11 | 83.67 | 87.36 | 81.40 | 93.18 |
| cN0 (n = 107) | cN1 (n = 183) | |||
|---|---|---|---|---|
| pN0 (n = 90) | pN1 (n = 17) | pN0 (n = 53) | pN1 (n = 130) | |
| AUC (95% CI) | 0.83 (0.73–0.93) | 0.90 (0.85–0.94) | ||
| SEN (%) | 88.24 | 78.46 | ||
| SPE (%) | 68.89 | 84.91 | ||
| ACC (%) | 71.96 | 80.33 | ||
| PPV (%) | 34.88 | 92.73 | ||
| NPV (%) | 96.88 | 61.64 | ||
Publisher’s Note: MDPI stays neutral with regard to jurisdictional claims in published maps and institutional affiliations. |
© 2022 by the authors. Licensee MDPI, Basel, Switzerland. This article is an open access article distributed under the terms and conditions of the Creative Commons Attribution (CC BY) license (https://creativecommons.org/licenses/by/4.0/).
Share and Cite
Cheng, J.; Ren, C.; Liu, G.; Shui, R.; Zhang, Y.; Li, J.; Shao, Z. Development of High-Resolution Dedicated PET-Based Radiomics Machine Learning Model to Predict Axillary Lymph Node Status in Early-Stage Breast Cancer. Cancers 2022, 14, 950. https://doi.org/10.3390/cancers14040950
Cheng J, Ren C, Liu G, Shui R, Zhang Y, Li J, Shao Z. Development of High-Resolution Dedicated PET-Based Radiomics Machine Learning Model to Predict Axillary Lymph Node Status in Early-Stage Breast Cancer. Cancers. 2022; 14(4):950. https://doi.org/10.3390/cancers14040950
Chicago/Turabian StyleCheng, Jingyi, Caiyue Ren, Guangyu Liu, Ruohong Shui, Yingjian Zhang, Junjie Li, and Zhimin Shao. 2022. "Development of High-Resolution Dedicated PET-Based Radiomics Machine Learning Model to Predict Axillary Lymph Node Status in Early-Stage Breast Cancer" Cancers 14, no. 4: 950. https://doi.org/10.3390/cancers14040950
APA StyleCheng, J., Ren, C., Liu, G., Shui, R., Zhang, Y., Li, J., & Shao, Z. (2022). Development of High-Resolution Dedicated PET-Based Radiomics Machine Learning Model to Predict Axillary Lymph Node Status in Early-Stage Breast Cancer. Cancers, 14(4), 950. https://doi.org/10.3390/cancers14040950