
Patient-Reported Quality of Life Outcomes after Moderately Hypofractionated and Normofractionated Proton Therapy for Localized Prostate Cancer

 , , , ,
Abstract
:Simple Summary
Abstract
1. Introduction
2. Materials and Methods
2.1. Study Design
2.2. Treatment Protocols
2.3. Proton Therapy
2.4. Measurement of Patient-Reported QOL
2.5. Statistical Analysis
3. Results
3.1. Baseline Patient Characteristics and QOL Scores, and Data Collection
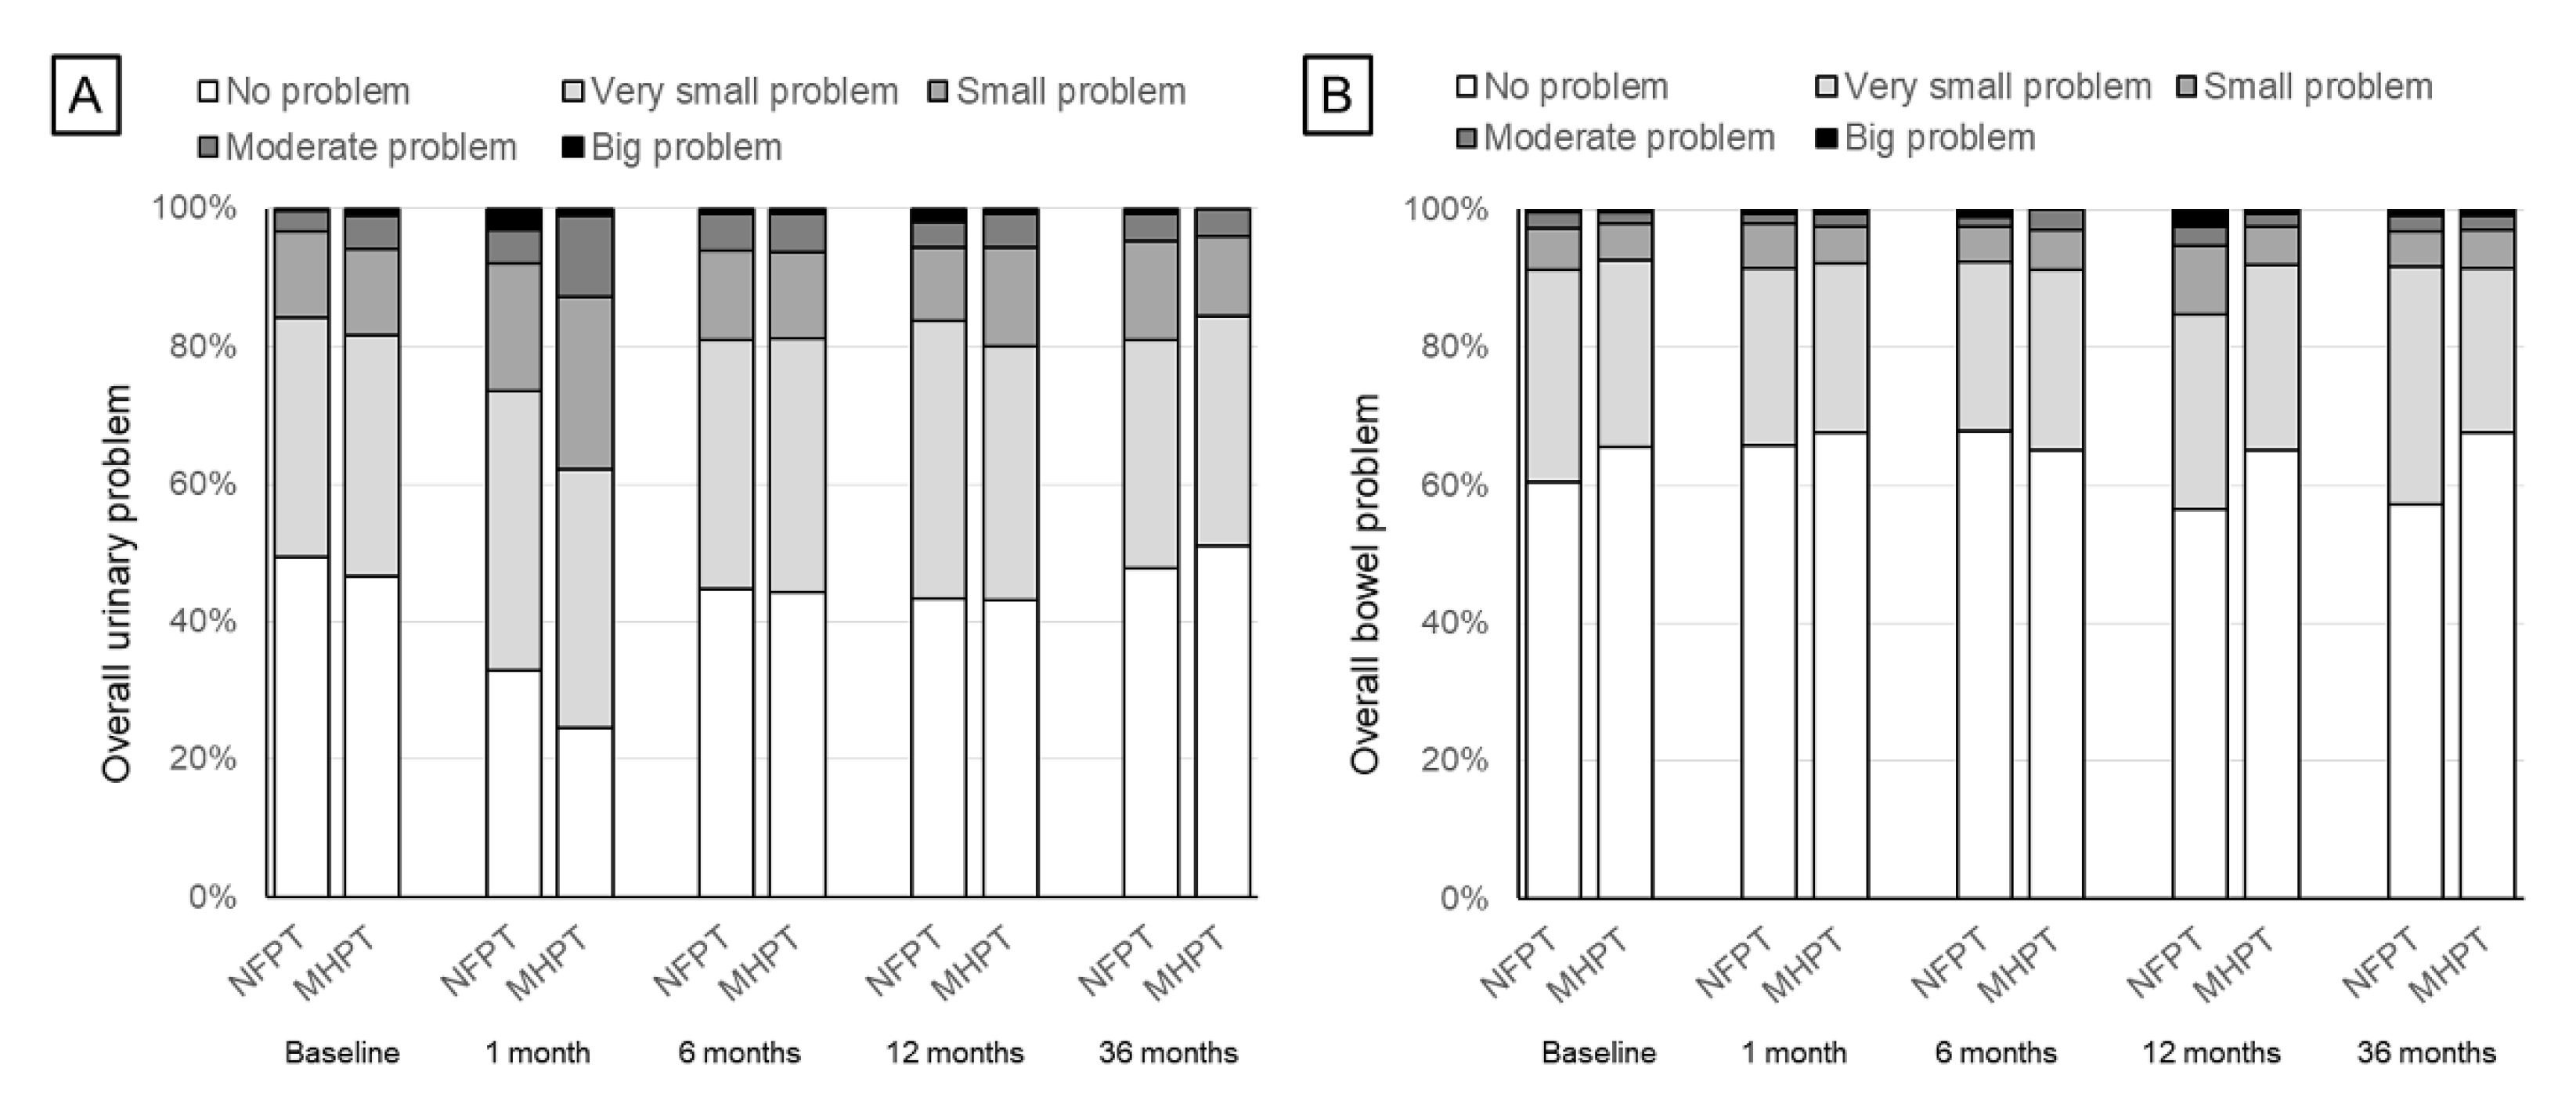
3.2. Urinary Domain
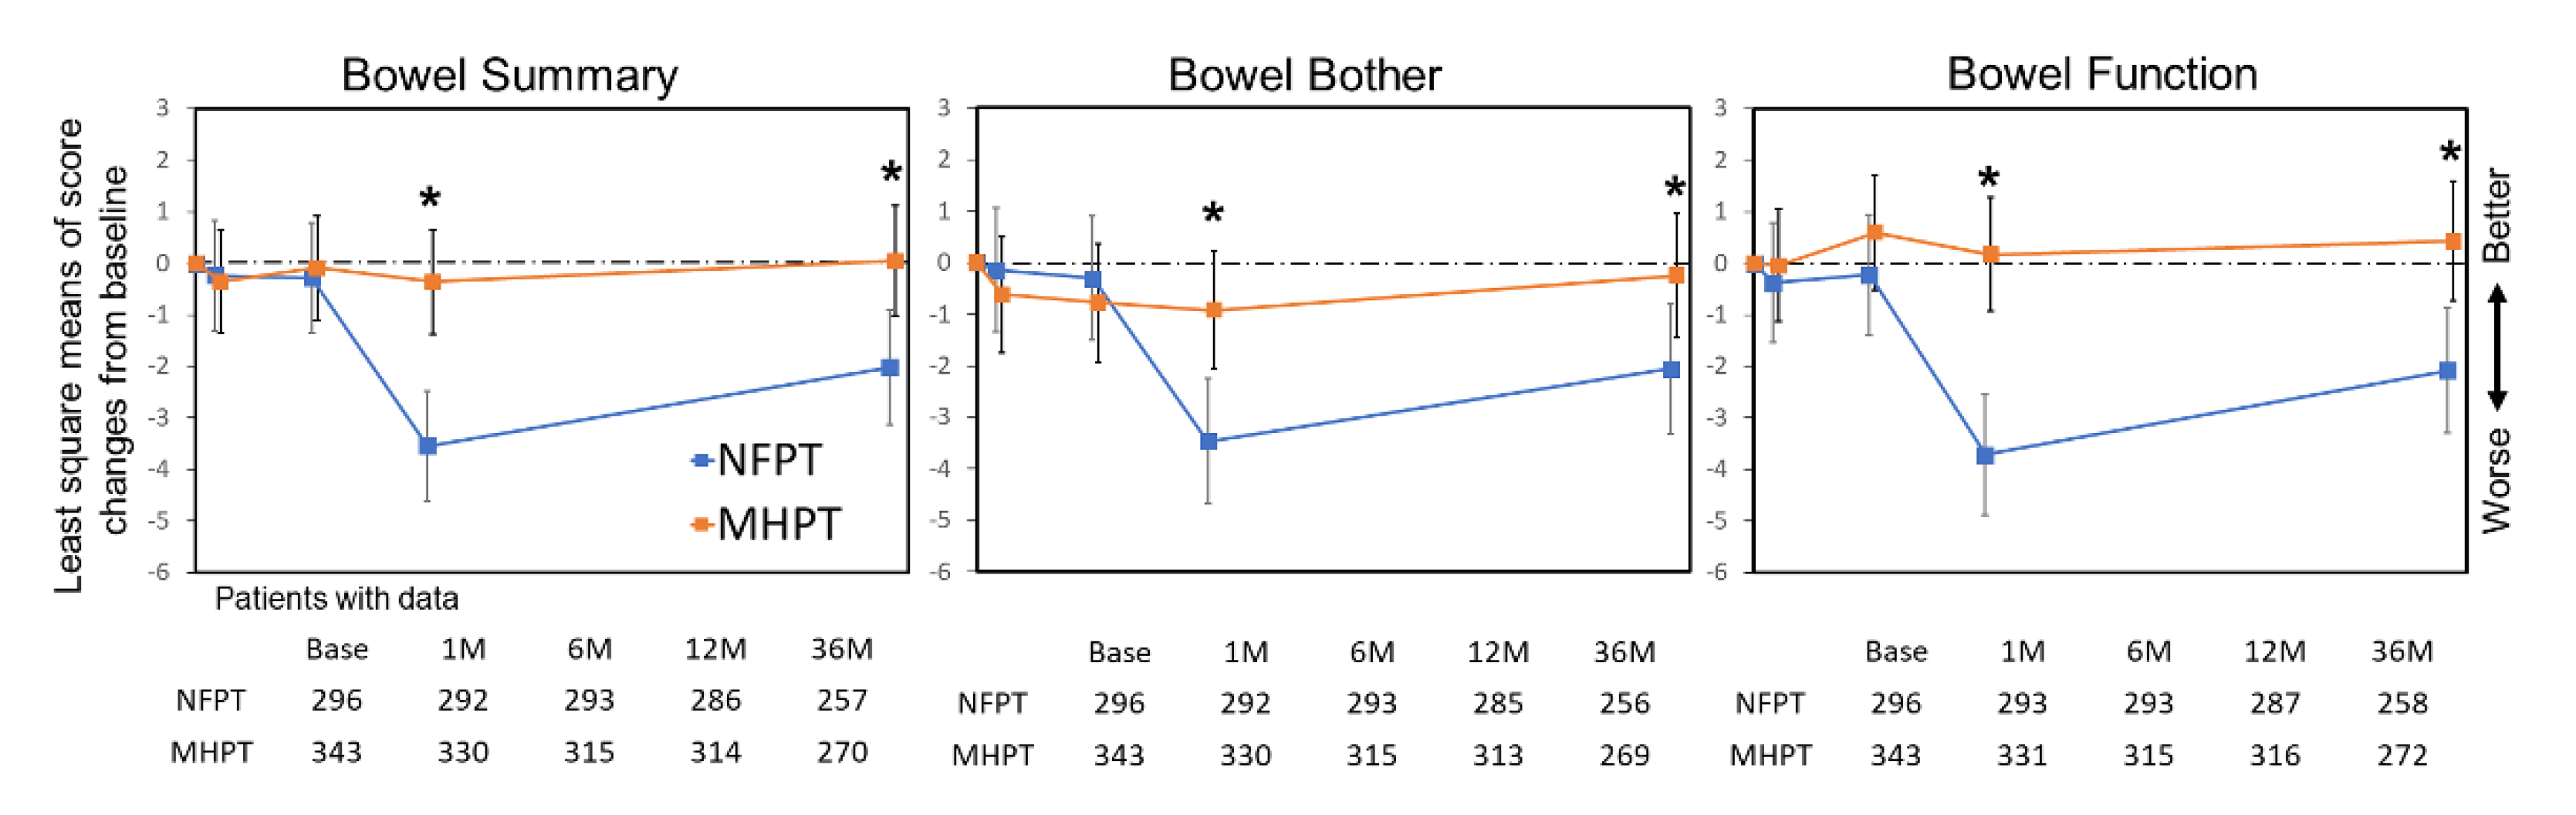
3.3. Bowel Domain
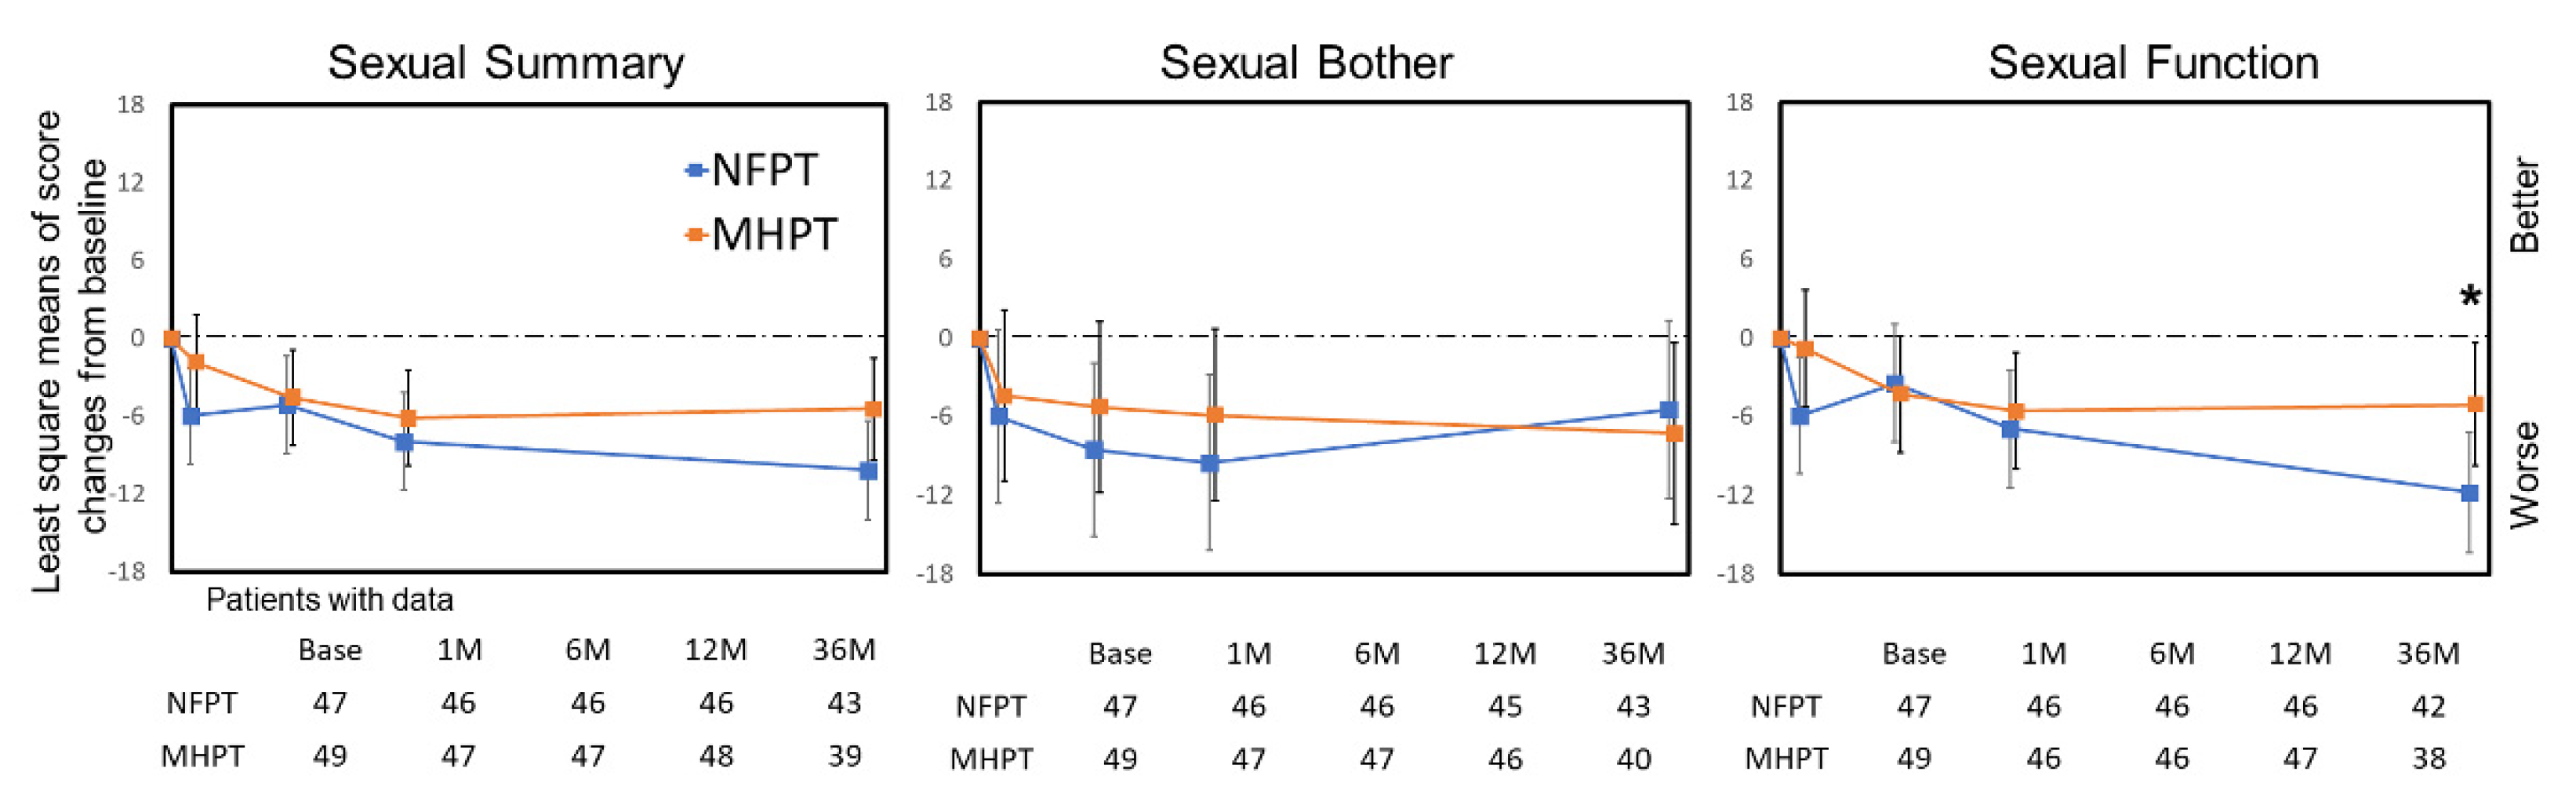
3.4. Sexual Domain
4. Discussion
5. Conclusions
Supplementary Materials
Author Contributions
Funding
Institutional Review Board Statement
Informed Consent Statement
Data Availability Statement
Acknowledgments
Conflicts of Interest
References
- National Comprehensive Cancer Network. NCCN Clinical Practice Guidelines in Oncology for Prostate Cancer. Available online: https://www.nccn.org (accessed on 14 December 2021).
- Donovan, J.L.; Hamdy, F.C.; Lane, J.A.; Mason, M.; Metcalfe, C.; Walsh, E.; Blazeby, J.; Peters, T.; Holding, P.; Bonnington, S.; et al. Patient-Reported Outcomes after Monitoring, Surgery, or Radiotherapy for Prostate Cancer. N. Engl. J. Med. 2016, 375, 1425–1437. [Google Scholar] [CrossRef] [PubMed] [Green Version]
- Chen, R.C.; Basak, R.; Meyer, A.-M.; Kuo, T.-M.; Carpenter, W.R.; Agans, R.P.; Broughman, J.R.; Reeve, B.B.; Nielsen, M.E.; Usinger, D.S.; et al. Association Between Choice of Radical Prostatectomy, External Beam Radiotherapy, Brachytherapy, or Active Surveillance and Patient-Reported Quality of Life Among Men With Localized Prostate Cancer. JAMA 2017, 317, 1141–1150. [Google Scholar] [CrossRef] [PubMed] [Green Version]
- Zaorsky, N.G.; Shaikh, T.; Murphy, C.T.; Hallman, M.A.; Hayes, S.B.; Sobczak, M.L.; Horwitz, E.M. Comparison of outcomes and toxicities among radiation therapy treatment options for prostate cancer. Cancer Treat. Rev. 2016, 48, 50–60. [Google Scholar] [CrossRef] [PubMed]
- Iwata, H.; Ishikawa, H.; Takagi, M.; Okimoto, T.; Murayama, S.; Akimoto, T.; Wada, H.; Arimura, T.; Sato, Y.; Araya, M.; et al. Long-term outcomes of proton therapy for prostate cancer in Japan: A multi-institutional survey of the Japanese Radiation Oncology Study Group. Cancer Med. 2018, 7, 677–689. [Google Scholar] [CrossRef] [PubMed] [Green Version]
- Ishikawa, H.; Tsuji, H.; Murayama, S.; Sugimoto, M.; Shinohara, N.; Maruyama, S.; Murakami, M.; Shirato, H.; Sakurai, H. Particle therapy for prostate cancer: The past, present and future. Int. J. Urol. 2019, 26, 971–979. [Google Scholar] [CrossRef] [PubMed]
- Morgan, S.C.; Hoffman, K.; Loblaw, D.A.; Buyyounouski, M.K.; Patton, C.; Barocas, D.; Bentzen, S.; Chang, M.; Efstathiou, J.; Greany, P.; et al. Hypofractionated radiation therapy for localized prostate cancer: An ASTRO, ASCO, and AUA evidence-based guideline. J. Clin. Oncol. 2018, 36, 3411–3430. [Google Scholar] [CrossRef] [PubMed]
- Brenner, D.J.; Martinez, A.A.; Edmundson, G.K.; Mitchell, C.; Thames, H.D.; Armour, E.P. Direct evidence that prostate tumors show high sensitivity to fractionation (low alpha/beta ratio), similar to late-responding normal tissue. Int. J. Radiat. Oncol. Biol. Phys. 2002, 52, 6–13. [Google Scholar] [CrossRef]
- Fowler, J.; Chappell, R.; Ritter, M. Is alpha/beta for prostate tumors really low? Int. J. Radiat. Oncol. Biol. Phys. 2001, 50, 1021–1031. [Google Scholar] [CrossRef]
- Lee, W.R.; Dignam, J.J.; Amin, M.B.; Bruner, D.W.; Low, D.; Swanson, G.P.; Shah, A.B.; D’Souza, D.P.; Michalski, J.M.; Dayes, I.S.; et al. Randomized phase III non-inferiority study comparing two radiotherapy fractionation schedules in patients with low-risk prostate cancer. J. Clin. Oncol. 2016, 34, 2325–2332. [Google Scholar] [CrossRef]
- Dearnaley, D.; Syndikus, I.; Mossop, H.; Khoo, V.; Birtle, A.; Bloomfield, D.; Graham, J.; Kirkbride, P.; Logue, J.; Malik, Z.; et al. Conventional versus hypofractionated high-dose intensity-modulated radiotherapy for prostate cancer: 5-year outcomes of the randomised, non-inferiority, phase 3 CHHiP trial. Lancet Oncol. 2016, 17, 1047–1060. [Google Scholar] [CrossRef] [Green Version]
- Aluwini, S.; Pos, F.; Schimmel, E.; Krol, S.; van der Toorn, P.P.; de Jager, H.; Alemayehu, W.G.; Heemsbergen, W.; Heijmen, B.; Incrocci, L. Hypofractionated versus conventionally fractionated radiotherapy for patients with prostate cancer (HYPRO): Late toxicity results from a randomised, non-inferiority, phase 3 trial. Lancet Oncol. 2016, 17, 464–474. [Google Scholar] [CrossRef]
- Bruner, D.W.; Pugh, S.L.; Lee, W.R.; Hall, W.A.; Dignam, J.J.; Low, D.; Swanson, G.P.; Shah, A.B.; Malone, S.; Michalski, J.M.; et al. Quality of life in patients with low-risk prostate cancer treated with hypofractionated vs conventional radiotherapy: A phase 3 randomized clinical trial. JAMA Oncol. 2019, 5, 664–670. [Google Scholar] [CrossRef] [Green Version]
- Wilkins, A.; Mossop, H.; Syndikus, I.; Khoo, V.; Bloomfield, D.; Parker, C.; Logue, J.; Scrase, C.; Patterson, H.; Birtle, A.; et al. Hypofractionated radiotherapy versus conventionally fractionated radiotherapy for patients with intermediate-risk localised prostate cancer: 2-year patient-reported outcomes of the randomised, non-inferiority, phase 3 CHHiP trial. Lancet Oncol. 2015, 16, 1605–1616. [Google Scholar] [CrossRef] [Green Version]
- Wortel, R.C.; De Hoop, E.O.-; Heemsbergen, W.D.; Pos, F.J.; Incrocci, L. Moderate Hypofractionation in Intermediate- and High-Risk, Localized Prostate Cancer: Health-Related Quality of Life from the Randomized, Phase 3 HYPRO Trial. Int. J. Radiat. Oncol. Biol. Phys. 2019, 103, 823–833. [Google Scholar] [CrossRef]
- Grewal, A.S.; Schonewolf, C.; Min, E.J.; Chao, H.-H.; Both, S.; Lam, S.; Mazzoni, S.; Bekelman, J.; Christodouleas, J.; Vapiwala, N. Four-Year Outcomes From a Prospective Phase II Clinical Trial of Moderately Hypofractionated Proton Therapy for Localized Prostate Cancer. Int. J. Radiat. Oncol. Biol. Phys. 2019, 105, 713–722. [Google Scholar] [CrossRef]
- Henderson, R.H.; Bryant, C.; Hoppe, B.S.; Nichols, R.C.; Mendenhall, W.M.; Flampouri, S.; Su, Z.; Li, Z.; Morris, C.G.; Mendenhall, N.P. Five-year outcomes from a prospective trial of image-guided accelerated hypofractionated proton therapy for prostate cancer. Acta Oncol. 2017, 56, 963–970. [Google Scholar] [CrossRef] [Green Version]
- Slater, J.; Slater, J.D.; Kang, J.I.; Namihas, I.C.; Jabola, B.R.; Brown, K.; Grove, R.; Watt, C.; Bush, D.A. Hypofractionated Proton Therapy in Early Prostate Cancer: Results of a Phase I/II Trial at Loma Linda University. Int. J. Part. Ther. 2019, 6, 1–9. [Google Scholar] [CrossRef] [PubMed] [Green Version]
- Iwata, H.; Ogino, H.; Hashimoto, S.; Yamada, M.; Shibata, H.; Yasui, K.; Toshito, T.; Omachi, C.; Tatekawa, K.; Manabe, Y.; et al. Spot Scanning and Passive Scattering Proton Therapy: Relative Biological Effectiveness and Oxygen Enhancement Ratio in Cultured Cells. Int. J. Radiat. Oncol. Biol. Phys. 2016, 95, 95–102. [Google Scholar] [CrossRef]
- Nakajima, K.; Iwata, H.; Ogino, H.; Hattori, Y.; Hashimoto, S.; Nakanishi, M.; Toshito, T.; Umemoto, Y.; Iwatsuki, S.; Shibamoto, Y.; et al. Acute toxicity of image-guided hypofractionated proton therapy for localized prostate cancer. Int. J. Clin. Oncol. 2017, 23, 353–360. [Google Scholar] [CrossRef] [PubMed]
- Toshito, T.; Omachi, C.; Kibe, Y.; Sugai, H.; Hayashi, K.; Shibata, H.; Yasui, K.; Tanaka, K.; Yamamoto, T.; Yoshida, A.; et al. A proton therapy system in Nagoya Proton Therapy Center. Australas. Phys. Eng. Sci. Med. 2016, 39, 645–654. [Google Scholar] [CrossRef] [PubMed]
- Pugh, T.J.; Munsell, M.F.; Choi, S.; Nguyen, Q.N.; Mathai, B.; Zhu, X.R.; Sahoo, N.; Gillin, M.; Johnson, J.L.; Amos, R.A.; et al. Quality of Life and Toxicity From Passively Scattered and Spot-Scanning Proton Beam Therapy for Localized Prostate Cancer. Int. J. Radiat. Oncol. Biol. Phys. 2013, 87, 946–953. [Google Scholar] [CrossRef] [Green Version]
- Park, P.C.; Zhu, X.R.; Lee, A.K.; Sahoo, N.; Melancon, A.D.; Zhang, L.; Dong, L. A Beam-Specific Planning Target Volume (PTV) Design for Proton Therapy to Account for Setup and Range Uncertainties. Int. J. Radiat. Oncol. Biol. Phys. 2012, 82, e329–e336. [Google Scholar] [CrossRef] [PubMed] [Green Version]
- Zhu, X.R.; Poenisch, F.; Song, X.; Johnson, J.L.; Ciangaru, G.; Taylor, M.B.; Lii, M.; Martin, C.; Arjomandy, B.; Lee, A.K.; et al. Patient-Specific Quality Assurance for Prostate Cancer Patients Receiving Spot Scanning Proton Therapy Using Single-Field Uniform Dose. Int. J. Radiat. Oncol. Biol. Phys. 2011, 81, 552–559. [Google Scholar] [CrossRef] [PubMed]
- Wei, J.T.; Dunn, R.L.; Litwin, M.; Sandler, H.M.; Sanda, M.G. Development and validation of the expanded prostate cancer index composite (EPIC) for comprehensive assessment of health-related quality of life in men with prostate cancer. Urology 2000, 56, 899–905. [Google Scholar] [CrossRef] [Green Version]
- Norman, G.R.; Sloan, J.A.; Wyrwich, K.W. Interpretation of changes in health-related quality of life: The remarkable universality of half a standard deviation. Med. Care 2003, 41, 582–592. [Google Scholar] [CrossRef] [PubMed]
- Kanda, Y. Investigation of the freely available easy-to-use software ‘EZR’ for medical statistics. Bone Marrow Transplant. 2013, 48, 452–458. [Google Scholar] [CrossRef] [Green Version]
- Shibamoto, Y.; Otsuka, S.; Iwata, H.; Sugie, C.; Ogino, H.; Tomita, N. Radiobiological evaluation of the radiation dose as used in high-precision radiotherapy: Effect of prolonged delivery time and applicability of the linear-quadratic model. J. Radiat. Res. 2012, 53, 1–9. [Google Scholar] [CrossRef] [Green Version]
- Marzi, S.; Saracino, B.; Petrongari, M.G.; Arcangeli, S.; Gomellini, S.; Arcangeli, G.; Benassi, M.; Landoni, V. Modeling of alpha/beta for late rectal toxicity from a randomized phase II study: Conventional versus hypofractionated scheme for localized prostate cancer. J. Exp. Clin. Cancer Res. 2009, 28, 117. [Google Scholar] [CrossRef] [Green Version]
- Brenner, D.J. Fractionation and late rectal toxicity. Int. J. Radiat. Oncol. Biol. Phys. 2004, 60, 1013–1015. [Google Scholar] [CrossRef] [PubMed]
- Catton, C.N.; Lukka, H.; Gu, C.S.; Martin, J.M.; Supiot, S.; Chung, P.W.M.; Bauman, G.S.; Bahary, J.P.; Ahmed, S.; Cheung, P.; et al. Randomized trial of a hypofractionated radiation regimen for the treatment of localized prostate cancer. J. Clin. Oncol. 2017, 35, 1884–1890. [Google Scholar] [CrossRef]
- Trofimov, A.; Nguyen, P.L.; Coen, J.J.; Doppke, K.P.; Schneider, R.J.; Adams, J.A.; Bortfeld, T.R.; Zietman, A.L.; Delaney, T.F.; Shipley, W.U. Radiotherapy treatment of early-stage prostate cancer with IMRT and protons: A treatment planning comparison. Int. J. Radiat. Oncol. Biol. Phys. 2007, 69, 444–453. [Google Scholar] [CrossRef] [PubMed] [Green Version]
- Gray, P.J.; Paly, J.J.; Yeap, B.Y.; Sanda, M.G.; Sandler, H.M.; Michalski, J.M.; Talcott, J.A.; Coen, J.J.; Hamstra, D.A.; Shipley, W.U.; et al. Patient-reported outcomes after 3-dimensional conformal, intensity-modulated, or proton beam radiotherapy for localized prostate cancer. Cancer 2013, 119, 1729–1735. [Google Scholar] [CrossRef] [PubMed] [Green Version]


| Characteristics | NFPT (n = 296) | MHPT (n = 343) | p Value |
|---|---|---|---|
| Age, median years (range) | 69 (51–90) | 69 (46–86) | 0.16 |
| T stage (%) | 0.64 | ||
| T1/T2/T3 | 72 (24)/178 (60)/46 (16) | 73 (21)/217 (63)/53 (16) | |
| Gleason score (%) | 0.15 | ||
| 6/7/8–10/Unknown | 80 (27)/116 (39)/100 (34)/0 (0) | 80 (23)/160 (47)/101 (29)/2 (1) | |
| Initial PSA, ng/mL | 0.016 | ||
| Median (IQR) | 9.0 (6.1–14.8) | 7.6 (5.6–12.3) | |
| Mean (SD) | 14.3 (17.1) | 13.6 (20.7) | |
| NCCN risk group (%) | 0.19 | ||
| Low/Intermediate/High | 50 (17)/117 (40)/129 (43) | 51 (15)/160 (47)/132 (38) | |
| Prostate volume, cc | 0.23 | ||
| Median (IQR) | 28.6 (23.4–37.1) | 26.6 (22.1–35.8) | |
| Mean (SD) | 32.1 (12.7) | 30.9 (14.1) | |
| CTV, cc | 0.25 | ||
| Median (IQR) | 31.5 (25.6–40.3) | 29.3 (24.7–38.6) | |
| Mean (SD) | 34.6 (12.7) | 33.4 (13.9) | |
| Hypertension (%) | 0.18 | ||
| Yes | 69 (23) | 97 (28) | |
| Diabetes (%) | 0.55 | ||
| Yes | 34 (11) | 45 (13) | |
| ADT (%) | 0.16 | ||
| None/N/N-A | 47 (16)/121 (41)/128 (43) | 49 (14)/166 (48)/128 (37) | |
| PT technique (%) | <0.001 | ||
| Passive scattering/Spot scanning | 264 (89)/32 (11) | 342 (99.7)/1 (0.3) |
| EPIC Domain | NFPT (n = 296) | MHPT (n = 343) | p Value | ||
|---|---|---|---|---|---|
| Mean Score (Range) | SD | Mean Score (Range) | SD | ||
| Urinary | |||||
| Summary | 92.2 (51.4–100) | 8.7 | 91.8 (41.0–100) | 9.5 | 0.51 |
| Bother | 89.4 (42.9–100) | 11.8 | 88.6 (32.1–100) | 12.5 | 0.43 |
| Function | 96.4 (53.4–100) | 7.4 | 96.2 (41.8–100) | 8.3 | 0.77 |
| Incontinence | 95.2 (48.0–100) | 10.2 | 94.9 (22.8–100) | 11.6 | 0.63 |
| Iritative/obstructive | 92.0 (53.6–100) | 9.3 | 91.7 (39.2–100) | 9.9 | 0.72 |
| Bowel | |||||
| Summary | 93.5 (42.9–100) | 8.4 | 93.7 (53.6–100) | 7.2 | 0.69 |
| Bother | 94.9 (32.1–100) | 9.3 | 95.5 (42.9–100) | 7.8 | 0.35 |
| Function | 92.1 (46.4–100) | 8.9 | 92.0 (50.0–100) | 8.7 | 0.83 |
| Sexual Summary | |||||
| All patients | 33.7 (0–75.0) | 10.8 | 34.1 (2.5–85.4) | 10.7 | 0.68 |
| ADT (-) | 46.8 (15.4–75.0) | 14.3 | 46.7 (21.2–85.4) | 16.3 | 0.98 |
| Sexual Bother | |||||
| All patients | 90.6 (0–100) | 19.8 | 91.2 (0–100) | 18.7 | 0.68 |
| ADT (-) | 86.4 (25–100) | 18.7 | 88.5 (31.3–100) | 17.7 | 0.58 |
| Sexual Function | |||||
| All patients | 8.3 (0–62.5) | 14.9 | 8.6 (0–78.1) | 14.9 | 0.79 |
| ADT (-) | 28.8 (0–62.5) | 18.7 | 28.4 (0–78.1) | 22.4 | 0.93 |
| MSC and MCID at 1–36 Months | 1 Month | 6 Months | |||||||||||||
|---|---|---|---|---|---|---|---|---|---|---|---|---|---|---|---|
| NFPT | MHPT | NFPT | MHPT | ||||||||||||
| EPIC Domain | 1/2 SD a | n | MSC b | MCID (%) | n | MSC b | MCID (%) | p Value c | n | MSC b | MCID (%) | n | MSC b | MCID (%) | p Value c |
| Urinary | |||||||||||||||
| Summary | 4.6 | 290 | −5.0 | 122 (42) | 327 | −6.2 | 161 (49) | 0.076 | 289 | −1.3 | 74 (26) | 313 | 0 | 65 (21) | 0.18 |
| Bother | 6.1 | 290 | −5.0 | 121 (42) | 327 | −7.3 | 169 (52) | 0.015 | 289 | −1.0 | 80 (28) | 313 | 0 | 79 (25) | 0.52 |
| Function | 4.0 | 290 | −4.8 | 105 (36) | 329 | −4.9 | 140 (43) | 0.12 | 290 | −1.9 | 69 (24) | 314 | −0.1 | 60 (19) | 0.17 |
| Incontinence | 5.5 | 286 | −3.6 | 71 (25) | 327 | −3.9 | 93 (28) | 0.32 | 288 | −0.7 | 51 (18) | 311 | 0.7 | 39 (13) | 0.086 |
| Irritative/obstructive | 4.8 | 290 | −5.3 | 119 (41) | 327 | −6.8 | 150 (46) | 0.26 | 289 | −1.5 | 68 (24) | 313 | −0.4 | 69 (22) | 0.70 |
| Bowel | |||||||||||||||
| Summary | 3.9 | 292 | −0.2 | 71 (24) | 330 | −0.3 | 65 (20) | 0.17 | 293 | −0.3 | 70 (24) | 315 | 0 | 60 (19) | 0.17 |
| Bother | 4.3 | 292 | −0.1 | 58 (20) | 330 | −0.6 | 50 (15) | 0.14 | 293 | −0.4 | 50 (17) | 315 | −0.8 | 60 (19) | 0.60 |
| Function | 4.4 | 293 | −0.3 | 69 (24) | 331 | −0.1 | 73 (22) | 0.70 | 293 | −0.3 | 66 (23) | 315 | 0.7 | 62 (20) | 0.43 |
| Sexual (no ADT) | |||||||||||||||
| Summary | 7.6 | 46 | −5.8 | 12 (26) | 47 | −2.1 | 14 (30) | 0.82 | 46 | −5.6 | 17 (37) | 47 | −4.5 | 17 (36) | 1 |
| Bother | 9.0 | 46 | −6.5 | 13 (28) | 47 | −4.7 | 12 (26) | 0.82 | 46 | −9.1 | 17 (37) | 47 | −5.5 | 14 (30) | 0.51 |
| Function | 10.2 | 46 | −5.4 | 13 (28) | 46 | −1.0 | 13 (28) | 1 | 46 | −3.9 | 14 (30) | 46 | −4.1 | 14 (30) | 1 |
| MSC and MCID at 1–36 Months | 12 Months | 36 Months | |||||||||||||
| NFPT | MHPT | NFPT | MHPT | ||||||||||||
| EPIC Domain | 1/2 SD a | n | MSC b | MCID (%) | n | MSC b | MCID (%) | pValue c | n | MSC b | MCID (%) | n | MSC b | MCID (%) | pValue c |
| Urinary | |||||||||||||||
| Summary | 4.6 | 284 | −1.9 | 74 (26) | 314 | −1.1 | 78 (25) | 0.78 | 259 | −1.6 | 62 (24) | 267 | 0.0 | 56 (21) | 0.47 |
| Bother | 6.1 | 284 | −1.4 | 83 (29) | 315 | −1.1 | 83 (26) | 0.47 | 259 | −0.7 | 73 (28) | 266 | 1.1 | 49 (18) | 0.010 |
| Function | 4.0 | 286 | −2.7 | 76 (27) | 316 | −1.3 | 70 (22) | 0.22 | 260 | −2.6 | 67 (26) | 269 | −1.3 | 56 (21) | 0.18 |
| Incontinence | 5.5 | 284 | −2.2 | 61 (21) | 315 | −0.6 | 57 (18) | 0.31 | 256 | −3.6 | 65 (25) | 260 | −1.5 | 49 (19) | 0.089 |
| Irritative/obstructive | 4.8 | 284 | −1.7 | 71 (25) | 314 | −1.4 | 71 (23) | 0.50 | 259 | −0.4 | 56 (22) | 266 | 0.7 | 47 (18) | 0.27 |
| Bowel | |||||||||||||||
| Summary | 3.9 | 286 | −3.6 | 107 (37) | 314 | −0.3 | 60 (19) | <0.001 | 257 | −2.0 | 74 (29) | 270 | 0.1 | 49 (18) | 0.004 |
| Bother | 4.3 | 285 | −3.6 | 88 (31) | 313 | −0.9 | 52 (17) | <0.001 | 256 | −2.2 | 58 (23) | 269 | −0.2 | 39 (14) | 0.018 |
| Function | 4.4 | 287 | −3.6 | 106 (37) | 316 | 0.3 | 70 (22) | <0.001 | 258 | −1.9 | 82 (32) | 272 | 0.5 | 56 (21) | 0.002 |
| Sexual (no ADT) | |||||||||||||||
| Summary | 7.6 | 46 | −8.0 | 23 (50) | 48 | −6.1 | 19 (40) | 0.41 | 43 | −10.5 | 26 (60) | 39 | −5.9 | 19 (49) | 0.38 |
| Bother | 9.0 | 45 | −9.7 | 16 (36) | 46 | −6.0 | 18 (39) | 0.83 | 43 | −5.5 | 14 (33) | 40 | −7.3 | 17 (43) | 0.37 |
| Function | 10.2 | 46 | −6.9 | 18 (39) | 47 | −5.5 | 11 (23) | 0.12 | 42 | −12.6 | 24 (57) | 38 | −6.0 | 15 (39) | 0.13 |
Publisher’s Note: MDPI stays neutral with regard to jurisdictional claims in published maps and institutional affiliations. |
© 2022 by the authors. Licensee MDPI, Basel, Switzerland. This article is an open access article distributed under the terms and conditions of the Creative Commons Attribution (CC BY) license (https://creativecommons.org/licenses/by/4.0/).
Share and Cite
Nakajima, K.; Iwata, H.; Hattori, Y.; Nomura, K.; Hayashi, K.; Toshito, T.; Umemoto, Y.; Hashimoto, S.; Ogino, H.; Shibamoto, Y. Patient-Reported Quality of Life Outcomes after Moderately Hypofractionated and Normofractionated Proton Therapy for Localized Prostate Cancer. Cancers 2022, 14, 517. https://doi.org/10.3390/cancers14030517
Nakajima K, Iwata H, Hattori Y, Nomura K, Hayashi K, Toshito T, Umemoto Y, Hashimoto S, Ogino H, Shibamoto Y. Patient-Reported Quality of Life Outcomes after Moderately Hypofractionated and Normofractionated Proton Therapy for Localized Prostate Cancer. Cancers. 2022; 14(3):517. https://doi.org/10.3390/cancers14030517
Chicago/Turabian StyleNakajima, Koichiro, Hiromitsu Iwata, Yukiko Hattori, Kento Nomura, Kensuke Hayashi, Toshiyuki Toshito, Yukihiro Umemoto, Shingo Hashimoto, Hiroyuki Ogino, and Yuta Shibamoto. 2022. "Patient-Reported Quality of Life Outcomes after Moderately Hypofractionated and Normofractionated Proton Therapy for Localized Prostate Cancer" Cancers 14, no. 3: 517. https://doi.org/10.3390/cancers14030517
APA StyleNakajima, K., Iwata, H., Hattori, Y., Nomura, K., Hayashi, K., Toshito, T., Umemoto, Y., Hashimoto, S., Ogino, H., & Shibamoto, Y. (2022). Patient-Reported Quality of Life Outcomes after Moderately Hypofractionated and Normofractionated Proton Therapy for Localized Prostate Cancer. Cancers, 14(3), 517. https://doi.org/10.3390/cancers14030517