
Mediating Effects of Diagnostic Route on the Comorbidity Gap in Survival of Patients with Diffuse Large B-Cell or Follicular Lymphoma in England


Abstract
Simple Summary
Abstract
1. Introduction
2. Methods
2.1. Study Design, Participants, Data, and Setting
2.2. Outcome, Exposure, and Other Variables
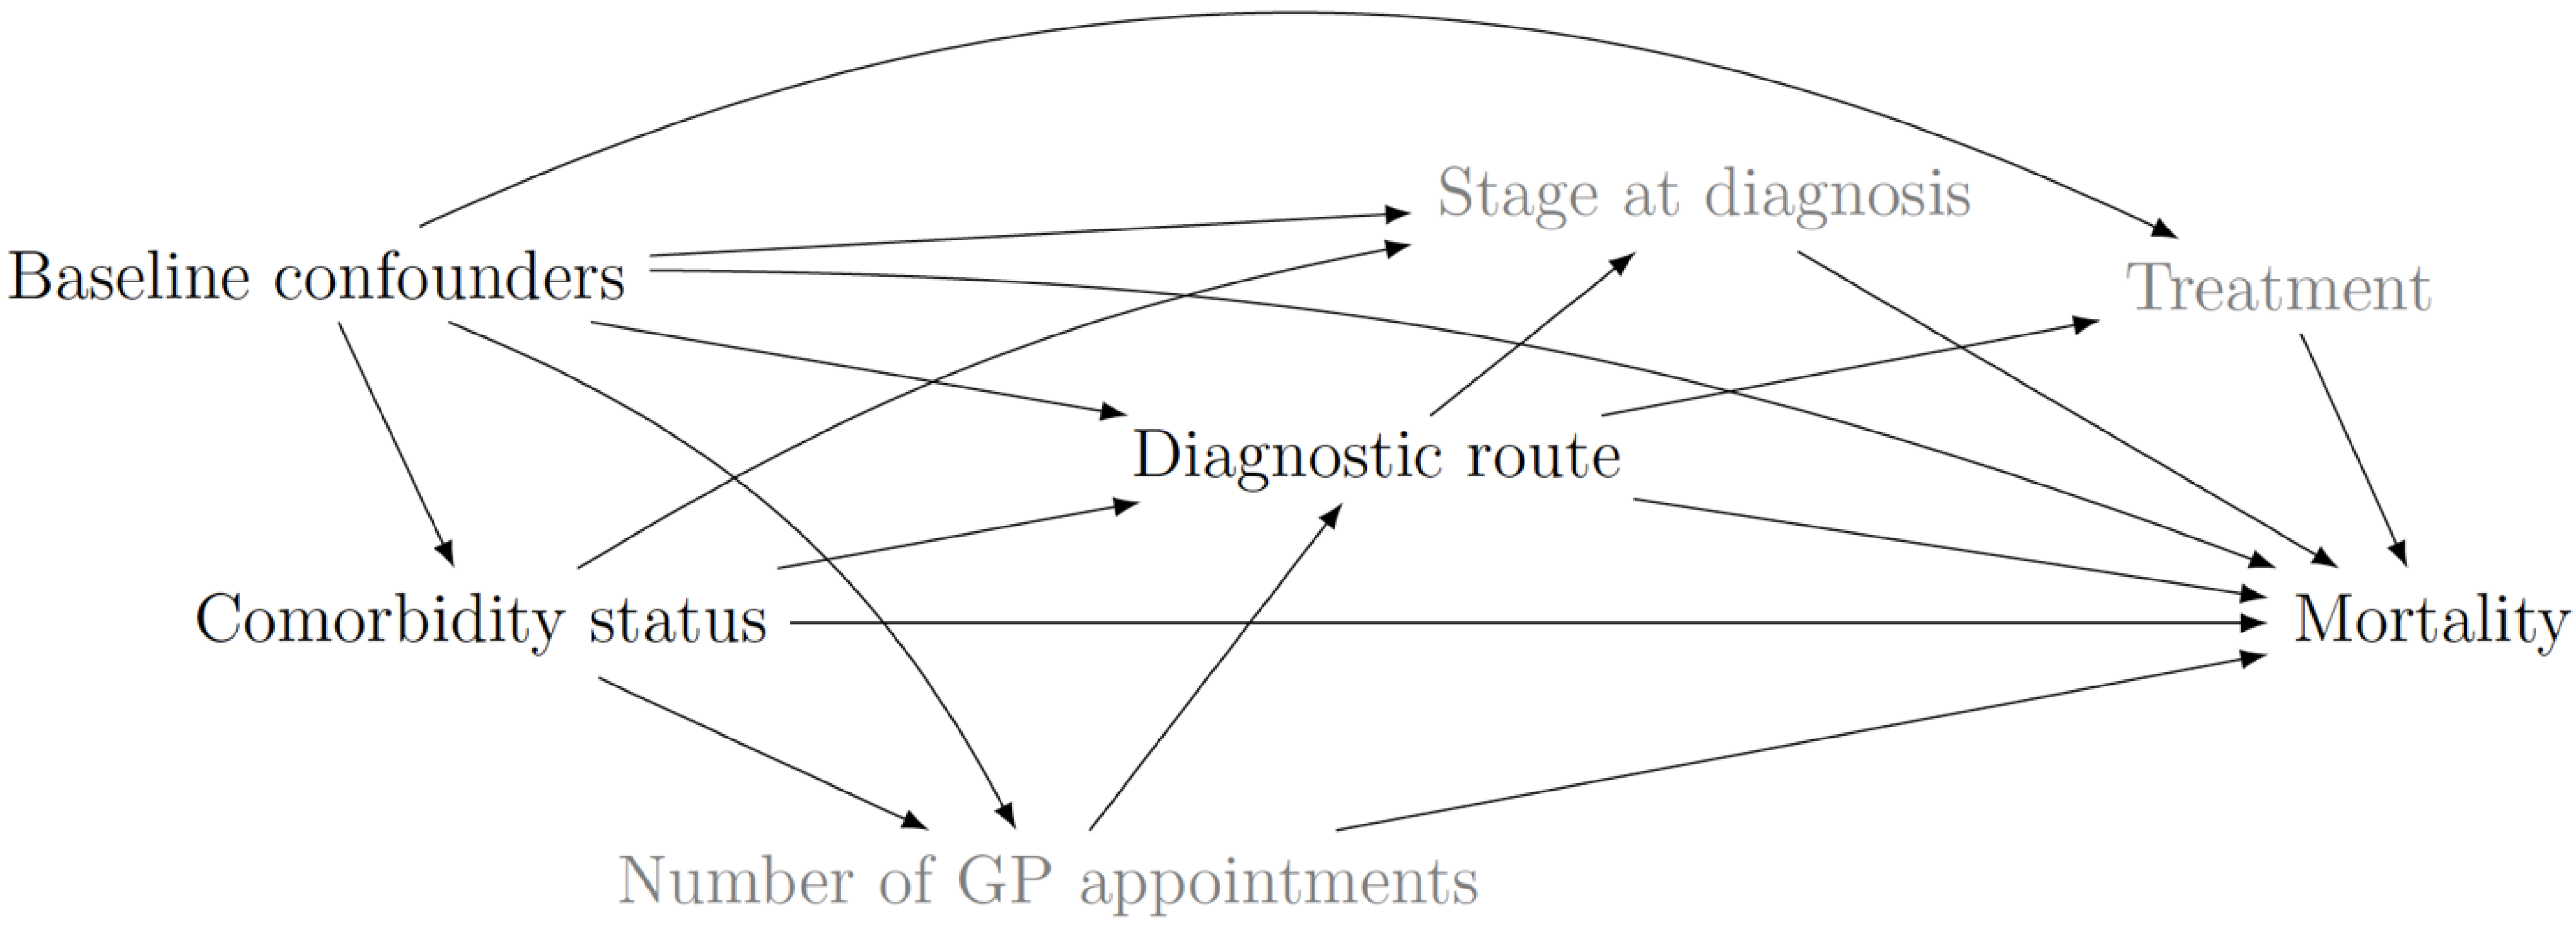
2.3. Causal Diagram
3. Statistical Analysis
3.1. Descriptive Statistics
3.2. Natural Effect Estimates and Proportion Mediated
4. Results
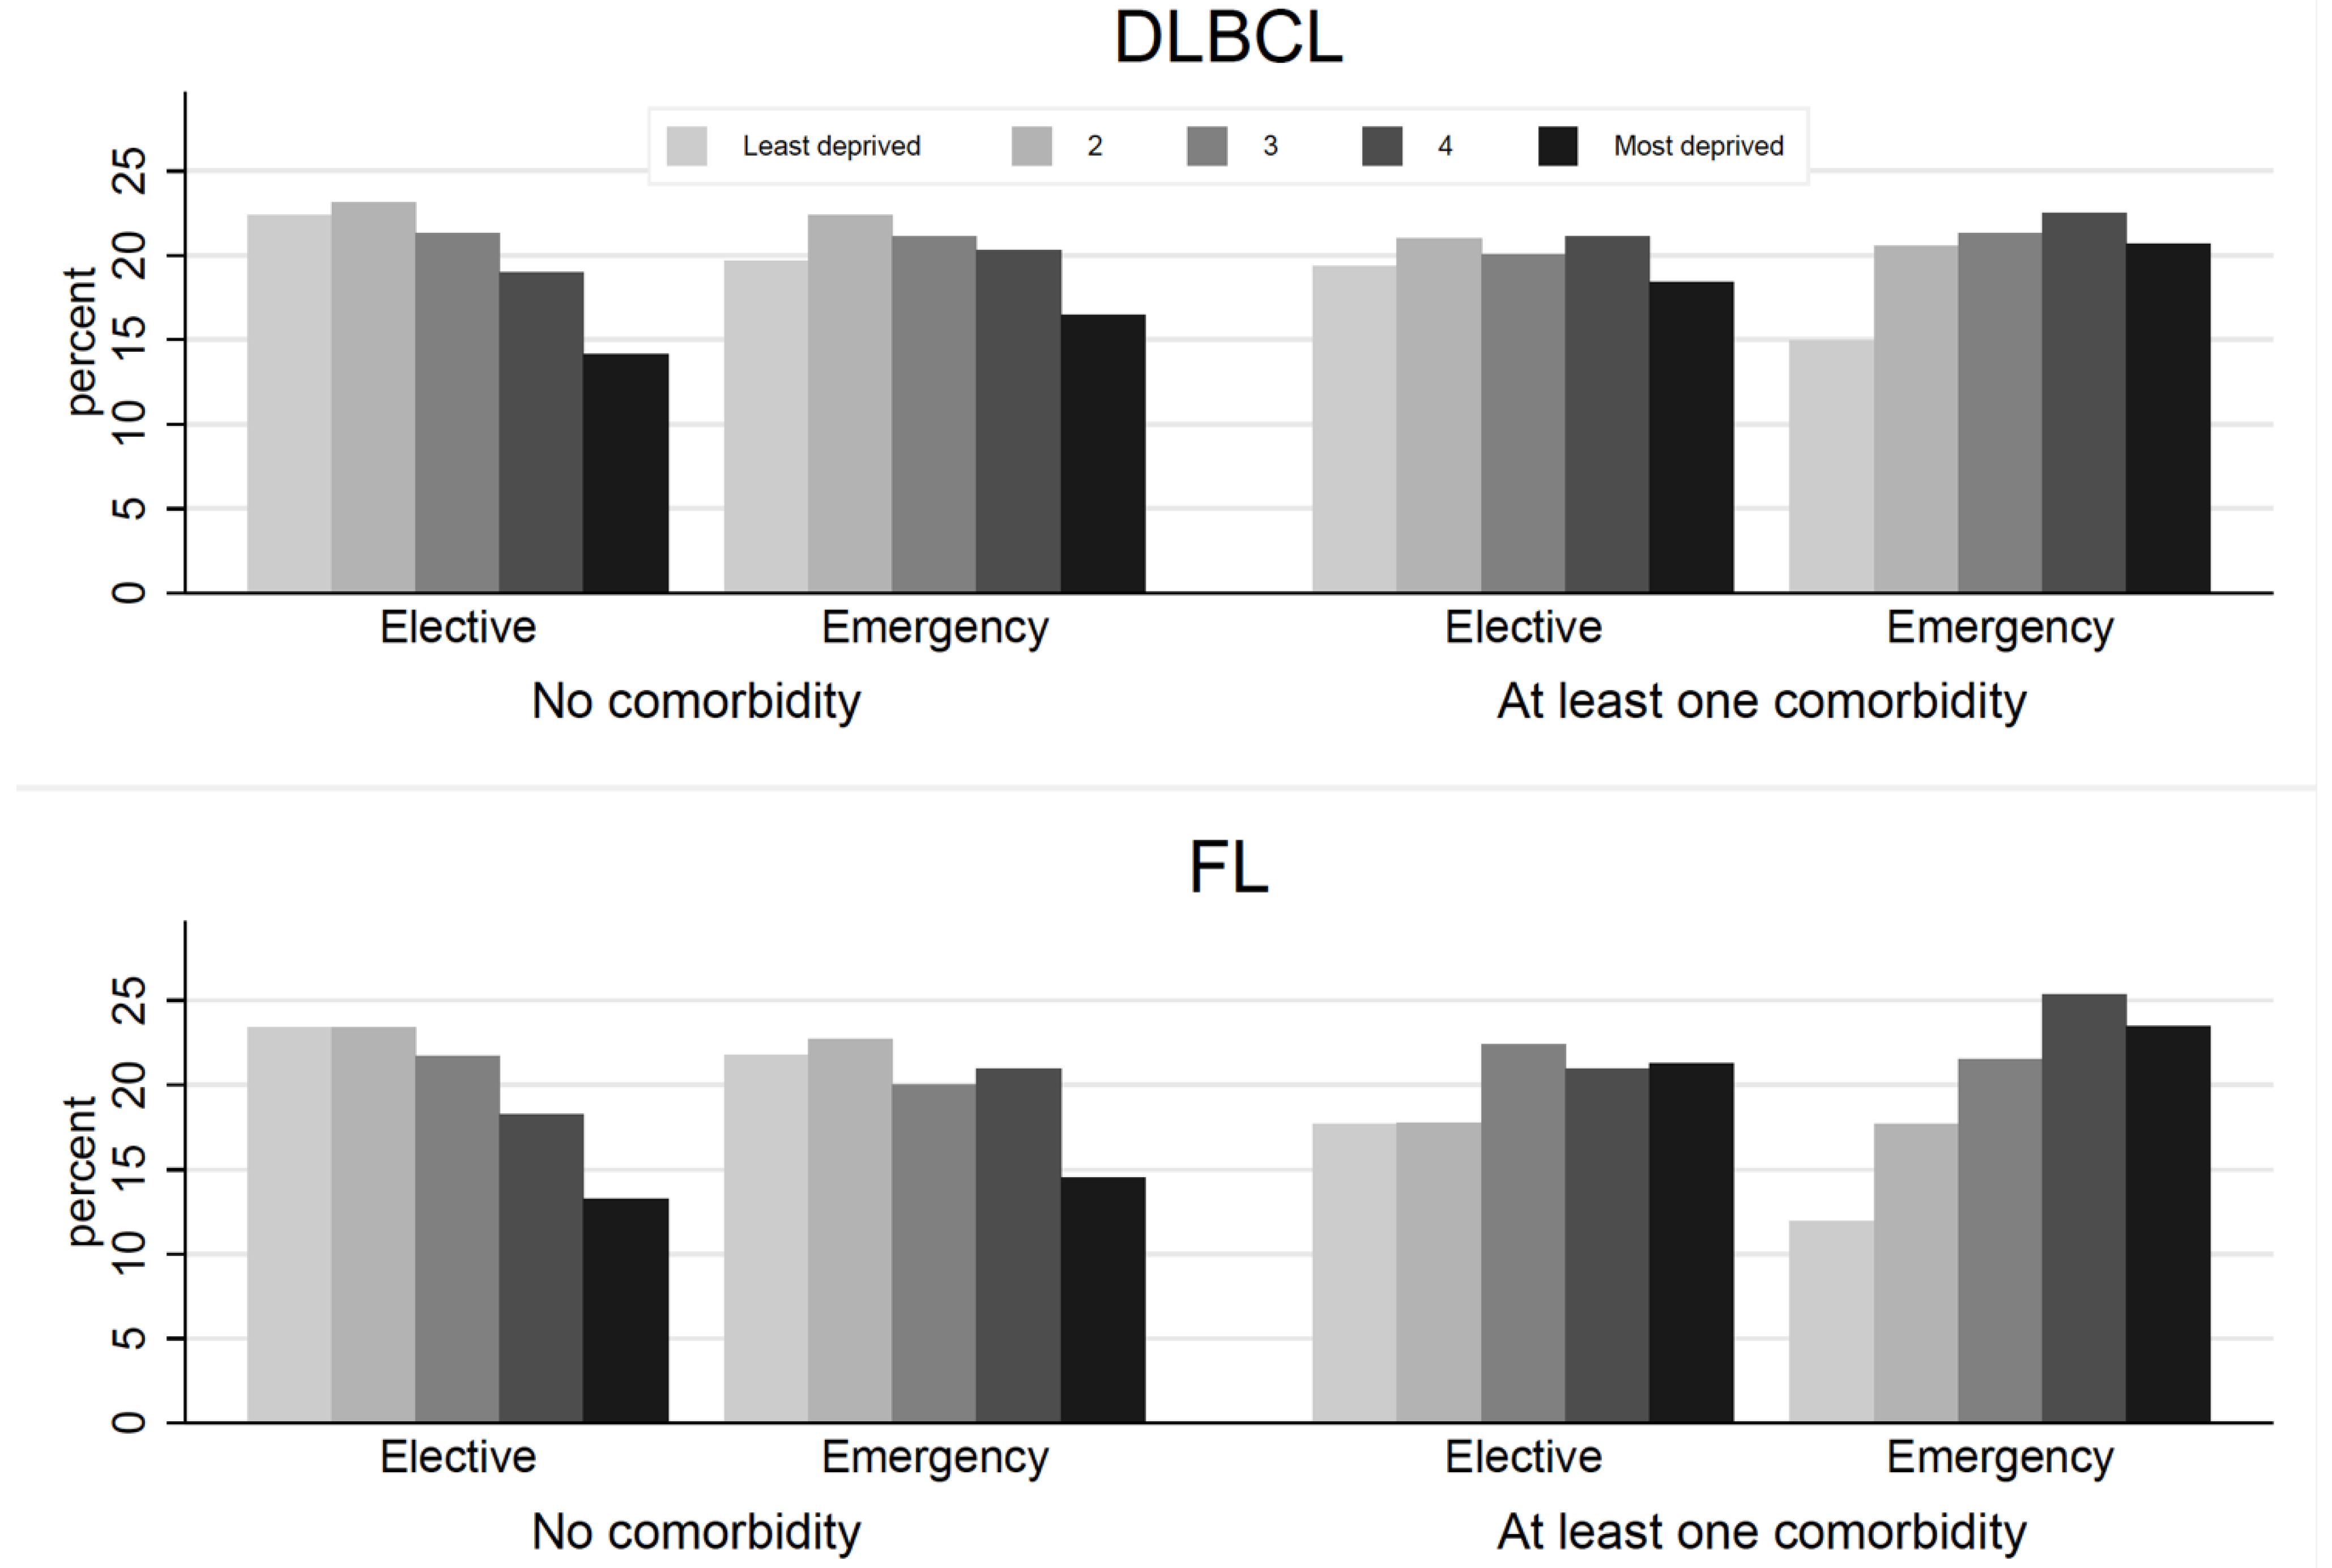
4.1. Summary Statistics
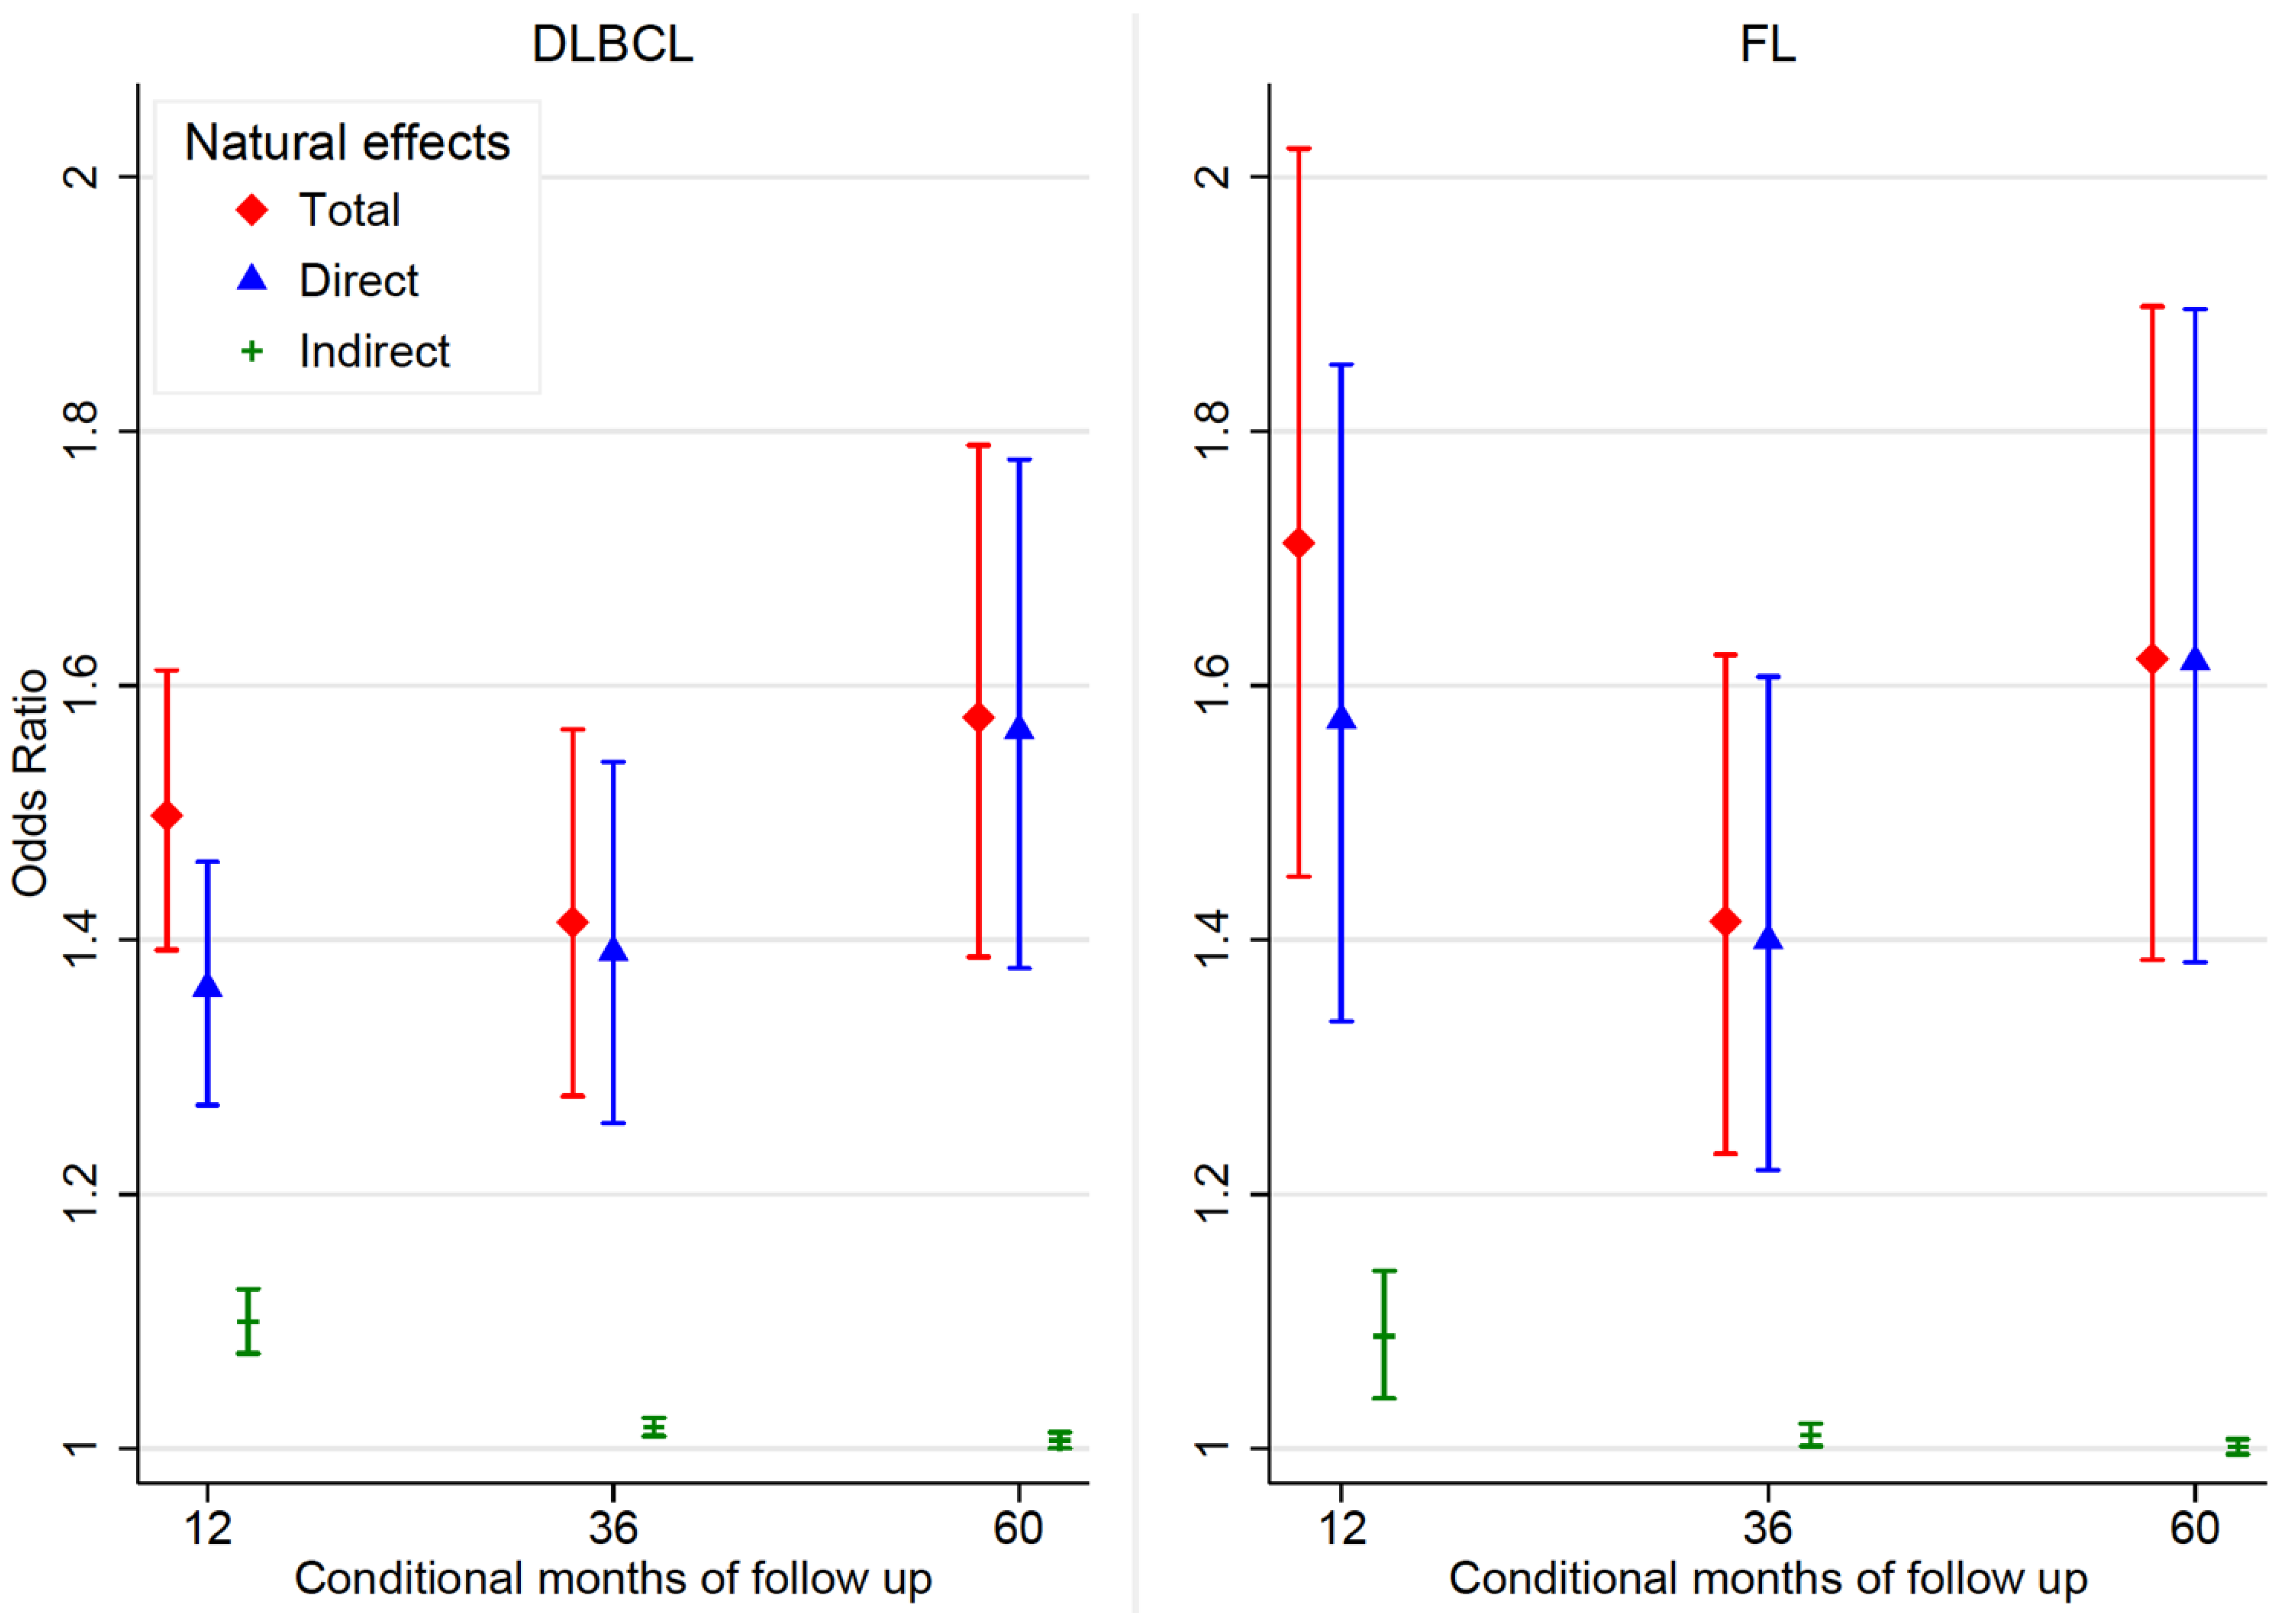
4.2. Natural Effect Estimates
5. Discussion
Supplementary Materials
Author Contributions
Funding
Institutional Review Board Statement
Informed Consent Statement
Data Availability Statement
Conflicts of Interest
References
- Rachet, B.; Mitry, E.; Shah, A.; Cooper, N.; Coleman, M.P. Survival from non-Hodgkin lymphoma in England and Wales up to 2001. Br. J. Cancer 2008, 99, S104–S106. [Google Scholar] [CrossRef] [PubMed][Green Version]
- Rachet, B.; Ellis, L.; Maringe, C.; Chu, T.; Nur, U.; Quaresma, M.; Shah, A.; Walters, S.; Woods, L.; Forman, D.; et al. Socioeconomic inequalities in cancer survival in England after the NHS cancer plan. Br. J. Cancer 2010, 103, 446–453. [Google Scholar] [CrossRef] [PubMed]
- Smith, A.; Crouch, S.; Lax, S.; Li, J.; Painter, D.; Howell, D.; Patmore, R.; Jack, A.; Roman, E. Lymphoma incidence, survival and prevalence 2004–2014: Sub-type analyses from the UK’s Haematological Malignancy Research Network. Br. J. Cancer 2015, 112, 1575–1584. [Google Scholar] [CrossRef] [PubMed]
- Li, R.; Daniel, R.; Rachet, B. How much do tumor stage and treatment explain socioeconomic inequalities in breast cancer survival? Applying causal mediation analysis to population-based data. Eur. J. Epidemiol. 2016, 31, 603–611. [Google Scholar] [CrossRef]
- Renzi, C.; Lyratzopoulos, G.; Hamilton, W.; Maringe, C.; Rachet, B. Contrasting effects of comorbidities on emergency colon cancer diagnosis: A longitudinal data-linkage study in England. BMC Health Serv. Res. 2019, 19, 311. [Google Scholar] [CrossRef]
- Renzi, C.; Kaushal, A.; Emery, J.; Hamilton, W.; Neal, R.D.; Rachet, B.; Rubin, G.; Singh, H.; Walter, F.M.; de Wit, N.J.; et al. Comorbid chronic diseases and cancer diagnosis: Disease-specific effects and underlying mechanisms. Nat. Rev. Clin. Oncol. 2019, 16, 746–761. [Google Scholar] [CrossRef]
- Robins, J.M.; Greenland, S. Identifiability and Exchangeability for Direct and Indirect Effects. Epidemiology 1992, 3, 143–155. [Google Scholar] [CrossRef]
- VanderWeele, T.J. Mediation Analysis: A Practitioner’s Guide. Annu. Rev. Public Health 2016, 37, 17–32. [Google Scholar] [CrossRef]
- Richiardi, L.; Bellocco, R.; Zugna, D. Mediation analysis in epidemiology: Methods, interpretation and bias. Int. J. Epidemiol. 2013, 42, 1511–1519. [Google Scholar] [CrossRef]
- International Agency for Research on Cancer International Classification of Diseases for Oncology. 2013. Available online: http://codes.iarc.fr/ (accessed on 4 October 2019).
- Public Health England National Cancer Registration and Analysis Service. 2019. Available online: https://www.gov.uk/guidance/national-cancer-registration-and-analysis-service-ncras#cancer-registration (accessed on 30 March 2020).
- NHS Digital Hospital Episode Statistics. 2015. Available online: https://digital.nhs.uk/data-and-information/data-tools-and-services/data-services/hospital-episode-statistics (accessed on 4 October 2019).
- Maringe, C.; Fowler, H.; Rachet, B.; Luque-Fernandez, M.A. Reproducibility, reliability and validity of population-based administrative health data for the assessment of cancer non-related comorbidities. PLoS ONE 2017, 12, e0172814. [Google Scholar] [CrossRef]
- Charlson, M.E.; Pompei, P.; Ales, K.L.; MacKenzie, C.R. A new method of classifying prognostic comorbidity in longitudinal studies: Development and validation. J. Chronic Dis. 1987, 40, 373–383. [Google Scholar] [CrossRef]
- Armitage, J.N.; van der Meulen, J.H. Identifying co-morbidity in surgical patients using administrative data with the Royal College of Surgeons Charlson Score. Br. J. Surg. 2010, 97, 772–781. [Google Scholar] [CrossRef] [PubMed]
- Elliss-Brookes, L.; McPhail, S.; Ives, A.; Greenslade, M.; Shelton, J.; Hiom, S.; Richards, M. Routes to diagnosis for cancer—Determining the patient journey using multiple routine data sets. Br. J. Cancer 2012, 107, 1220–1226. [Google Scholar] [CrossRef] [PubMed]
- National Health Service: Data dictionary Lower Super Output Area. 2018. Available online: https://www.datadictionary.nhs.uk/data_dictionary (accessed on 4 October 2019).
- English Indices of Multiple Deprivation. 2015. Available online: https://www.gov.uk/government/statistics/english-indices-of-deprivation-2015 (accessed on 4 October 2019).
- Office for National Statistics Clinical Commissioning Group Population Estimates. 2020. Available online: https://www.ons.gov.uk/peoplepopulationandcommunity/populationandmigration/populationestimates/datasets/clinicalcommissioninggroupmidyearpopulationestimates (accessed on 30 March 2020).
- Sheringham, J.R.; Georghiou, T.; Chitnis, X.A.; Bardsley, M. Comparing primary and secondary health-care use between diagnostic routes before a colorectal cancer diagnosis: Cohort study using linked data. Br. J. Cancer 2014, 111, 1490–1499. [Google Scholar] [CrossRef] [PubMed]
- Hernán, M.A. The hazards of hazard ratios. Epidemiology 2010, 21, 13–15. [Google Scholar] [CrossRef] [PubMed]
- Pohar-Perme, M.; Janez, S.; Jacques, E. On Estimation in Relative Survival. Biometrics 2012, 68, 113–120. [Google Scholar] [CrossRef]
- StataCorp. Stata Statistical Software, Version 17; StataCorp LLC.: College Station, TX, USA, 2021.
- Clerc-Urmès, I.; Grzebyk, M.; Hédelin, G. Net survival estimation with stns. Stata J. 2014, 14, 87–102. [Google Scholar] [CrossRef]
- Robins, J. A new approach to causal inference in mortality studies with a sustained exposure period—Application to control of the healthy worker survivor effect. Math. Model 1986, 7, 1393–1512. [Google Scholar] [CrossRef]
- Daniel, R.M.; de Stavola, B.L.; Cousens, S.N. gformula: Estimating causal effects in the presence of time-varying confounding or mediation using the g-computation formula. Stata J. 2011, 11, 479–517. [Google Scholar] [CrossRef]
- Renzi, C.; Lyratzopoulos, G.; Card, T.; Chu, T.P.C.; Macleod, U.; Rachet, B. Do colorectal cancer patients diagnosed as an emergency differ from non-emergency patients in their consultation patterns and symptoms? A longitudinal data-linkage study in England. Br. J. Cancer 2016, 115, 866. [Google Scholar] [CrossRef]
- Kane, E.; Howell, D.; Smith, A.; Crouch, S.; Burton, C.; Roman, E.; Patmore, R. Emergency admission and survival from aggressive non—Hodgkin lymphoma: A report from the UK’s population-based Haematological Malignancy Research Network. Eur. J. Cancer 2017, 78, 53–60. [Google Scholar] [CrossRef] [PubMed]
- Wästerlid, T.; Harrysson, S.; Andersson, T.M.L.; Ekberg, S.; Enblad, G.; Andersson, P.O.; Jerkeman, M.; Eloranta, S.; Smedby, K.E. Outcome and determinants of failure to complete primary R-CHOP treatment for reasons other than non-response among patients with diffuse large B-cell lymphoma. Am. J. Hematol. 2020, 95, 740–748. [Google Scholar] [CrossRef] [PubMed]
- Hamilton, W. Emergency admissions of cancer as a marker of diagnostic delay. Br. J. Cancer 2012, 107, 1205–1206. [Google Scholar] [CrossRef] [PubMed]
- Gurney, J.; Sarfati, D.; Stanley, J. The impact of patient comorbidity on cancer stage at diagnosis. Br. J. Cancer 2015, 113, 1375–1380. [Google Scholar] [CrossRef]
- Sarfati, D.; Koczwara, B.; Jackson, C. The impact of comorbidity on cancer and its treatment. CA Cancer J. Clin. 2016, 66, 337–350. [Google Scholar] [CrossRef]
- Salika, T.; Lyratzopoulos, G.; Whitaker, K.L.; Waller, J.; Renzi, C. Do comorbidities influence help-seeking for cancer alarm symptoms? A population-based survey in England. J. Public Health 2017, 40, 340–349. [Google Scholar] [CrossRef]
- Smith, M.J.; Fernandez, M.A.L.; Belot, A.; Quartagno, M.; Bonaventure, A.; Majano, S.B.; Rachet, B.; Njagi, E.N. Investigating the inequalities in route to diagnosis amongst patients with diffuse large B-cell or follicular lymphoma in England. Br. J. Cancer 2021, 125, 1299–1307. [Google Scholar] [CrossRef]
- Smith, A.; Crouch, S.; Howell, D.; Burton, C.; Patmore, R.; Roman, E. Impact of age and socioeconomic status on treatment and survival from aggressive lymphoma: A UK population-based study of diffuse large B-cell lymphoma. Cancer Epidemiol. 2015, 39, 1103–1112. [Google Scholar] [CrossRef]
- Smith, M.J.; Belot, A.; Quartagno, M.; Fernandez, M.A.L.; Bonaventure, A.; Gachau, S.; Majano, S.B.; Rachet, B.; Njagi, E.N. Excess Mortality by Multimorbidity, Socioeconomic, and Healthcare Factors, amongst Patients Diagnosed with Diffuse Large B-Cell or Follicular Lymphoma in England. Cancers 2021, 13, 5805. [Google Scholar] [CrossRef]
- Ingleby, F.C.; Belot, A.; Atherton, I.; Baker, M.; Elliss-Brookes, L.; Woods, L.M. Assessment of the concordance between individual-level and area-level measures of socio-economic deprivation in a cancer patient cohort in England and Wales. BMJ Open 2020, 10, e041714. [Google Scholar] [CrossRef]
- Herbert, A.; Wijlaars, L.; Zylbersztejn, A.; Cromwell, D.; Hardelid, P. Data Resource Profile: Hospital Episode Statistics Admitted Patient Care (HES APC). Int. J. Epidemiol. 2017, 46, 1093–1093i. [Google Scholar] [CrossRef] [PubMed]
- Sarfati, D. Review of methods used to measure comorbidity in cancer populations: No gold standard exists. J. Clin. Epidemiol. 2012, 65, 924–933. [Google Scholar] [CrossRef] [PubMed]
- Bannay, A.; Chaignot, C.; Blotiere, P.O.; Basson, M.; Weill, A.; Ricordeau, P.; Alla, F. The Best Use of the Charlson Comorbidity Index with Electronic Health Care Database to Predict Mortality. Med. Care 2016, 54, 188–194. [Google Scholar] [CrossRef] [PubMed]


| No Comorbidity N (%) | Comorbidity N (%) | Total N (%) | OR † (95% CI) | p-Value * | |
|---|---|---|---|---|---|
| Diffuse large B-cell lymphoma | |||||
| Age *** | |||||
| Mean (SD) | 70.3 (11.3) | 74.1 (10.6) | 70.7 (11.0) | 1.35 (1.31–1.41) ** | <0.001 |
| Sex | |||||
| Male | 12,904 (53.2) | 1748 (56.2) | 14,652 (53.5) | Ref | - |
| Female | 11,365 (46.8) | 1362 (43.8) | 12,727 (46.5) | 0.88 (0.82–0.95) | 0.001 |
| Deprivation | |||||
| Least deprived | 5348 (22.0) | 547 (17.6) | 5895 (21.5) | Ref | - |
| 2 | 5586 (23.0) | 652 (21.0) | 6238 (22.8) | 1.14 (1.01–1.29) | 0.031 |
| 3 | 5115 (21.1) | 641 (20.6) | 5756 (21.0) | 1.23 (1.09–1.38) | 0.001 |
| 4 | 4665 (19.2) | 676 (21.7) | 5341 (19.5) | 1.42 (1.26–1.60) | <0.001 |
| Most deprived | 3555 (14.7) | 594 (19.1) | 4149 (15.2) | 1.63 (1.44–1.85) | <0.001 |
| Route | |||||
| Elective | 15,495 (67.3) | 1785 (58.8) | 17,280 (66.3) | Ref | - |
| Emergency | 7547 (32.8) | 1252 (41.2) | 8799 (33.7) | 1.44 (1.33–1.56) | <0.001 |
| Missing | 1227 (5.1) | 73 (2.4) | 1300 (4.7) | - | - |
| Follicular lymphoma | |||||
| Age *** | |||||
| Mean (SD) | 66.2 (11.0) | 72.0 (10.3) | 66.7 (10.7) | 1.62 (1.53–1.71) ** | <0.001 |
| Sex | |||||
| Male | 5980 (46.4) | 532 (46.5) | 6512 (46.4) | Ref | - |
| Female | 6918 (53.6) | 613 (53.5) | 7531 (53.6) | 1.00 (0.88–1.12) | 0.949 |
| Deprivation | |||||
| Least deprived | 3091 (24.0) | 193 (16.9) | 3284 (23.4) | Ref | - |
| 2 | 3025 (23.5) | 203 (17.7) | 3228 (23.0) | 1.07 (0.88–1.32) | 0.487 |
| 3 | 2759 (21.4) | 254 (22.2) | 3013 (21.5) | 1.47 (1.21–1.79) | <0.001 |
| 4 | 2356 (18.3) | 253 (22.1) | 2609 (18.6) | 1.71 (1.42–2.09) | <0.001 |
| Most deprived | 1667 (12.9) | 242 (21.1) | 1909 (13.6) | 2.32 (1.91–2.83) | <0.001 |
| Route | |||||
| Elective | 10,332 (87.2) | 889 (81.0) | 11,221 (86.7) | Ref | - |
| Emergency | 1518 (12.8) | 209 (19.0) | 2407 (18.6) | 1.60 (1.36–1.88) | <0.001 |
| Missing | 1058 (8.2) | 47 (4.1) | 1105 (7.9) | - | - |
| 1 Year NS (95% CI) | 3 Years NS (95% CI) | 5 Years NS (95% CI) | ||||
|---|---|---|---|---|---|---|
| Least Deprived | Most Deprived | Least Deprived | Most Deprived | Least Deprived | Most Deprived | |
| DLBCL | ||||||
| Comorbidity | ||||||
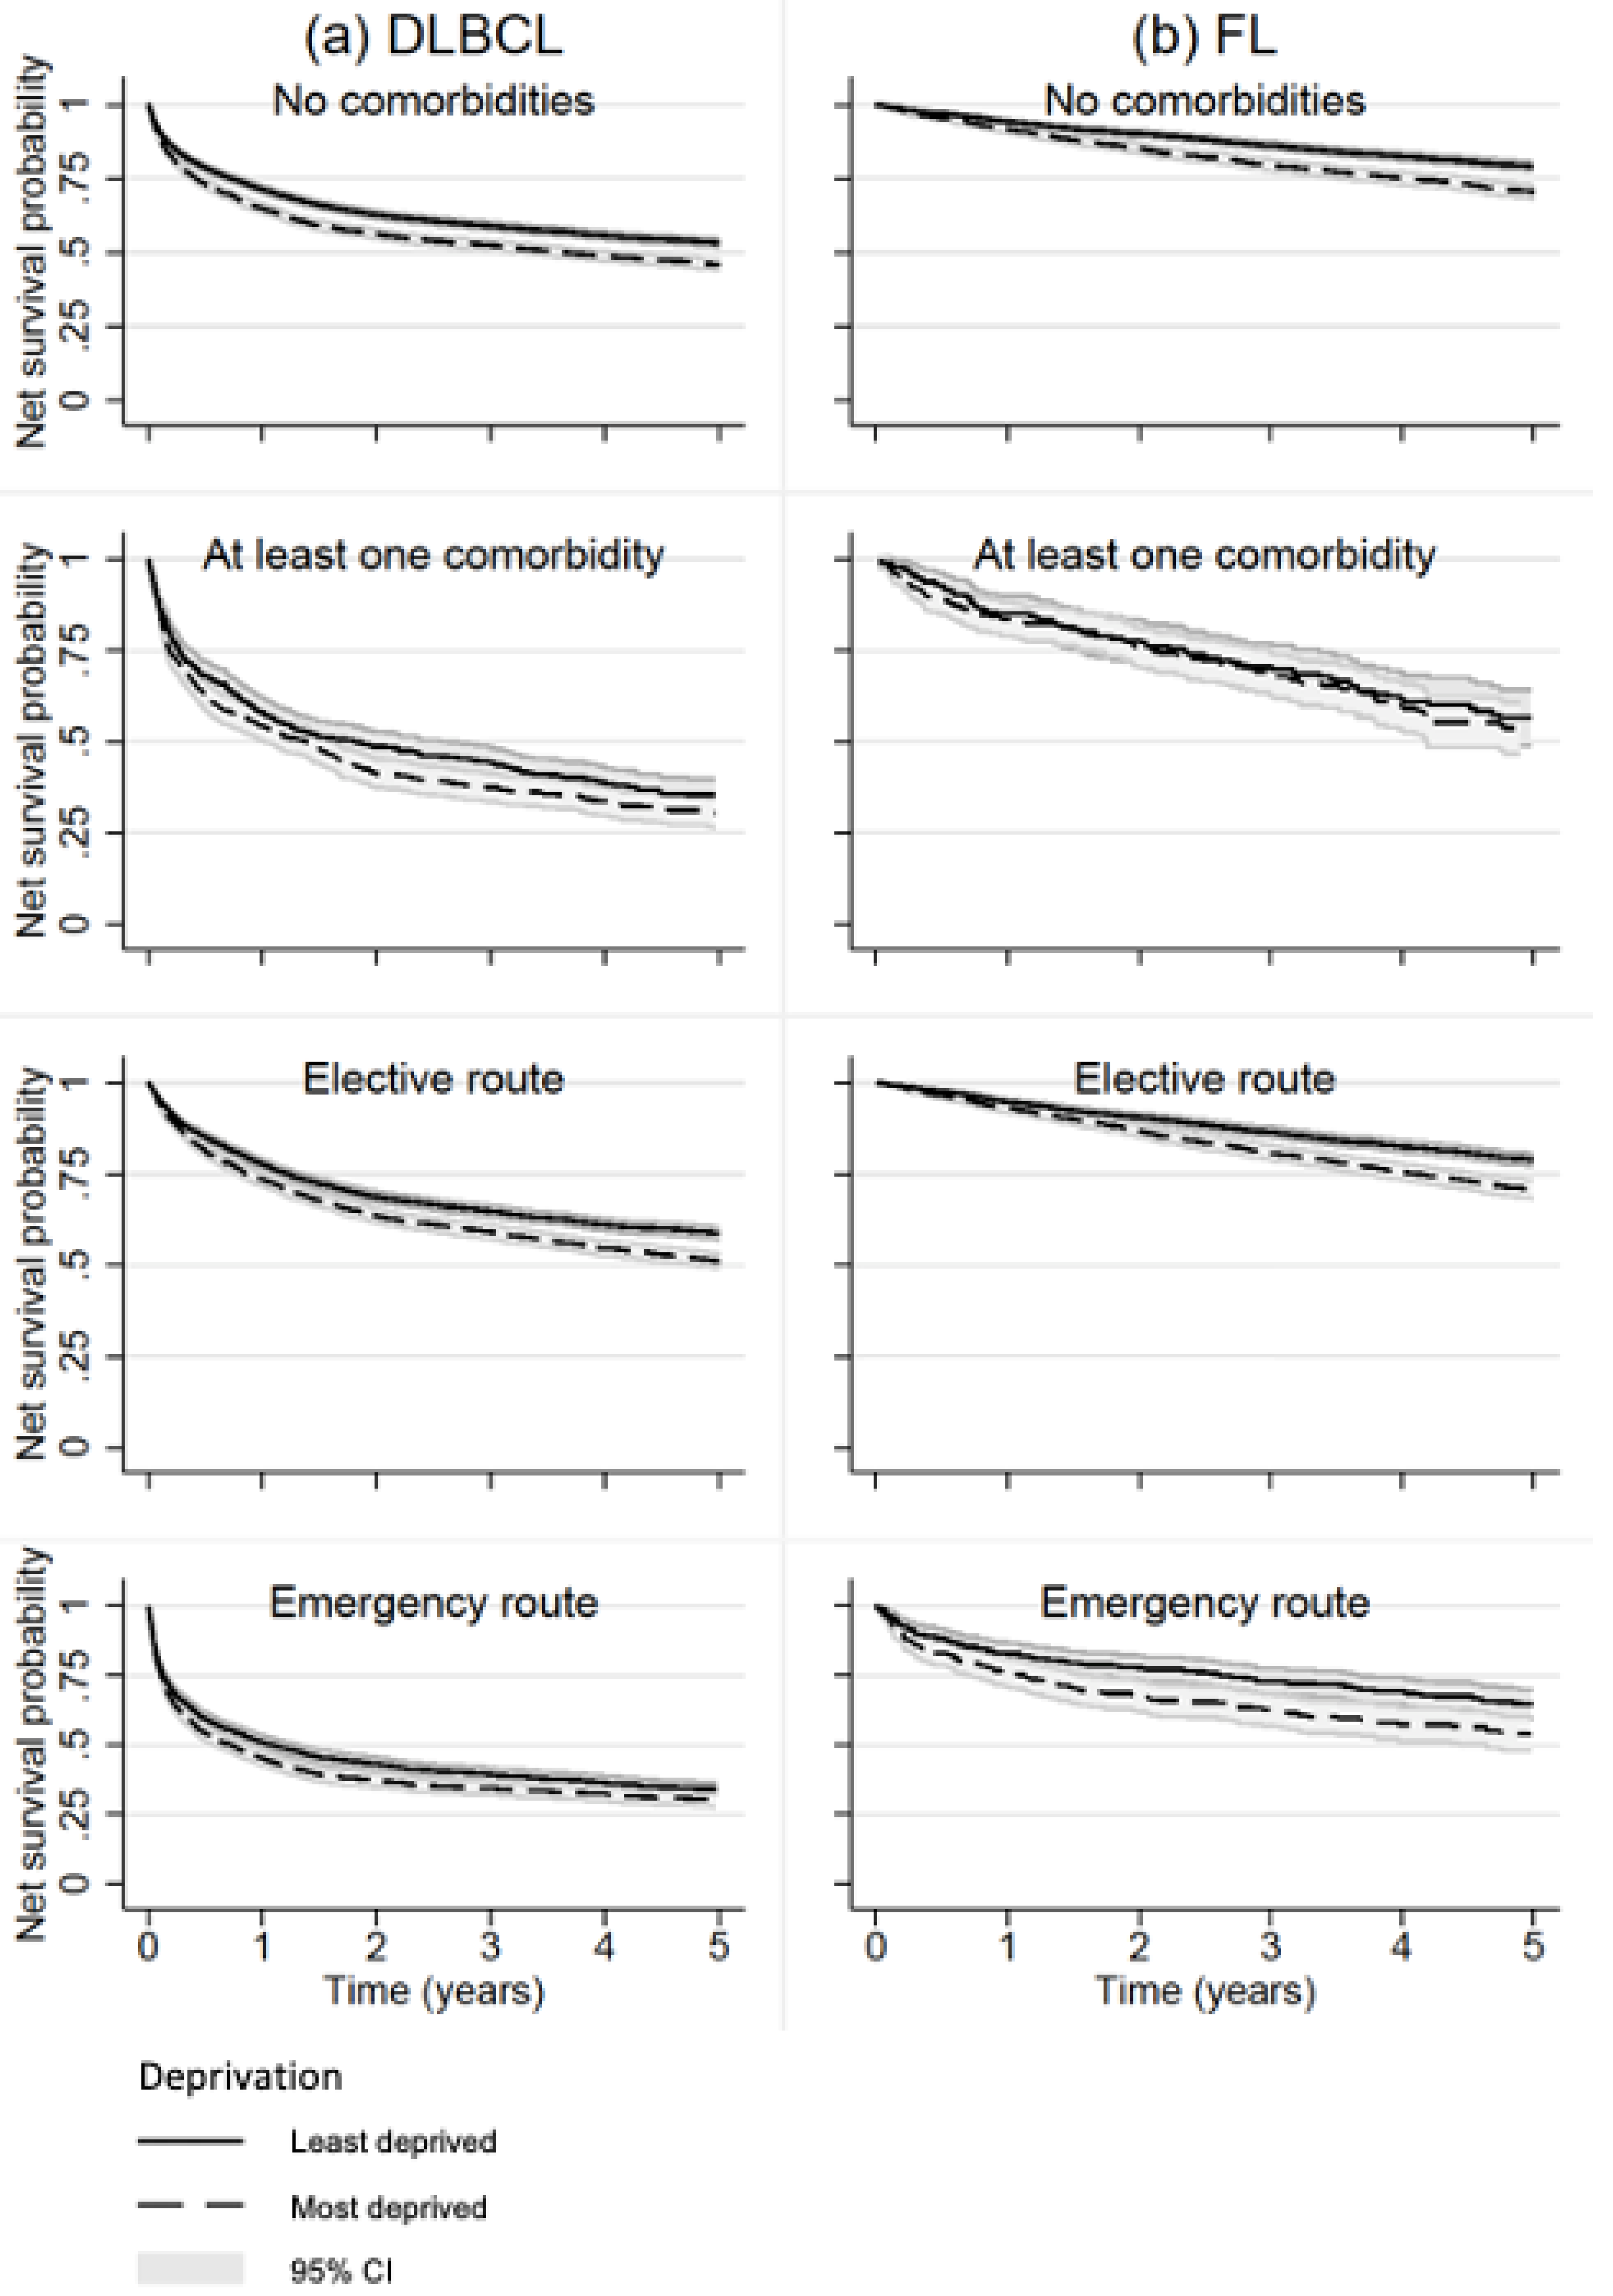
| None | 71.3 (70.1–72.5) | 64.9 (63.4–66.5) | 58.9 (57.6–60.4) | 52.5 (50.9–54.2) | 53.3 (51.9–54.7) | 45.7 (44.0–47.4) |
| At least one | 58.0 (53.8–62.1) | 54.2 (50.2–58.2) | 44.1 (39.9–48.3) | 37.4 (33.5–41.3) | 35.4 (31.0–39.7) | 30.4 (26.4–34.4) |
| Route | ||||||
| Elective | 77.8 (76.5–79.1) | 73.6 (71.9–75.3) | 64.8 (63.3–66.3) | 59.2 (57.3–61.1) | 58.8 (57.2–60.4) | 51.1 (49.1–53.2) |
| Emergency | 51.0 (48.6–53.4) | 45.3 (42.8–47.8) | 39.4 (37.1–41.8) | 34.6 (32.2–37.0) | 34.3 (32.0–36.7) | 30.2 (27.8–32.6) |
| Follicular | ||||||
| Comorbidity | ||||||
| None | 94.1 (93.3–95.0) | 91.7 (90.3–93.0) | 86.3 (85.0–87.5) | 79.6 (77.7–81.6) | 79.0 (77.5–80.5) | 70.5 (68.2–72.9) |
| At least one | 85.0 (80.0–90.0) | 83.5 (78.8–88.2) | 70.5 (64.0–77.0) | 68.4 (62.5–74.3) | 56.6 (48.9–64.3) | 53.7 (46.8–60.7) |
| Route | ||||||
| Elective | 94.7 (93.9–95.6) | 93.1 (91.9–94.4) | 86.6 (85.3–88.0) | 81.0 (79.0–82.9) | 78.8 (77.1–80.5) | 70.9 (68.4–73.3) |
| Emergency | 82.8 (78.9–86.7) | 75.9 (70.9–81.0) | 72.9 (68.2–77.5) | 62.7 (56.9–68.5) | 64.2 (58.9–69.5) | 53.5 (47.2–59.7) |
| 1 Year OR (CI) | 3 Years OR (CI) | 5 Years OR (CI) | |
|---|---|---|---|
| DLBCL | |||
| TCE | 1.50 (1.39–1.61) | 1.41 (1.28–1.57) | 1.57 (1.39–1.79) |
| NDE | 1.36 (1.27–1.46) | 1.39 (1.26–1.54) | 1.56 (1.38–1.78) |
| NIE | 1.10 (1.07–1.13) | 1.02 (1.01–1.03) | 1.01 (1.00–1.02) |
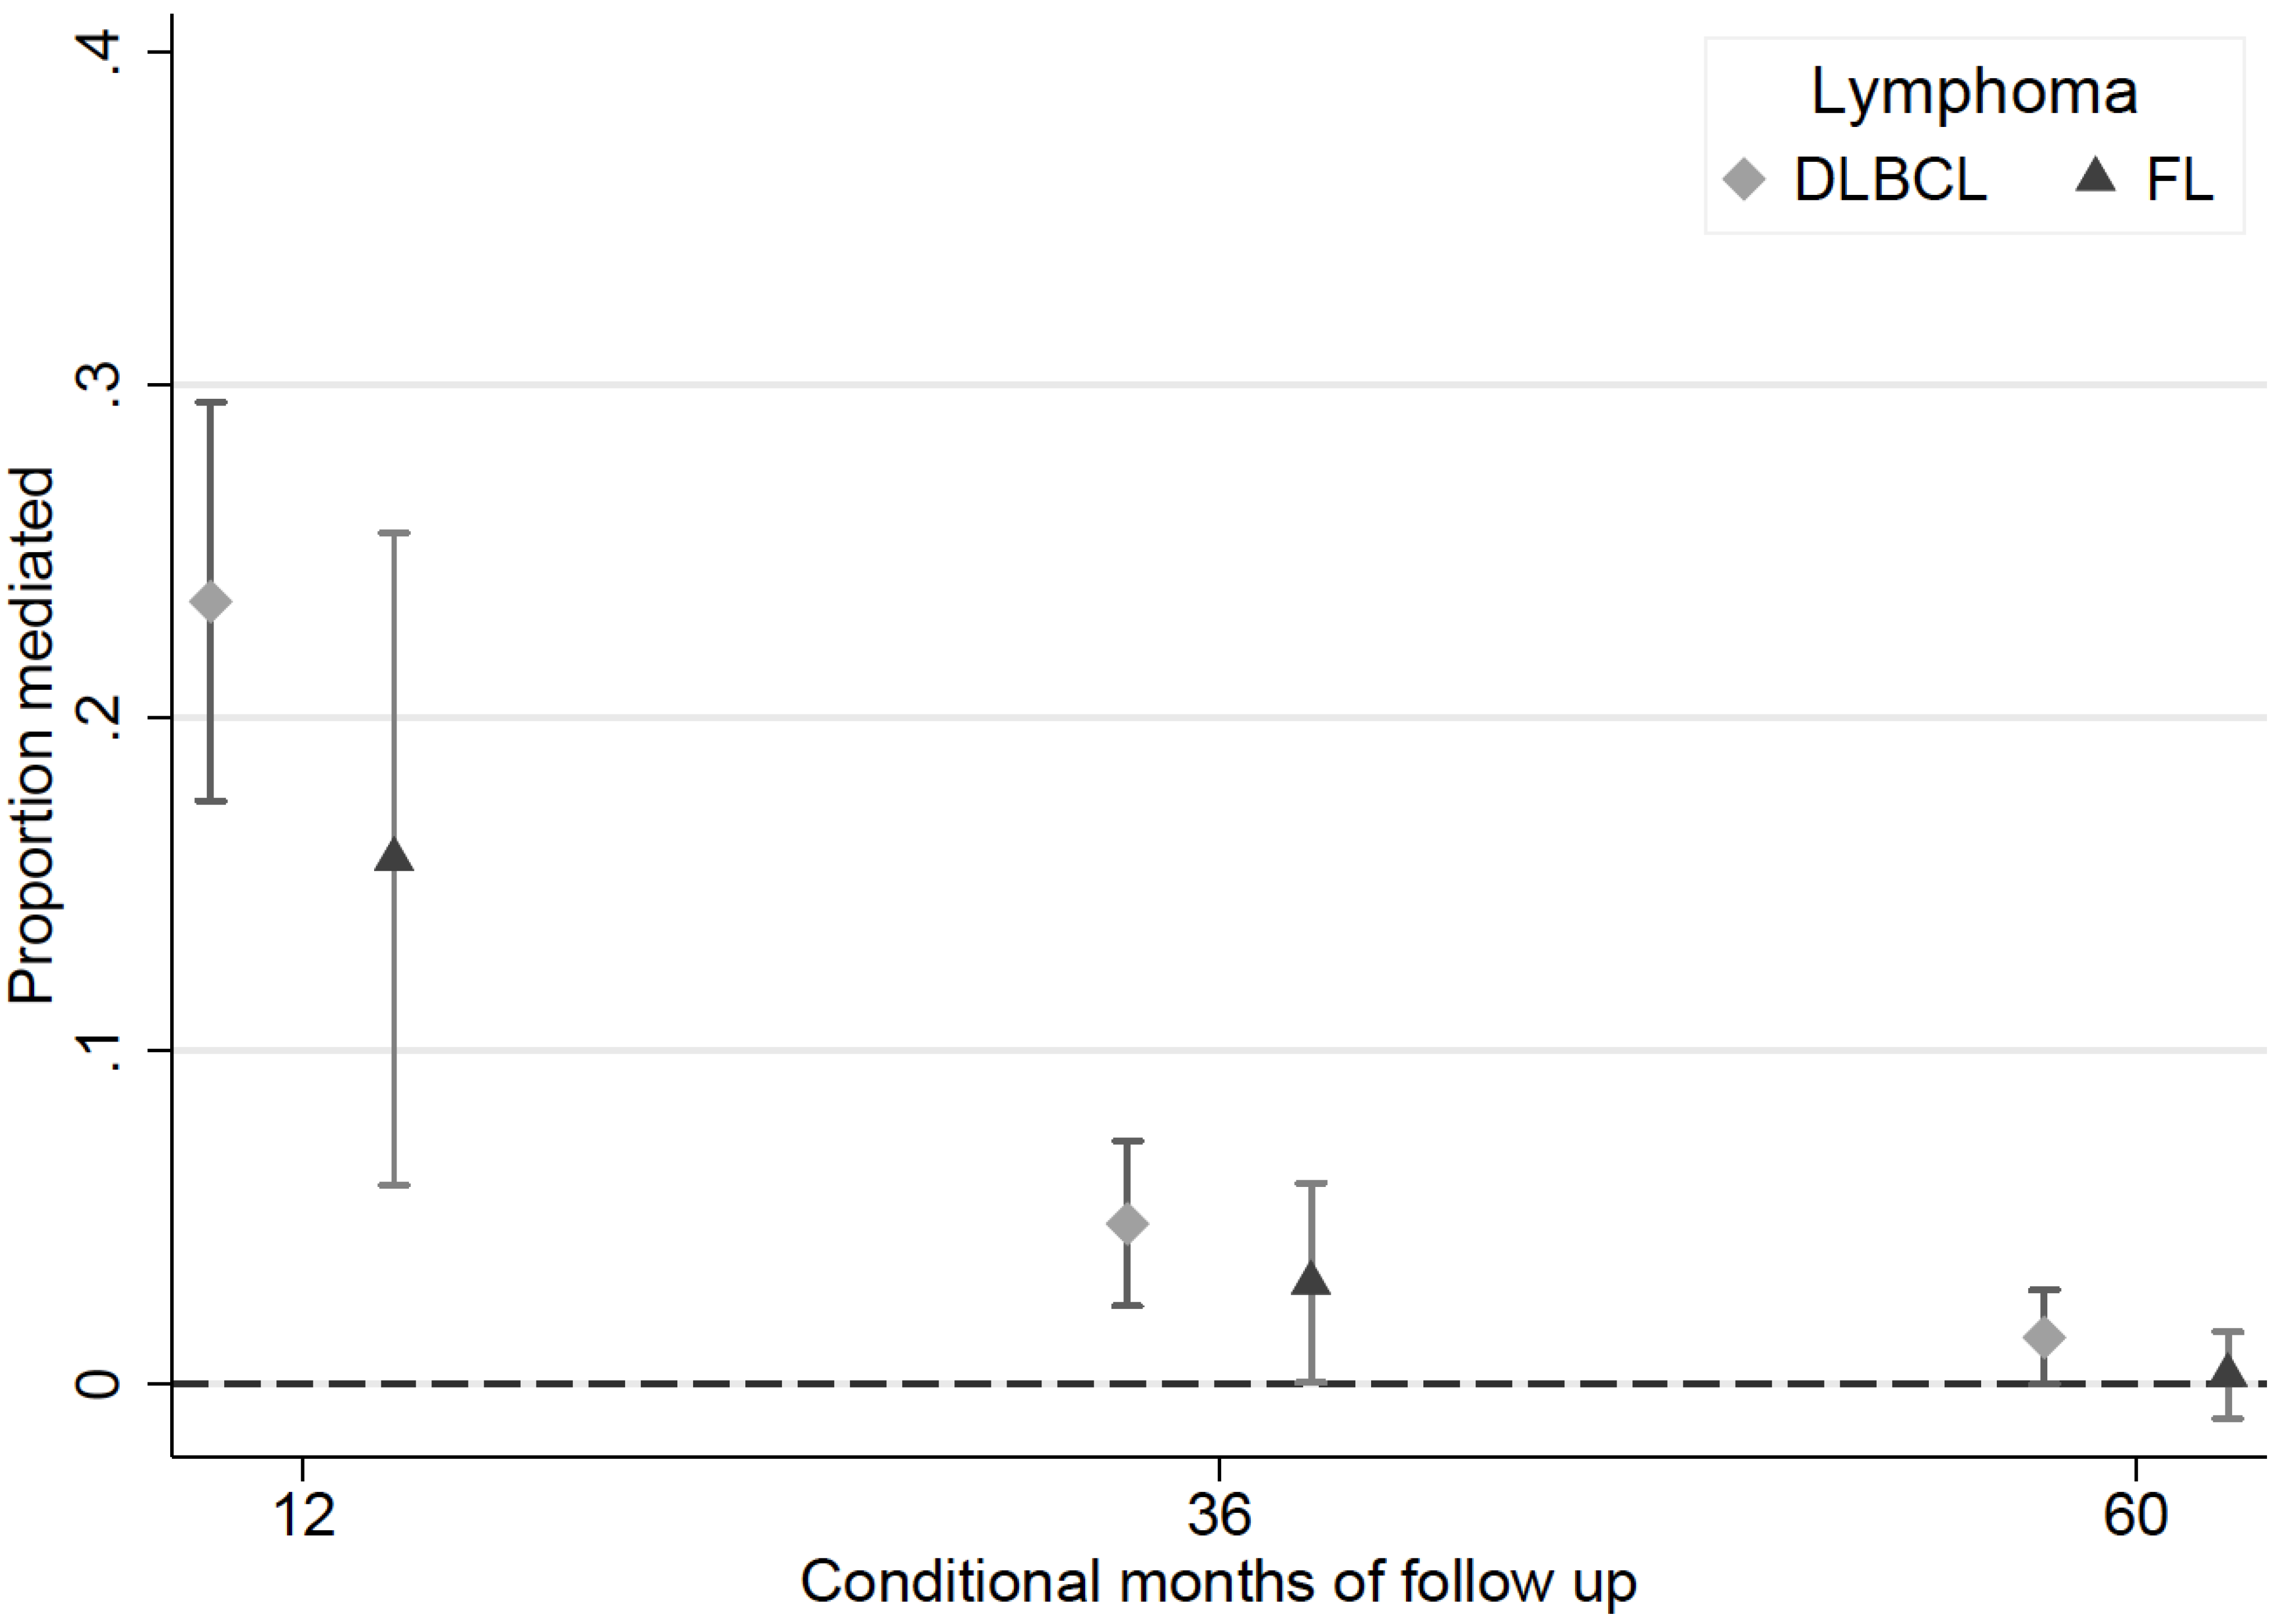
| PM | 23.5% (17.5–29.5) | 4.8% (2.3 –7.2) | 1.3% (0.0–2.8) |
| FL | |||
| TCE | 1.71 (1.45–2.02) | 1.41 (1.23–1.62) | 1.62 (1.38–1.90) |
| NDE | 1.57 (1.34–1.85) | 1.40 (1.22–1.61) | 1.62 (1.38–1.90) |
| NIE | 1.09 (1.04–1.14) | 1.01 (1.00–1.02) | 1.00 (0.99–1.01) |
| PM | 15.8% (6.0–25.6) | 3.0% (0.0–6.0) | 0.3% (−1.0–1.5) |
Publisher’s Note: MDPI stays neutral with regard to jurisdictional claims in published maps and institutional affiliations. |
© 2022 by the authors. Licensee MDPI, Basel, Switzerland. This article is an open access article distributed under the terms and conditions of the Creative Commons Attribution (CC BY) license (https://creativecommons.org/licenses/by/4.0/).
Share and Cite
Smith, M.J.; Rachet, B.; Luque-Fernandez, M.A. Mediating Effects of Diagnostic Route on the Comorbidity Gap in Survival of Patients with Diffuse Large B-Cell or Follicular Lymphoma in England. Cancers 2022, 14, 5082. https://doi.org/10.3390/cancers14205082
Smith MJ, Rachet B, Luque-Fernandez MA. Mediating Effects of Diagnostic Route on the Comorbidity Gap in Survival of Patients with Diffuse Large B-Cell or Follicular Lymphoma in England. Cancers. 2022; 14(20):5082. https://doi.org/10.3390/cancers14205082
Chicago/Turabian StyleSmith, Matthew J., Bernard Rachet, and Miguel Angel Luque-Fernandez. 2022. "Mediating Effects of Diagnostic Route on the Comorbidity Gap in Survival of Patients with Diffuse Large B-Cell or Follicular Lymphoma in England" Cancers 14, no. 20: 5082. https://doi.org/10.3390/cancers14205082
APA StyleSmith, M. J., Rachet, B., & Luque-Fernandez, M. A. (2022). Mediating Effects of Diagnostic Route on the Comorbidity Gap in Survival of Patients with Diffuse Large B-Cell or Follicular Lymphoma in England. Cancers, 14(20), 5082. https://doi.org/10.3390/cancers14205082