
CLDN1 Sensitizes Triple-Negative Breast Cancer Cells to Chemotherapy

 , ,
, ,  , and
, and 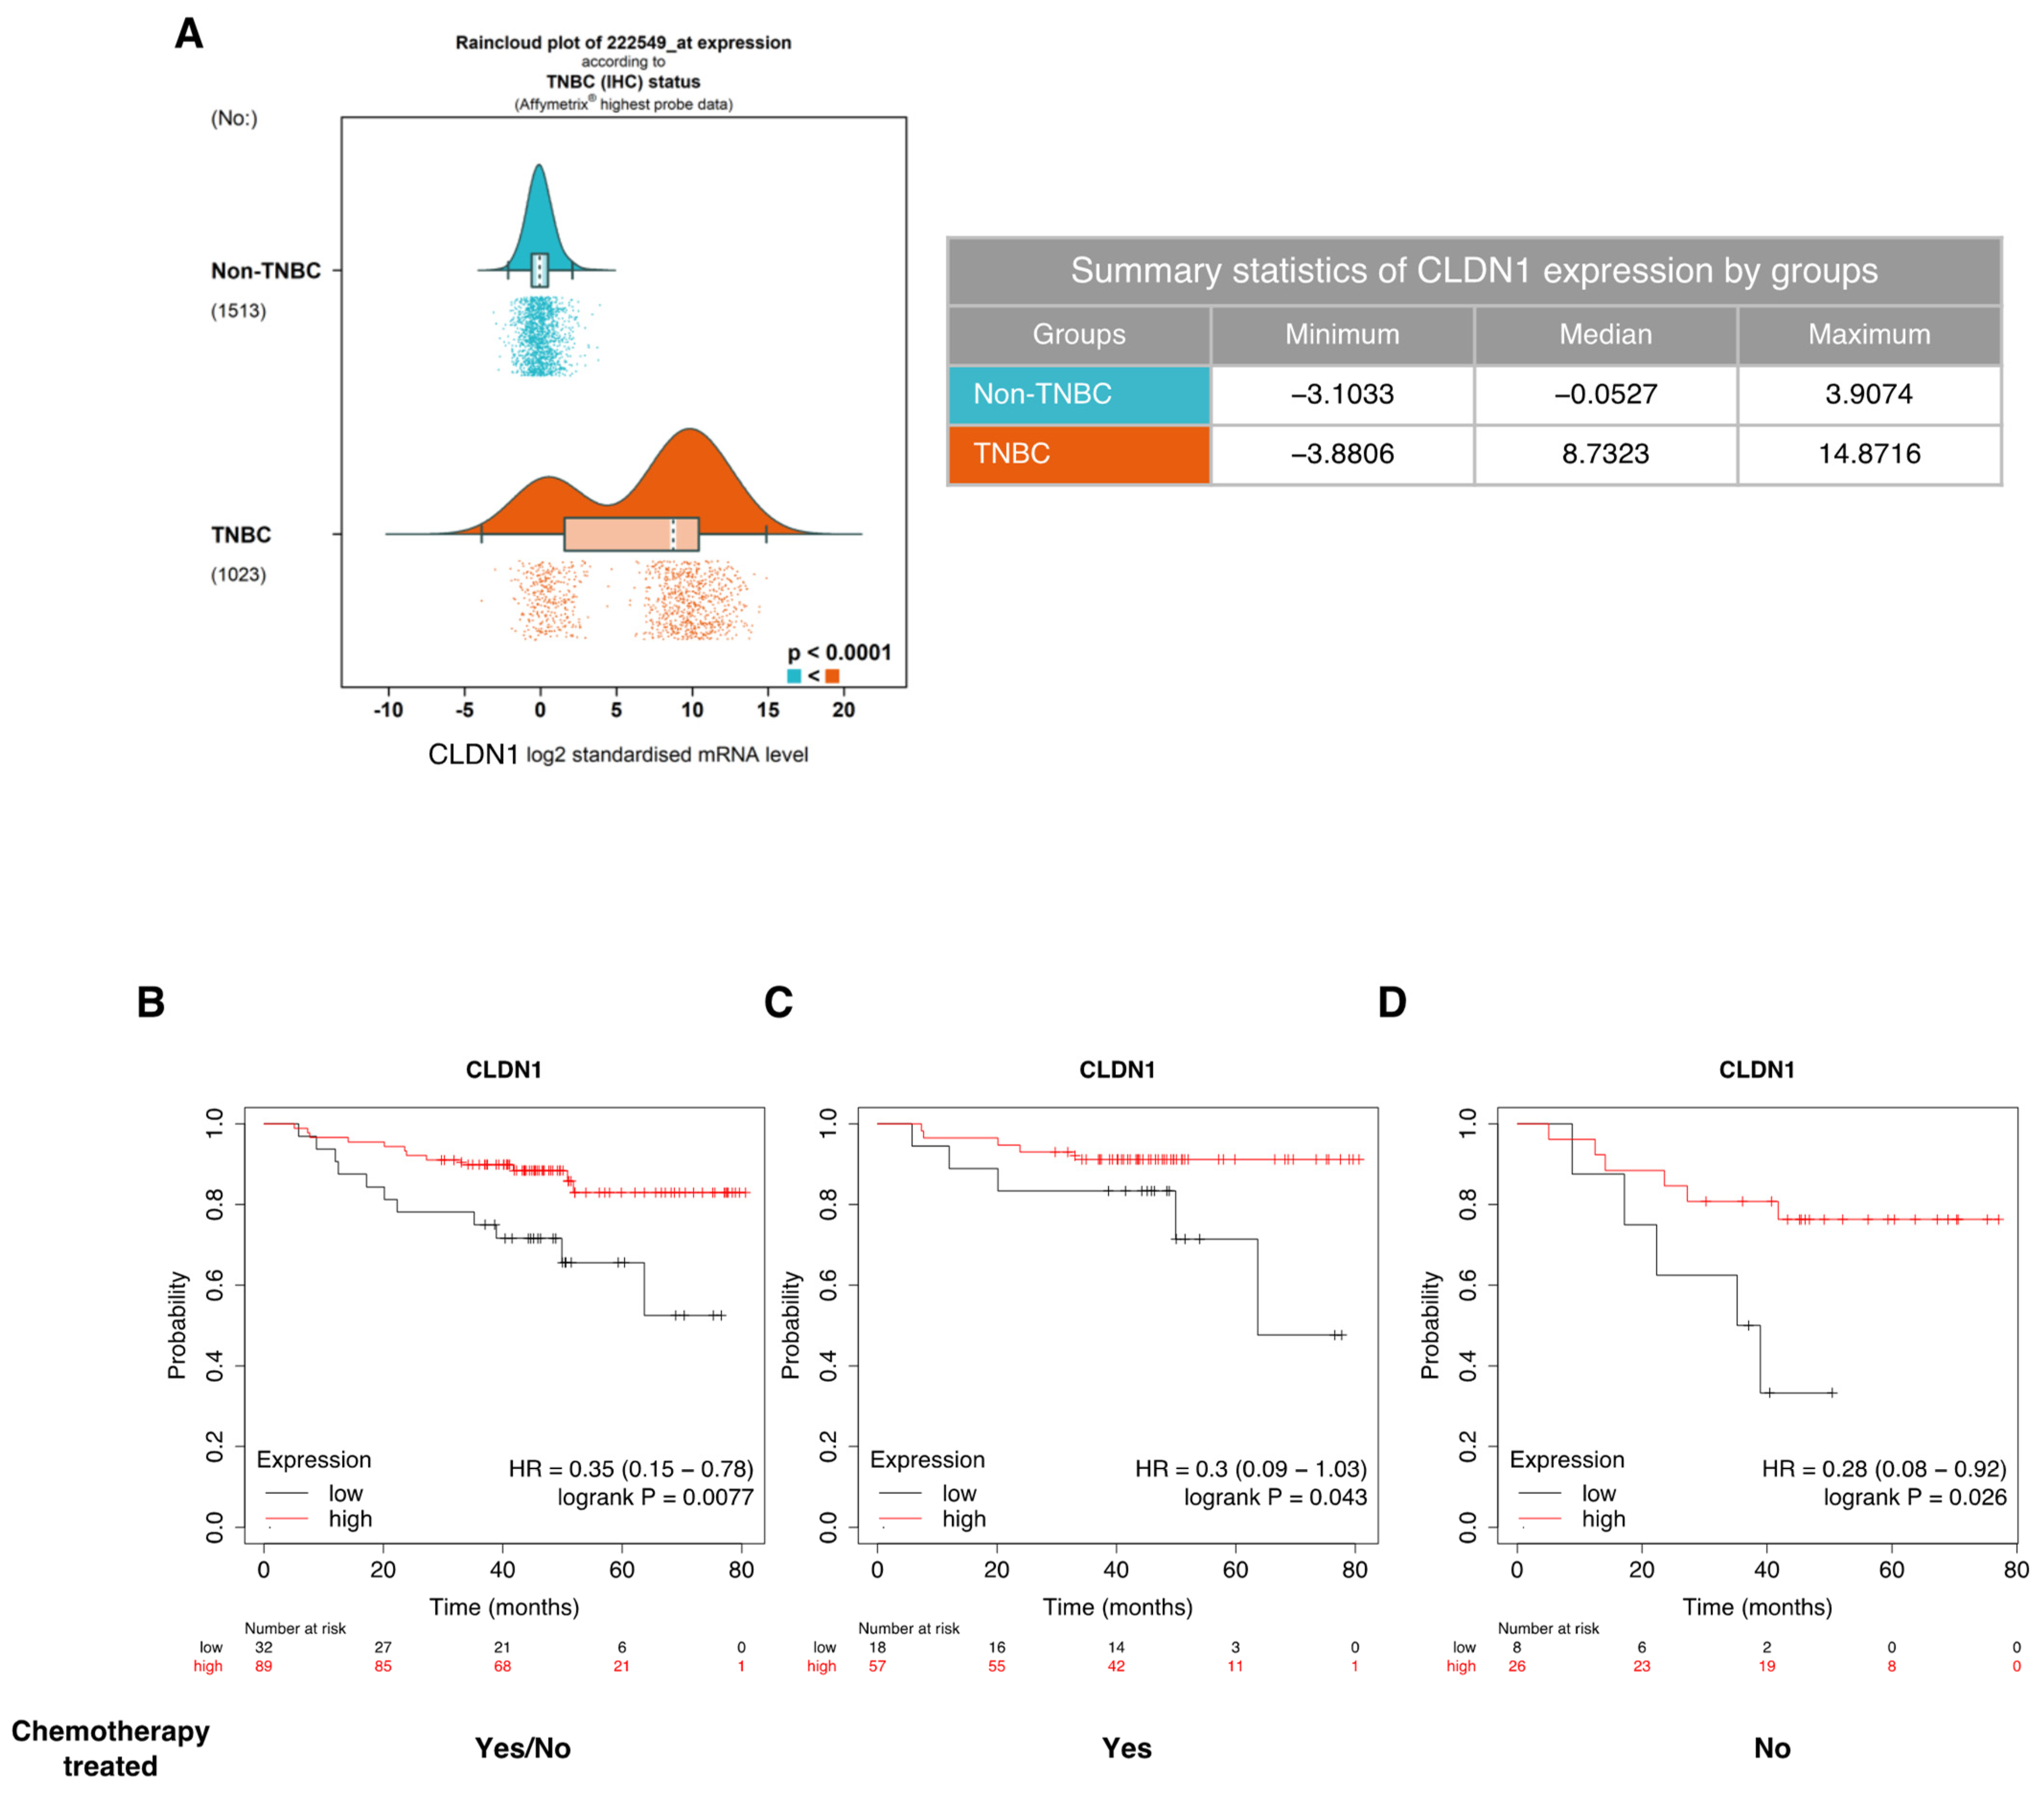
Simple Summary
Abstract
1. Introduction
2. Materials and Methods
2.1. Cell Culture and Treatment
2.2. Generation of Stable Cell Lines
2.3. RNA Interference Transfection
2.4. Western Blot
2.5. Cell Viability
2.6. Flow Cytometry
2.7. CLDN1 mRNA Expression Raincloud Analysis in Breast Tumors
2.8. Kaplan–Meier Overall Survival Analysis
2.9. Statistical Analysis
3. Results
3.1. CLDN1 Expression Is Associated with Better Sensitivity to Conventional Chemotherapeutic Agents
3.2. CLDN1 Is Involved in the Chemosensitivity of HCC1806 “Claudin-1-High” Cells to 5-FU, PTX and DOX
3.3. Endogenous CLDN1 Sensitizes MDA-MB-231 Cells to PTX and DOX
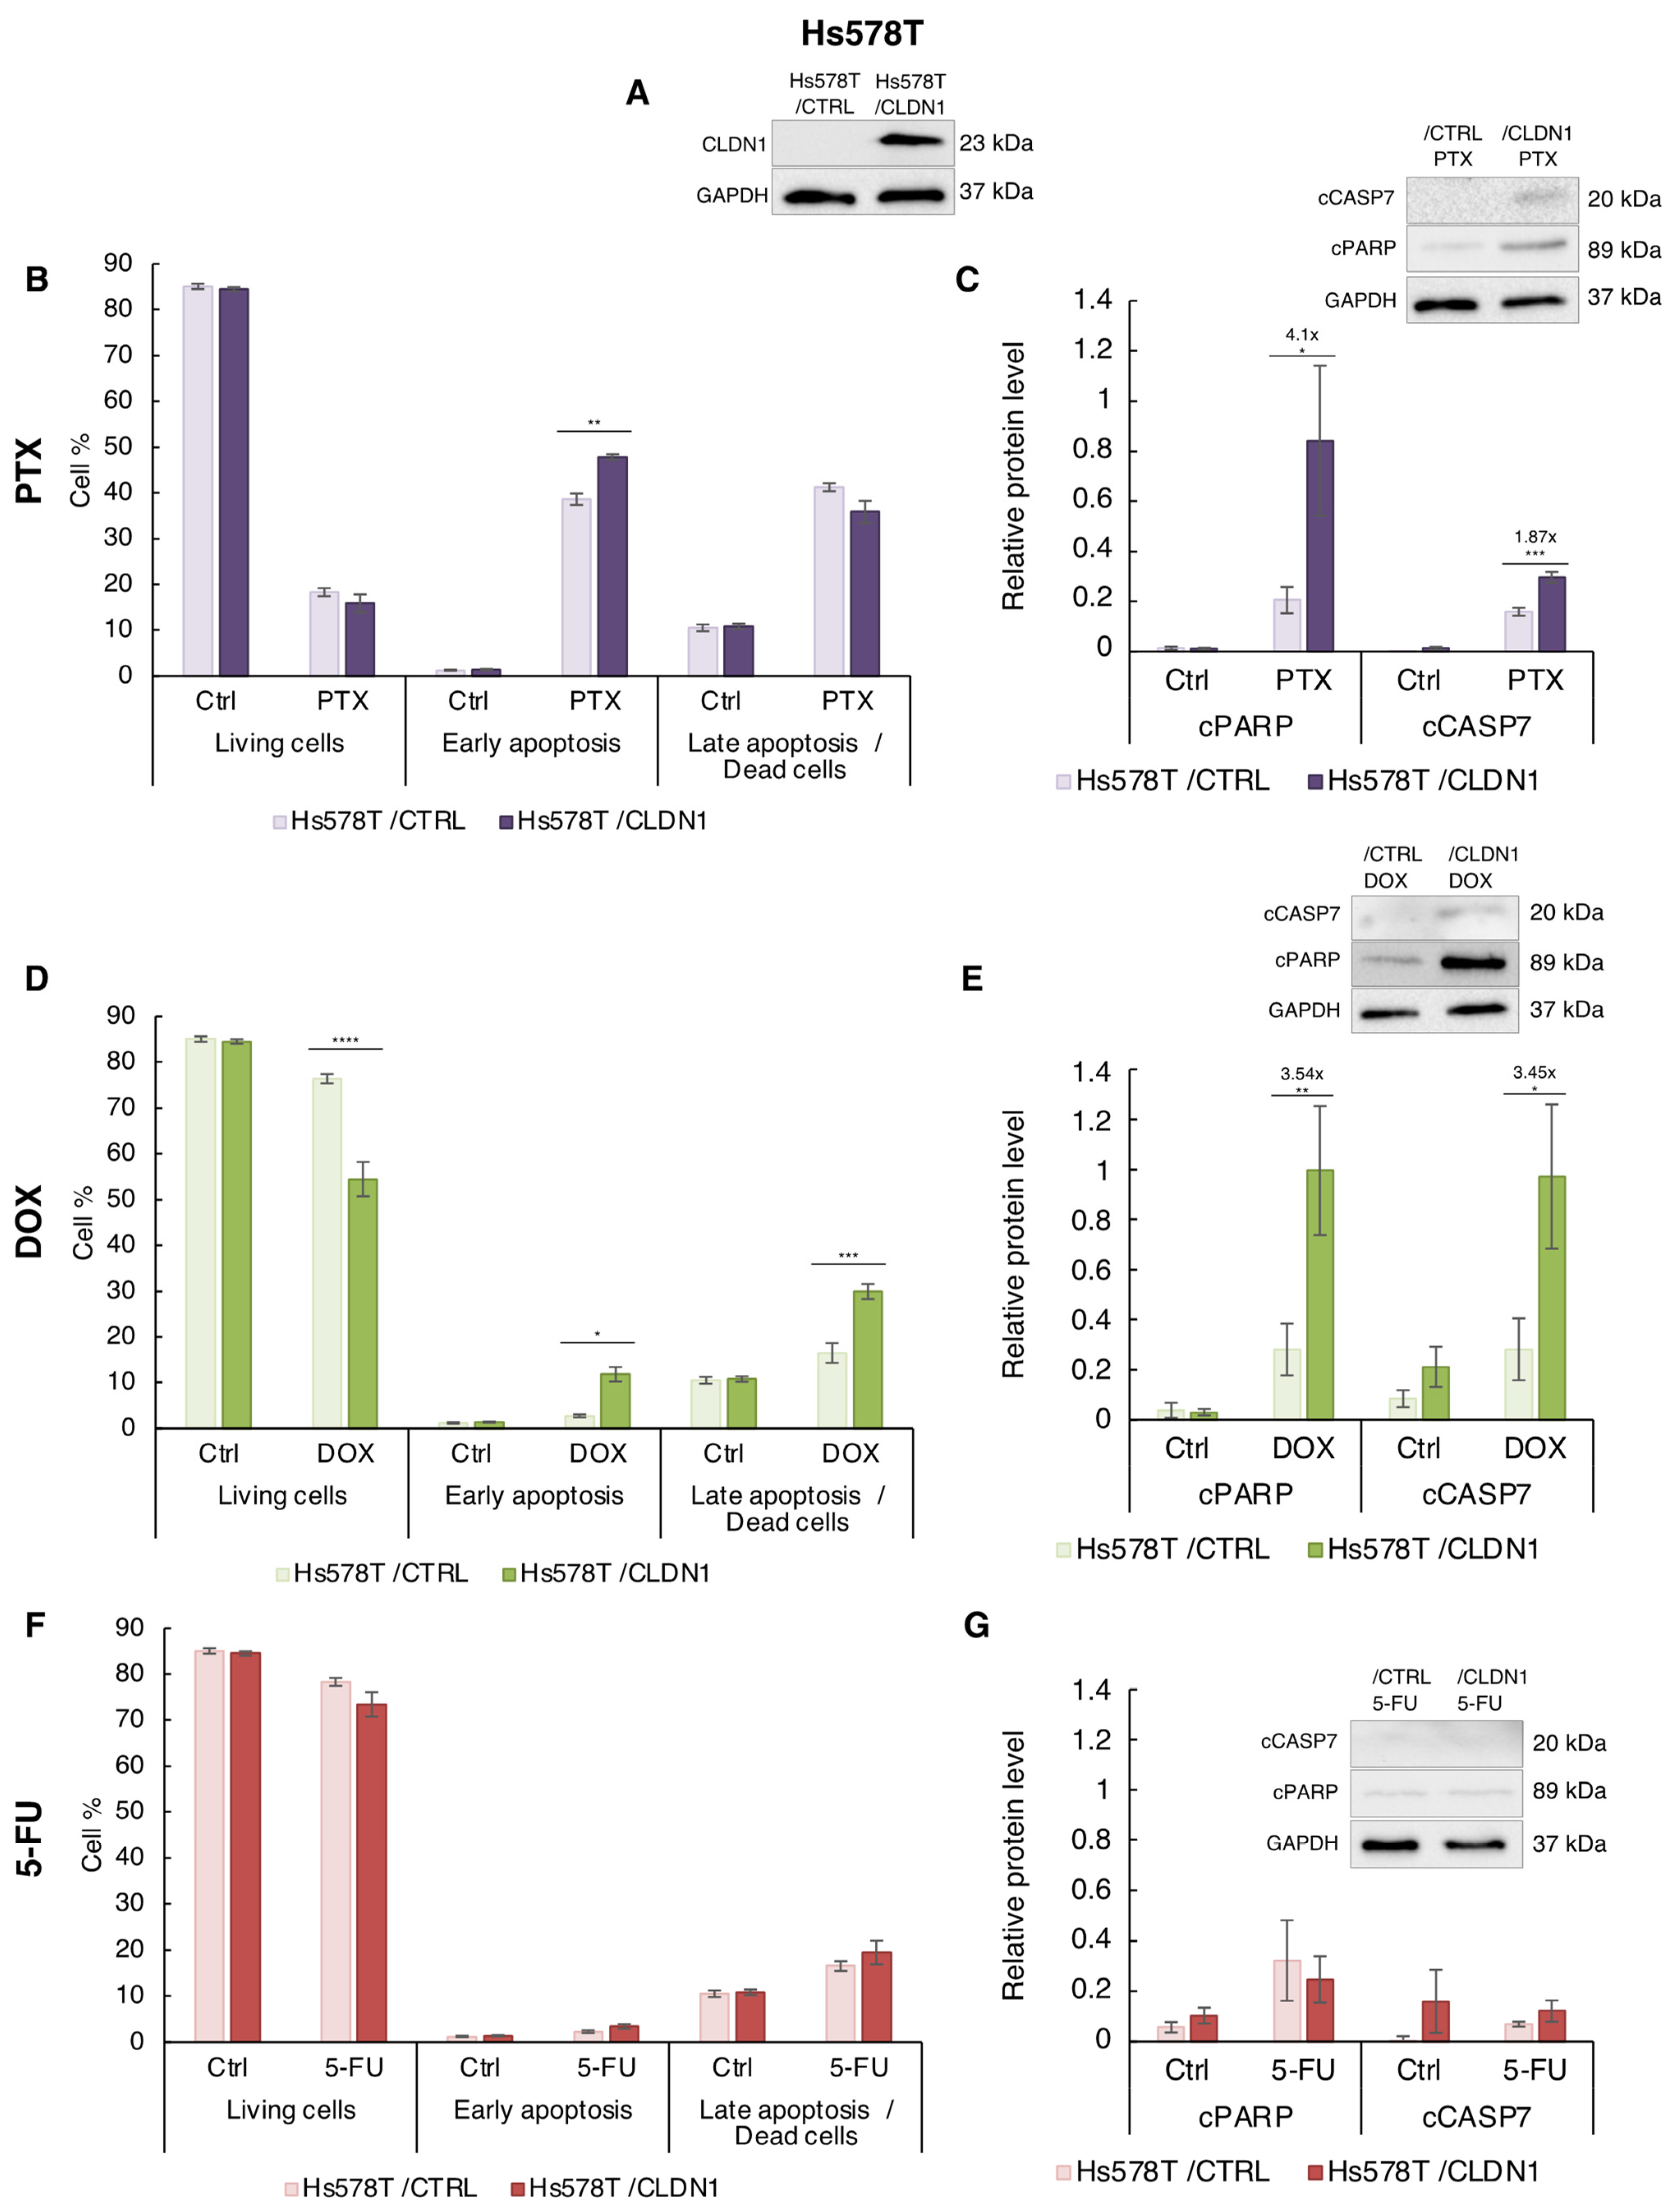
3.4. Ectopic CLDN1 Expression Sensitizes Hs578T Cells to PTX and DOX but Not to 5-FU
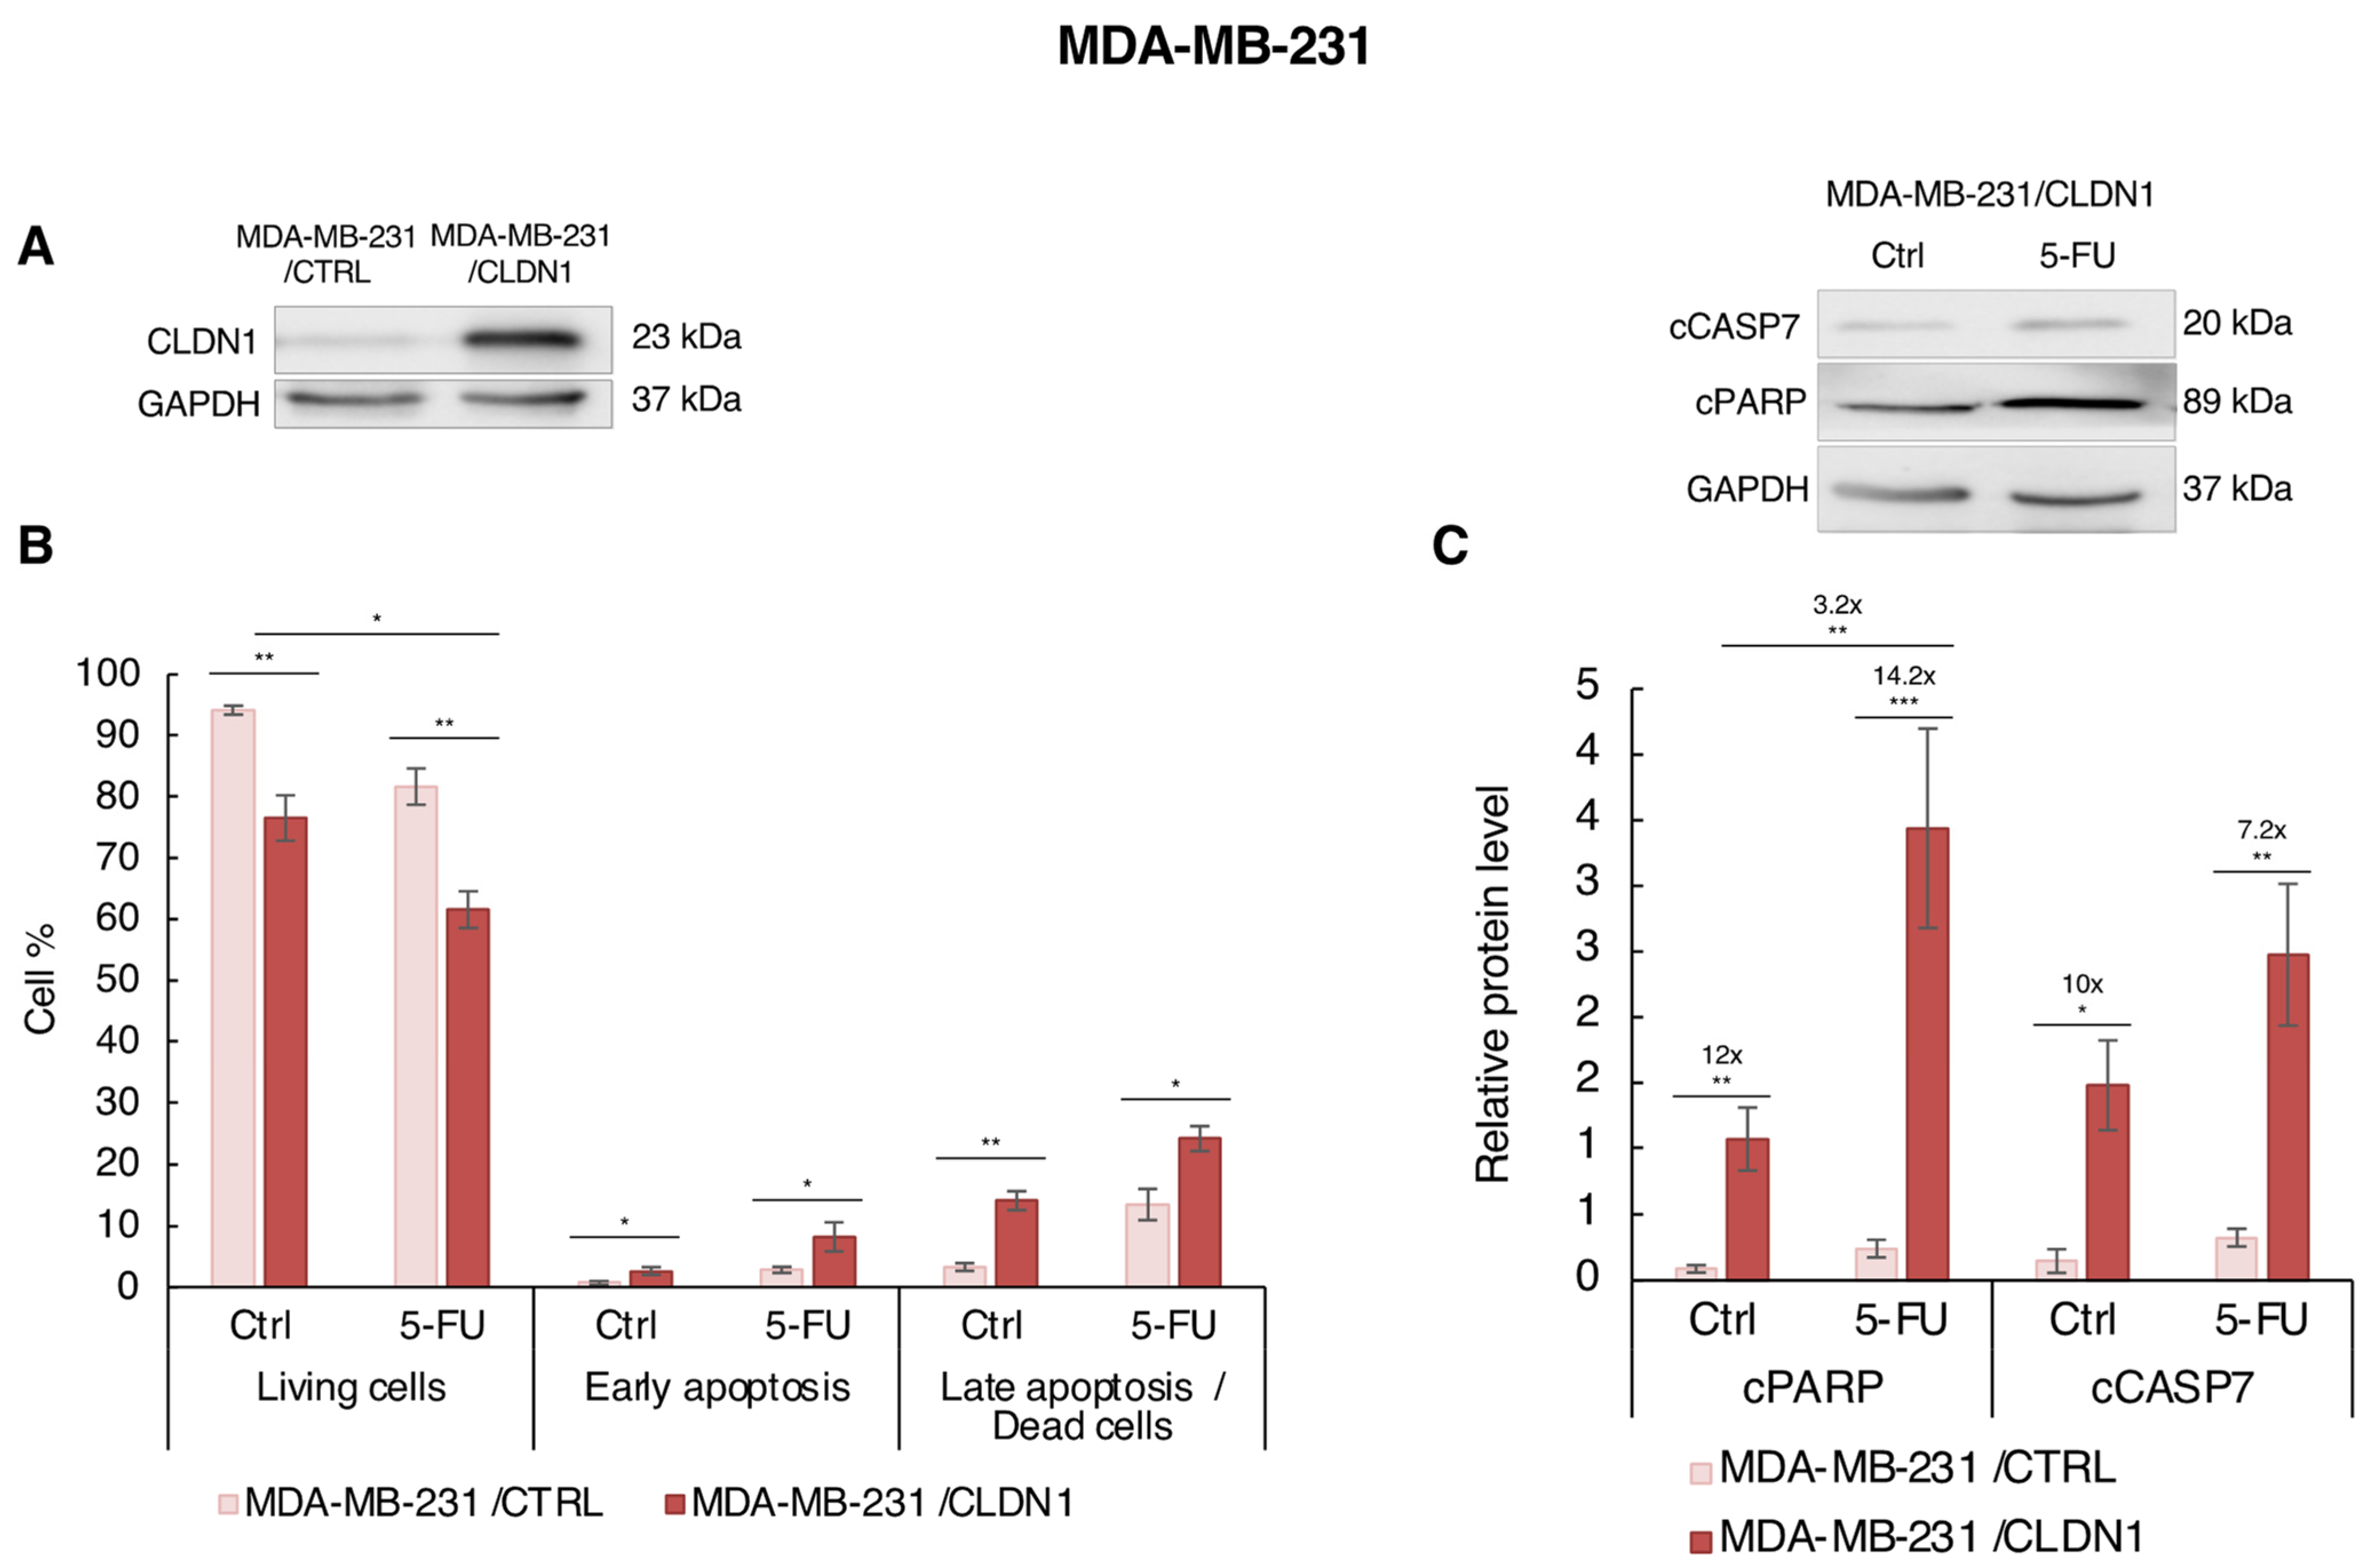
3.5. Ectopic CLDN1 Expression Sensitizes MDA-MB-231 Cells to 5-FU t
4. Discussion
5. Conclusions
Supplementary Materials
Author Contributions
Funding
Institutional Review Board Statement
Informed Consent Statement
Data Availability Statement
Acknowledgments
Conflicts of Interest
References
- Foulkes, W.D.; Smith, I.E.; Reis-Filho, J.S. Triple-Negative Breast Cancer. N. Engl. J. Med. 2010, 363, 1938–1948. [Google Scholar] [CrossRef] [PubMed]
- Dent, R.; Trudeau, M.; Pritchard, K.I.; Hanna, W.M.; Kahn, H.K.; Sawka, C.A.; Lickley, L.A.; Rawlinson, E.; Sun, P.; Narod, S.A. Triple-Negative Breast Cancer: Clinical Features and Patterns of Recurrence. Clin. Cancer Res. 2007, 13, 4429–4434. [Google Scholar] [CrossRef] [PubMed]
- Kennecke, H.; Yerushalmi, R.; Woods, R.; Cheang, M.C.U.; Voduc, D.; Speers, C.H.; Nielsen, T.O.; Gelmon, K. Metastatic Behavior of Breast Cancer Subtypes. JCO 2010, 28, 3271–3277. [Google Scholar] [CrossRef] [PubMed]
- Al-Mahmood, S.; Sapiezynski, J.; Garbuzenko, O.B.; Minko, T. Metastatic and Triple-Negative Breast Cancer: Challenges and Treatment Options. Drug Deliv. Transl. Res. 2018, 8, 1483–1507. [Google Scholar] [CrossRef] [PubMed]
- Liedtke, C.; Mazouni, C.; Hess, K.R.; André, F.; Tordai, A.; Mejia, J.A.; Symmans, W.F.; Gonzalez-Angulo, A.M.; Hennessy, B.; Green, M.; et al. Response to Neoadjuvant Therapy and Long-Term Survival in Patients with Triple-Negative Breast Cancer. JCO 2008, 26, 1275–1281. [Google Scholar] [CrossRef] [PubMed]
- Von Minckwitz, G.; Untch, M.; Blohmer, J.-U.; Costa, S.D.; Eidtmann, H.; Fasching, P.A.; Gerber, B.; Eiermann, W.; Hilfrich, J.; Huober, J.; et al. Definition and Impact of Pathologic Complete Response on Prognosis after Neoadjuvant Chemotherapy in Various Intrinsic Breast Cancer Subtypes. J. Clin. Oncol. 2012, 30, 1796–1804. [Google Scholar] [CrossRef]
- Lu, S.; Singh, K.; Mangray, S.; Tavares, R.; Noble, L.; Resnick, M.B.; Yakirevich, E. Claudin Expression in High-Grade Invasive Ductal Carcinoma of the Breast: Correlation with the Molecular Subtype. Mod. Pathol. 2013, 26, 485–495. [Google Scholar] [CrossRef] [PubMed]
- Tőkés, A.-M.; Kulka, J.; Paku, S.; Szik, Á.; Páska, C.; Novák, P.K.; Szilák, L.; Kiss, A.; Bögi, K.; Schaff, Z. Claudin-1, -3 and -4 Proteins and MRNA Expression in Benign and Malignant Breast Lesions: A Research Study. Breast Cancer Res. 2005, 7, R296. [Google Scholar] [CrossRef] [PubMed]
- Bhat, A.A.; Syed, N.; Therachiyil, L.; Nisar, S.; Hashem, S.; Macha, M.A.; Yadav, S.K.; Krishnankutty, R.; Muralitharan, S.; Al-Naemi, H.; et al. Claudin-1, A Double-Edged Sword in Cancer. Int. J. Mol. Sci. 2020, 21, 569. [Google Scholar] [CrossRef]
- Furuse, M.; Sasaki, H.; Fujimoto, K.; Tsukita, S. A Single Gene Product, Claudin-1 or -2, Reconstitutes Tight Junction Strands and Recruits Occludin in Fibroblasts. J. Cell Biol. 1998, 143, 391–401. [Google Scholar] [CrossRef]
- Saitou, M.; Fujimoto, K.; Doi, Y.; Itoh, M.; Fujimoto, T.; Furuse, M.; Takano, H.; Noda, T.; Tsukita, S. Occludin-Deficient Embryonic Stem Cells Can Differentiate into Polarized Epithelial Cells Bearing Tight Junctions. J. Cell Biol. 1998, 141, 397–408. [Google Scholar] [CrossRef] [PubMed]
- Ma, F.; Ding, X.; Fan, Y.; Ying, J.; Zheng, S.; Lu, N.; Xu, B. A CLDN1-Negative Phenotype Predicts Poor Prognosis in Triple-Negative Breast Cancer. PLoS ONE 2014, 9, e112765. [Google Scholar] [CrossRef]
- Morohashi, S.; Kusumi, T.; Sato, F.; Odagiri, H.; Chiba, H.; Yoshihara, S.; Hakamada, K.; Sasaki, M.; Kijima, H. Decreased Expression of Claudin-1 Correlates with Recurrence Status in Breast Cancer. Int. J. Mol. Med. 2007, 20, 139–143. [Google Scholar] [CrossRef] [PubMed]
- Szasz, A.M.; Tokes, A.M.; Micsinai, M.; Krenacs, T.; Jakab, C.; Lukacs, L.; Nemeth, Z.; Baranyai, Z.; Dede, K.; Madaras, L.; et al. Prognostic Significance of Claudin Expression Changes in Breast Cancer with Regional Lymph Node Metastasis. Clin. Exp. Metastasis 2011, 28, 55–63. [Google Scholar] [CrossRef] [PubMed]
- Zhang, J.; Du, C.; Zhang, L.; Wang, Y.; Zhang, Y.; Li, J. LncRNA GSEC Promotes the Progression of Triple Negative Breast Cancer (TNBC) by Targeting the MiR-202-5p/AXL Axis. Onco Targets 2021, 14, 2747–2759. [Google Scholar] [CrossRef] [PubMed]
- Zhou, B.; Moodie, A.; Blanchard, A.; Leygue, E.; Myal, Y. Claudin 1 in Breast Cancer: New Insights. JCM 2015, 4, 1960–1976. [Google Scholar] [CrossRef] [PubMed]
- Zhang, K.; Yao, H.-P.; Wang, M.-H. Activation of RON Differentially Regulates Claudin Expression and Localization: Role of Claudin-1 in RON-Mediated Epithelial Cell Motility. Carcinogenesis 2007, 29, 552–559. [Google Scholar] [CrossRef] [PubMed][Green Version]
- Chiang, S.-K.; Chang, W.-C.; Chen, S.-E.; Chang, L.-C. DOCK1 Regulates Growth and Motility through the RRP1B-Claudin-1 Pathway in Claudin-Low Breast Cancer Cells. Cancers 2019, 11, 1762. [Google Scholar] [CrossRef] [PubMed]
- Geoffroy, M.; Kleinclauss, A.; Kuntz, S.; Grillier-Vuissoz, I. Claudin 1 Inhibits Cell Migration and Increases Intercellular Adhesion in Triple-Negative Breast Cancer Cell Line. Mol. Biol. Rep. 2020, 47, 7643–7653. [Google Scholar] [CrossRef]
- Geoffroy, M.; Kleinclauss, A.; Grandemange, S.; Hupont, S.; Boisbrun, M.; Flament, S.; Grillier-Vuissoz, I.; Kuntz, S. Pro-Apoptotic Effect of Δ2-TGZ in “Claudin-1-Low” Triple-Negative Breast Cancer Cells: Involvement of Claudin-1. Breast Cancer Res. Treat. 2017, 165, 517–527. [Google Scholar] [CrossRef] [PubMed]
- Hoevel, T.; Macek, R.; Swisshelm, K.; Kubbies, M. Reexpression of the TJ Protein CLDN1 Induces Apoptosis in Breast Tumor Spheroids. Int. J. Cancer 2004, 108, 374–383. [Google Scholar] [CrossRef] [PubMed]
- Tong, H.; Li, T.; Qiu, W.; Zhu, Z. Claudin-1 Silencing Increases Sensitivity of Liver Cancer HepG2 Cells to 5-Fluorouracil by Inhibiting Autophagy. Oncol. Lett. 2019, 18, 5709–5716. [Google Scholar] [CrossRef] [PubMed]
- Zhao, Z.; Li, J.; Jiang, Y.; Xu, W.; Li, X.; Jing, W. CLDN1 Increases Drug Resistance of Non-Small Cell Lung Cancer by Activating Autophagy via Up-Regulation of ULK1 Phosphorylation. Med. Sci. Monit. 2017, 23, 2906–2916. [Google Scholar] [CrossRef] [PubMed]
- Fortier, A.-M.; Asselin, E.; Cadrin, M. Keratin 8 and 18 Loss in Epithelial Cancer Cells Increases Collective Cell Migration and Cisplatin Sensitivity through Claudin1 Up-Regulation. J. Biol. Chem. 2013, 288, 11555–11571. [Google Scholar] [CrossRef] [PubMed]
- Wu, J.-E.; Wu, Y.-Y.; Tung, C.-H.; Tsai, Y.-T.; Chen, H.-Y.; Chen, Y.-L.; Hong, T.-M. DNA Methylation Maintains the CLDN1-EPHB6-SLUG Axis to Enhance Chemotherapeutic Efficacy and Inhibit Lung Cancer Progression. Theranostics 2020, 10, 8903–8923. [Google Scholar] [CrossRef]
- Zhou, B.; Blanchard, A.; Wang, N.; Ma, X.; Han, J.; Schroedter, I.; Leygue, E.; Myal, Y. Claudin 1 Promotes Migration and Increases Sensitivity to Tamoxifen and Anticancer Drugs in Luminal-like Human Breast Cancer Cells MCF7. Cancer Investig. 2015, 33, 429–439. [Google Scholar] [CrossRef]
- Jézéquel, P.; Gouraud, W.; Ben Azzouz, F.; Guérin-Charbonnel, C.; Juin, P.P.; Lasla, H.; Campone, M. Bc-GenExMiner 4.5: New Mining Module Computes Breast Cancer Differential Gene Expression Analyses. Database 2021, 2021, baab007. [Google Scholar] [CrossRef] [PubMed]
- Győrffy, B. Survival Analysis across the Entire Transcriptome Identifies Biomarkers with the Highest Prognostic Power in Breast Cancer. Comput. Struct. Biotechnol. J. 2021, 19, 4101–4109. [Google Scholar] [CrossRef] [PubMed]
- Ősz, Á.; Lánczky, A.; Győrffy, B. Survival Analysis in Breast Cancer Using Proteomic Data from Four Independent Datasets. Sci. Rep. 2021, 11, 16787. [Google Scholar] [CrossRef] [PubMed]
- Longley, D.B.; Harkin, D.P.; Johnston, P.G. 5-Fluorouracil: Mechanisms of Action and Clinical Strategies. Nat. Rev. Cancer 2003, 3, 330–338. [Google Scholar] [CrossRef] [PubMed]
- Meredith, A.-M.; Dass, C.R. Increasing Role of the Cancer Chemotherapeutic Doxorubicin in Cellular Metabolism. J. Pharm. Pharmacol. 2016, 68, 729–741. [Google Scholar] [CrossRef] [PubMed]
- Xiao, H.; Verdier-Pinard, P.; Fernandez-Fuentes, N.; Burd, B.; Angeletti, R.; Fiser, A.; Horwitz, S.B.; Orr, G.A. Insights into the Mechanism of Microtubule Stabilization by Taxol. Proc. Natl. Acad. Sci. USA 2006, 103, 10166–10173. [Google Scholar] [CrossRef]
- Liu, X.; He, M.; Li, L.; Wang, X.; Han, S.; Zhao, J.; Dong, Y.; Ahmad, M.; Li, L.; Zhang, X.; et al. EMT and Cancer Cell Stemness Associated With Chemotherapeutic Resistance in Esophageal Cancer. Front. Oncol. 2021, 11, 672222. [Google Scholar] [CrossRef] [PubMed]
- Noguchi, S.; Takagi, A.; Tanaka, T.; Takahashi, Y.; Pan, X.; Kibayashi, Y.; Mizokami, R.; Nishimura, T.; Tomi, M. Fluorouracil Uptake in Triple-negative Breast Cancer Cells: Negligible Contribution of Equilibrative Nucleoside Transporters 1 and 2. Biopharm. Drug Dispos. 2021, 42, 85–93. [Google Scholar] [CrossRef] [PubMed]
- Liu, A.; Cerniglia, G.J.; Bernhard, E.J.; Prendergast, G.C. RhoB Is Required to Mediate Apoptosis in Neoplastically Transformed Cells after DNA Damage. Proc. Natl. Acad. Sci. USA 2001, 98, 6192–6197. [Google Scholar] [CrossRef]
- Zhou, J.; Zhu, Y.; Zhang, G.; Liu, N.; Sun, L.; Liu, M.; Qiu, M.; Luo, D.; Tang, Q.; Liao, Z.; et al. A Distinct Role of RhoB in Gastric Cancer Suppression. Int. J. Cancer 2011, 128, 1057–1068. [Google Scholar] [CrossRef]
- Fallahi, H.; Godini, R. System-Level Responses to Cisplatin in pro-Apoptotic Stages of Breast Cancer MCF-7 Cell Line. Comput. Biol. Chem. 2019, 83, 107155. [Google Scholar] [CrossRef] [PubMed]
- Skálová, H.; Hájková, N.; Majerová, B.; Bártů, M.; Povýšil, C.; Tichá, I. Impact of Chemotherapy on the Expression of Claudins and Cadherins in Invasive Breast Cancer. Exp. Med. 2019, 18, 3014–3024. [Google Scholar] [CrossRef]
- Martínez-Estrada, O.M.; Cullerés, A.; Soriano, F.X.; Peinado, H.; Bolós, V.; Martínez, F.O.; Reina, M.; Cano, A.; Fabre, M.; Vilaró, S. The Transcription Factors Slug and Snail Act as Repressors of Claudin-1 Expression in Epithelial Cells 1. Biochem. J. 2006, 394, 449–457. [Google Scholar] [CrossRef]
- Zheng, Q.; Wang, C.; Wang, L.; Zhang, D.; Liu, N.; Ming, X.; Zhou, H.; Guli, Q.; Liu, Y. Interaction with SP1, but Not Binding to the E-Box Motifs, Is Responsible for BHLHE40/DEC1-Induced Transcriptional Suppression of CLDN1 and Cell Invasion in MCF-7 Cells. Mol. Carcinog. 2018, 57, 1116–1129. [Google Scholar] [CrossRef]
- Yang, X.; Shang, P.; Yu, B.; Jin, Q.; Liao, J.; Wang, L.; Ji, J.; Guo, X. Combination Therapy with MiR34a and Doxorubicin Synergistically Inhibits Dox-Resistant Breast Cancer Progression via down-Regulation of Snail through Suppressing Notch/NF-ΚB and RAS/RAF/MEK/ERK Signaling Pathway. Acta Pharm. Sin. B 2021, 11, 2819–2834. [Google Scholar] [CrossRef] [PubMed]
- Marinello, P.C.; Panis, C.; Silva, T.N.X.; Binato, R.; Abdelhay, E.; Rodrigues, J.A.; Mencalha, A.L.; Lopes, N.M.D.; Luiz, R.C.; Cecchini, R.; et al. Metformin Prevention of Doxorubicin Resistance in MCF-7 and MDA-MB-231 Involves Oxidative Stress Generation and Modulation of Cell Adaptation Genes. Sci. Rep. 2019, 9, 5864. [Google Scholar] [CrossRef] [PubMed]
- Krämer, F.; White, K.; Kubbies, M.; Swisshelm, K.; Weber, B.H.F. Genomic Organization of Claudin-1 and Its Assessment in Hereditary and Sporadic Breast Cancer. Hum. Genet. 2000, 107, 249–256. [Google Scholar] [CrossRef] [PubMed]
- Di Cello, F.; Cope, L.; Li, H.; Jeschke, J.; Wang, W.; Baylin, S.B.; Zahnow, C.A. Methylation of the Claudin 1 Promoter Is Associated with Loss of Expression in Estrogen Receptor Positive Breast Cancer. PLoS ONE 2013, 8, e68630. [Google Scholar] [CrossRef] [PubMed]


Publisher’s Note: MDPI stays neutral with regard to jurisdictional claims in published maps and institutional affiliations. |
© 2022 by the authors. Licensee MDPI, Basel, Switzerland. This article is an open access article distributed under the terms and conditions of the Creative Commons Attribution (CC BY) license (https://creativecommons.org/licenses/by/4.0/).
Share and Cite
Lemesle, M.; Geoffroy, M.; Alpy, F.; Tomasetto, C.-L.; Kuntz, S.; Grillier-Vuissoz, I. CLDN1 Sensitizes Triple-Negative Breast Cancer Cells to Chemotherapy. Cancers 2022, 14, 5026. https://doi.org/10.3390/cancers14205026
Lemesle M, Geoffroy M, Alpy F, Tomasetto C-L, Kuntz S, Grillier-Vuissoz I. CLDN1 Sensitizes Triple-Negative Breast Cancer Cells to Chemotherapy. Cancers. 2022; 14(20):5026. https://doi.org/10.3390/cancers14205026
Chicago/Turabian StyleLemesle, Marine, Marine Geoffroy, Fabien Alpy, Catherine-Laure Tomasetto, Sandra Kuntz, and Isabelle Grillier-Vuissoz. 2022. "CLDN1 Sensitizes Triple-Negative Breast Cancer Cells to Chemotherapy" Cancers 14, no. 20: 5026. https://doi.org/10.3390/cancers14205026
APA StyleLemesle, M., Geoffroy, M., Alpy, F., Tomasetto, C.-L., Kuntz, S., & Grillier-Vuissoz, I. (2022). CLDN1 Sensitizes Triple-Negative Breast Cancer Cells to Chemotherapy. Cancers, 14(20), 5026. https://doi.org/10.3390/cancers14205026