
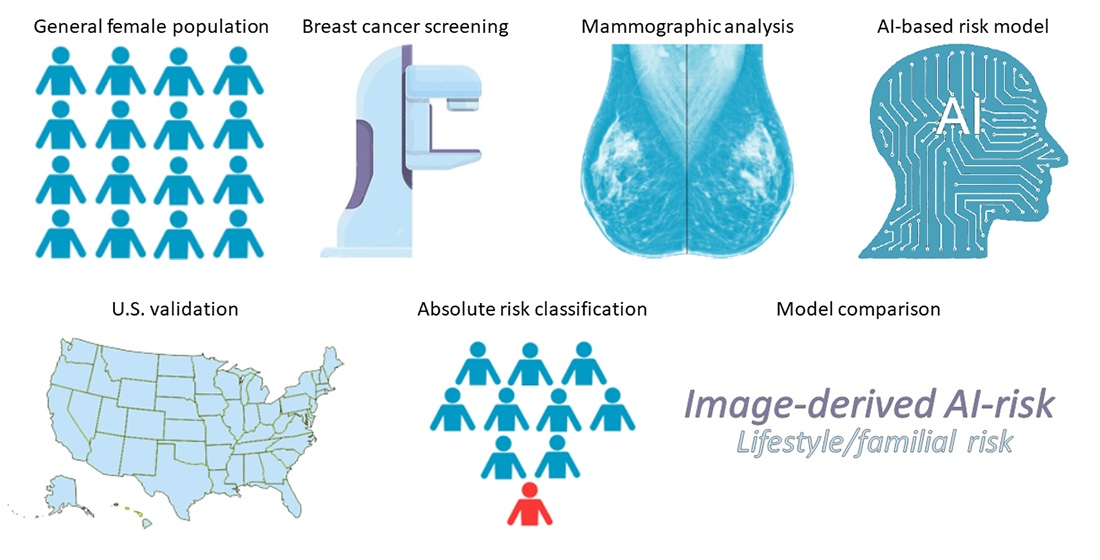
External Validation of a Mammography-Derived AI-Based Risk Model in a U.S. Breast Cancer Screening Cohort of White and Black Women

 ,
,  ,
,  , ,
, ,  , and
, and
Abstract
Simple Summary
Abstract

1. Introduction
2. Materials and Methods
2.1. Study Design and Data Acquisition
2.2. Short-Term Risk Assessment
2.3. Statistical Analysis
3. Results
3.1. Study Dataset Characteristics
3.2. External Validation of the AI Risk Model
3.3. Comparisons with the Gail Risk Model
3.4. Exploratory Analysis on Potential Effects of FFDM Views on AI Risk
4. Discussion
5. Conclusions
Supplementary Materials
Author Contributions
Funding
Institutional Review Board Statement
Informed Consent Statement
Data Availability Statement
Acknowledgments
Conflicts of Interest
References
- Pashayan, N.; Antoniou, A.C.; Ivanus, U.; Esserman, L.J.; Easton, D.F.; French, D.; Sroczynski, G.; Hall, P.; Cuzick, J.; Evans, D.G. Personalized early detection and prevention of breast cancer: ENVISION consensus statement. Nat. Rev. Clin. Oncol. 2020, 17, 687–705. [Google Scholar] [CrossRef]
- McCormack, V.A.; dos Santos Silva, I. Breast density and parenchymal patterns as markers of breast cancer risk: A meta-analysis. Cancer Epidemiol. Biomark. Prev. 2006, 15, 1159–1169. [Google Scholar] [CrossRef] [PubMed]
- Brentnall, A.R.; Cuzick, J.; Buist, D.S.; Bowles, E.J.A. Long-term accuracy of breast cancer risk assessment combining classic risk factors and breast density. JAMA Oncol. 2018, 4, e180174. [Google Scholar] [CrossRef]
- Boyd, N.F.; Guo, H.; Martin, L.J.; Sun, L.; Stone, J.; Fishell, E.; Jong, R.A.; Hislop, G.; Chiarelli, A.; Minkin, S. Mammographic density and the risk and detection of breast cancer. N. Engl. J. Med. 2007, 356, 227–236. [Google Scholar] [CrossRef] [PubMed]
- Are You Dense Advocacy. D.E.N.S.E. State Efforts. Available online: http://areyoudenseadvocacy.org/ (accessed on 1 June 2021).
- Vilmun, B.M.; Vejborg, I.; Lynge, E.; Lillholm, M.; Nielsen, M.; Nielsen, M.B.; Carlsen, J.F. Impact of adding breast density to breast cancer risk models: A systematic review. Eur. J. Radiol. 2020, 127, 109019. [Google Scholar] [CrossRef]
- Brentnall, A.R.; Cohn, W.F.; Knaus, W.A.; Yaffe, M.J.; Cuzick, J.; Harvey, J.A. A case-control study to add volumetric or clinical mammographic density into the Tyrer-Cuzick breast cancer risk model. J. Breast Imaging 2019, 1, 99–106. [Google Scholar] [CrossRef] [PubMed]
- Gastounioti, A.; Conant, E.F.; Kontos, D. Beyond breast density: A review on the advancing role of parenchymal texture analysis in breast cancer risk assessment. Breast Cancer Res. 2016, 18, 91. [Google Scholar] [CrossRef]
- Gastounioti, A.; Desai, S.; Ahluwalia, V.S.; Conant, E.F.; Kontos, D. Artificial intelligence in mammographic phenotyping of breast cancer risk: A narrative review. Breast Cancer Res. 2022, 24, 1–12. [Google Scholar] [CrossRef]
- Lamb, L.R.; Lehman, C.D.; Gastounioti, A.; Conant, E.F.; Bahl, M. Artificial Intelligence (AI) for Screening Mammography, From the AI Special Series on AI Applications. Am. J. Roentgenol. 2022, 219, 369–380. [Google Scholar] [CrossRef]
- Yoon, J.H.; Kim, E.-K. Deep Learning-Based Artificial Intelligence for Mammography. Korean J. Radiol. 2021, 22, 1225. [Google Scholar] [CrossRef]
- Destounis, S.V.; Santacroce, A.; Arieno, A. Update on breast density, risk estimation, and supplemental screening. Am. J. Roentgenol. 2020, 214, 296–305. [Google Scholar] [CrossRef] [PubMed]
- Sechopoulos, I.; Teuwen, J.; Mann, R. Artificial intelligence for breast cancer detection in mammography and digital breast tomosynthesis: State of the art. Semin. Cancer Biol. 2021, 72, 214–225. [Google Scholar] [CrossRef] [PubMed]
- Geras, K.J.; Mann, R.M.; Moy, L. Artificial intelligence for mammography and digital breast tomosynthesis: Current concepts and future perspectives. Radiology 2019, 293, 246–259. [Google Scholar] [CrossRef] [PubMed]
- Kaushal, A.; Altman, R.; Langlotz, C. Geographic distribution of US cohorts used to train deep learning algorithms. Jama 2020, 324, 1212–1213. [Google Scholar] [CrossRef]
- Zou, J.; Schiebinger, L. Ensuring that biomedical AI benefits diverse populations. EBioMedicine 2021, 67, 103358. [Google Scholar] [CrossRef]
- Eriksson, M.; Czene, K.; Strand, F.; Zackrisson, S.; Lindholm, P.; Lång, K.; Förnvik, D.; Sartor, H.; Mavaddat, N.; Easton, D. Identification of women at high risk of breast cancer who need supplemental screening. Radiology 2020, 297, 327–333. [Google Scholar] [CrossRef]
- Eriksson, M.; Li, J.; Leifland, K.; Czene, K.; Hall, P. A comprehensive tool for measuring mammographic density changes over time. Breast Cancer Res. Treat. 2018, 169, 371–379. [Google Scholar] [CrossRef]
- National Collaborating Centre for Cancer. Familial Breast Cancer: Classification and Care of People at Risk of Familial Breast Cancer and Management of Breast Cancer and Related Risks in People with a Family History of Breast Cancer; National Collaborating Centre for Cancer: Cardiff, UK, 2013. [Google Scholar]
- Faraggi, D. Adjusting receiver operating characteristic curves and related indices for covariates. J. R. Stat. Soc. Ser. D (Stat.) 2003, 52, 179–192. [Google Scholar] [CrossRef]
- Gail, M.H.; Brinton, L.A.; Byar, D.P.; Corle, D.K.; Green, S.B.; Schairer, C.; Mulvihill, J.J. Projecting individualized probabilities of developing breast cancer for white females who are being examined annually. J. Natl. Cancer Inst. 1989, 81, 1879–1886. [Google Scholar] [CrossRef]
- Tyrer, J.; Duffy, S.W.; Cuzick, J. A breast cancer prediction model incorporating familial and personal risk factors. Stat. Med. 2004, 23, 1111–1130. [Google Scholar] [CrossRef]
- Castells, X.; Tora-Rocamora, I.; Posso, M.; Roman, M.; Vernet-Tomas, M.; Rodriguez-Arana, A.; Domingo, L.; Vidal, C.; Bare, M.; Ferrer, J.; et al. Risk of Breast Cancer in Women with False-Positive Results according to Mammographic Features. Radiology 2016, 280, 379–386. [Google Scholar] [CrossRef] [PubMed]
- McKinney, S.M.; Sieniek, M.; Godbole, V.; Godwin, J.; Antropova, N.; Ashrafian, H.; Back, T.; Chesus, M.; Corrado, G.S.; Darzi, A.; et al. International evaluation of an AI system for breast cancer screening. Nature 2020, 577, 89–94. [Google Scholar] [CrossRef] [PubMed]
- Yala, A.; Mikhael, P.G.; Strand, F.; Lin, G.; Smith, K.; Wan, Y.-L.; Lamb, L.; Hughes, K.; Lehman, C.; Barzilay, R. Toward robust mammography-based models for breast cancer risk. Sci. Transl. Med. 2021, 13, eaba4373. [Google Scholar] [CrossRef] [PubMed]
- McCarthy, A.M.; Liu, Y.; Ehsan, S.; Guan, Z.; Liang, J.; Huang, T.; Hughes, K.; Semine, A.; Kontos, D.; Conant, E. Validation of Breast Cancer Risk Models by Race/Ethnicity, Family History and Molecular Subtypes. Cancers 2021, 14, 45. [Google Scholar] [CrossRef] [PubMed]
- Kerlikowske, K.; Zhu, W.; Tosteson, A.N.; Sprague, B.L.; Tice, J.A.; Lehman, C.D.; Miglioretti, D.L. Identifying women with dense breasts at high risk for interval cancer: A cohort study. Ann. Intern. Med. 2015, 162, 673–681. [Google Scholar] [CrossRef] [PubMed]
- Porter, P.L.; El-Bastawissi, A.Y.; Mandelson, M.T.; Lin, M.G.; Khalid, N.; Watney, E.A.; Cousens, L.; White, D.; Taplin, S.; White, E. Breast tumor characteristics as predictors of mammographic detection: Comparison of interval-and screen-detected cancers. J. Natl. Cancer Inst. 1999, 91, 2020–2028. [Google Scholar] [CrossRef]
- Lee, C.S.; Moy, L.; Hughes, D.; Golden, D.; Bhargavan-Chatfield, M.; Hemingway, J.; Geras, A.; Duszak, R.; Rosenkrantz, A.B. Radiologist Characteristics Associated with Interpretive Performance of Screening Mammography: A National Mammography Database (NMD) Study. Radiology 2021, 300, 518–528. [Google Scholar] [CrossRef]
- Peintinger, F. National Breast Screening Programs across Europe. Breast Care 2019, 14, 354–358. [Google Scholar] [CrossRef]
- Eriksson, M.; Destounis, S.; Czene, K.; Zeiberg, A.; Day, R.; Conant, E.F.; Schilling, K.; Hall, P. A risk model for digital breast tomosynthesis to predict breast cancer and guide clinical care. Sci. Transl. Med. 2022, 14, eabn3971. [Google Scholar] [CrossRef]


| Characteristic | Controls, n = 4963 1 | Cases, n = 176 1 | p-Value 2 |
|---|---|---|---|
| Age at screening | 56.49 (10.32) | 59.20 (11.06) | 0.002 |
| BMI at screening | 29.42 (7.47) | 29.37 (6.85) | 0.92 |
| Missing BMI | 165 | 10 | |
| Age > 50 (postmenopausal) | 3462/4963 (70%) | 132/176 (75%) | 0.14 |
| Race | 0.21 | ||
| White | 2069/4917 (42%) | 85/175 (49%) | |
| Black | 2521/4917 (51%) | 81/175 (46%) | |
| Other | 327/4917 (6.7%) | 9/175 (5.1%) | |
| Missing | 46 | 1 | |
| Age at first child | 0.70 | ||
| Nulliparous | 1102/4302 (26%) | 33/142 (23%) | |
| <20 | 830/4302 (19%) | 24/142 (17%) | |
| 20–24 | 859/4302 (20%) | 29/142 (20%) | |
| 25–29 | 811/4302 (19%) | 27/142 (19%) | |
| ≥30 | 700/4302 (16%) | 29/142 (20%) | |
| Missing | 661 | 34 | |
| Family history of breast cancer | <0.001 | ||
| No family history | 3985/4899 (81%) | 115/167 (69%) | |
| One 1st degree relative | 832/4899 (17%) | 39/167 (23%) | |
| ≥2 1st degree relatives | 82/4899 (1.7%) | 13/167 (7.8%) | |
| Missing | 64 | 9 | |
| Number of prior biopsies | <0.001 | ||
| 0 | 438/1227 (36%) | 4/46 (8.7%) | |
| 1 | 543/1227 (44%) | 24/46 (52%) | |
| 2 or more | 246/1227 (20%) | 18/46 (39%) | |
| Missing | 3736 | 130 | |
| Atypical hyperplasia | 31/350 (8.9%) | 3/17 (18%) | 0.20 |
| Missing | 4613 | 159 | |
| BI-RADS density | <0.001 | ||
| 1 | 623/4963 (13%) | 13/176 (7.4%) | |
| 2 | 2816/4963 (57%) | 84/176 (48%) | |
| 3 | 1424/4963 (29%) | 77/176 (44%) | |
| 4 | 100/4963 (2.0%) | 2/176 (1.1%) | |
| Characteristic | Controls, n = 4963 1 | Cases, n = 176 1 | p-Value 2 |
|---|---|---|---|
| Breast percent density 3 | 25.88 (20.42) | 31.59 (22.14) | <0.001 |
| Calcs malignancy | 0.13 (0.16) | 0.22 (0.22) | <0.001 |
| Masses malignancy | 0.18 (0.19) | 0.24 (0.24) | 0.001 |
| Calcs asymmetry | 0.03 (0.05) | 0.07 (0.09) | <0.001 |
| Masses asymmetry | 0.05 (0.06) | 0.08 (0.08) | <0.001 |
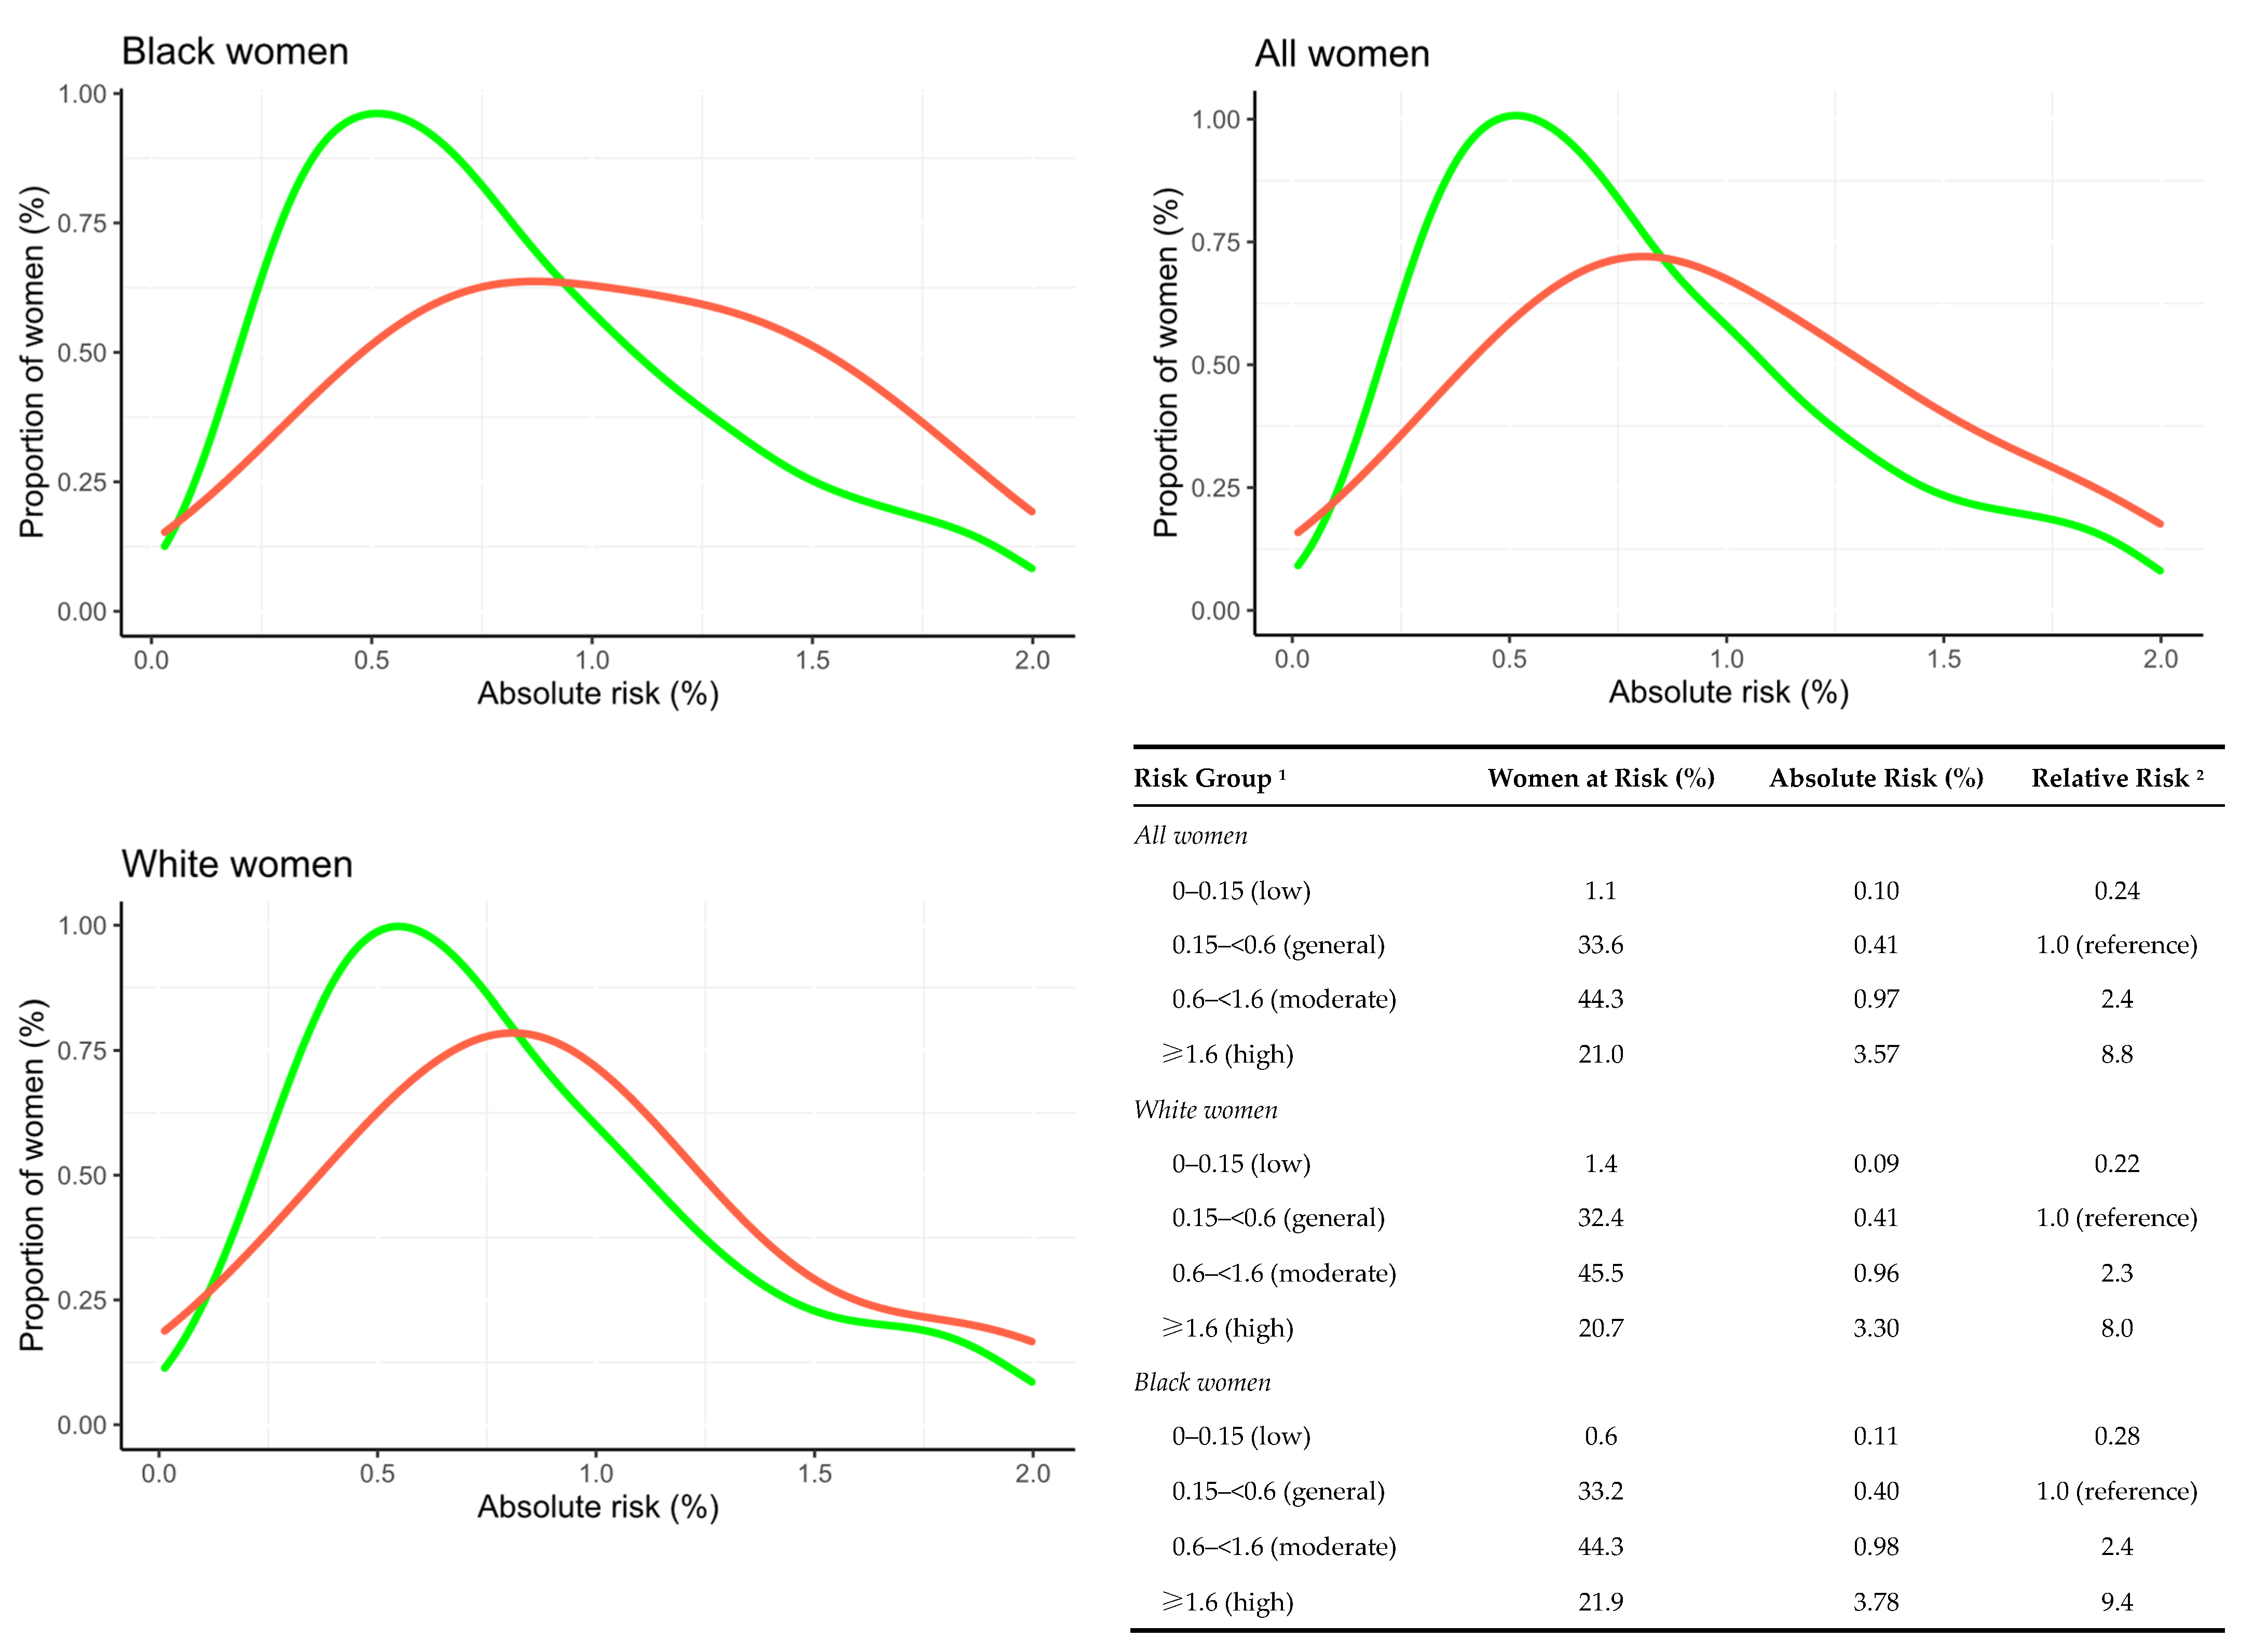
| AI absolute 2-year risk (%) | 0.79 (0.49, 1.35) | 1.39 (0.79, 2.96) | <0.001 |
| Gail absolute 5-year risk (%) 4 | 1.38 (1.01, 1.76) | 1.57 (1.24, 2.21) | <0.001 |
| Study Participant Characteristic Subgroup | All Women 1 | White Women | Black Women | p-Value 2 | ||||||
|---|---|---|---|---|---|---|---|---|---|---|
| n | AUC | 95% CI | n | AUC | 95% CI | n | AUC | 95% CI | ||
| Full cohort | 176/4963 | 0.68 | 0.64–0.72 | 85/2069 | 0.67 | 0.61–0.72 | 81/2521 | 0.70 | 0.65–0.76 | 0.20 |
| BI-RADS density | ||||||||||
| 1 + 2 | 97/3439 | 0.67 | 0.62–0.72 | 43/1276 | 0.66 | 0.58–0.73 | 48/1975 | 0.69 | 0.62–0.76 | 0.17 |
| 3 + 4 | 79/1524 | 0.69 | 0.62–0.74 | 42/793 | 0.68 | 0.60–0.76 | 33/546 | 0.71 | 0.61–0.80 | 0.69 |
| p-value 3 | 0.82 | 0.85 | 0.63 | |||||||
| Tumor invasiveness | ||||||||||
| Invasive | 128/4963 | 0.70 | 0.65–0.74 | 59/2069 | 0.68 | 0.60–0.75 | 62/2521 | 0.72 | 0.66–0.78 | 0.22 |
| In situ | 48/4963 | 0.63 | 0.55–0.70 | 26/2069 | 0.64 | 0.54–0.74 | 19/2521 | 0.65 | 0.52–0.77 | 0.74 |
| p-value 3 | 0.18 | 0.64 | 0.38 | |||||||
| Tumor size (invasive tumors only) | ||||||||||
| ≤10 mm | 68/4963 | 0.66 | 0.60–0.72 | 37/2069 | 0.63 | 0.53–0.72 | 25/2521 | 0.71 | 0.62–0.80 | 0.08 |
| >10–20 mm | 38/4963 | 0.73 | 0.64–0.81 | 16/2069 | 0.73 | 0.60–0.84 | 21/2521 | 0.71 | 0.59–0.82 | 0.68 |
| >20 mm | 22/4963 | 0.76 | 0.67–0.84 | 6/2069 | 0.79 | 0.62–0.91 | 16/2521 | 0.74 | 0.63–0.84 | 0.95 |
| p-value 3 | 0.26 | 0.11 | 0.71 | |||||||
| In situ grade | ||||||||||
| Low–intermediate | 35/4963 | 0.63 | 0.54–0.71 | 18/2069 | 0.65 | 0.53–0.77 | 15/2521 | 0.60 | 0.46–0.74 | 0.55 |
| High | 13/4963 | 0.64 | 0.48–0.78 | 8/2069 | 0.63 | 0.46–0.77 | 4/2521 | 0.83 | 0.66–0.95 | 0.12 |
| p-value 3 | 0.63 | 0.37 | 0.14 | |||||||
| Risk Model in Cancer Subgroups | All Women (166/4894) 1 | White Women (78/2037) | Black Women (80/2487) | p-Value 2 | |||
|---|---|---|---|---|---|---|---|
| AUC | 95% CI | AUC | 95% CI | AUC | 95% CI | ||
| All cancers | |||||||
| Gail 5-year risk | 0.55 | 0.50–0.60 | 0.61 | 0.54–0.68 | 0.48 | 0.41–0.54 | 0.12 |
| AI 2-year risk | 0.68 | 0.64–0.72 | 0.66 | 0.60–0.72 | 0.71 | 0.65–0.76 | 0.54 |
| p-value 3 | <0.01 | 0.38 | <0.01 | ||||
| Invasive cancers | |||||||
| Gail 5-year risk | 0.55 | 0.50–0.61 | 0.61 | 0.53–0.69 | 0.47 | 0.39–0.54 | 0.12 |
| AI 2-year risk | 0.70 | 0.65–0.75 | 0.67 | 0.59–0.74 | 0.73 | 0.66–0.79 | 0.56 |
| p-value 3 | <0.01 | 0.39 | <0.01 | ||||
Publisher’s Note: MDPI stays neutral with regard to jurisdictional claims in published maps and institutional affiliations. |
© 2022 by the authors. Licensee MDPI, Basel, Switzerland. This article is an open access article distributed under the terms and conditions of the Creative Commons Attribution (CC BY) license (https://creativecommons.org/licenses/by/4.0/).
Share and Cite
Gastounioti, A.; Eriksson, M.; Cohen, E.A.; Mankowski, W.; Pantalone, L.; Ehsan, S.; McCarthy, A.M.; Kontos, D.; Hall, P.; Conant, E.F. External Validation of a Mammography-Derived AI-Based Risk Model in a U.S. Breast Cancer Screening Cohort of White and Black Women. Cancers 2022, 14, 4803. https://doi.org/10.3390/cancers14194803
Gastounioti A, Eriksson M, Cohen EA, Mankowski W, Pantalone L, Ehsan S, McCarthy AM, Kontos D, Hall P, Conant EF. External Validation of a Mammography-Derived AI-Based Risk Model in a U.S. Breast Cancer Screening Cohort of White and Black Women. Cancers. 2022; 14(19):4803. https://doi.org/10.3390/cancers14194803
Chicago/Turabian StyleGastounioti, Aimilia, Mikael Eriksson, Eric A. Cohen, Walter Mankowski, Lauren Pantalone, Sarah Ehsan, Anne Marie McCarthy, Despina Kontos, Per Hall, and Emily F. Conant. 2022. "External Validation of a Mammography-Derived AI-Based Risk Model in a U.S. Breast Cancer Screening Cohort of White and Black Women" Cancers 14, no. 19: 4803. https://doi.org/10.3390/cancers14194803
APA StyleGastounioti, A., Eriksson, M., Cohen, E. A., Mankowski, W., Pantalone, L., Ehsan, S., McCarthy, A. M., Kontos, D., Hall, P., & Conant, E. F. (2022). External Validation of a Mammography-Derived AI-Based Risk Model in a U.S. Breast Cancer Screening Cohort of White and Black Women. Cancers, 14(19), 4803. https://doi.org/10.3390/cancers14194803