
Lymph Node Ratio as a Prognostic Factor in Neck Dissection in Oral Cancer Patients: A Systematic Review and Meta-Analysis

 , ,
, ,  and
and
Abstract
:Simple Summary
Abstract
1. Introduction
2. Materials and Methods
2.1. Protocol
2.2. Search Strategy and Eligibility of Studies
2.3. Data Collection and Effect Estimates
2.4. Statistical Analyses
2.5. Assessment of Study Quality and Publication Bias
3. Results
3.1. Description of Eligible Studies
3.2. Study Characteristics

| Study | Number of Patients | Age, Mean (Range) | Oral Cancer Subsite | Median Follow-Up, (Range) | Endpoints | LNR Cut-Off and Method of Determination | Median Nodes Removed (Lymph Node Yield, LNY) |
|---|---|---|---|---|---|---|---|
| Agarwal et al. (2019) [46] | 94 | 47, (24–80) | Lip, buccal mucosa, tongue, alveolus, retromolar trigone | 66.5 mo, (7–80) | OS, DFS | 0.12 (log-rank test) | NR |
| Arun et al. (2020) [47] | 212 | 52, (21–85) | NR | 23.2 mo | DFS, OS | 0.04 (median) | 42.5 |
| Bharath et al. (2018) [42] | 51 | NR | Tongue | 24 mo, (24–36) | DFS, OS | 0.05 (previous literature) | 23.16 |
| Chang et al. (2018) [48] | 389 | 51.8, (23–84) | Lip, retromolar trigone, gingiva, tongue, hard palate, buccal mucosa, floor of mouth | 42 mo, (0–152) | OS, DFS | 0.05 (ROC curve) | NR |
| Chow et al. (2017) [45] | 39 | 70, (46–95) | Buccal mucosa | 79 mo, (5–167) | OS, DSS | 0.07 (previous literature) | 23 |
| Ding et al. (2019) [49] | 149 | 59, (28–88) | Tongue, floor of mouth, other | 20 mo, (0–137), | OS, DFS, LRDFS, DMFS | 0.1 (median) | 29 |
| Ebrahimi et al. (2011) [50] | 313 | 63.4, (28.5–91.5) | Tongue, floor of mouth, alveolus, retromolar trigone, buccal, other | 32.3 mo | OS, DSS | 0.025 (log scale) | 27.4 |
| Gil et al. (2009) [51] | 386 | 58, (14–88) | Tongue, floor of mouth, upper gum, lower gum, hard palate, retromolar trigone, buccal mucosa | 67 mo, (4–184) | OS, DSS, LRDFS | 0.06 (median) | 35 |
| Hosni et al. (2017) [52] | 914 | 61, (18–92) | Tongue, others | 51 mo, (1–189) | RF, DF, OS | 0.06 (maximally selected rank statistic) | 36 |
| Iftikhar et al. (2020) [43] | 130 | High ratio: 48.3, Low ratio: 50.2 | Tongue | NR | OS, DFS | 0.012 (ROC curve) | NR |
| Jin et al. (2020) [53] | 233 | 59.24 | Tongue, non-tongue | 68 mo, (1–122) | OS | 0.024 (X-tile software calculation) | 21.97 |
| Kim et al. (2011) [54] | 211 | 55, (21–88) | Tongue, floor of mouth, buccal mucosa, gingiva, hard palate, retromolar trigone | 58 mo, (4–180) | DSS, OS | 0.06 (previous literature) | 25 |
| Künzel et al. (2014) [55] | 374 | 55, (26–85) | Tongue, floor of mouth, cheek, gingiva | 3.99 y (0.01–24.04) | DSS, OS, LRC, LC, RC | 0.05, 0.07 (ROC curve, median) | 26 |
| Lee C.C. et al. (2015) [56] | 347 | 56 | Buccal mucosa, tongue, other | 33 mo | OS | 0.2 (previous literature) | 23.2 |
| Lee C.C. et al. (2017) [14] | 3958 | 59 | Tongue, lip, floor of mouth, gum and retromolar trigone, buccal mucosa, hard palate, other | NR | DSS, OS | 0.2 (previous literature) | 33 |
| Lee H. et al. (2019) [57] | 345 | 55 | Tongue, floor of mouth, buccal mucosa, gingiva, hard palate, retromolar trigone, lip | 58 mo | DFS, OS, DSS | 0.1 (ROC curve) | 35 |
| Lieng et al. (2016) [44] | 72 | 60, (24–89) | Tongue | 55 mo, (2.1–177) | DFS, OS | 0.143 (log-rank test) | 19 |
| Moratin et al. (2020) [58] | 430 | 63.9, (18–92) | Tongue, buccal mucosa, floor of mouth, alveolar process, maxilla, soft palate | NR | OS, PFS | 0.08 (ROC curve) | NR |
| Ong et al. (2016) [18] | 99 | 62, (23–94) | Tongue | 48.5 mo, (2–156) | OS, DSS | 0.06 (previous literature) | 33 |
| Patel et al. (2013) [15] | 4254 | 52.63, (14–99) | NR | 41 mo, (2–322), | OS, DSS, DFS, LRFS, LRDFS, DMFS | 0.07 (ROC curve) | 39 |
| Rempel et al. (2018) [59] | 171 | 56.6, (24–81) | Floor of mouth, tongue, mandibula/alveolar process, maxilla/ hard palate, soft palate, buccal mucosa | 80.5 mo | OS | 0.07 (previous literature) | 22 |
| Safi et al. (2017) [60] | 499 | 62.51, (28–98) | Floor of mouth, tongue, lower jaw, palate, cheek | 35 mo, (3–117) | LRR | 0.07 (ROC curve) | 20 |
| Shrime et al. (2009) [61] | 143 | 58.7, (14.8–89.4) | Tongue, upper and lower gingiva, floor of mouth, hard palate, buccal mucosa, retromolar trigone | 32.4 mo, (1.2–140.4) | OS | 0.06 (maximally selected rank statistic) | 36 |
| Son et al. (2017) [40] | 157 | 54, (24–87) | Tongue, floor of mouth, buccal mucosa, gingiva, lip, hard palate, retromolar trigone | 46 mo, (14–74) | RFS, DSS, OS | 0.05 (ROC curve) | NR |
| Spoerl et al. (2020) [16] | 717 | 60.8, (28–91) | Buccal mucosa, upper alveolus and gingiva, lower alveolus and gingiva, hard palate, tongue, floor of mouth | 89 mo | OS, RFS | 0.055 (median) | 38 |
| Subramaniam et al. (2019) [62] | 643 | 55.1, (18–82) | Tongue, floor of mouth, buccal cavity, alveolus/retromolar trigone | 2.9 years, (0.5–11) | DFS, OS | 0.1 (previous literature) | 23 |
| Suzuki et al. (2016) [41] | 35 | NR | Tongue, upper gum, lower gum, floor of mouth, cheek mucosa, hard palate | 20.9 mo | OS, DMFS, Lung MFS | 0.07 (previous literature) | NR |
| Urban et al. (2013) [17] | 3091 | 60, (14–99) | Tongue, floor of mouth, gum and other | 21 mo | OS, CSS | 0.065 (previous literature) | 27 |
| Weckx et al. (2019) [63] | 159 | 62 | Floor of mouth, tongue, lower jaw, upper jaw and hard palate, soft palate, cheek | 43 mo, (3–408) | OS | 0.07 (NR) | NR |
| Xu et al. (2017) [64] | 2036 | 59 | Tongue, lower gingiva, buccal mucosa, floor of mouth, upper gingiva, hard palate | 65 mo, (1–178) | DFS, DSS | 0.06 (previous literature) | 23.5 |
| Yamagata et al. (2019) [65] | 95 | 65.5, (35–88) | Tongue, lower gingiva, floor of mouth, buccal mucosa, hard palate, upper gingiva | 65.5, (35–88) | OS | 0.04 (ROC curve) | 33 |
| Zhao et al. (2020) [66] | 248 | 55.4, (26–75) | Tongue, gingiva, buccal mucosa, palate, floor of mouth, retromolar trigone | 55.4, (26–75) | OS, DFS, DSS, LRFS, DMFS | 0.076 (ROC curve) | 32.02 |
3.3. Meta-Analysis
3.3.1. Studies Analyzing Exclusively Patients with Positive Lymph Nodes (Group YES)
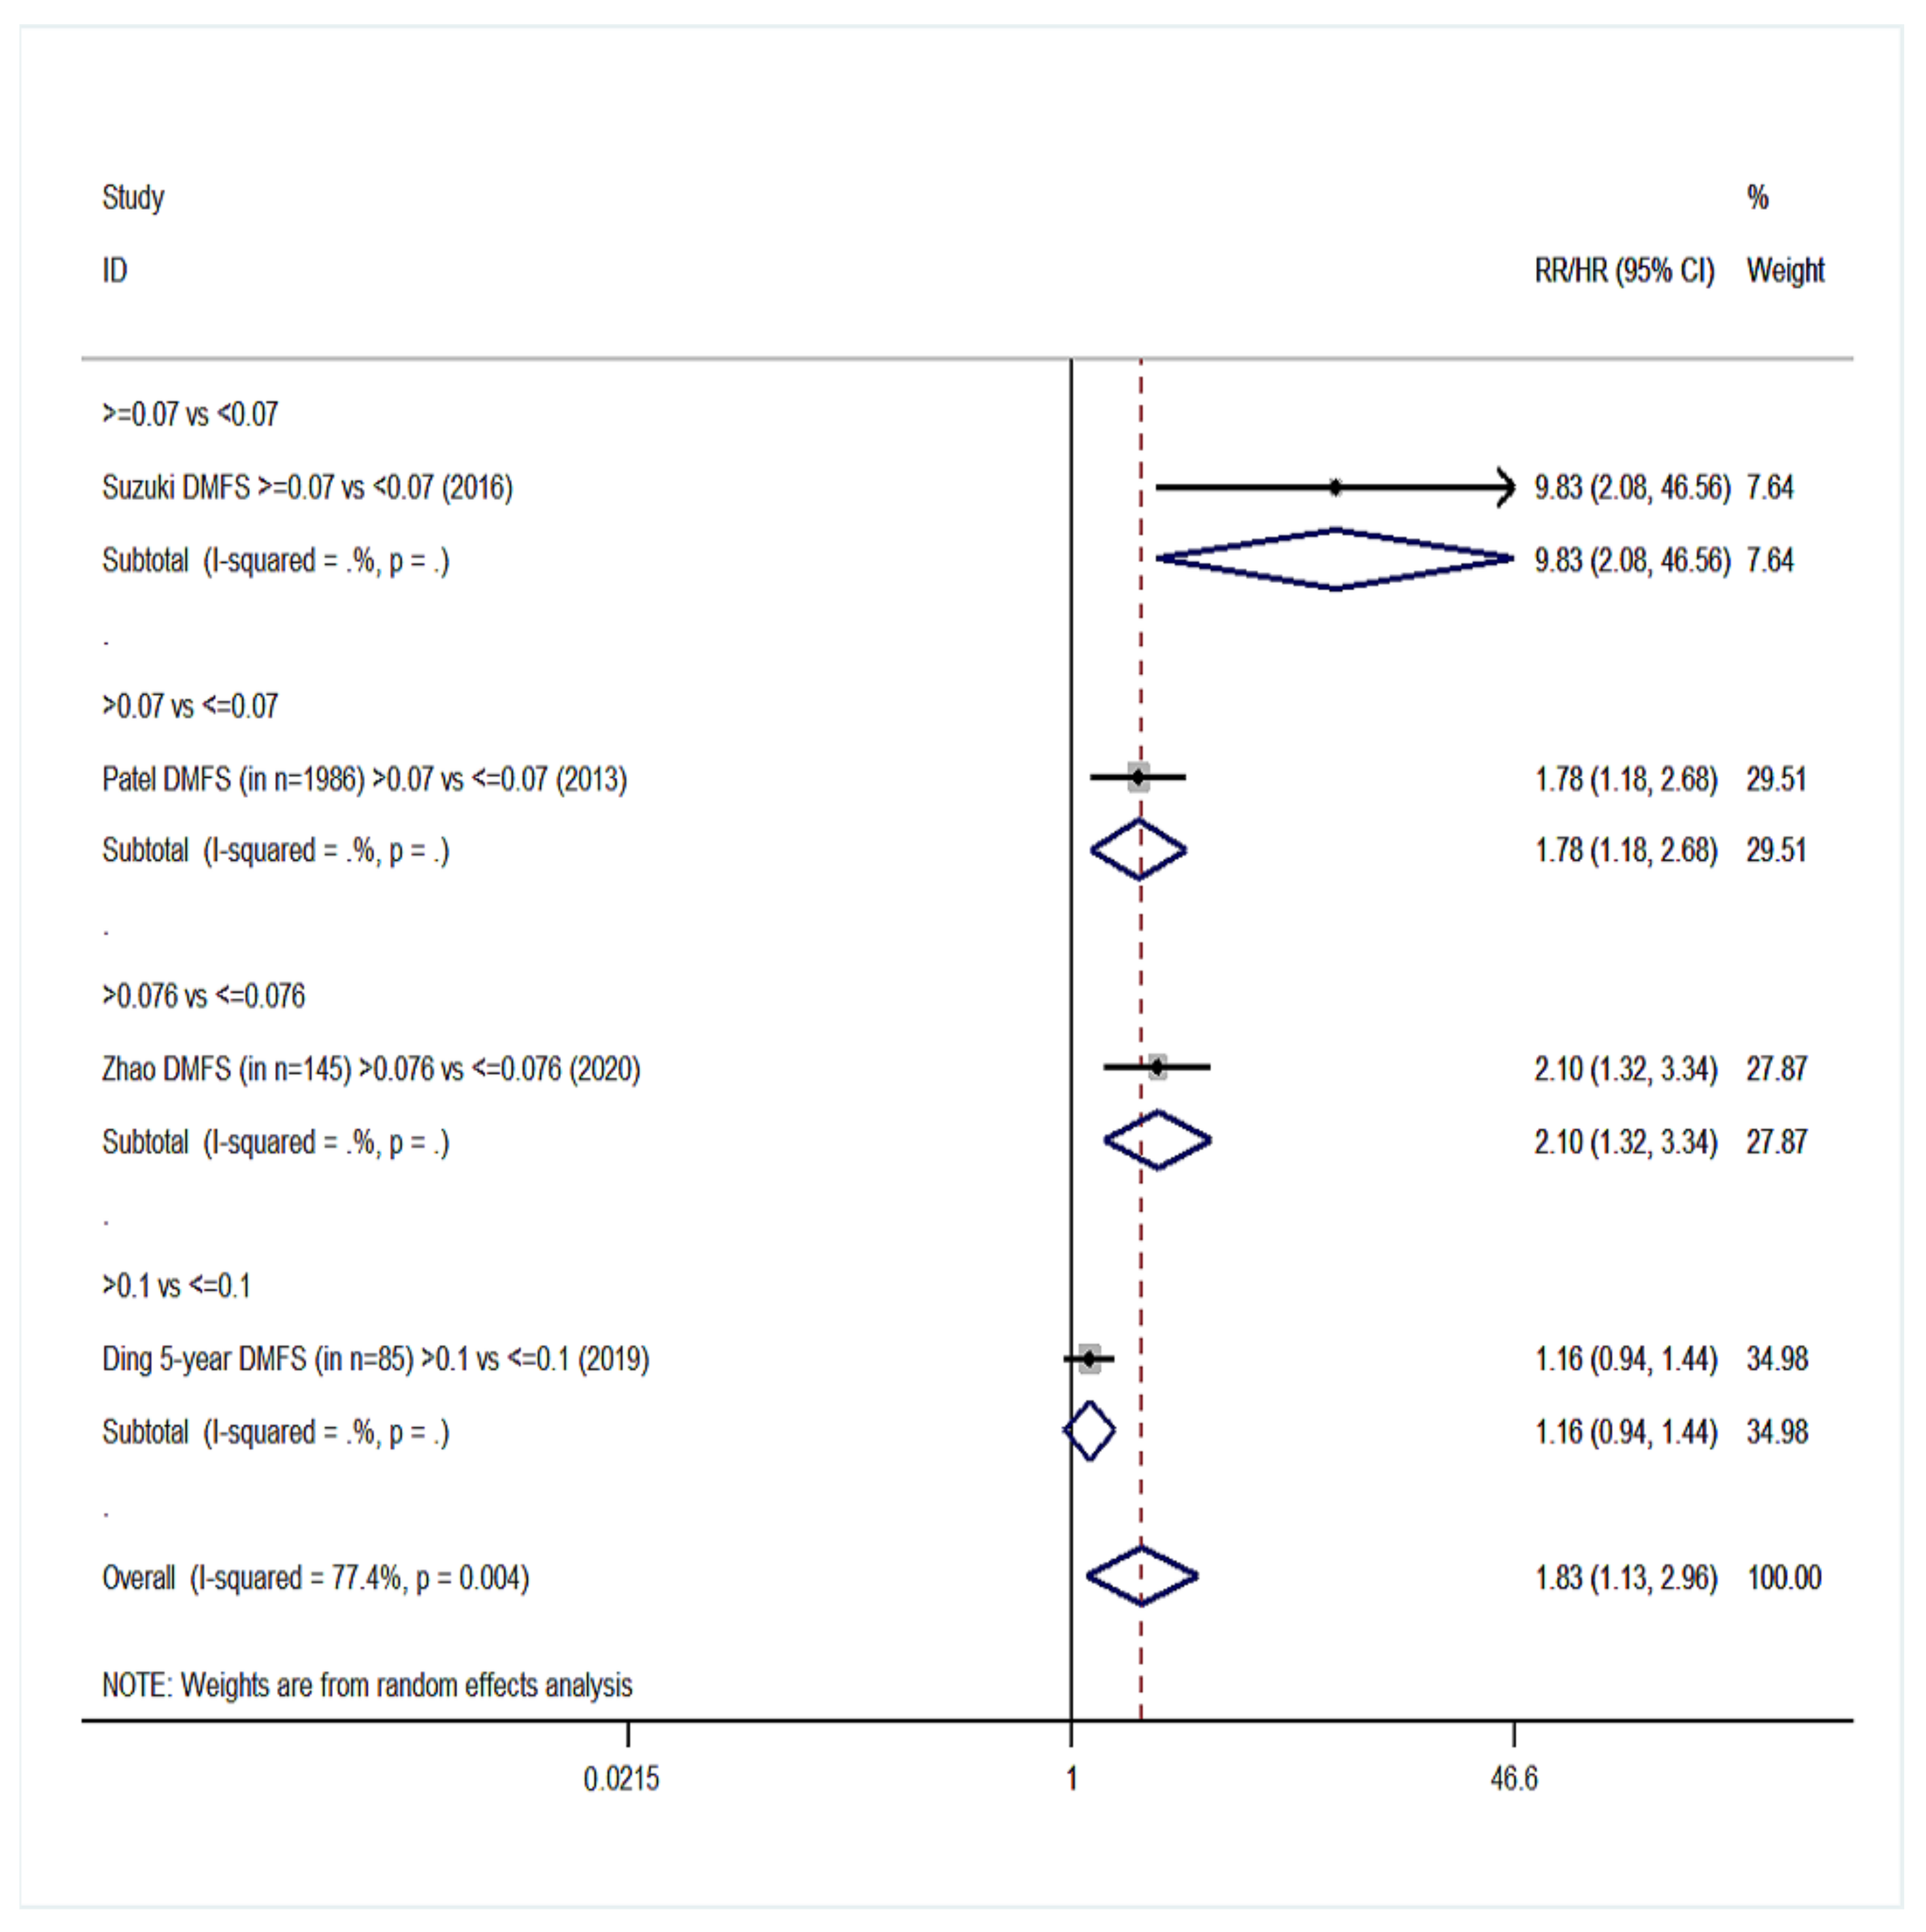
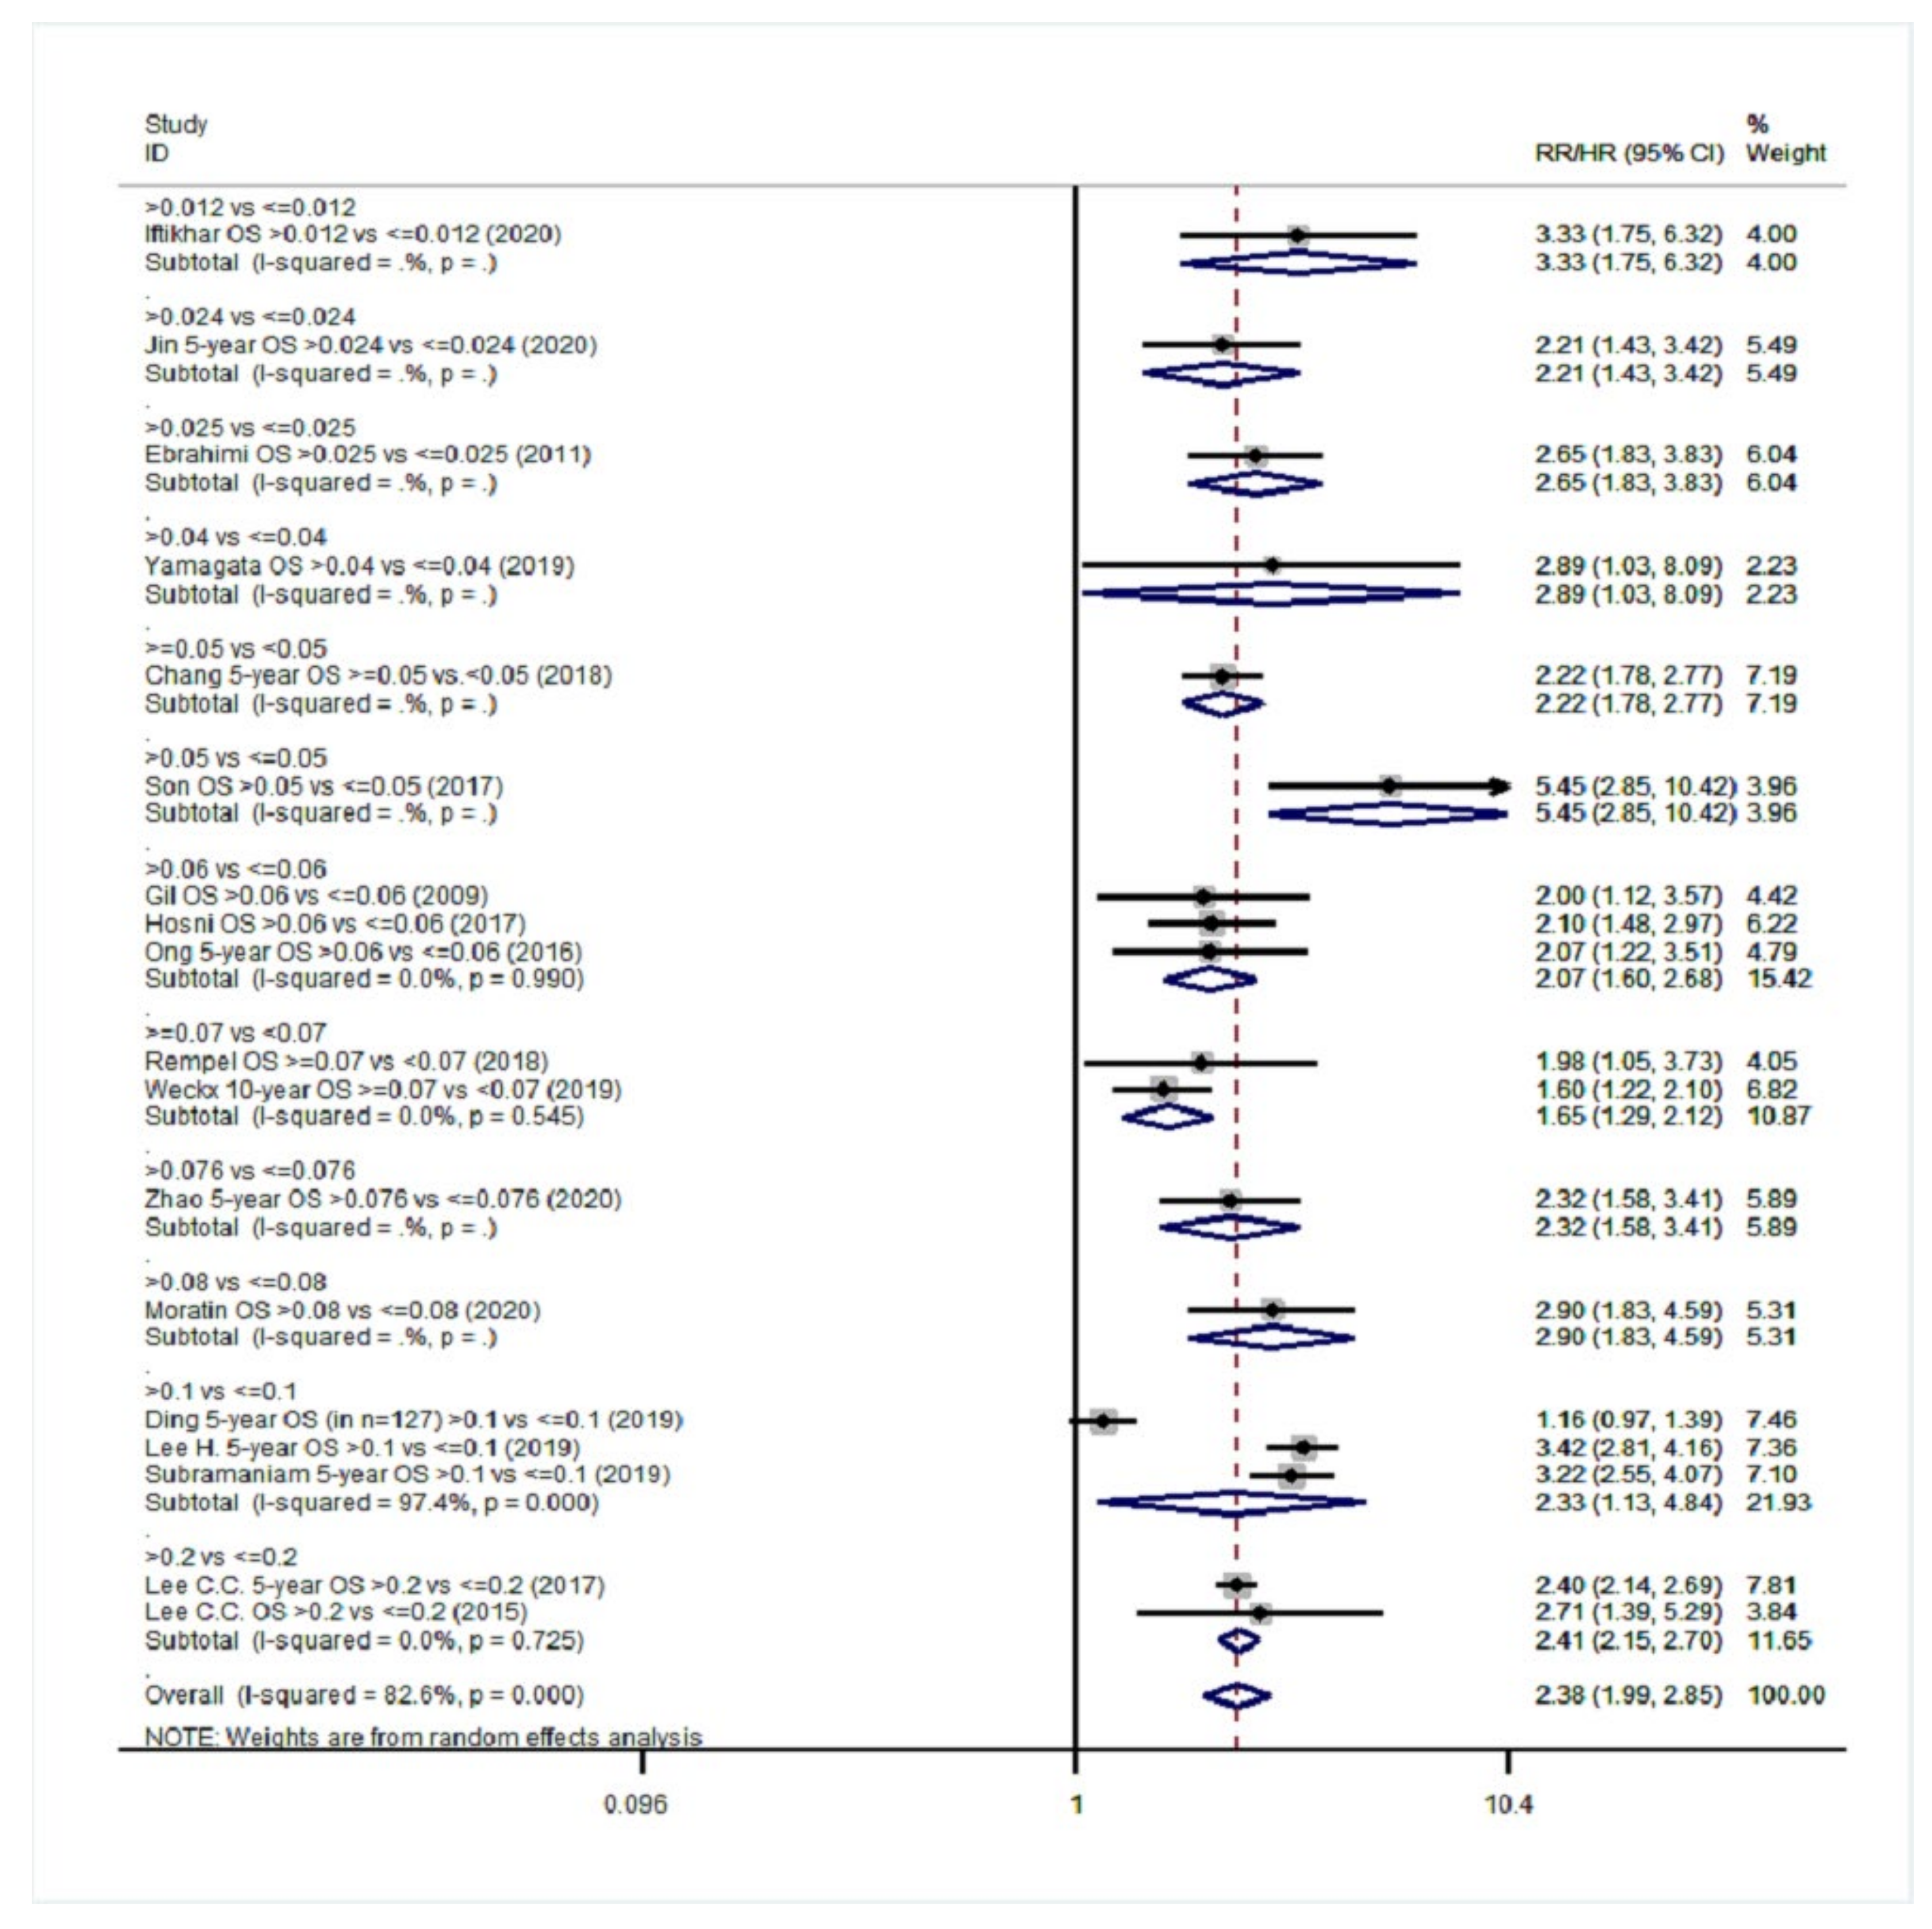
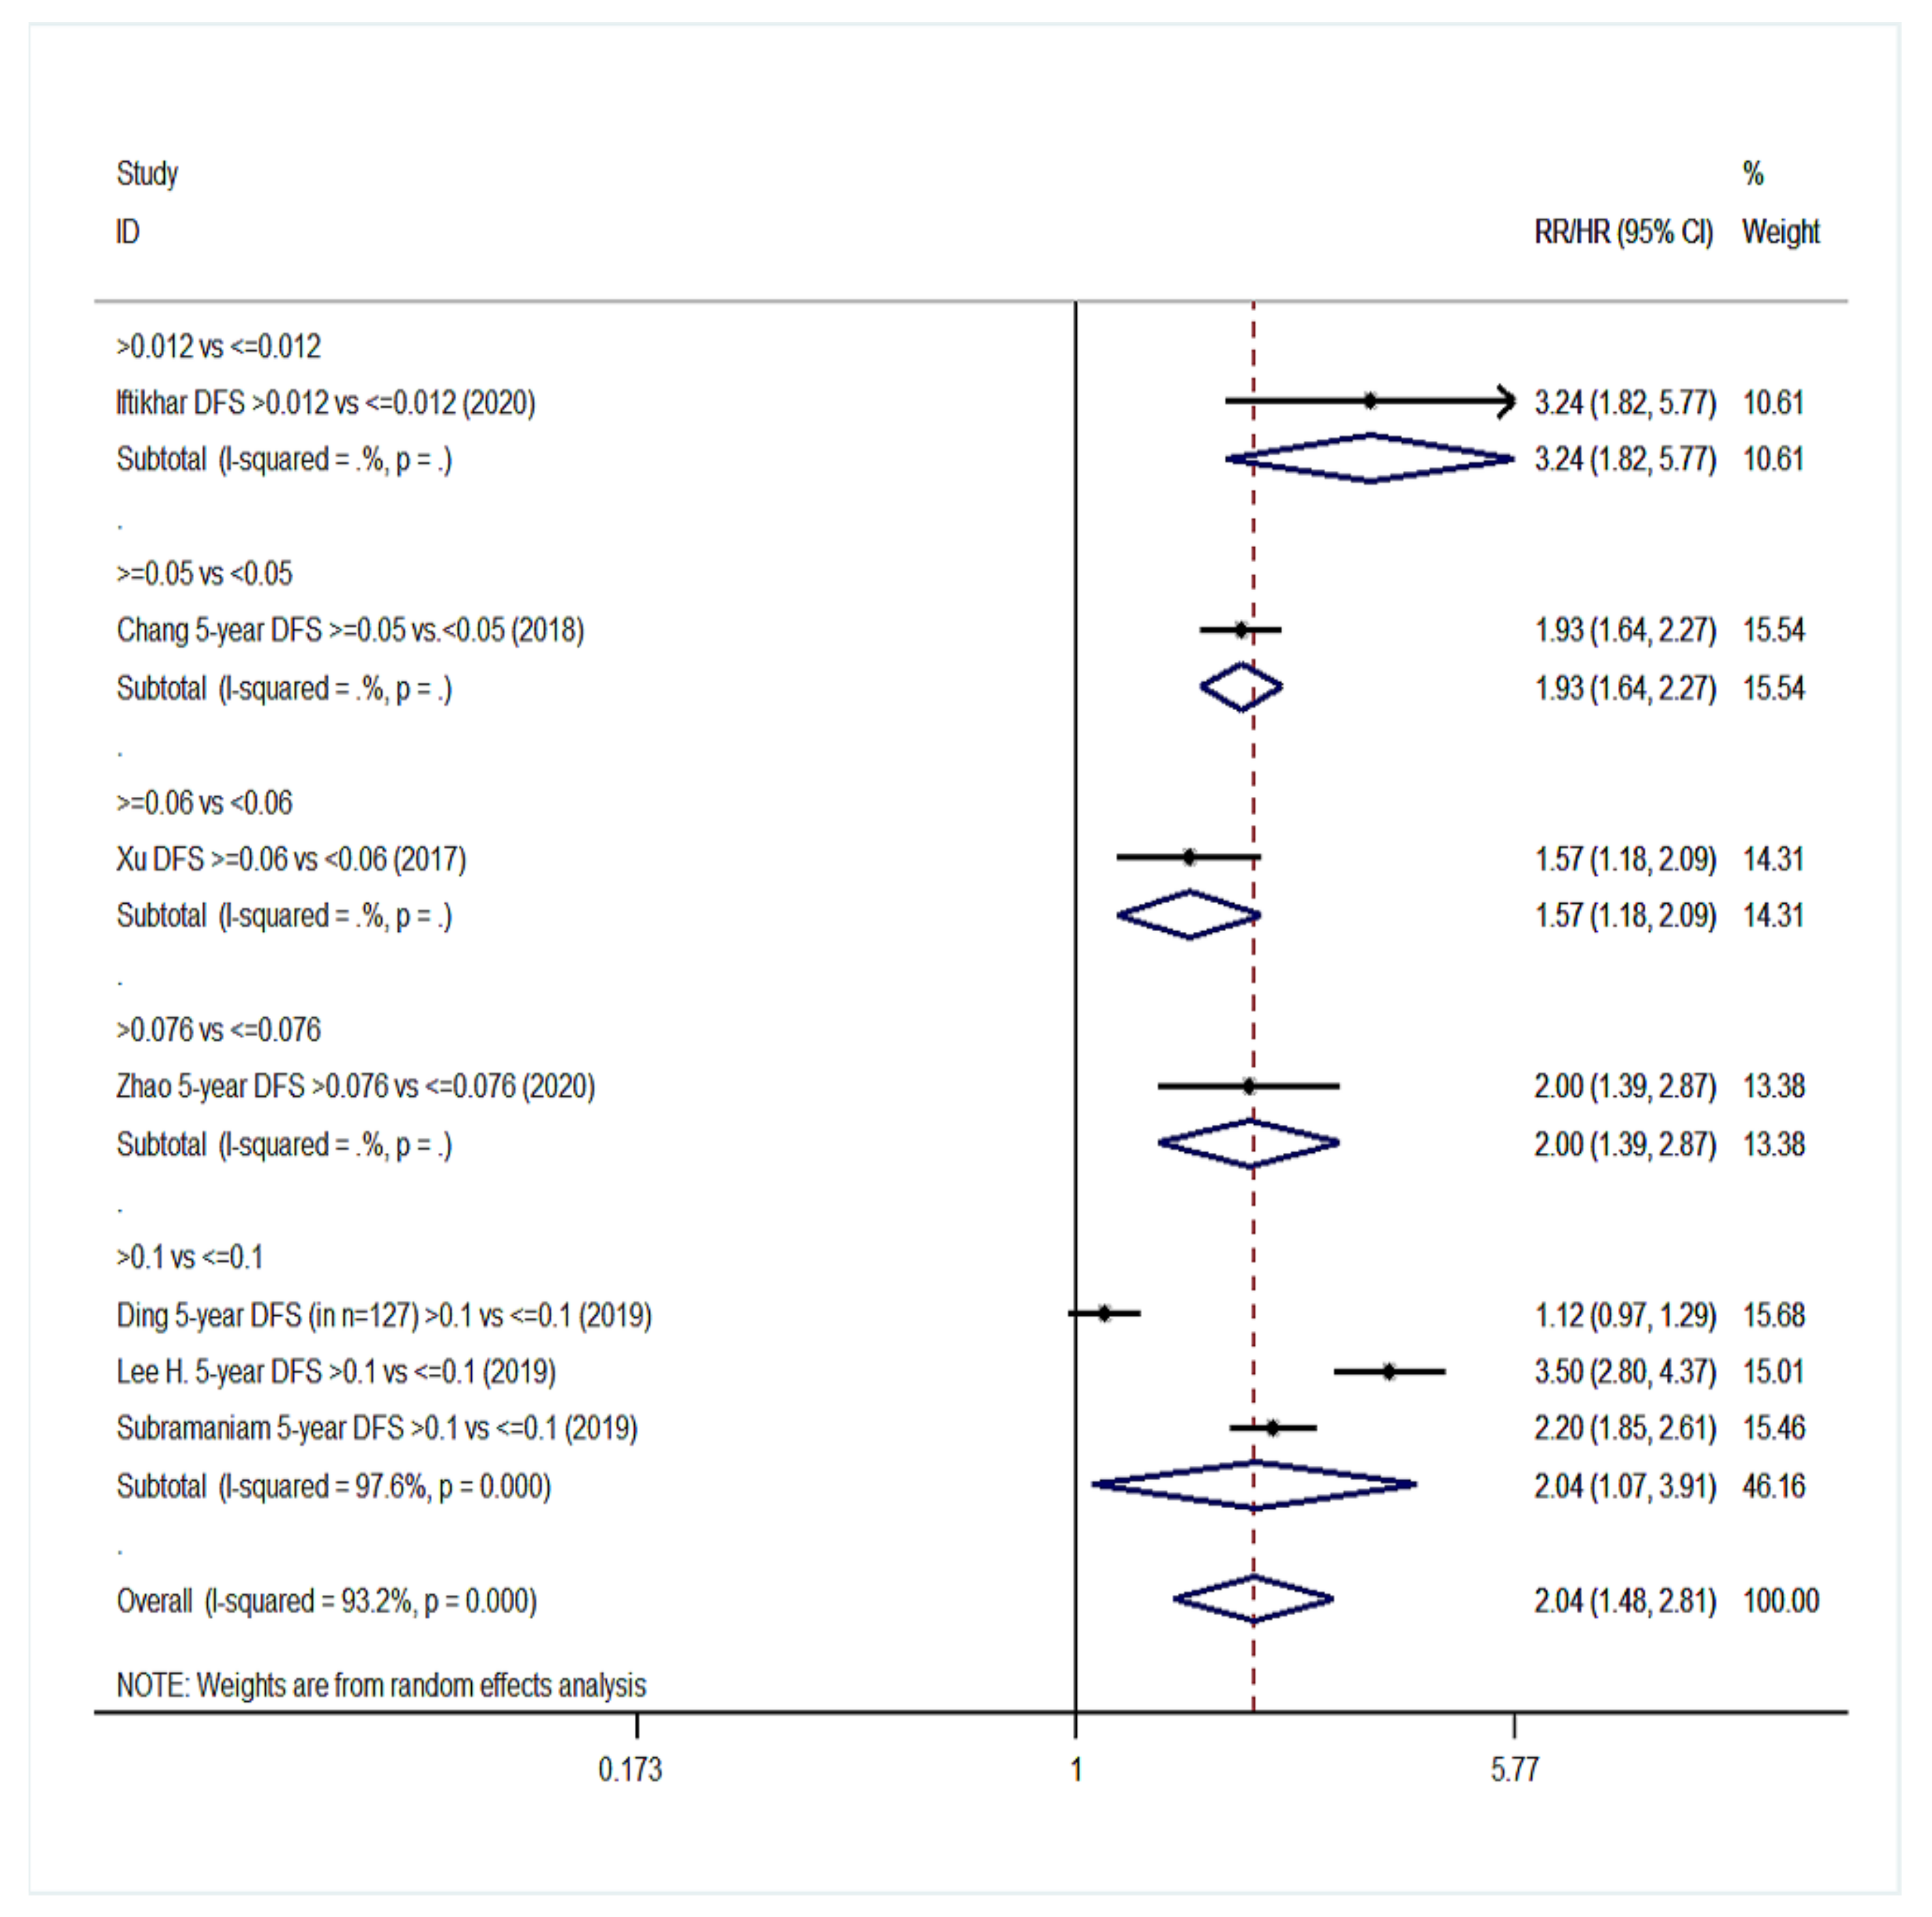
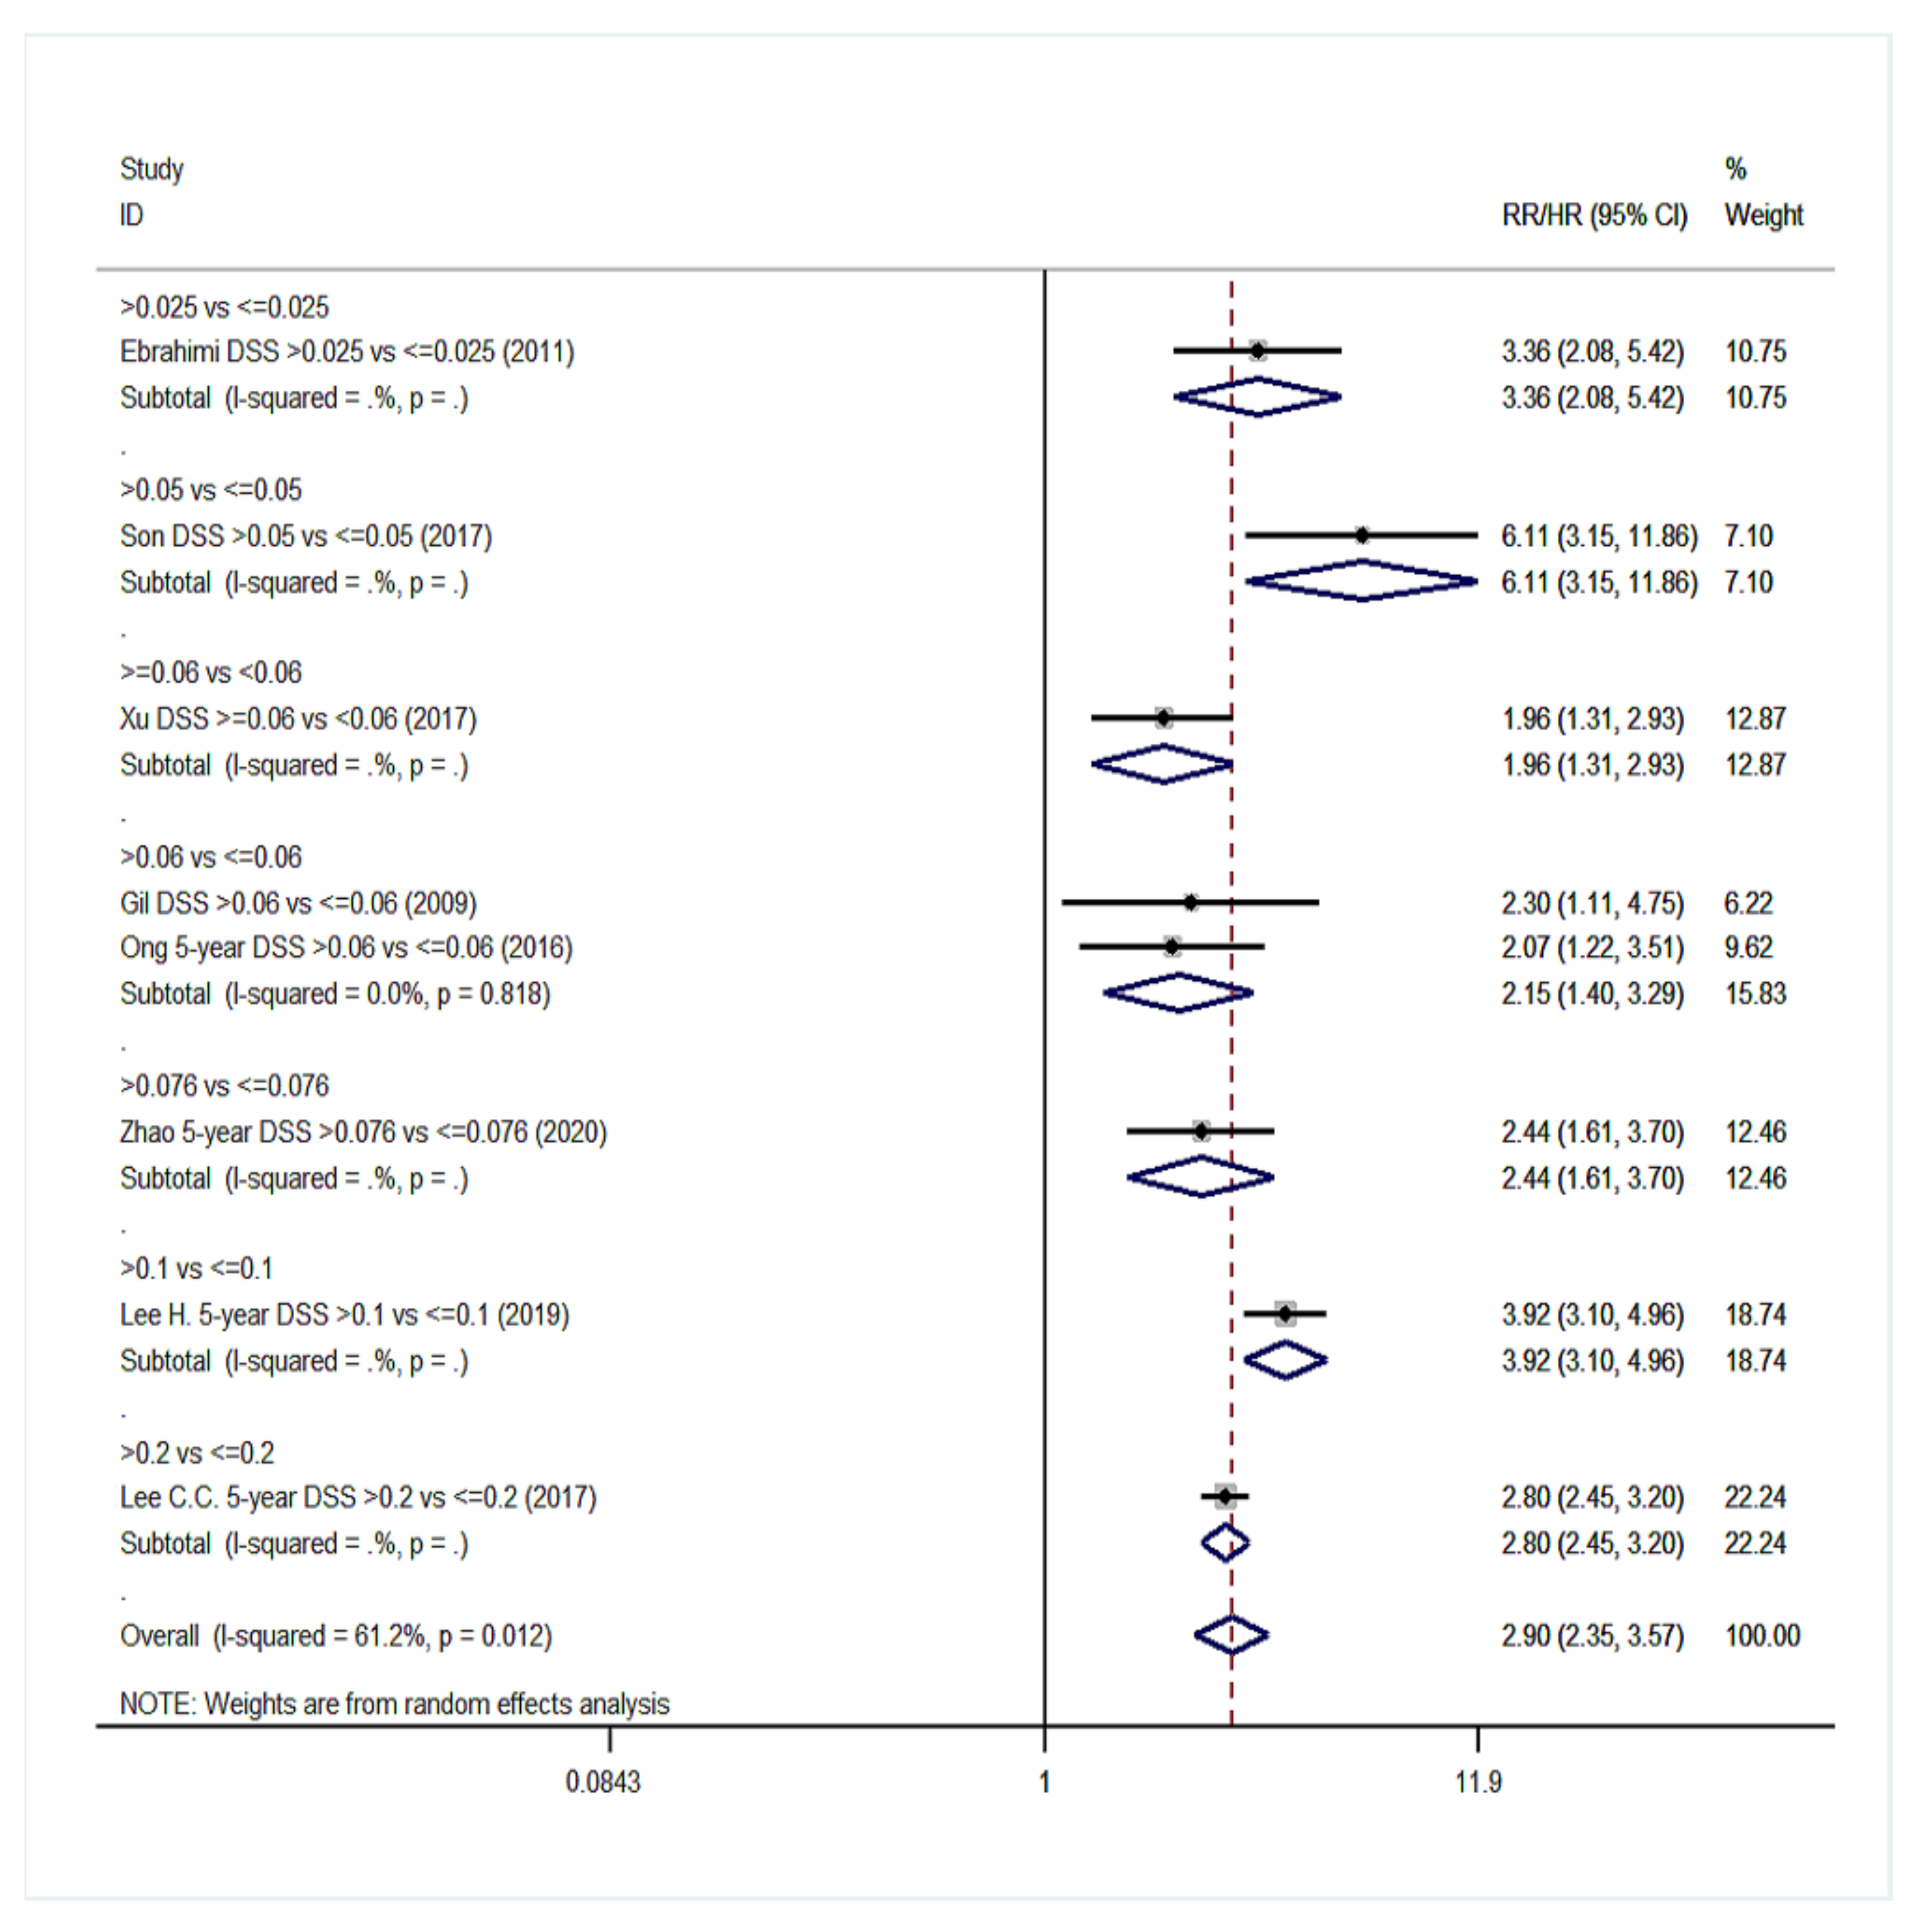
3.3.2. Studies Analyzing Patients with Positive and Negative Lymph Nodes (Group NO)
3.4. Meta-Regression Analysis
3.5. Evaluation of Quality of Studies and Risk of Bias
3.6. LNR as an Independent Prognostic Factor
3.6.1. LNR as an Independent Prognostic Factor in Group YES
3.6.2. LNR as an Independent Prognostic Factor in Group NO
4. Discussion
5. Conclusions
Supplementary Materials
Author Contributions
Funding
Conflicts of Interest
References
- Jemal, A.; Bray, F.; Center, M.M.; Ferlay, J.; Ward, E.; Forman, D. Global Cancer Statistics. CA Cancer J. Clin. 2011, 61, 69–90. [Google Scholar] [CrossRef] [PubMed]
- Blot, W.J.; McLaughlin, J.K.; Winn, D.M.; Austin, D.F.; Greenberg, R.S.; Preston-Martin, S.; Bernstein, L.; Schoenberg, J.B.; Stemhagen, A.; Fraumeni, J.F. Smoking and Drinking in Relation to Oral and Pharyngeal Cancer. Cancer Res. 1988, 48, 3282–3287. [Google Scholar]
- Dhanuthai, K.; Rojanawatsirivej, S.; Thosaporn, W.; Kintarak, S.; Subarnbhesaj, A.; Darling, M.; Kryshtalskyj, E.; Chiang, C.-P.; Shin, H.-I.; Choi, S.-Y.; et al. Oral Cancer: A Multicenter Study. Med. Oral Patol. Oral Cir. Bucal 2018, 23, e23–e29. [Google Scholar] [CrossRef] [PubMed]
- Tankéré, F.; Camproux, A.; Barry, B.; Guedon, C.; Depondt, J.; Gehanno, P. Prognostic Value of Lymph Node Involvement in Oral Cancers: A Study of 137 Cases. Laryngoscope 2000, 110, 2061–2065. [Google Scholar] [CrossRef] [PubMed]
- Liao, C.-T.; Hsueh, C.; Lee, L.-Y.; Lin, C.-Y.; Fan, K.-H.; Wang, H.-M.; Huang, S.-F.; Chen, I.-H.; Kang, C.-J.; Ng, S.-H.; et al. Neck Dissection Field and Lymph Node Density Predict Prognosis in Patients with Oral Cavity Cancer and Pathological Node Metastases Treated with Adjuvant Therapy. Oral Oncol. 2012, 48, 329–336. [Google Scholar] [CrossRef] [PubMed]
- Almangush, A.; Mäkitie, A.A.; Triantafyllou, A.; de Bree, R.; Strojan, P.; Rinaldo, A.; Hernandez-Prera, J.C.; Suárez, C.; Kowalski, L.P.; Ferlito, A.; et al. Staging and Grading of Oral Squamous Cell Carcinoma: An Update. Oral Oncol. 2020, 107, 104799. [Google Scholar] [CrossRef]
- Lee, N.C.J.; Eskander, A.; Park, H.S.; Mehra, S.; Burtness, B.A.; Husain, Z. Pathologic Staging Changes in Oral Cavity Squamous Cell Carcinoma: Stage Migration and Implications for Adjuvant Treatment. Cancer 2019, 125, 2975–2983. [Google Scholar] [CrossRef]
- Huang, S.H.; O’Sullivan, B. Overview of the 8th Edition TNM Classification for Head and Neck Cancer. Curr. Treat. Options Oncol. 2017, 18, 40. [Google Scholar] [CrossRef]
- Bullock, M.J. Current Challenges in the Staging of Oral Cancer. Head Neck Pathol. 2019, 13, 440–448. [Google Scholar] [CrossRef]
- Kim, K.-Y.; Zhang, X.; Kim, S.-M.; Lee, B.-D.; Cha, I.-H. A Combined Prognostic Factor for Improved Risk Stratification of Patients with Oral Cancer. Oral Dis. 2017, 23, 91–96. [Google Scholar] [CrossRef]
- Akagi, Y.; Adachi, Y.; Kinugasa, T.; Oka, Y.; Mizobe, T.; Shirouzu, K. Lymph Node Evaluation and Survival in Colorectal Cancer: Review of Population-Based, Prospective Studies. Anticancer Res. 2013, 33, 2839–2847. [Google Scholar] [PubMed]
- Liu, D.; Chen, Y.; Deng, M.; Xie, G.; Wang, J.; Zhang, L.; Liu, Q.; Yuan, P.; Feng, X. Lymph Node Ratio and Breast Cancer Prognosis: A Meta-Analysis. Breast Cancer Tokyo Jpn. 2014, 21, 1–9. [Google Scholar] [CrossRef] [PubMed]
- Teng, J.; Abdygametova, A.; Du, J.; Ma, B.; Zhou, R.; Shyr, Y.; Ye, F. Bayesian Inference of Lymph Node Ratio Estimation and Survival Prognosis for Breast Cancer Patients. IEEE J. Biomed. Health Inform. 2020, 24, 354–364. [Google Scholar] [CrossRef] [PubMed]
- Lee, C.-C.; Su, Y.-C.; Hung, S.-K.; Chen, P.-C.; Huang, C.-I.; Huang, W.-L.; Lin, Y.-W.; Yang, C.-C. Recommendation for Incorporation of a Different Lymph Node Scoring System in Future AJCC N Category for Oral Cancer. Sci. Rep. 2017, 7, 14117. [Google Scholar] [CrossRef]
- Patel, S.G.; Amit, M.; Yen, T.C.; Liao, C.T.; Chaturvedi, P.; Agarwal, J.P.; Kowalski, L.P.; Ebrahimi, A.; Clark, J.R.; Cernea, C.R.; et al. Lymph Node Density in Oral Cavity Cancer: Results of the International Consortium for Outcomes Research. Br. J. Cancer 2013, 109, 2087–2095. [Google Scholar] [CrossRef]
- Spoerl, S.; Gerken, M.; Mamilos, A.; Fischer, R.; Wolf, S.; Nieberle, F.; Klingelhöffer, C.; Meier, J.K.; Spoerl, S.; Ettl, T.; et al. Lymph Node Ratio as a Predictor for Outcome in Oral Squamous Cell Carcinoma: A Multicenter Population-Based Cohort Study. Clin. Oral Investig. 2021, 25, 1705–1713. [Google Scholar] [CrossRef]
- Urban, D.; Gluck, I.; Pfeffer, M.R.; Symon, Z.; Lawrence, Y.R. Lymph Node Ratio Predicts the Benefit of Post-Operative Radiotherapy in Oral Cavity Cancer. Radiother. Oncol. 2013, 106, 74–79. [Google Scholar] [CrossRef]
- Ong, W.; Zhao, R.; Lui, B.; Tan, W.; Ebrahimi, A.; Clark, J.R.; Soo, K.-C.; Tan, N.-C.; Tan, H.-K.; Iyer, N.G. Prognostic Significance of Lymph Node Density in Squamous Cell Carcinoma of the Tongue. Head Neck 2016, 38 (Suppl. 1), E859–E866. [Google Scholar] [CrossRef]
- Moher, D.; Liberati, A.; Tetzlaff, J.; Altman, D.G. Preferred Reporting Items for Systematic Reviews and Meta-Analyses: The PRISMA Statement. BMJ 2009, 339, b2535. [Google Scholar] [CrossRef]
- Cochrane Handbook for Systematic Reviews of Interventions. Available online: https://training.cochrane.org/handbook/current (accessed on 7 March 2022).
- Wells, G.; Wells, G.; Shea, B.; Shea, B.; O’Connell, D.; Peterson, J.; Welch, V.; Losos, M.; Tugwell, P.; Ga, S.W.; et al. The Newcastle-Ottawa Scale (NOS) for Assessing the Quality of Nonrandomised Studies in Meta-Analyses. 2014. Available online: https://www.semanticscholar.org/paper/The-Newcastle-Ottawa-Scale-(NOS)-for-Assessing-the-Wells-Wells/c293fb316b6176154c3fdbb8340a107d9c8c82bf#paper-header (accessed on 7 April 2022).
- Adel, M.; Tsao, C.-K.; Wei, F.-C.; Chien, H.-T.; Lai, C.-H.; Liao, C.-T.; Wang, H.-M.; Fan, K.-H.; Kang, C.-J.; Chang, J.T.-C.; et al. Preoperative SCC Antigen, CRP Serum Levels, and Lymph Node Density in Oral Squamous Cell Carcinoma. Medicine 2016, 95, e3149. [Google Scholar] [CrossRef]
- Amar, A.; Rapoport, A.; Curioni, O.A.; Dedivitis, R.A.; Cernea, C.R.; Brandão, L.G. The Density of Metastatic Lymph Node as Prognostic Factor in Squamous Cell Carcinoma of the Tongue and Floor of the Mouth. Braz. J. Otorhinolaryngol. 2012, 78, 86–90. [Google Scholar] [CrossRef] [Green Version]
- Chen, C.-C.; Lin, J.-C.; Chen, K.-W. Lymph Node Ratio as a Prognostic Factor in Head and Neck Cancer Patients. Radiat. Oncol. 2015, 10, 181. [Google Scholar] [CrossRef]
- Faisal, M.; Dhanani, R.; Ullah, S.; Bakar, M.A.; Irfan, N.; Malik, K.I.; Loya, A.; Boban, E.M.; Hussain, R.; Jamshed, A. Prognostic Outcomes of Treatment Naïve Oral Tongue Squamous Cell Carcinoma (OTSCC): A Comprehensive Analysis of 14 Years. Eur. Arch. Otorhinolaryngol. 2021, 278, 3045–3053. [Google Scholar] [CrossRef]
- Feng, Z.; Xu, Q.S.; Wang, C.; Li, J.Z.; Mao, M.H.; Li, H.; Qin, L.Z.; Han, Z. Lymph Node Ratio Is Associated with Adverse Clinicopathological Features and Is a Crucial Nodal Parameter for Oral and Oropharyngeal Cancer. Sci. Rep. 2017, 7, 6708. [Google Scholar] [CrossRef]
- Hingsammer, L.; Seier, T.; Ikenberg, J.; Schumann, P.; Zweifel, D.; Rücker, M.; Bredell, M.; Lanzer, M. The Influence of Lymph Node Ratio on Survival and Disease Recurrence in Squamous Cell Carcinoma of the Tongue. Int. J. Oral Maxillofac. Surg. 2019, 48, 851–856. [Google Scholar] [CrossRef]
- Iocca, O.; Di Maio, P.; De Virgilio, A.; Pellini, R.; Golusiński, P.; Petruzzi, G.; Zocchi, J.; Pirola, F.; Janczak, R.; Golusiński, W.; et al. Lymph Node Yield and Lymph Node Ratio in Oral Cavity and Oropharyngeal Carcinoma: Preliminary Results from a Prospective, Multicenter, International Cohort. Oral Oncol. 2020, 107, 104740. [Google Scholar] [CrossRef]
- Kim, K.-Y.; Cha, I.-H. Risk Stratification of Oral Cancer Patients Using a Combined Prognostic Factor Including Lymph Node Density and Biomarker. J. Cancer Res. Clin. Oncol. 2012, 138, 483–490. [Google Scholar] [CrossRef]
- Mascitti, M.; Rubini, C.; De Michele, F.; Balercia, P.; Girotto, R.; Troiano, G.; Lo Muzio, L.; Santarelli, A. American Joint Committee on Cancer Staging System 7th Edition versus 8th Edition: Any Improvement for Patients with Squamous Cell Carcinoma of the Tongue? Oral Surg. Oral Med. Oral Pathol. Oral Radiol. 2018, 126, 415–423. [Google Scholar] [CrossRef]
- Noble, A.R.; Greskovich, J.F.; Han, J.; Reddy, C.A.; Nwizu, T.I.; Khan, M.F.; Scharpf, J.; Adelstein, D.J.; Burkey, B.B.; Koyfman, S.A. Risk Factors Associated with Disease Recurrence in Patients with Stage III/IV Squamous Cell Carcinoma of the Oral Cavity Treated with Surgery and Postoperative Radiotherapy. Anticancer Res. 2016, 36, 785–792. [Google Scholar]
- Roberts, T.J.; Colevas, A.D.; Hara, W.; Holsinger, F.C.; Oakley-Girvan, I.; Divi, V. Number of Positive Nodes Is Superior to the Lymph Node Ratio and American Joint Committee on Cancer N Staging for the Prognosis of Surgically Treated Head and Neck Squamous Cell Carcinomas. Cancer 2016, 122, 1388–1397. [Google Scholar] [CrossRef]
- Safi, A.-F.; Grandoch, A.; Nickenig, H.-J.; Zöller, J.E.; Kreppel, M. Importance of Lymph Node Ratio for Locoregional Recurrence of Squamous Cell Carcinoma of the Buccal Mucosa. Head Neck 2017, 39, 2488–2493. [Google Scholar] [CrossRef]
- Safi, A.-F.; Grandoch, A.; Nickenig, H.-J.; Zöller, J.E.; Kreppel, M. The Importance of Lymph Node Ratio for Locoregional Recurrence of Squamous Cell Carcinoma of the Tongue. J. Cranio-Maxillofac. Surg. 2017, 45, 1058–1061. [Google Scholar] [CrossRef]
- Safi, A.-F.; Kauke, M.; Grandoch, A.; Nickenig, H.-J.; Zöller, J.; Kreppel, M. The Importance of Lymph Node Ratio for Patients with Mandibular Infiltration of Oral Squamous Cell Carcinoma. J. Cranio-Maxillofac. Surg. 2018, 46, 1007–1012. [Google Scholar] [CrossRef]
- Sayed, S.I.; Sharma, S.; Rane, P.; Vaishampayan, S.; Talole, S.; Chaturvedi, P.; Chaukar, D.; Deshmukh, A.; Agarwal, J.P.; D’cruz, A.K. Can Metastatic Lymph Node Ratio (LNR) Predict Survival in Oral Cavity Cancer Patients? J. Surg. Oncol. 2013, 108, 256–263. [Google Scholar] [CrossRef]
- Shrime, M.G.; Ma, C.; Gullane, P.J.; Gilbert, R.W.; Irish, J.C.; Brown, D.H.; Goldstein, D.P. Impact of Nodal Ratio on Survival in Squamous Cell Carcinoma of the Oral Cavity. Head Neck 2009, 31, 1129–1136. [Google Scholar] [CrossRef]
- Troeltzsch, M.; Haidari, S.; Boser, S.; Troeltzsch, M.; Probst, F.A.; Ehrenfeld, M.; Otto, S. What Factors Are Associated with Regional Recurrence after Operative Treatment of Oral Squamous Cell Carcinoma? J. Oral Maxillofac. Surg. 2018, 76, 2650–2659. [Google Scholar] [CrossRef]
- Zirk, M.; Safi, A.-F.; Buller, J.; Nickenig, H.-J.; Dreiseidler, T.; Zinser, M.; Drebber, U.; Zöller, J.E.; Kreppel, M. Lymph Node Ratio as Prognosticator in Floor of Mouth Squamous Cell Carcinoma Patients. J. Cranio-Maxillofac. Surg. 2018, 46, 195–200. [Google Scholar] [CrossRef] [PubMed]
- Son, H.-J.; Roh, J.-L.; Cho, K.-J.; Choi, S.-H.; Nam, S.Y.; Kim, S.Y. Nodal Factors Predictive of Recurrence and Survival in Patients with Oral Cavity Squamous Cell Carcinoma. Clin. Otolaryngol. 2018, 43, 470–476. [Google Scholar] [CrossRef] [PubMed]
- Suzuki, H.; Beppu, S.; Hanai, N.; Hirakawa, H.; Hasegawa, Y. Lymph Node Density Predicts Lung Metastases in Oral Squamous Cell Carcinoma. Br. J. Oral Maxillofac. Surg. 2016, 54, 213–218. [Google Scholar] [CrossRef] [PubMed]
- Bharath, V.M.; Balagopal, P.G.; Nebu, A.G.; Jayasudha, A.V.; Iqbal Ahmed, M.; Sebastian, P. Can Metastatic Lymph Node Ratio Be Used as an Independent Prognostic Factor in Carcinoma Tongue? Gulf J. Oncol. 2018, 1, 6–10. [Google Scholar]
- Iftikhar, H.; Rozi, S.; Zahid, N.; Awan, M.S.; Nathani, K.R. Lymph Node Ratio as a Prognostic Marker of Oral Tongue Squamous Cell Carcinoma: A Cohort Study. Ann. R. Coll. Surg. Engl. 2020, 102, 726–732. [Google Scholar] [CrossRef]
- Lieng, H.; Gebski, V.J.; Morgan, G.J.; Veness, M.J. Important Prognostic Significance of Lymph Node Density in Patients with Node Positive Oral Tongue Cancer. ANZ J. Surg. 2016, 86, 681–686. [Google Scholar] [CrossRef]
- Chow, T.-L.; Kwan, W.W.Y.; Fung, S.-C.; Ho, L.-I. Prognostic Value of Lymph Node Density in Buccal Squamous Cell Carcinoma. Am. J. Otolaryngol. 2017, 38, 529–532. [Google Scholar] [CrossRef]
- Agarwal, J.P.; Kane, S.; Ghosh-Laskar, S.; Pilar, A.; Manik, V.; Oza, N.; Wagle, P.; Gupta, T.; Budrukkar, A.; Murthy, V.; et al. Extranodal Extension in Resected Oral Cavity Squamous Cell Carcinoma: More to It than Meets the Eye. Laryngoscope 2019, 129, 1130–1136. [Google Scholar] [CrossRef]
- Arun, I.; Maity, N.; Hameed, S.; Jain, P.V.; Manikantan, K.; Sharan, R.; Arun, P. Lymph Node Characteristics and Their Prognostic Significance in Oral Squamous Cell Carcinoma. Head Neck 2021, 43, 520–533. [Google Scholar] [CrossRef]
- Chang, W.-C.; Lin, C.-S.; Yang, C.-Y.; Lin, C.-K.; Chen, Y.-W. Lymph Node Density as a Prognostic Predictor in Patients with Betel Nut-Related Oral Squamous Cell Carcinoma. Clin. Oral Investig. 2018, 22, 1513–1521. [Google Scholar] [CrossRef]
- Ding, D.; Stokes, W.; Eguchi, M.; Hararah, M.; Sumner, W.; Amini, A.; Goddard, J.; Somerset, H.; Bradley, C.; McDermott, J.; et al. Association between Lymph Node Ratio and Recurrence and Survival Outcomes in Patients with Oral Cavity Cancer. JAMA Otolaryngol.-Head Neck Surg. 2019, 145, 53–61. [Google Scholar] [CrossRef]
- Ebrahimi, A.; Clark, J.R.; Zhang, W.J.; Elliott, M.S.; Gao, K.; Milross, C.G.; Shannon, K.F. Lymph Node Ratio as an Independent Prognostic Factor in Oral Squamous Cell Carcinoma. Head Neck 2011, 33, 1245–1251. [Google Scholar] [CrossRef]
- Gil, Z.; Carlson, D.L.; Boyle, J.O.; Kraus, D.H.; Shah, J.P.; Shaha, A.R.; Singh, B.; Wong, R.J.; Patel, S.G. Lymph Node Density Is a Significant Predictor of Outcome in Patients with Oral Cancer. Cancer 2009, 115, 5700–5710. [Google Scholar] [CrossRef]
- Hosni, A.; McMullen, C.; Huang, S.H.; Xu, W.; Su, J.; Bayley, A.; Bratman, S.V.; Cho, J.; Giuliani, M.; Kim, J.; et al. Lymph Node Ratio Relationship to Regional Failure and Distant Metastases in Oral Cavity Cancer. Radiother. Oncol. 2017, 124, 225–231. [Google Scholar] [CrossRef]
- Jin, W.; Zhu, Z.; Wu, Y.; Ding, X.; Wu, H.; Song, X.; Wu, Y. Prognostic Value of Log Odds of Positive Lymph Nodes in Patients with Resectable Oral Squamous Cell Carcinoma. Oral Oncol. 2020, 108, 104709. [Google Scholar] [CrossRef]
- Kim, S.Y.; Nam, S.Y.; Choi, S.-H.; Cho, K.-J.; Roh, J.-L. Prognostic Value of Lymph Node Density in Node-Positive Patients with Oral Squamous Cell Carcinoma. Ann. Surg. Oncol. 2011, 18, 2310–2317. [Google Scholar] [CrossRef]
- Künzel, J.; Mantsopoulos, K.; Psychogios, G.; Grundtner, P.; Koch, M.; Iro, H. Lymph Node Ratio as a Valuable Additional Predictor of Outcome in Selected Patients with Oral Cavity Cancer. Oral Surg. Oral Med. Oral Pathol. Oral Radiol. 2014, 117, 677–684. [Google Scholar] [CrossRef]
- Lee, C.-C.; Ho, H.-C.; Su, Y.-C.; Lee, M.-S.; Hung, S.-K.; Chen, Y.-L. The Prognostic Ability of Log Odds of Positive Lymph Nodes in Oral Cavity Squamous Cell Carcinoma. Medicine 2015, 94, e1069. [Google Scholar] [CrossRef]
- Lee, H.; Roh, J.-L.; Cho, K.-J.; Choi, S.-H.; Nam, S.Y.; Kim, S.Y. Number of Positive Lymph Nodes Better Predicts Survival for Oral Cavity Cancer. J. Surg. Oncol. 2019, 119, 675–682. [Google Scholar] [CrossRef]
- Moratin, J.; Metzger, K.; Kansy, K.; Ristow, O.; Engel, M.; Hoffmann, J.; Flechtenmacher, C.; Freier, K.; Freudlsperger, C.; Horn, D. The Prognostic Significance of the Lymph Node Ratio in Oral Cancer Differs for Anatomical Subsites. Int. J. Oral Maxillofac. Surg. 2020, 49, 558–563. [Google Scholar] [CrossRef]
- Rempel, V.; Safi, A.F.; Drebber, U.; Nickenig, H.J.; Neugebauer, J.; Zöller, J.E.; Kreppel, M. The Prognostic Relevance of Lymph Node Ratio in Patients with Oral Squamous Cell Carcinoma Treated with Neoadjuvant Therapy Regimen and Radical Surgery. J. Cranio-Maxillofac. Surg. 2018, 46, 1659–1663. [Google Scholar] [CrossRef]
- Safi, A.-F.; Kauke, M.; Grandoch, A.; Nickenig, H.-J.; Drebber, U.; Zöller, J.; Kreppel, M. The Importance of Log Odds of Positive Lymph Nodes for Locoregional Recurrence in Oral Squamous Cell Carcinoma. Oral Oncol. 2017, 72, 48–55. [Google Scholar] [CrossRef]
- Shrime, M.G.; Bachar, G.; Lea, J.; Volling, C.; Ma, C.; Gullane, P.J.; Gilbert, R.W.; Irish, J.C.; Brown, D.H.; Goldstein, D.P. Nodal Ratio as an Independent Predictor of Survival in Squamous Cell Carcinoma of the Oral Cavity. Head Neck 2009, 31, 1482–1488. [Google Scholar] [CrossRef] [PubMed]
- Subramaniam, N.; Balasubramanian, D.; Kumar, N.; Murthy, S.; Vijayan, S.N.; Nambiar, A.; Vidhyadharan, S.; Thankappan, K.; Iyer, S. Lymph Node Staging Systems in Oral Squamous Cell Carcinoma: A Comparative Analysis. Oral Oncol. 2019, 97, 92–98. [Google Scholar] [CrossRef] [PubMed]
- Weckx, A.; Riekert, M.; Grandoch, A.; Schick, V.; Zöller, J.E.; Kreppel, M. Time to Recurrence and Patient Survival in Recurrent Oral Squamous Cell Carcinoma. Oral Oncol. 2019, 94, 8–13. [Google Scholar] [CrossRef] [PubMed]
- Xu, Q.S.; Wang, C.; Li, B.; Li, J.Z.; Mao, M.H.; Qin, L.Z.; Li, H.; Huang, X.; Han, Z.; Feng, Z. Prognostic Value of Pathologic Grade for Patients with Oral Squamous Cell Carcinoma. Oral Dis. 2018, 24, 335–346. [Google Scholar] [CrossRef] [PubMed]
- Yamagata, K.; Fukuzawa, S.; Kanno, N.; Uchida, F.; Yanagawa, T.; Bukawa, H. Is Lymph Node Ratio a Prognostic Factor for Patients with Oral Squamous Cell Carcinoma? J. Oral Maxillofac. Surg. 2019, 77, 1510–1519. [Google Scholar] [CrossRef] [PubMed]
- Zhao, T.-C.; Liang, S.-Y.; Ju, W.-T.; Fu, Y.; Zhou, Z.-H.; Wang, L.-Z.; Li, J.; Zhang, C.-P.; Zhang, Z.-Y.; Zhong, L.-P. High-Risk Lymph Node Ratio Predicts Worse Prognosis in Patients with Locally Advanced Oral Cancer. J. Oral Pathol. Med. 2020, 49, 787–795. [Google Scholar] [CrossRef]
- Huang, T.H.; Li, K.Y.; Choi, W.S. Lymph Node Ratio as Prognostic Variable in Oral Squamous Cell Carcinomas: Systematic Review and Meta-Analysis. Oral Oncol. 2019, 89, 133–143. [Google Scholar] [CrossRef]
- Reinisch, S.; Kruse, A.; Bredell, M.; Lübbers, H.-T.; Gander, T.; Lanzer, M. Is Lymph-Node Ratio a Superior Predictor than Lymph Node Status for Recurrence-Free and Overall Survival in Patients with Head and Neck Squamous Cell Carcinoma? Ann. Surg. Oncol. 2014, 21, 1912–1918. [Google Scholar] [CrossRef]
- Talmi, Y.P.; Takes, R.P.; Alon, E.E.; Nixon, I.J.; López, F.; de Bree, R.; Rodrigo, J.P.; Shaha, A.R.; Halmos, G.B.; Rinaldo, A.; et al. Prognostic Value of Lymph Node Ratio in Head and Neck Squamous Cell Carcinoma. Head Neck 2018, 40, 1082–1090. [Google Scholar] [CrossRef]
- Ebrahimi, A.; Zhang, W.J.; Gao, K.; Clark, J.R. Nodal Yield and Survival in Oral Squamous Cancer. Cancer 2011, 117, 2917–2925. [Google Scholar] [CrossRef]
- Divi, V.; Harris, J.; Harari, P.M.; Cooper, J.S.; McHugh, J.; Bell, D.; Sturgis, E.M.; Cmelak, A.J.; Suntharalingam, M.; Raben, D.; et al. Establishing Quality Indicators for Neck Dissection: Correlating the Number of Lymph Nodes with Oncologic Outcomes (NRG Oncology RTOG 9501 and RTOG 0234). Cancer 2016, 122, 3464–3471. [Google Scholar] [CrossRef]
- Friedman, M.; Lim, J.W.; Dickey, W.; Tanyeri, H.; Kirshenbaum, G.L.; Phadke, D.M.; Caldarelli, D. Quantification of Lymph Nodes in Selective Neck Dissection. Laryngoscope 1999, 109, 368–370. [Google Scholar] [CrossRef]
- Omura, K. Current Status of Oral Cancer Treatment Strategies: Surgical Treatments for Oral Squamous Cell Carcinoma. Int. J. Clin. Oncol. 2014, 19, 423–430. [Google Scholar] [CrossRef]
- Monroe, M.M.; Lai, S.Y. Sentinel Lymph Node Biopsy for Oral Cancer: Supporting Evidence and Recent Novel Developments. Curr. Oncol. Rep. 2014, 16, 385. [Google Scholar] [CrossRef]
- Ganly, I.; Patel, S.; Shah, J. Early Stage Squamous Cell Cancer of the Oral Tongue--Clinicopathologic Features Affecting Outcome. Cancer 2012, 118, 101–111. [Google Scholar] [CrossRef]
- Loganathan, P.; Sayan, A.; Hsu, D.W.K.; Paraneetharan, S.; Ilankovan, V. Squamous Cell Carcinoma of the Anterior Tongue: Is Tumour Thickness an Indicator for Cervical Metastasis? Int. J. Oral Maxillofac. Surg. 2017, 46, 407–412. [Google Scholar] [CrossRef]
- Marres, C.C.M.; de Ridder, M.; Hegger, I.; van Velthuysen, M.L.F.; Hauptmann, M.; Navran, A.; Balm, A.J.M. The Influence of Nodal Yield in Neck Dissections on Lymph Node Ratio in Head and Neck Cancer. Oral Oncol. 2014, 50, 59–64. [Google Scholar] [CrossRef]
- Raja, R.S.; Weinreb, I.; Bullock, M.J.; Carlson, D.L.; Ferris, R.L.; Harrison, L.B.; McHugh, J.B.; Pettus, J.; Richardson, M.S.; Shah, J.; et al. Protocol for the Examination of Specimens from Patients with Carcinomas of the Lip and Oral Cavity. 2017. Available online: https://cap.objects.frb.io/protocols/cp-headandneck-lip-oralcavity-17protocol-4001.pdf (accessed on 18 May 2022).
- Liberati, A.; Altman, D.G.; Tetzlaff, J.; Mulrow, C.; Gøtzsche, P.C.; Ioannidis, J.P.A.; Clarke, M.; Devereaux, P.J.; Kleijnen, J.; Moher, D. The PRISMA Statement for Reporting Systematic Reviews and Meta-Analyses of Studies That Evaluate Health Care Interventions: Explanation and Elaboration. J. Clin. Epidemiol. 2009, 62, e1–e34. [Google Scholar] [CrossRef] [Green Version]


| Survival Endpoints | Studies Analyzing Exclusively Patients with Positive Lymph Nodes (Group YES) | Studies Analyzing Patients with Positive and Negative Lymph Nodes (Group NO) | ||||
|---|---|---|---|---|---|---|
| n § | RR (95% CI) | Heterogeneity I2, p | n § | RR (95% CI) | Heterogeneity I2, p | |
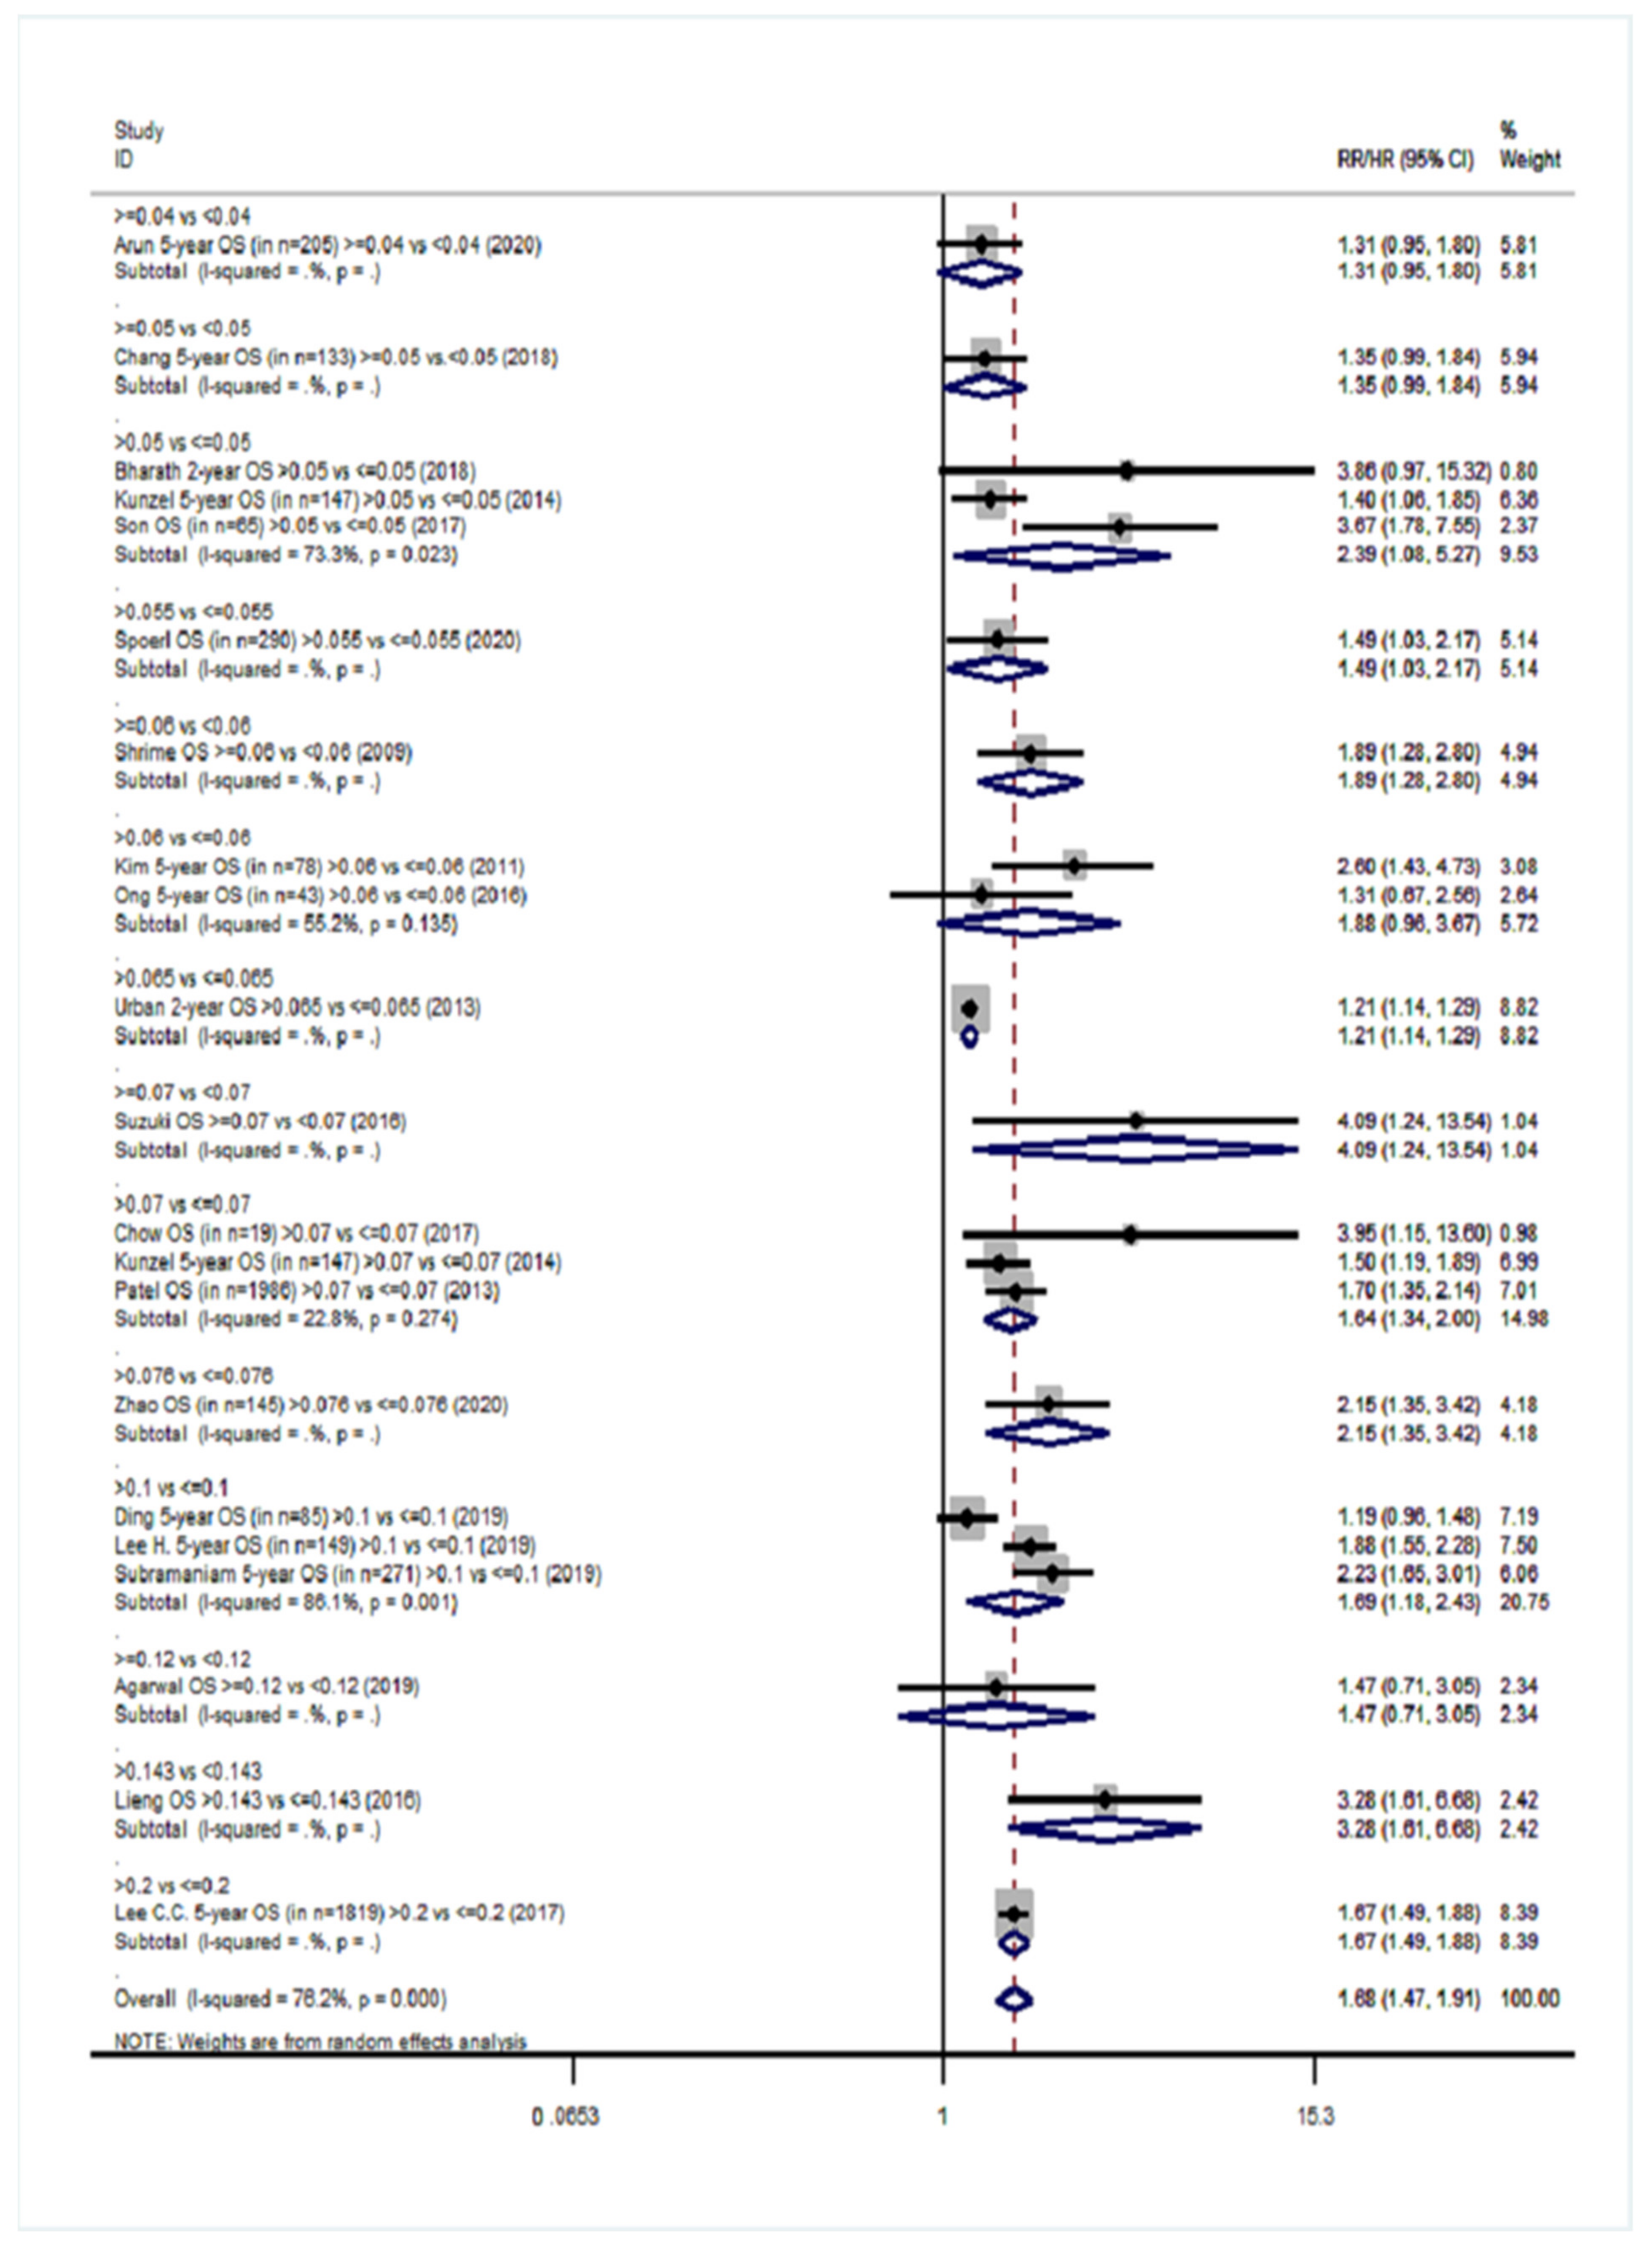
| Overall survival (OS) | 20 | 1.68 (1.47–1.91) | 76.2%, <0.001 | 18 | 2.38 (1.99–2.85) | 82.6%, <0.001 |
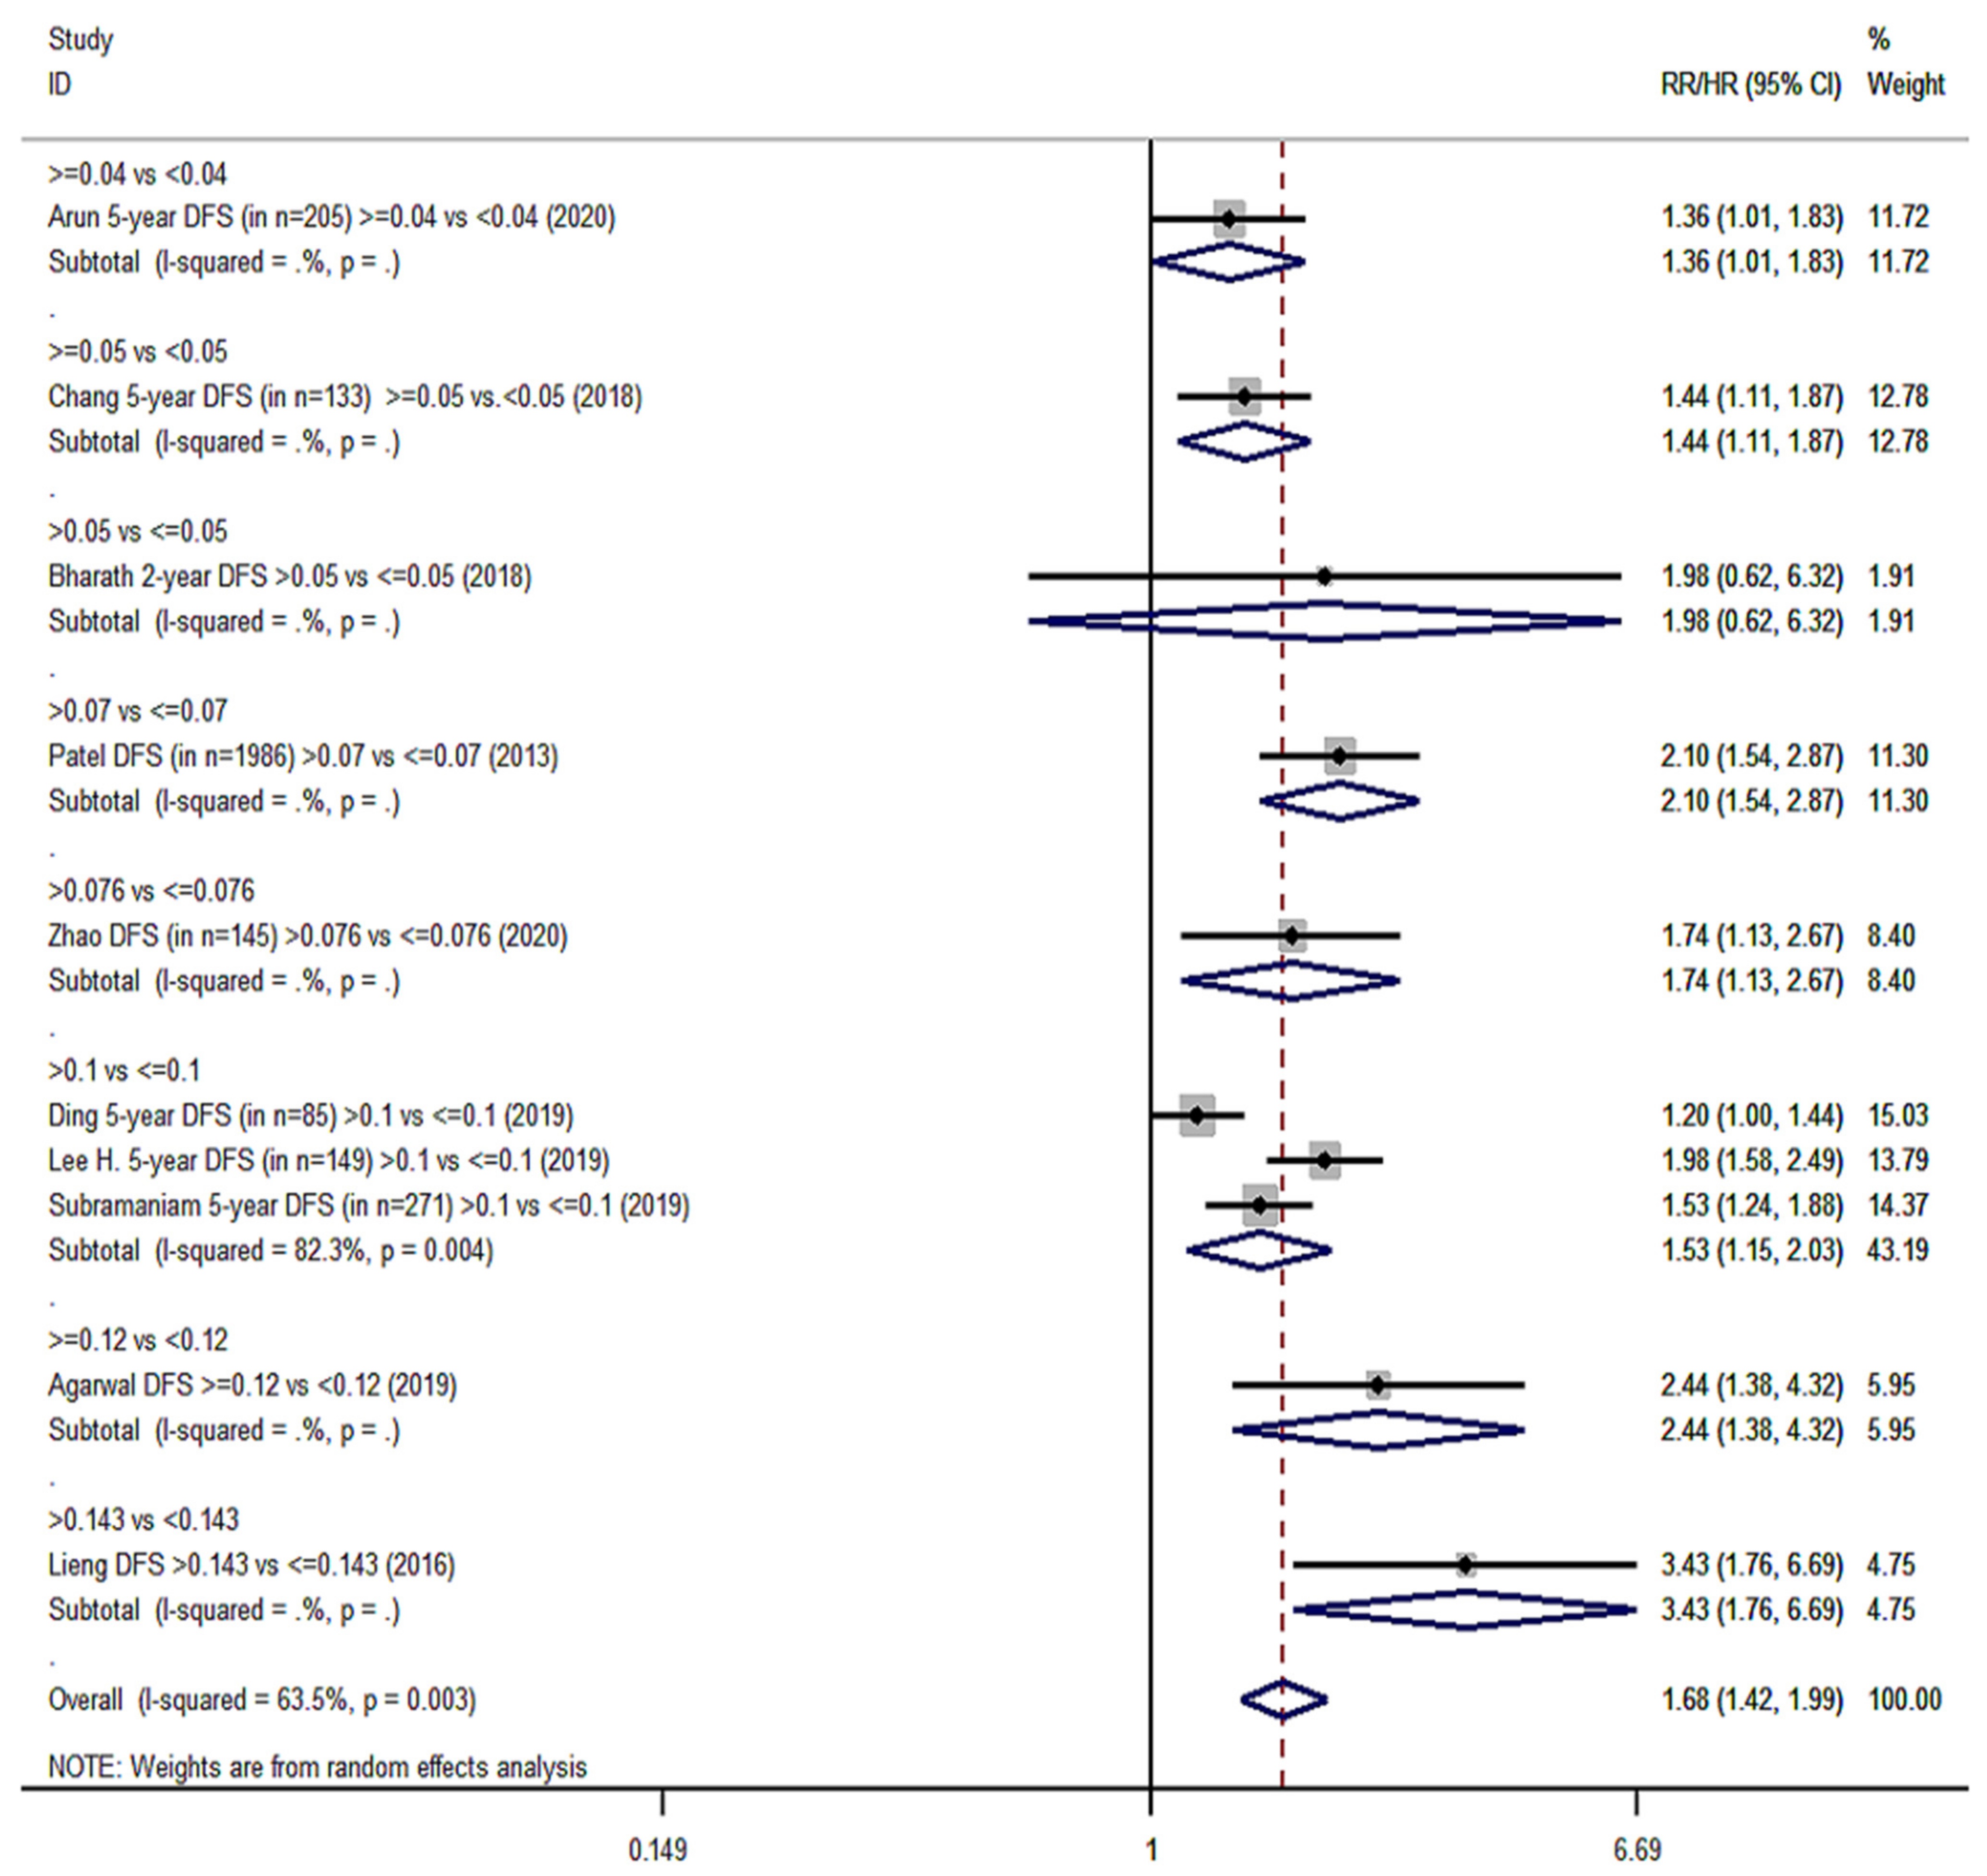
| Disease-free survival (DFS) | 10 | 1.68 (1.42–1.99) | 63.5%, 0.003 | 7 | 2.04 (1.48–2.81) | 93.2%, <0.001 |
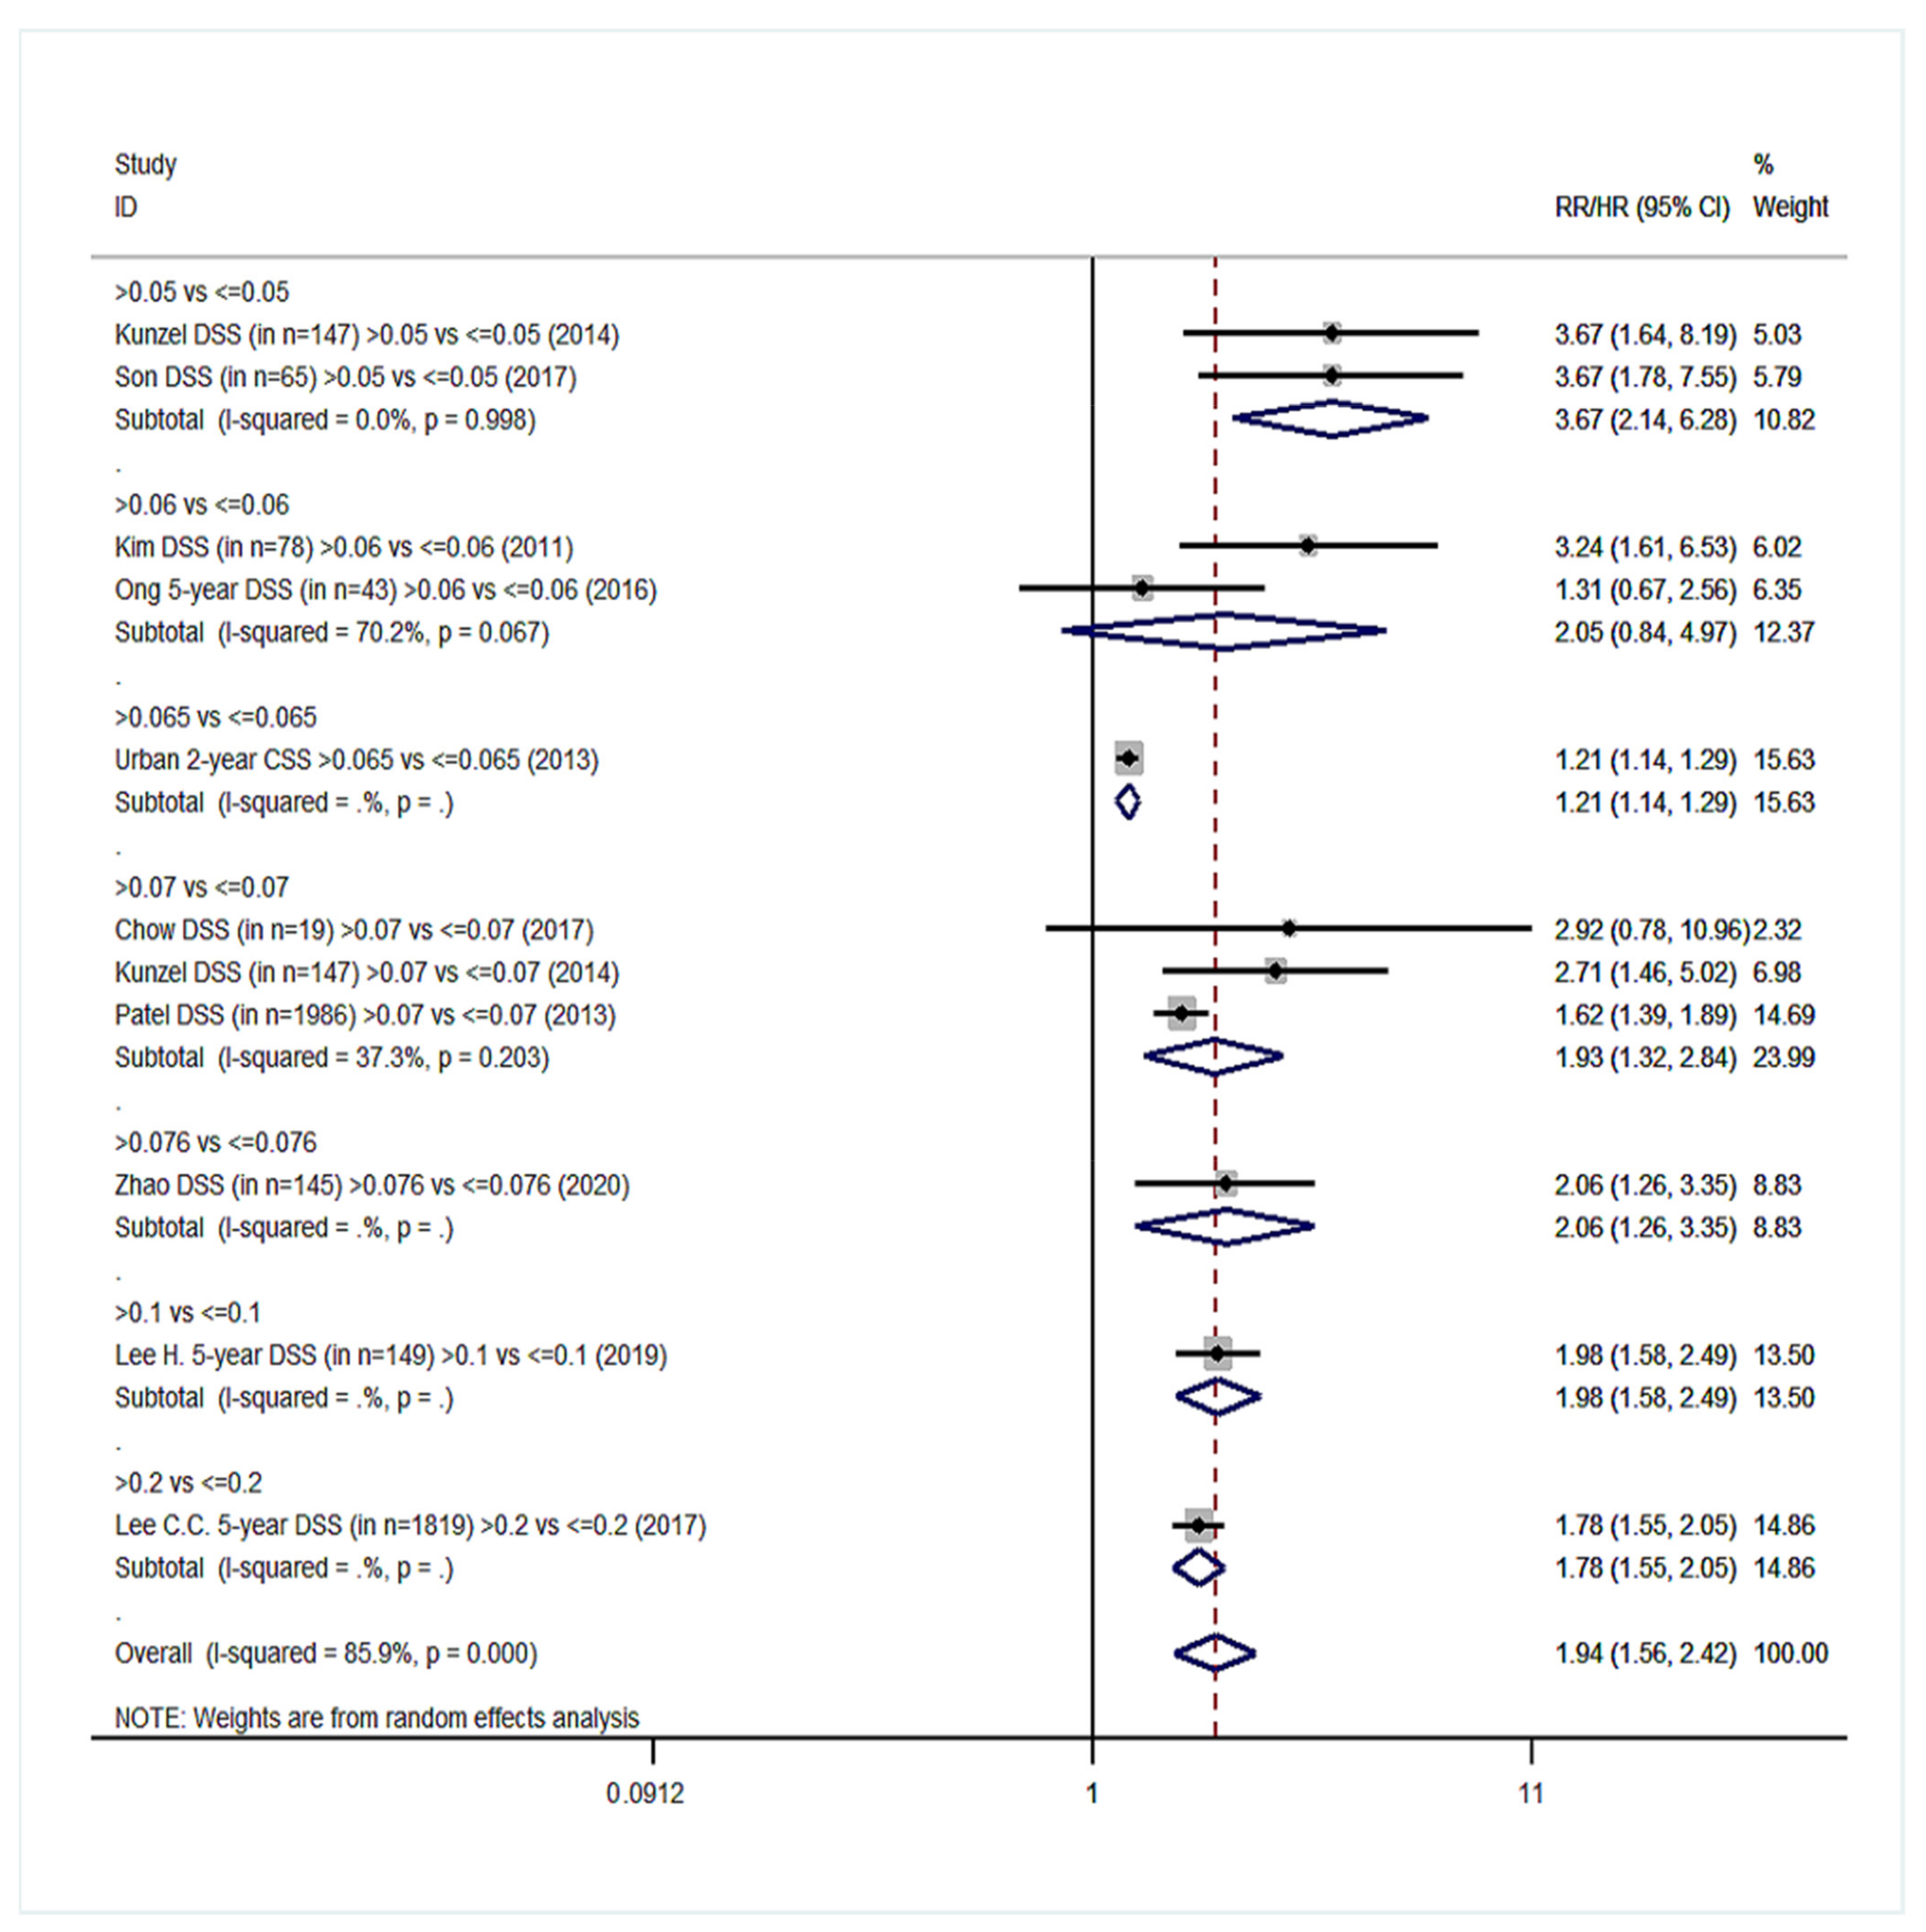
| Disease-specific survival (DSS) | 11 | 1.94 (1.56–2.42) | 85.9%, <0.001 | 8 | 2.90 (2.35–3.57) | 61.2%, 0.012 |
| Recurrence-free survival (RFS) | 2 | 2.27 (0.91–5.62) | 80.4%, 0.024 | 1 | Only 1 study | NC |
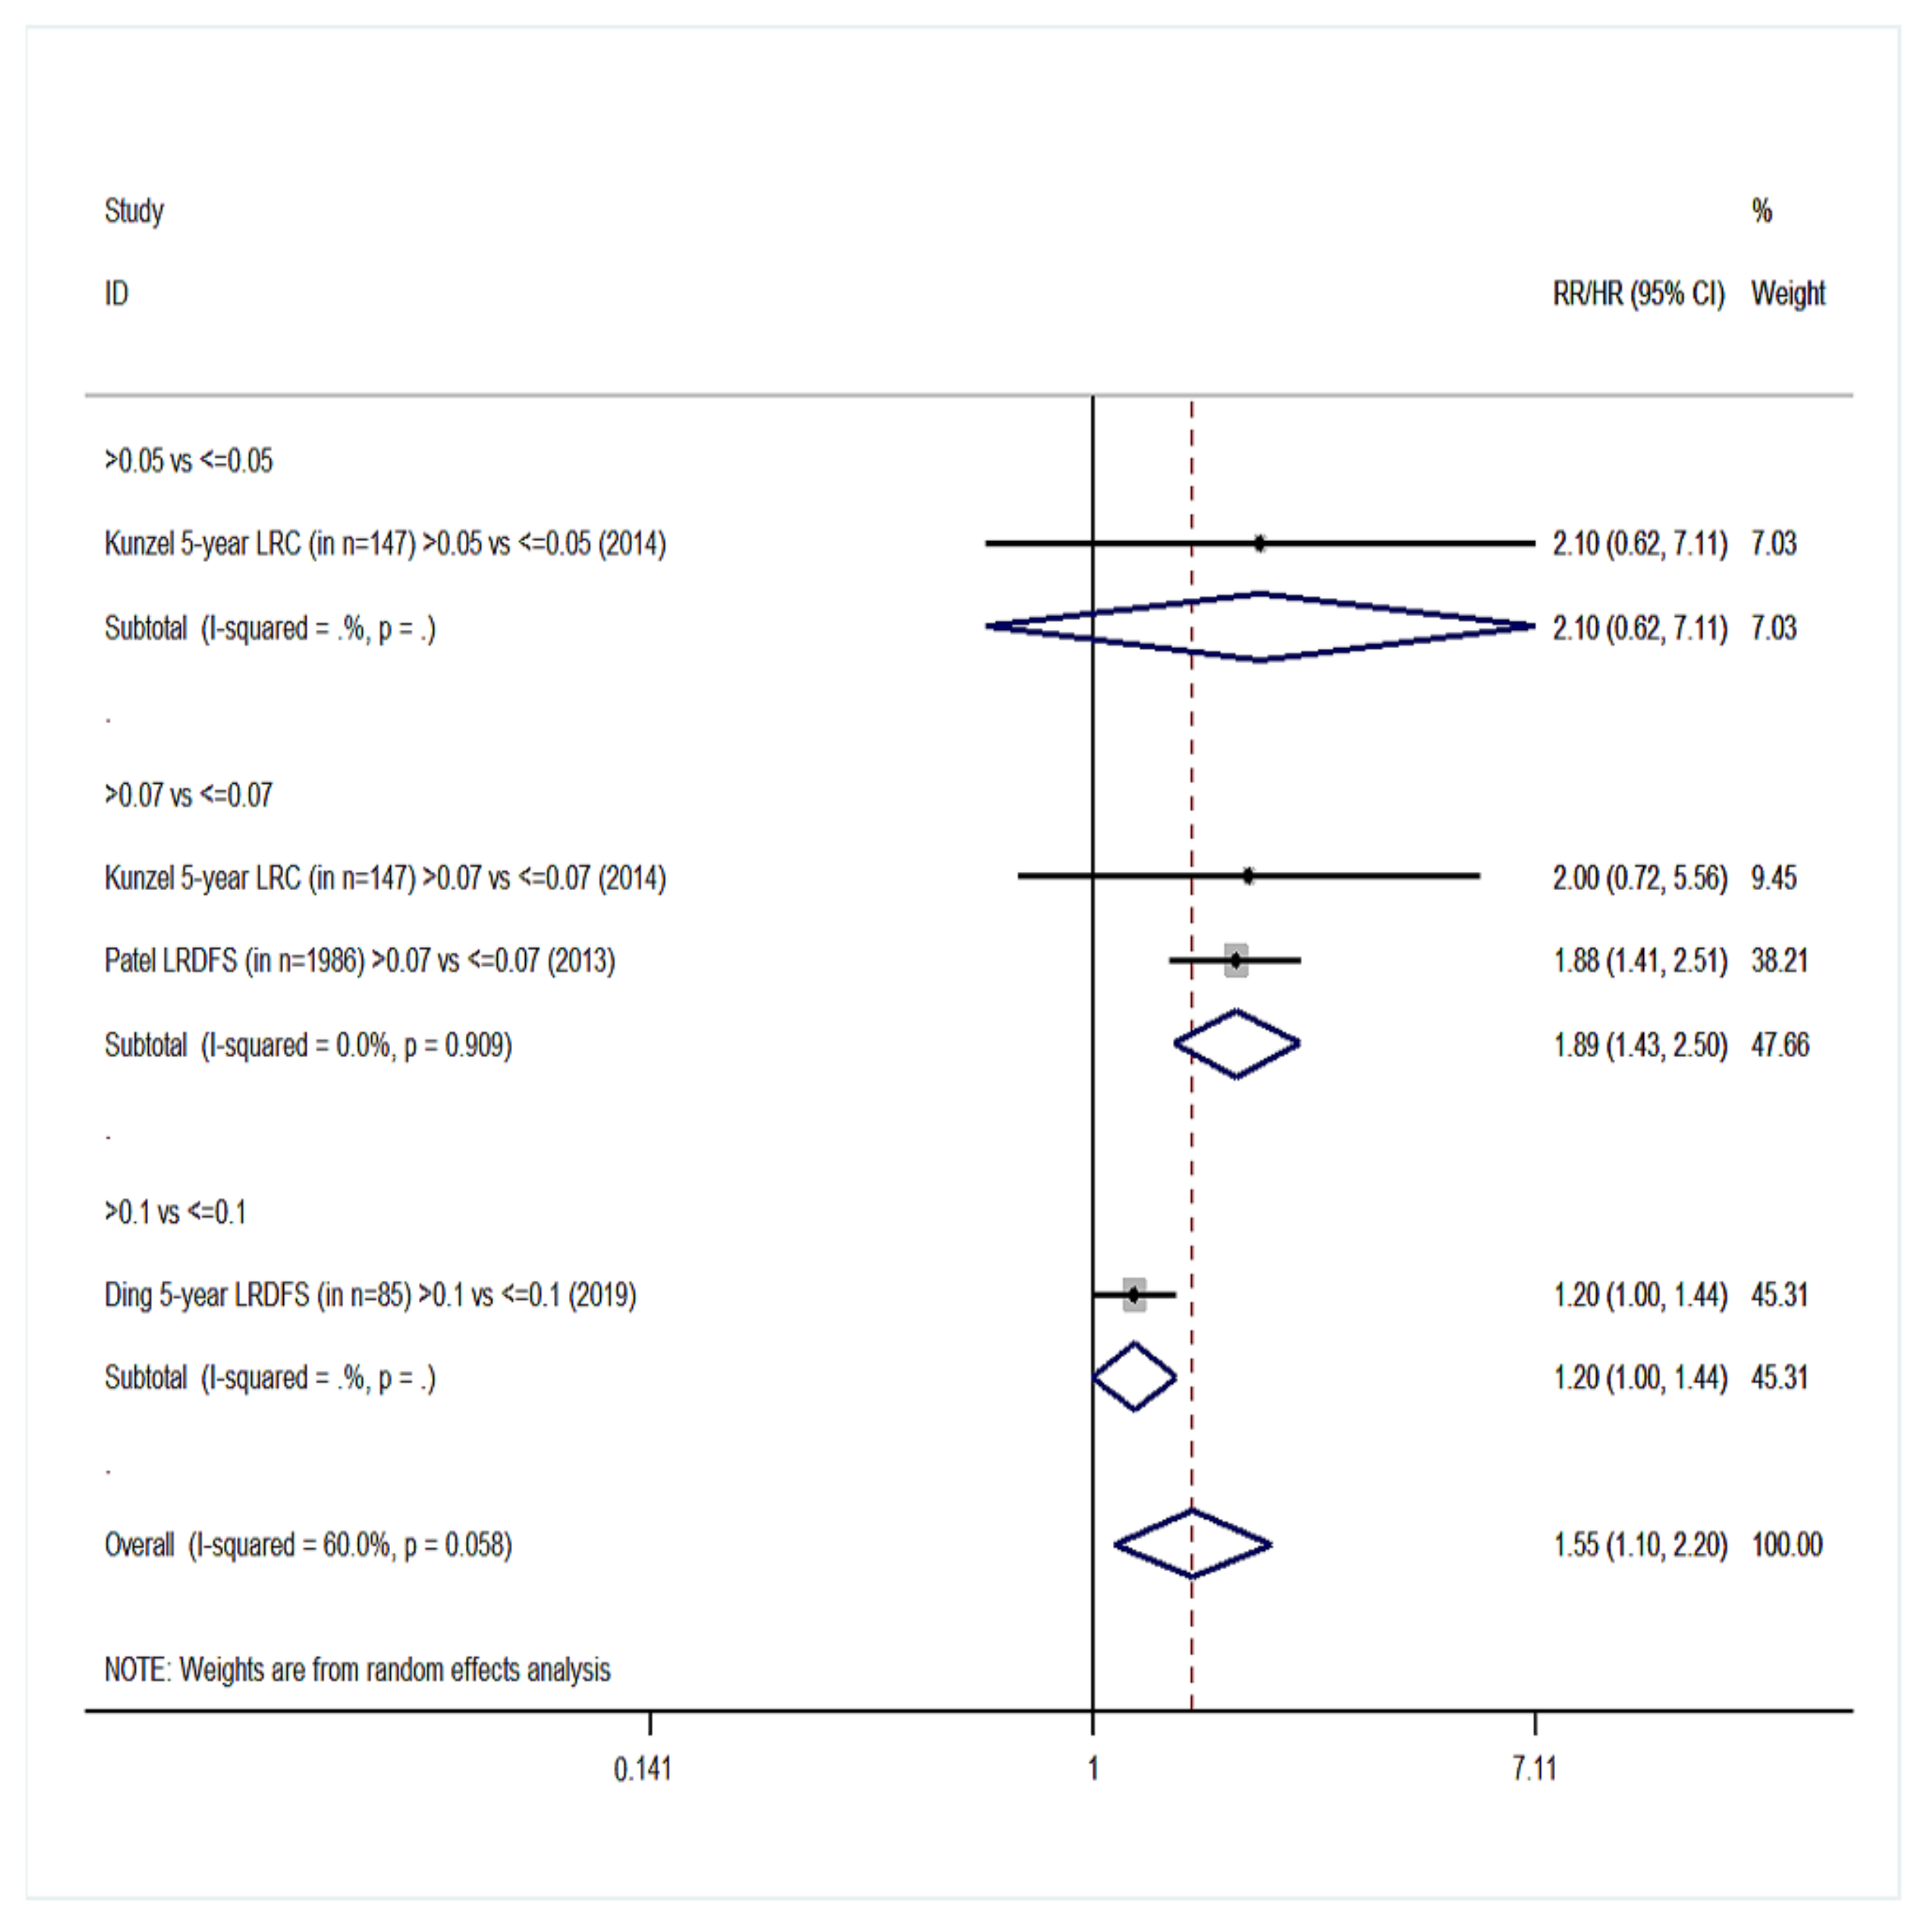
| Locoregional disease-free survival (LRDFS) | 4 | 1.55 (1.10–2.20) | 60%, 0.058 | 3 | 1.88 (0.83–4.25) | 72.4%, 0.027 |
| Distant metastasis-free survival (DMFS) | 4 | 1.83 (1.13–2.96) | 77.4%, 0.004 | 3 | 2.11 (0.97–4.63) | 94%, <0.001 |
| Local recurrence-free survival (LRFS) | 3 | 1.73 (1.41–2.13) | 6.1%, 0.345 | 1 | Only 1 study | NC |
Publisher’s Note: MDPI stays neutral with regard to jurisdictional claims in published maps and institutional affiliations. |
© 2022 by the authors. Licensee MDPI, Basel, Switzerland. This article is an open access article distributed under the terms and conditions of the Creative Commons Attribution (CC BY) license (https://creativecommons.org/licenses/by/4.0/).
Share and Cite
Gartagani, Z.; Doumas, S.; Kyriakopoulou, A.; Economopoulou, P.; Psaltopoulou, T.; Kotsantis, I.; Sergentanis, T.N.; Psyrri, A. Lymph Node Ratio as a Prognostic Factor in Neck Dissection in Oral Cancer Patients: A Systematic Review and Meta-Analysis. Cancers 2022, 14, 4456. https://doi.org/10.3390/cancers14184456
Gartagani Z, Doumas S, Kyriakopoulou A, Economopoulou P, Psaltopoulou T, Kotsantis I, Sergentanis TN, Psyrri A. Lymph Node Ratio as a Prognostic Factor in Neck Dissection in Oral Cancer Patients: A Systematic Review and Meta-Analysis. Cancers. 2022; 14(18):4456. https://doi.org/10.3390/cancers14184456
Chicago/Turabian StyleGartagani, Zoi, Stergios Doumas, Artemis Kyriakopoulou, Panagiota Economopoulou, Theodora Psaltopoulou, Ioannis Kotsantis, Theodoros N. Sergentanis, and Amanda Psyrri. 2022. "Lymph Node Ratio as a Prognostic Factor in Neck Dissection in Oral Cancer Patients: A Systematic Review and Meta-Analysis" Cancers 14, no. 18: 4456. https://doi.org/10.3390/cancers14184456
APA StyleGartagani, Z., Doumas, S., Kyriakopoulou, A., Economopoulou, P., Psaltopoulou, T., Kotsantis, I., Sergentanis, T. N., & Psyrri, A. (2022). Lymph Node Ratio as a Prognostic Factor in Neck Dissection in Oral Cancer Patients: A Systematic Review and Meta-Analysis. Cancers, 14(18), 4456. https://doi.org/10.3390/cancers14184456