Article

Molecular Divergence upon EGFR-TKI Resistance Could Be Dependent on the Exon Location of the Original EGFR-Sensitizing Mutation

by
Roberto Serna-Blasco
1,
Estela Sánchez-Herrero
1,2,
Lucía Robado de Lope
1,
Sandra Sanz-Moreno
1,
Alejandro Rodríguez-Festa
1,
Dunixe Ares-Trotta
1,
Alberto Cruz-Bermúdez
1,
Fabio Franco
3,
Alfredo Sánchez-Hernández
4,
María de Julián Campayo
4,
Carlos García-Girón
5,
Manuel Dómine
6,
Ana Blasco
7,
José M. Sánchez
8,
Juana Oramas
9,
Joaquim Bosch-Barrera
10,
María Á. Sala
11,
María Sereno
12,
Atocha Romero
1,3,* and
Mariano Provencio
3
1
Liquid Biopsy Laboratory, Instituto de Investigación Sanitaria Hospital Puerta de Hierro—Segovia de Arana, 28222 Madrid, Spain
2
I+D Department, Atrys Health, 08025 Barcelona, Spain
3
Medical Oncology, Hospital Puerta de Hierro, 28222 Majadahonda, Spain
4
Medical Oncology, Hospital Provincial Centre de Castelló, 120002 Castellón de La Plana, Spain
5
Medical Oncology, Hospital Universitario de Burgos, 09006 Burgos, Spain
6
Medical Oncology, Fundación Jiménez Díaz, 28040 Madrid, Spain
7
Medical Oncology, Hospital General Universitario Valencia, 46014 Valencia, Spain
8
Medical Oncology, Hospital de La Princesa, 28006 Madrid, Spain
9
Medical Oncology, Hospital Universitario de Canarias, 38320 La Laguna, Spain
10
Medical Oncology, Hospital ICO Girona, 8908 Girona, Spain
11
Medical Oncology, Hospital Basurto, 48013 Bilbao, Spain
12
Medical Oncology, Hospital Universitario Infanta Sofía, 28703 San Sebastián de Los Reyes, Spain
*
Author to whom correspondence should be addressed.
Cancers 2022, 14(18), 4446; https://doi.org/10.3390/cancers14184446
Submission received: 19 August 2022 / Revised: 7 September 2022 / Accepted: 8 September 2022 / Published: 13 September 2022
(This article belongs to the Special Issue Circulating Biomarkers in Cancer)

Abstract

:

Simple Summary

In this study, we report that the exon location of the original EGFR-sensitizing mutation could drive resistance mechanisms underlying tumor progression in advanced EGFR-positive NSCLC patients under targeted therapies. In our study, plasma detection of the p.T790M EGFR resistance mutation, upon disease progression, was more frequent in tumors with an EGFR exon 19 deletion (p = 0.0028). Furthermore, oncogenic mutations of KRAS, arising upon disease progression in 5.6% of the cases, were always detected in patients with tumors harboring EGFR exon 18 or 21-sensitizing mutations (p < 0.001).

Abstract

Tumor molecular profiling upon disease progression enables investigations of the tumor evolution. Next-generation sequencing (NGS) of liquid biopsies constitutes a noninvasive readily available source of tumor molecular information. In this study, 124 plasma samples from advanced EGFR-positive NSCLC patients, treated with a first-line EGFR tyrosine kinase inhibitor (EGFR-TKI) were collected upon disease progression. The circulating cell-free DNA (cfDNA) was sequenced using the Oncomine Pan-Cancer Cell-Free Assay™. Excluding EGFR mutations, the most frequently mutated gene was TP53 (57.3%), followed by APC (11.3%), FGFR3 (7.3%), and KRAS (5.6%). Different molecular alterations were observed upon disease progression depending on the location of the original EGFR-sensitizing mutation. Specifically, the detection of the p.T790M mutation was significantly associated with the presence of exon 19 mutations in EGFR (Fisher p-value: 0.028). All KRAS activating mutations (n = 8) were detected in tumors with EGFR mutations in exons 18 and 21 (Fisher p-value < 0.001). Similarly, mutations in NRAS and HRAS were more frequently detected in samples from tumors harboring mutations in exons 18 or 21 (Fisher p-value: 0.050 and Fisher p-value: 0.099, respectively). In conclusion, our data suggest that the mechanisms underlying EGFR-TKI resistance could be dependent on the exon location of the original EGFR-sensitizing mutation.

1. Introduction

Lung cancer is currently a serious public health problem. In the United States, the incidence of lung cancer is responsible for approximately one in seven cases of cancer in both sexes, but one in four deaths, being by far the leading cause of cancer death [1]. According to pathology reports, lung cancer can be classified into two main groups: non-small-cell lung cancer (NSCLC) and small-cell lung cancer, accounting for 85% and 15% of the cases, respectively. Among NSCLCs, EGFR-positive tumors define a subtype that may benefit from targeted therapies. Overall, EGFR mutations are mainly detected in young patients, females, and Asians. The age-standardized incidence rate of EGFR-positive NSCLC has been reported to be five per 100,000 person-years [2,3].
Despite EGFR inhibitors having dramatically improved the survival outcomes and quality of life of EGFR-positive NSCLC patients, drug-resistance mechanisms invariably emerge after treatment, leading to tumor progression within 2 years [4]. Currently, there is intense ongoing research focused on new treatment strategies for EGFR-mutated NSCLC patients. As a result, several third-generation EGFR tyrosine kinase inhibitors (EGFR-TKIs) are in the late stage of clinical development [5,6,7], and fourth-generation EGFR inhibitors are being evaluated in preclinical stages and phase I trials [8]. Similarly, the efficacy of the combinations of an EGFR-TKI with chemotherapy or antiangiogenic drugs has been evaluated in several trials [9,10]. Other drug combinations such as the third-generation EGFR-TKI lazertinib plus amivantamab, a human antibody targeting EGFR and MET, are under investigation. Furthermore, encouraging results have been reported with more than one-third of EGFR-mutant NSCLC patients that progressed on osimertinib showing durable responses [11].
A wide range of survival outcomes is observed in EGFR-positive NSCLC. Hence, some EGFR-mutant NSCLC patients exhibit a particularly good prognosis with a time to progression exceeding 30 months, while others are diagnosed as having tumor progression within 6 months of EGFR-TKI treatment initiation [12]. Heterogeneity caused by different clonal populations may underlie different clinical responses. Indeed, a high clonal diversity has been observed in early-stage EGFR-positive NSCLC patients [13,14,15]. In this regard, it was reported that, in advanced EGFR-positive NSCLC, tumors harboring concurrent TP53 or RB1 mutations showed a higher risk of histologic transformation and inferior sensitivity to EGFR-TKI [16,17]. Tumor biopsies in lung cancer upon disease progression are often not feasible or they may not reflect intratumoral heterogeneity and other relevant mutations that may arise in secondary lesions [18,19,20]. In such a scenario, liquid biopsy emerges as an attractive approach for tumor molecular profiling upon disease progression.
In this study, we performed a thorough explorative analysis of EGFR-positive NSCLC through NGS profiling of the plasma sample collected upon disease progression of 124 patients in order to characterize the molecular mechanisms via which tumors may progress and to identify the molecular mechanisms underlying different prognoses.

2. Materials and Methods

2.1. Patients and Samples

A total of 124 patients were recruited by 35 hospitals from February 2016 to September 2021. Written consent was obtained for all enrolled patients. This study was approved by the Ethical Committee of Hospital Puerta de Hierro, Madrid, Spain (internal code: PI 02/16), and conducted in accordance with the precepts of the Code of Ethics of the World Medical Association (Declaration of Helsinki). All patients included in this study were diagnosed with stage IV EGFR-positive NSCLC (as per the criteria of the American Joint Committee on Cancer, seventh edition). EGFR testing in the FFPE tissue sample was carried out in the pathology department of each participating hospital. Patients were at least 18 years old with a life expectancy of over 12 weeks. All patients were treated with a first-line EGFR-TKI. The choice of TKI therapy was left to the discretion of the physician. A plasma sample was collected in an 8.5 mL PPT™ tube (Becton Dickinson, Franklin Lakes, NJ, USA) upon disease progression (n = 124). Treatment response was assessed as per Response Evaluation Criteria in Solid Tumors (RECIST) version 1.1 criteria. The average time between the diagnosis disease progression and blood drawn was 5.4 days.

2.2. Laboratory Procedures

Blood samples were centrifuged at 1600× g for 10 min then immediately at 6000× g for 10 min; both centrifugations were performed at room temperature. Hemolyzed samples were excluded. Circulating cell-free DNA (cfDNA) was extracted from the resulting plasma using cfDNA QIAmp Circulating Nucleic Acid kit (Qiagen, Hiden, Germany) following the manufacturer’s protocol. cfDNA was quantified using Qubit 2.0 Fluorometer with a Qubit 1× dsDNA HS Assay Kit (Thermo Fisher, Palo Alto, CA, USA). Libraries were prepared using the Oncomine™ Pan-Cancer Cell-Free Assay kit (Thermo Fisher, Palo Alto, CA, USA), according to the manufacturer’s instructions (the list of genes covered by this panel is available in Supplementary Data S1). The minimum input of cfDNA from each sample required for library preparation was 10 ng, and the maximum volume was 10.4 µL. If less volume of cfDNA was used, RNase-free water was added up to a total volume of 10.4 µL. For library purification, AMPureXP magnetic beads (Beckman Coulter, Inc., Brea, CA, USA) were used. Finally, libraries were diluted to 50 pM using the quantification values obtained from an Ion Library TaqMan® Quantitation Kit (Thermo Fisher, Palo Alto, CA, USA) in a StepOnePlus™ qPCR machine (Thermo Fisher, Palo Alto, CA, USA). Libraries were prepared in batches of eight and were stored at −20 °C up to a maximum of 2 weeks until pool preparation.
A total of 16 samples were sequenced in every NGS run using two Ion 550™ Chips, each of them loaded with eight pooled samples. Templating and Ion 550™ Chip loading were carried out with an Ion Chef™ System (Thermo Fisher, Palo Alto, CA, USA), and then chips were sequenced on an Ion GeneStudio™ S5 Sequencer (Thermo Fisher, Palo Alto, CA, USA). Torrent Suite Software v5.12.2 was used to perform raw sequencing data analysis. The CoverageAnalysis v5.12.2 plugin was used for sequencing coverage analysis. Raw reads were aligned to the human reference genome hg19. Variant calling was carried out on the Ion Reporter platform v.5.18 using Oncomine TagSeq Pan-Cancer Liquid Biopsy—w2.5—Single Sample (workflow versions from w2.1 to w2.5 were used). Variant filtering was performed using an internal pipeline. The pipeline uses the raw data in the non-filtered-oncomine.tsv, which contains variants that have passed the OncomineVariants (v.5.12) filter and variants that have not. Specific conditions were established for single-nucleotide variants (SNVs), insertions or deletions (indels), multiple-nucleotide polymorphisms (MNP), fusions, and copy number variant (CNV) calls. Detailed information about the pipeline is available in Supplementary Figure S1. All candidate mutations were manually reviewed using the Integrative Genomics Viewer (IGV) v.2.3.40, (Broad Institute, Cambridge, MA, USA). The clinical significance of somatic variants was determined according to the Standards and Guidelines for the Interpretation and Reporting of Sequence Variants in Cancer [21]. The pathogenicity of TP53 and APC variants was assessed according to TP53-specific ACMG/AMP guidelines [22].
Genomic variants identified by NGS were further confirmed by digital PCR (dPCR) (the mutant allele frequency concordance between NGS and dPCR is shown in Supplementary Figure S2). A complete list of validated variants is available in Supplementary Data S2. In addition, variants identified as potential resistance mechanisms were retrospectively tracked using dPCR (or NGS in the case of CNVs) in all cases in which a baseline sample (before treatment initiation) was available (Supplementary Data S3). dPCR was carried out using predesigned or customized TaqMan® dPCR assays in a QuantStudio® 3D Digital PCR (Applied Biosystems®, South San Francisco, CA, USA). An 18 μL final reaction mix was obtained with 8.55 μL of template cfDNA, 9 μL of 20× QuantStudio® Master Mix, and 0.45 μL 40× TaqMan assay. Then, 14.5 μL of the final reaction volume was loaded to a QuantStudio® 3D digital PCR 20K chip. Positive and negative controls were included in every run. Thermal cycler conditions were defined as a first denaturalization step at 96 °C for 10 min, followed by 40 cycles at 56 °C for 2 min and 98 °C for 30 s, an elongation step at 72 °C for 10 min, before finally maintaining the samples at 22 °C for at least 30 min. Then, chip fluorescence was read twice using two independent QuantStudio® 3D Digital PCR instruments. The analysis was performed with QuantStudio® 3D AnalysisSuite™ Cloud; the default call assignment for each read was manually adjusted when needed. The limits of detection and quantitation of the dPCR TaqMan® assays were estimated according to the recommendations of The International Council for Harmonization of Technical Requirements for Pharmaceuticals for Human Use; ICH Q2 (R1) guidelines (validation of analytical procedures: text and methodology), as published elsewhere [23].

2.3. Statistical Analysis

Categorical variables are summarized as frequencies, and potential associations were evaluated using the chi-square test or Fisher’s test as appropriate, whereas continuous variables are shown as the mean and standard deviation (non-normally distributed variables are displayed as the median, along with 25th and 75th percentiles), and potential associations were tested using Student’s t-test or the Mann–Whitney U test.
Overall survival (OS) was defined as the time from diagnosis of stage IV NSCLC to death from any cause or the censored date of the last follow-up for patients who were alive when the data were extracted. Progression-free survival (PFS) was defined as the time between the start of EGFR-TKI treatment and disease progression, as assessed by RECIST criteria, and death from any cause or the censored date of the last follow-up, whichever occurred first. Survival was evaluated using the Kaplan–Meier method with Cox proportional hazards model assumption. The log-rank test was used to assess statistical differences between Kaplan–Meier survival curves. Hazard ratios (HRs) were estimated from the Cox model using a univariate approach. The statistical analysis was performed using R software (v.4.1.2) and Stata version 16.0 (StataCorp 2019, Stata Statistical Software Release 16; StataCorp LLC, College Station, TX, USA).

3. Results

3.1. Study Cohort

Between February 2016 and September 2021, 124 blood samples from advanced EGFR-positive NSCLC patients were collected upon disease progression to a first-line EGFR-TKI. The clinical characteristics of the study population are presented in Table 1. Patients were mostly women (77; 62.1%) and never-smokers (71; 57.3%). The mean age at diagnosis was 65.8 years (range 38–89). A total of 116 (93.6%) cases were adenocarcinomas, and the majority were stage IVB (64; 51.6%). Most patients had an Eastern Cooperative Oncology Group Performance Status (ECOG-PS) of 0 or 1 (72; 58.1%). All patients were treated with a first-line EGFR-TKI; 62 received afatinib (50%), 26 received erlotinib (21%), 33 received gefitinib (26.6%), and three were treated with osimertinib (2.4%).
According to the pathologist´s report, 68 (54.8%) tumors tested positive for deletions in exon 19, 43 (34.7%) tumors harbored the point mutation p.L858R in exon 21, and six (4.8%) tumors harbored insertions in exon 20. Point mutations at codon 719 (p.G719X), in exon 18, were found in three (2.4%) cases, and the p.L861Q mutation, in exon 21, was also detected in three (2.4%) cases. Lastly, one tumor harbored two concomitant EGFR-sensitizing mutations, namely, the p.S768I mutation, in exon 20, and the deletion p.E746_A750del, in exon 19.
Survival data were available for 91 patients. The median follow-up for this population was 46.7 (37.3 to 49.8) months, and the median OS was 23.6 (17.7 to 33) months. Kaplan–Meier curve for PFS, according to the original sensitizing mutations, is depicted in Supplementary Figure S3.

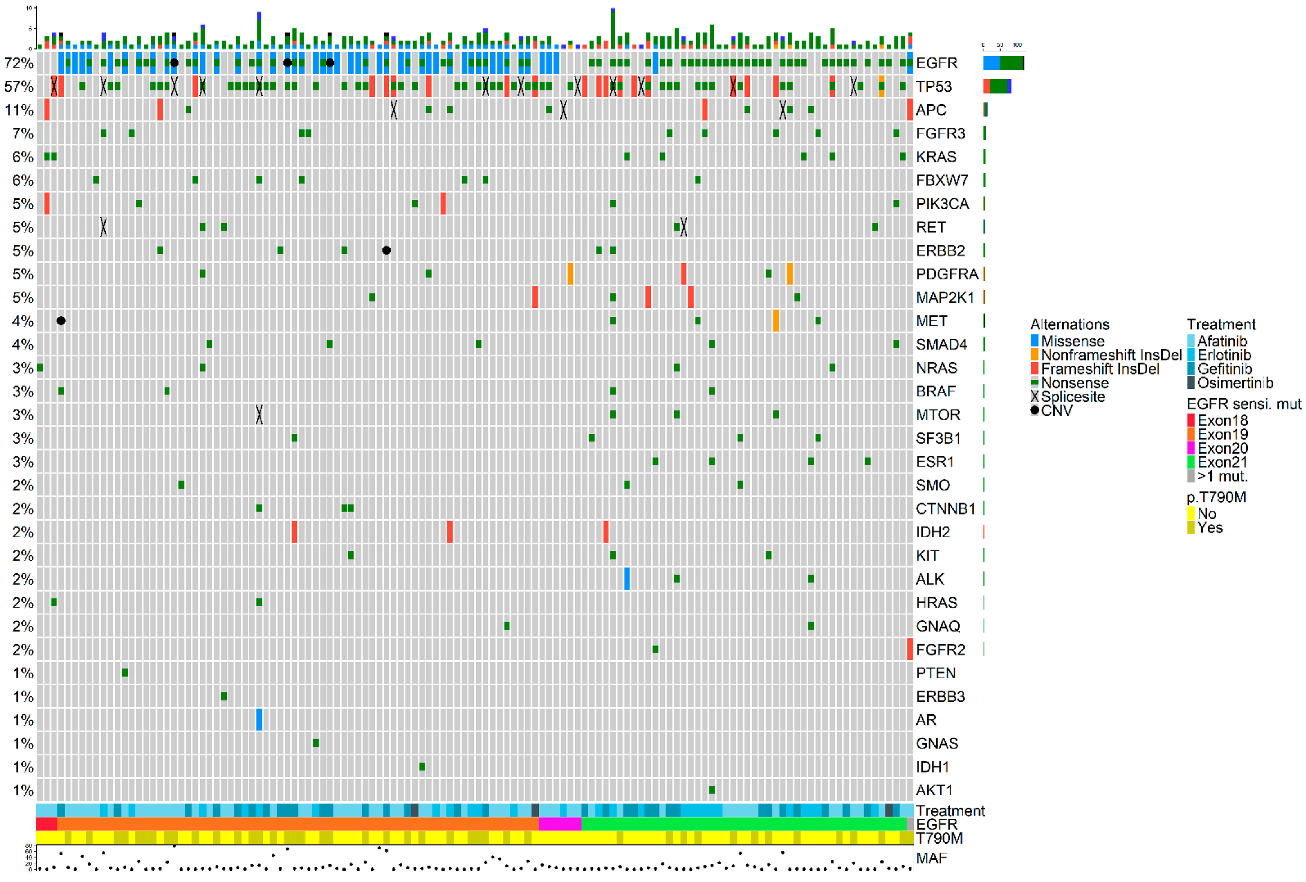
3.2. Molecular Landscape upon Disease Progression

In total, 365 somatic variants were detected across 32 genes (Figure 1). The most frequent types of variants detected were SNPs (73.9%), followed by indels (24.8%) and CNVs (1.3%). A database containing all detected mutations is available in Supplementary Data S4.
The mean number of detected mutations per sample was 2.9 (range 1–16) with a median mutant allele frequency (MAF) of 5.2% (range 0.1–77.7%) (Supplementary Table S1). Excluding EGFR mutations, the most frequently mutated gene was TP53, which was mutated in 57.3% of the cases, followed by APC (11.3%), FGFR3 (7.3%), and KRAS (5.6%) (Supplementary Table S2). Patients in whom a pathogenic mutation (class 5 or class 4) in TP53 or APC was detected upon disease progression did not show inferior OS compared to patients who did not.
As depicted in Figure 1, a widespread presence of co-occurring genetic alterations was observed. Specifically, 67.7% of the samples had concomitant mutations alongside the original EGFR-sensitizing mutation which was detected in the plasma sample of 89 patients (71.8%).
Plasma detection of the original EGFR-sensitizing mutation was more challenging in samples from patients with tumor progression exclusively at the brain level, compared with patients diagnosed as having disease progression in other locations (EGFR detection rate of 61.5% vs. 76.3%, respectively). On the contrary, the original EGFR mutation was detected in all samples from patients with disease progression at the hepatic level (13/13) (p = 0.015). The EGFR p.T790M resistance mutation was detected in 43 patients.
Oncogenic mutations in other genes were also observed. Specifically, the gain-of-function mutation p.P124L in MAP2K1 was observed in two cases. Furthermore, the p.E545K mutation in PIK3CA was detected in one patient. This mutation was absent at baseline, as well as at 3 months from treatment initiation, further supporting its role as a resistance mutation (Table 2). Similarly, the p.V600E mutation in BRAF was detected at disease progression in one case and tested negative in samples collected previously (Table 2; Supplementary Data S3).
Eight oncogenic variants in KRAS, namely, p.G12C, p.G12V, p.G12S, p.G12D, p.G15V, p.Q61R, p.Q61H, and p.A146T were detected in seven samples (5.6%) (Table 3). Of them, the p.G12C, p.G15V, p.Q61H, and p.G12D mutations were imputed as acquired resistance mechanisms as they were not detected in the previous samples from the corresponding cases. Conversely, the KRAS mutation p.A146T was found at baseline and corresponded to a patient showing the worst PFS (2.8 months) among all KRAS-positive cases (Table 2).
Lastly, CNVs in EGFR (n = 3), MET (n = 1), and ERBB2 (n = 1) were detected in five cases. These CNVs were absent in the pretreatment samples in three cases but were detected at baseline in two cases with MET and EGFR amplification. Patients in whom CNVs were detected at baseline showed the shortest PFS (2.8 and 3.9 months), suggesting primary resistance through amplification of MET or EGFR, respectively (Figure 2 and Table S2).

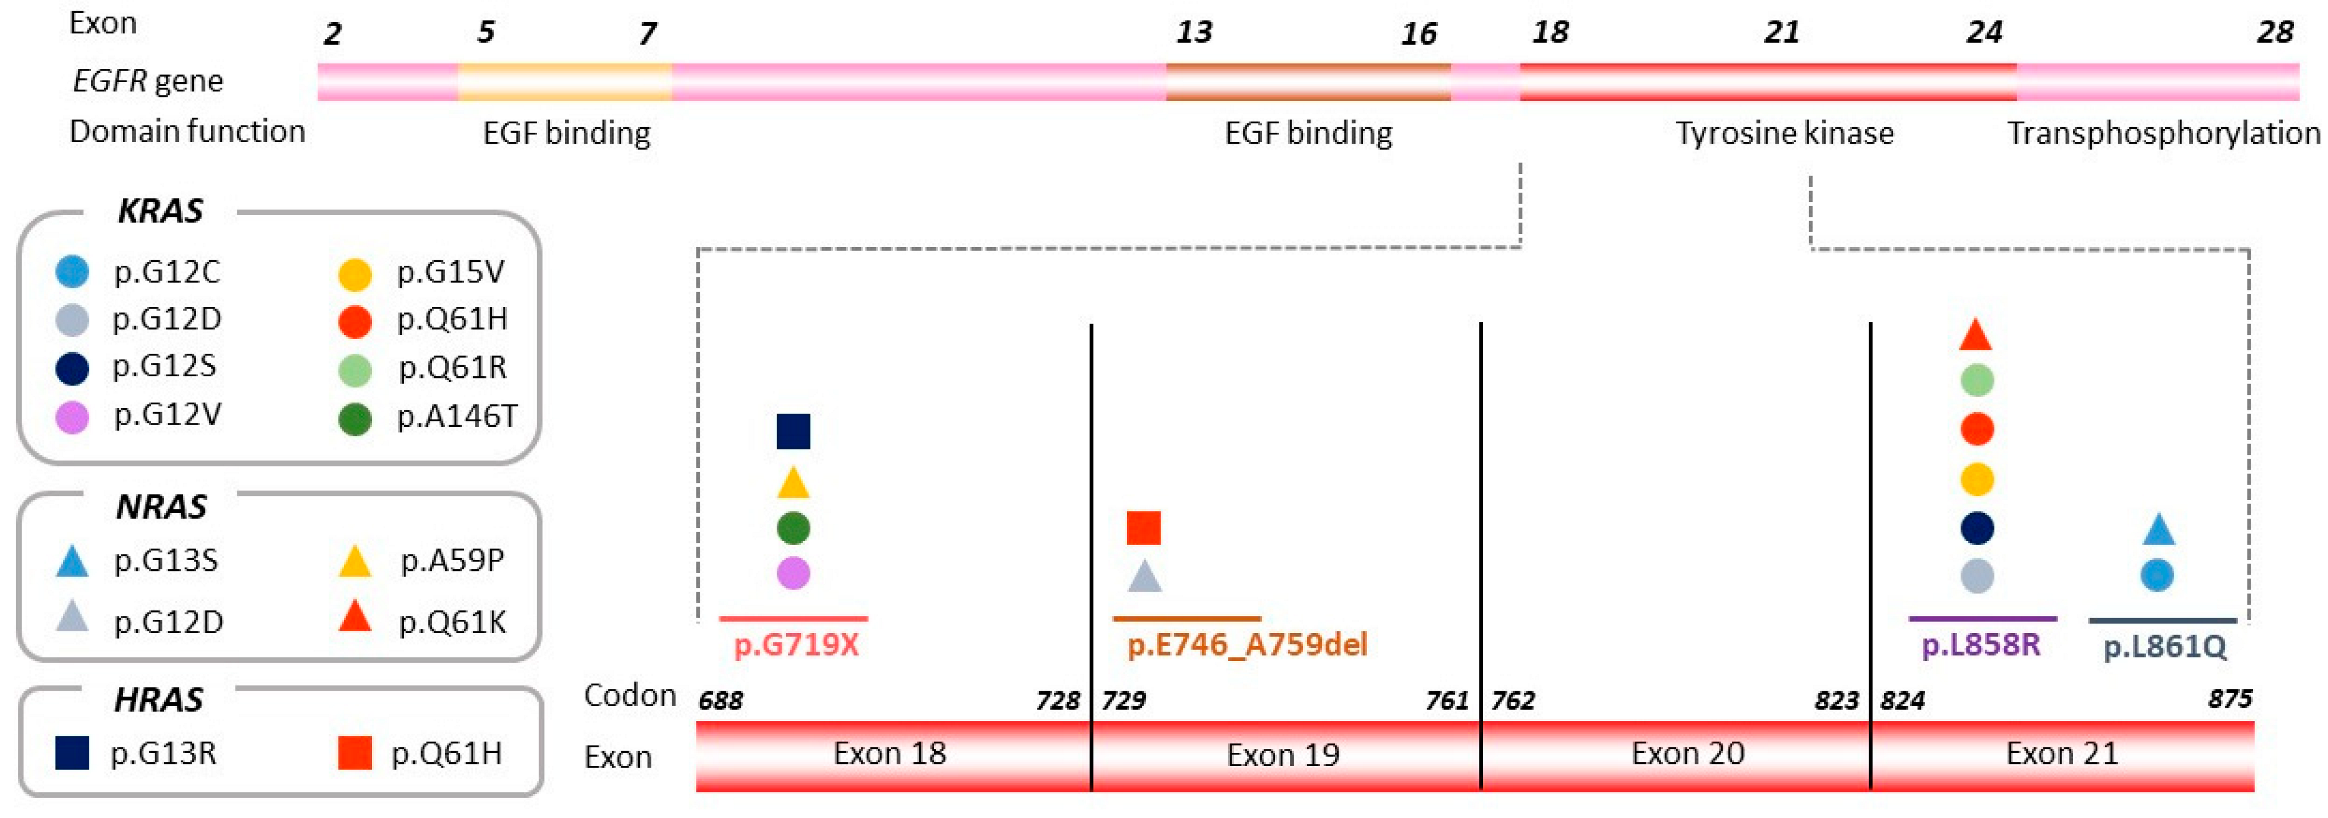
3.3. Exon Location of the Original Sensitizing Mutation Determines Distinct Molecular Profiles upon Disease Progression

Detection of the p.T790M mutation was more frequent in tumors harboring an EGFR mutation in exon 19 compared with tumors harboring an EGFR mutation in exon 21 (p = 0.028). Among p.T790M-negative cases, two cases showed clinically actionable mutations upon disease progression, which included a MET amplification and the p.G12C mutation in KRAS. The druggable p.V600E mutation in BRAF was detected in one case, which harbored an exon 19 deletion and tested positive for the p.T790M mutation.
We further tested whether other specific genetic co-alterations tended to be EGFR exon-dependent. Comparison of the frequency of genetic co-alterations present in samples from tumors harboring an exon 19 mutation with those with a mutation in exon 21 revealed significant enrichment for KRAS mutations in tumors harboring EGFR-sensitizing mutations in exons 18 and 21 (p < 0.001) (Figure 3). Noteworthy, three of the KRAS mutated cases (n = 7) harbored an uncommon EGFR mutation: the p.G719X mutation in two cases and the p.L861Q mutation in one case. The associations between uncommon EGFR-sensitizing mutations and KRAS mutations was also significant (p = 0.002).
A similar pattern was observed for NRAS (n = 4) (Supplementary Table S3) and HRAS (n = 2) (Supplementary Table S4); mutations in these genes were more frequently detected in samples from tumors harboring mutations in exons 18 or 21 (p = 0.050 and p = 0.099, respectively) (Figure 3).

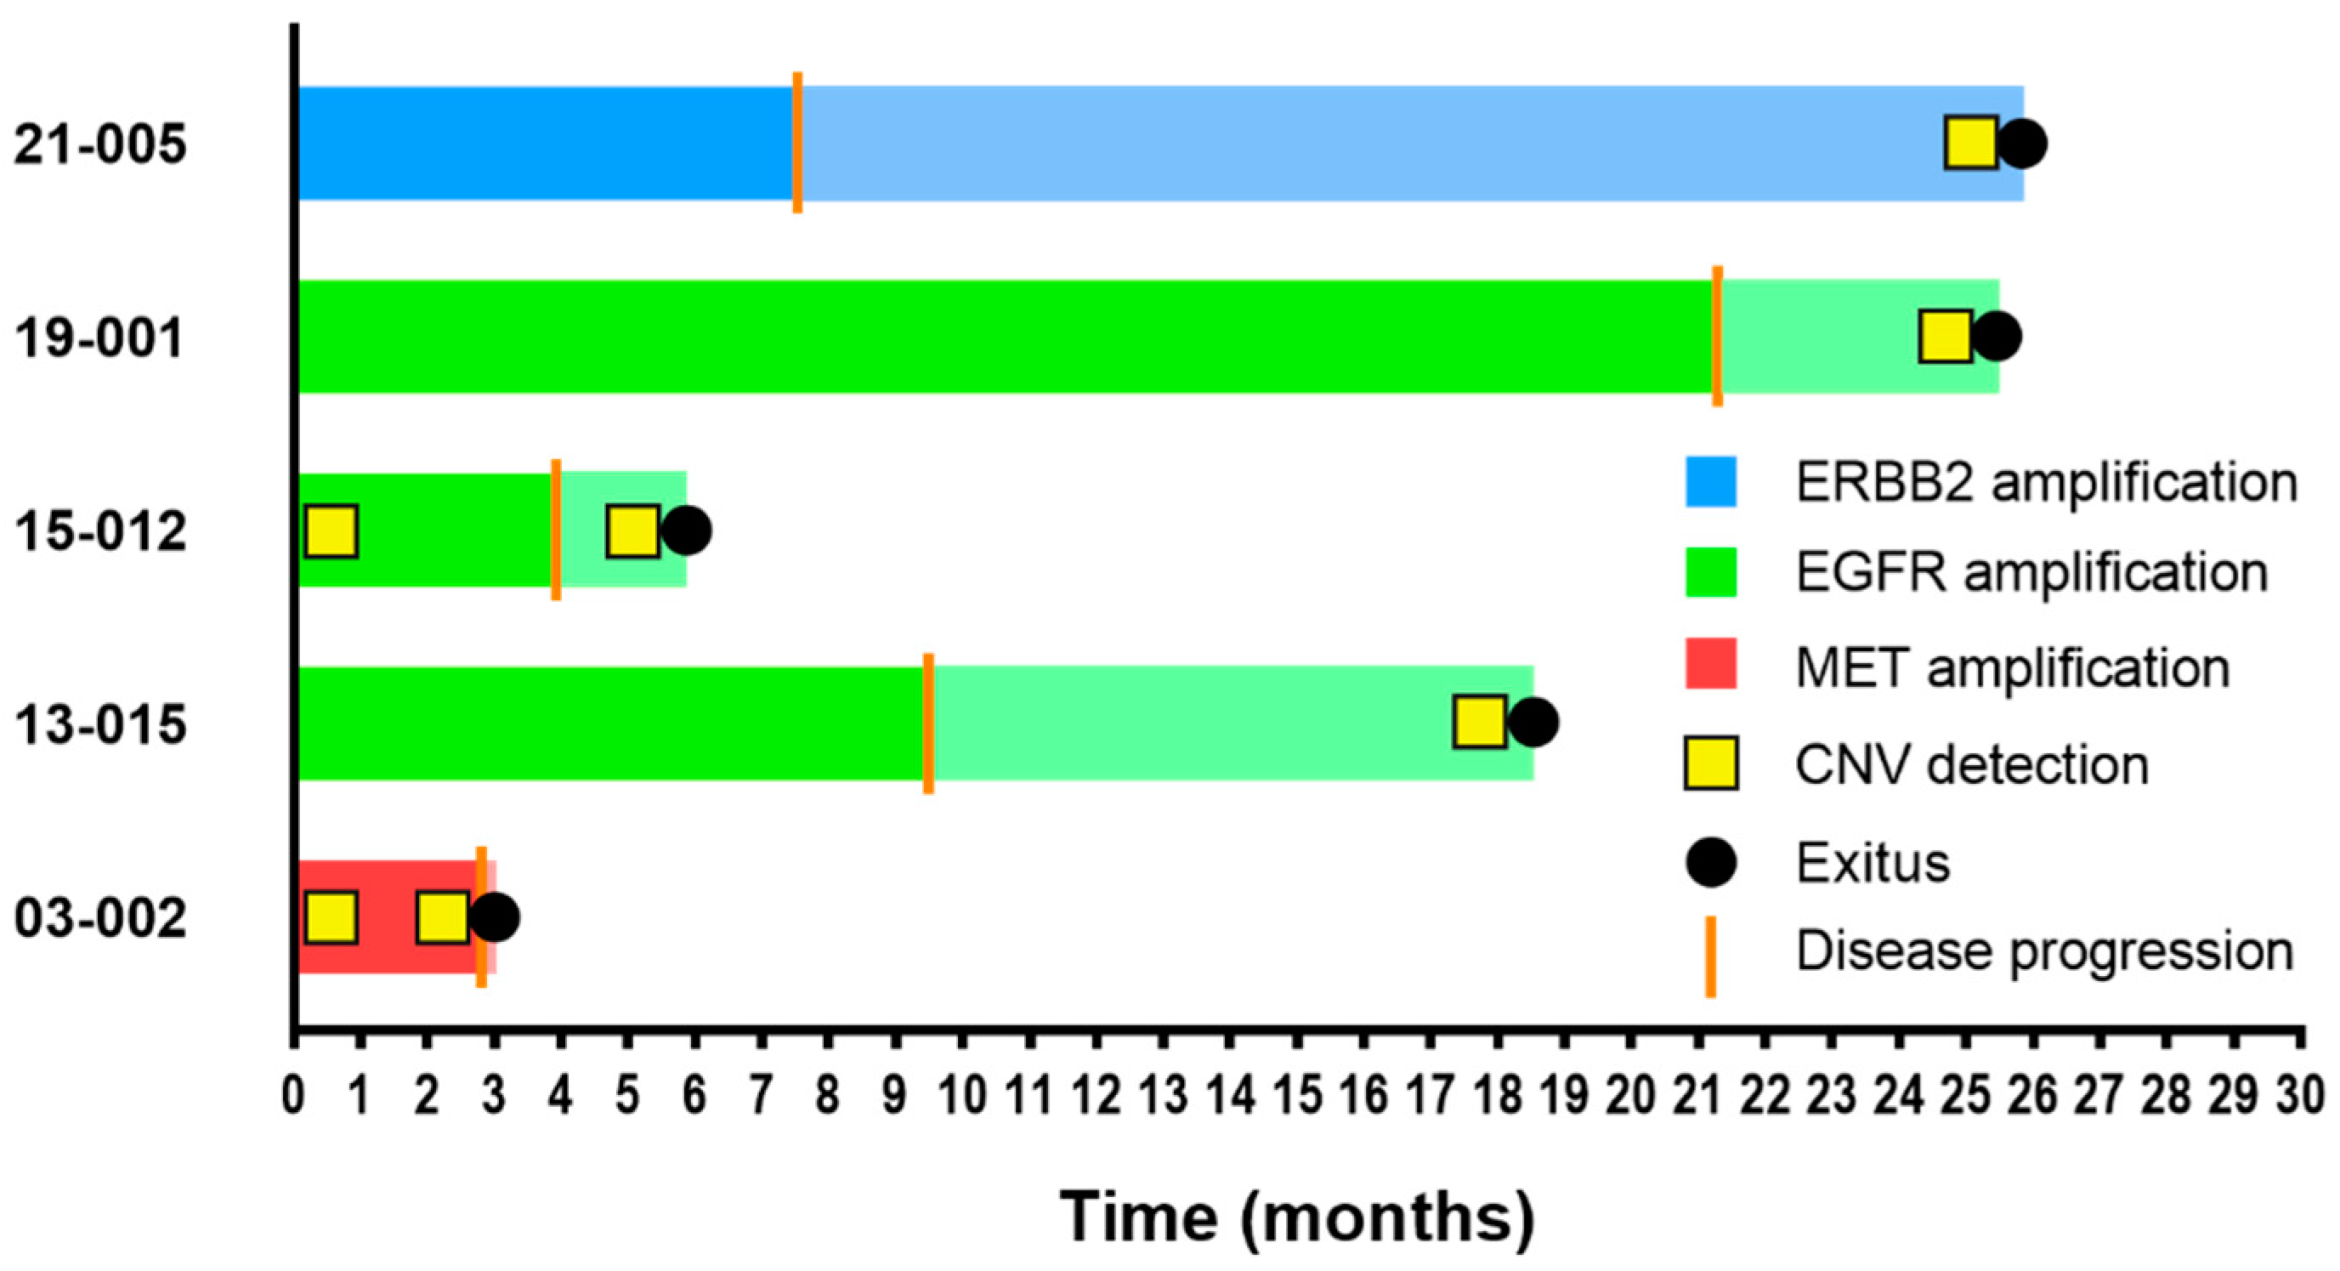
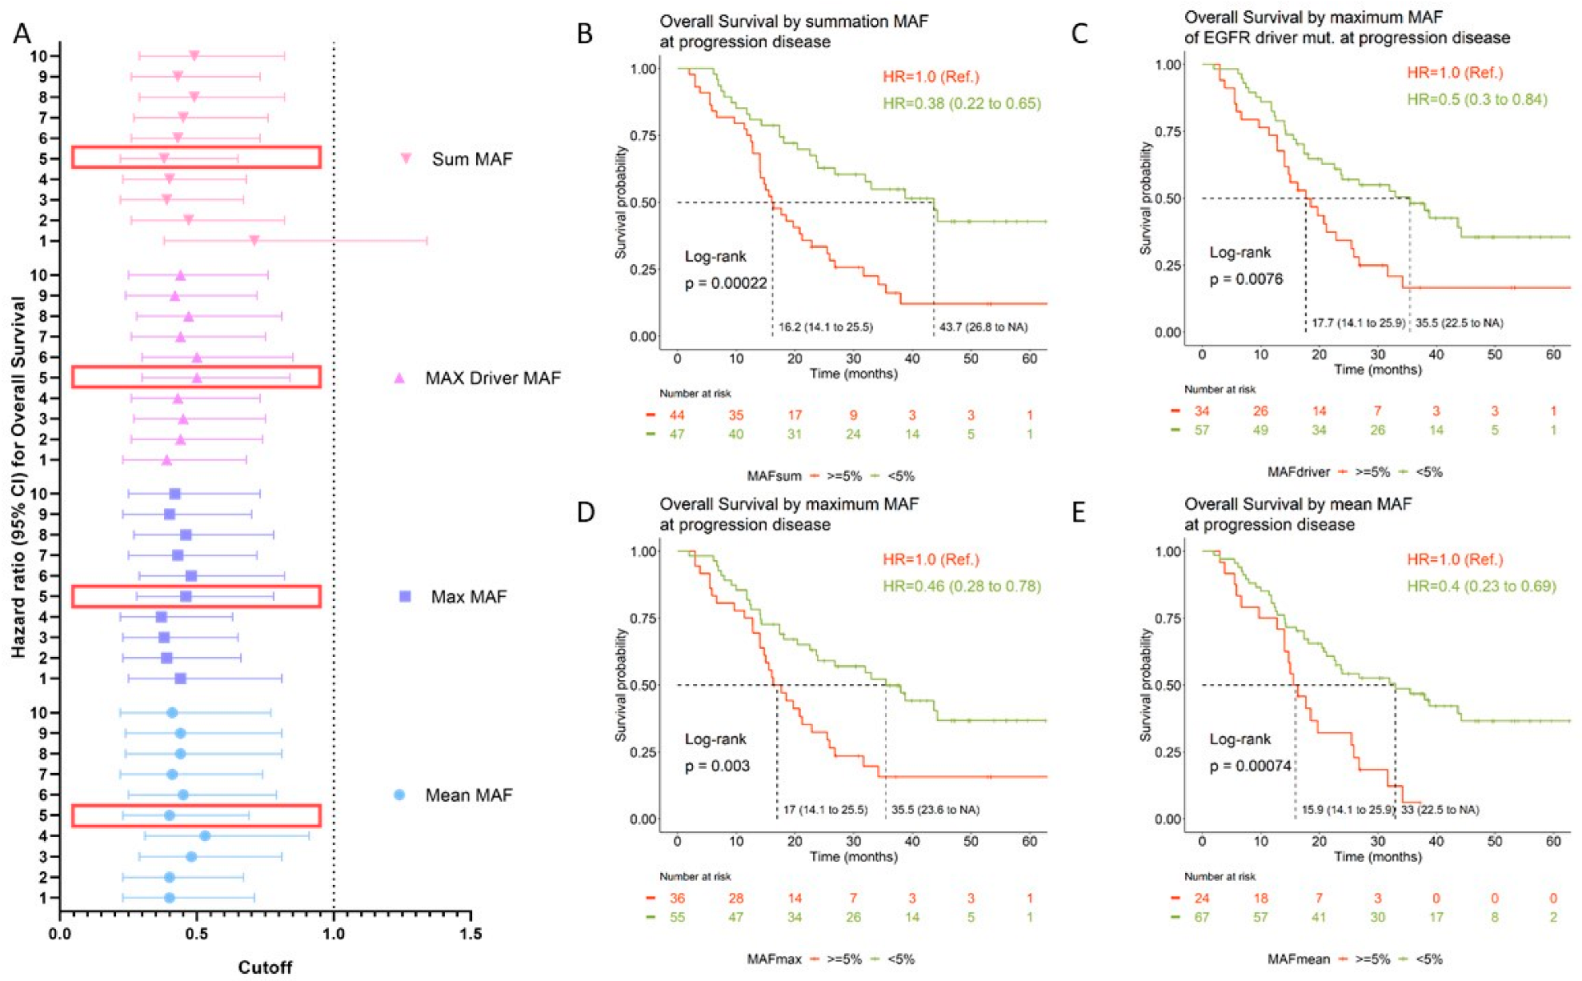
3.4. Prognostic Value of Circulating Tumor DNA

The prognostic value of circulating tumor DNA (ctDNA) levels was evaluated using different methodological approaches. To this aim, we calculated the mean, maximum, and sum of MAF from the set of all detected variants for each sample, and we established different MAF thresholds (ranging from 1% to 10%). In addition, the prognostic value of the MAF of the original EGFR-sensitizing mutation was tested. As presented in Table 4 and Figure 4A, the amount of ctDNA was of prognostic significance regardless of the approach used. Overall, patients with high ctDNA at disease progression had significantly worse OS than those patients in which the opposite situation occurred (Table 4 and Figure 4A). Kaplan–Meier curves for the <5%MAF cutoff are shown in Figure 4B–E. Using a cutoff of sum MAF < 5%, the median OS was 16 months (95% CI: 14 to 21.2) in patients with high ctDNA levels (MAF ≥ 5%) compared with 43.7 months (95% CI: 23.6 to NR) for patients with ctDNA levels below that cutoff.

4. Discussion

Several different mechanisms of acquired resistance to EGFR inhibitors have been described so far [24,25,26]. The wide variety of resistance mutations highlights the importance of tumor heterogeneity in shaping tumor resistance to targeted therapies. To our knowledge, here, we report for the first time that EGFR-TKI resistance through acquired KRAS mutation could be dependent on the exon location or type of mutation of the original EGFR-sensitizing mutation, suggesting that tumor resistance could be driven by the position in the genome of the original EGFR mutation. This hypothesis is plausible considering that it is well established that EGFR-mutant NSCLC patients have different sensitivity to targeted therapies according to the exon in which the original sensitizing mutation is detected [27]. This circumstance was also observed in our cohort (Supplementary Figure S3). In other words, EGFR-positive NSCLC tumors can be classified into different subtypes with different survival outcomes defined by the location of the EGFR-sensitizing mutation. In this way, unlike EGFR exon 19 deletions and point mutations in exon 21, most NSCLC tumors harboring EGFR exon 20 insertion mutations do not benefit from EGFR-TKIs with response rates reported to be below 5% and short intervals of disease control [28]. Indeed, important efforts have been made in order to develop effective therapies for this particular subset of patients in recent years [29].
Overall, TKI resistance can be classified into EGFR-dependent and EGFR-independent mechanisms. The p.T790M mutation is the most commonly observed resistance mechanism in NSCLC patients treated with first- and second-generation EGFR-TKIs [30,31,32]. In our study, the p.T790M mutation was significantly more frequently detected in tumors harboring a mutation in exon 19. This finding is consistent with previous reports [12,33]. Furthermore, in our cohort, amplifications in EGFR, MET, and ERBB2 were detected in five cases. MET gene amplification has been identified as a resistance mechanism for afatinib, gefitinb, erlotinib, and osimertinib [34,35,36,37]. Indeed, dual inhibition of EGFR and MET represents a promising treatment strategy [11]. Similarly, ERBB2 amplifications have been observed in tumors with acquired resistance to erlotinib, gefitinib, and osimertinib [38,39]. Oncogenic mutations in MAP2K1 and PIK3CA genes were also found in three cases. It is well established that activation of downstream EGFR signaling pathways such as MAPK/ERK or PIK3CA/AKT signaling pathways play an important role in EGFR-TKI resistance [40,41]. Similarly, acquired mutations in BRAF have been shown to underline EGFR-TKI resistance [42,43]. In our cohort, the p.V600E mutation in BRAF was detected alongside the p.T790M resistance mutation in one patient whose tumor harbored a deletion in exon 19. Similarly, a case report by Chao-Chi Ho et al. reported the acquisition of the mutation BRAF p.V600E in a patient with p.T790M at the time of progression while being treated with osimertinib [42]. In our study, ctDNA profiling was carried out with a relatively small NGS panel. The Oncomine™ Pan-Cancer Cell-Free Assay kit (Thermo Fisher, Palo Alto, CA, USA) covers hotspots in 52 genes. Therefore, these results should be interpreted with caution and they must be validated with larger cohorts.
The fact that KRAS mutations were more frequently detected in tumors harboring mutations in exon 18 and 21 or uncommon mutations may have important implications for the development of clinical trials evaluating the efficacy of dual or consecutive EGFR and KRAS blockage. It has previously been documented that the druggable mutation KRAS p.G12C is found in approximately 1% of EGFR-positive NSCLC patients progressing on a first-line treatment with an EGFR-TKI, and it tended to arise in tumors harboring EGFR uncommon mutations [44], supporting our findings.
Lastly, the amount of ctDNA at disease progression significantly correlated with OS. There is large evidence indicating that ctDNA levels significantly correlate with tumor bulk and, therefore, can be used to monitor disease [12,45,46]. Moreover, ctDNA levels are of prognostic significance [12]. Indeed it has been proposed to include ctDNA in the tumor staging system [47]. Nevertheless, it is not well established how ctDNA should be measured, especially when tumors do not harbor druggable mutations. As an exploratory approach, here, we evaluated the prognostic value using different methods (median of MAF from all mutations detected, maximum MAF of all detected mutation, MAF of the original EGFR-sensitizing mutation, and summation MAF of all detected mutations), and similar results were obtained.

5. Conclusions

Different molecular heterogeneous alterations were observed upon disease progression, highlighting the importance of heterogeneity driving tumor resistance. Our data suggest that the mechanisms underlying resistance could be dependent on the exon location of the original EGFR-sensitizing mutation. Further studies are warranted to confirm this observation.

Supplementary Materials

The following are available online at https://www.mdpi.com/article/10.3390/cancers14184446/s1, Figure S1: Flowchart of the bioinformatic pipeline optimized for processing and assessing variants using the Oncomine™ Pan-Cancer Cell-Free Assay; Figure S2: Linear correlation between MAF assessed by NGS and dPCR for driver EGFR and p.T790M mutations; Figure S3: Kaplan–Meier curve for PFS according to exon location of EGFR-sensitizing mutation at diagnosis of advanced NSCLC; Table S1: Types of mutations detected using NGS. MAF and MAPD parameters; Table S2: Number of patients with tumors harboring mutations in each gene covered by the NGS panel; Table S3: Relevant information regarding NRAS-mutated patients; Table S4: Relevant information regarding HRAS-mutated patients; Data S1: Datasheet with a list of genes included in the Oncomine™ Pan-Cancer Cell-Free Assay kit (Thermo Fisher, Palo Alto, CA, USA) (Format: .xlsx); Data S2: Datasheet with all TaqMan® dPCR assays (predesigned or customized) (Thermo Fisher, Palo Alto, CA, USA) available in our laboratory (format: .xlsx); Data S3: Datasheet with variants considered as potential mechanism of resistance with information about validation by dPCR/NGS and its detection in previous samples (format: .xlsx); Data S4: Final list of the genetic variants (N = 365) found through NGS for this study (format: .xlsx).

Author Contributions

Conceptualization, A.R. and M.P.; data curation, R.S.-B., E.S.-H., L.R.d.L., S.S.-M., A.R.-F., D.A.-T., A.S.-H., M.d.J.C., C.G.-G., M.D., A.B., J.M.S., J.O., J.B.-B., M.Á.S. and M.S.; formal analysis, R.S.-B. and A.R.; funding acquisition, F.F. and M.P.; investigation, S.S.-M., A.R.-F. and D.A.-T.; methodology, R.S.-B., E.S.-H., S.S.-M. and A.R.-F.; project administration, A.R. and M.P.; resources, M.P.; software, R.S.-B.; supervision, A.R. and M.P.; writing—original draft, R.S.-B., L.R.d.L. and A.R.; writing—review and editing, R.S.-B., E.S.-H., L.R.d.L., A.C.-B., A.R. and M.P. All authors have read and agreed to the published version of the manuscript.

Funding

This study was supported by Boehringer Ingelheim. Boehringer Ingelheim had no role in the design, analysis, or interpretation of the results in this study. Boehringer Ingelheim was given the opportunity to review the manuscript for medical and scientific accuracy as it relates to Boehringer Ingelheim substances, as well as intellectual property considerations. This article is part of a project that received funding from Instituto de Salud Carlos III through the project “PI21/01500” (co-funded by European Regional Development Fund/European Social Fund: “A way to make Europe”/“Investing in your future”). The work presented in this paper also received funding from the European Union’s Horizon 2020 research and innovation program under grant agreement No 875160. E.S.-H. was funded by the Consejería de Ciencia, Universidades e Innovación of the Comunidad de Madrid (Doctorados Industriales of the Comunidad de Madrid IND2019/BMD-17258). D.A.-T. was funded by the Consejería de Educación, Juventud y Deporte of the Comunidad de Madrid and by the Fondo Social Europeo (Programa Operativo de Empleo Juvenil, and Iniciativa de Empleo Juvenil), PEJ2019-TL/SAL-14607.

Institutional Review Board Statement

This study was approved by the Ethical Committee of Hospital Puerta de Hierro, Madrid, Spain (internal code: PI 02/16), and conducted in accordance with the precepts of the Code of Ethics of the World Medical Association (Declaration of Helsinki).

Informed Consent Statement

A total of 124 patients were recruited by 35 Hospitals from February 2016 to September 2021. Informed consent was obtained from all subjects involved in the study.

Data Availability Statement

In this study, an internal bioinformatics pipeline, designed using R, was used. A schematic flowchart of the pipeline is shown in Supplementary Figure S1. The data presented in this study are available on request from the corresponding author.

Acknowledgments

The authors would like to thank their patients and their families for making the study possible.

Conflicts of Interest

A.S.-H. reports personal fees and nonfinancial support from Roche, AstraZeneca, and Boehringer, outside the submitted work. M.d.J.C. reports personal fees from Roche, Pierre Fabre, and MSD and other fees from AstraZeneca, Boehringer Ingelheim, AstraZeneca, and Lilly, outside the submitted work. M.D. reports personal fees from AstraZeneca, BMS, Boehringer Ingelheim, MSD, Pfizer, and Roche, outside the submitted work. J.B.-B. reports grants and personal fees from Roche-Genentech, Pfizer, and Pierre Fabre and personal fees from MSD, BMS, AstraZeneca, and Novartis. A.R. reports personal fees from Boehringer and AstraZeneca. M.P. reports personal fees from Roche, BMS, MSD, Pfizer, Lilly, Novartis, and Takeda, as well as grants and personal fees from AstraZeneca and Boehringer during the conduct of the study. The remaining authors declare no conflicts of interest.

Abbreviations

cfDNA, circulating cell-free DNA; CI, confidence interval; CNS, central nervous system; CNV, copy number variant; ctDNA, circulating tumor DNA; dPCR, digital PCR; ECOG eastern cooperative oncology group; EGFR-TKI, EGFR tyrosine kinase inhibitor; HR, hazard ratio; IGV, integrative genome visualizer; Indel, insertion or deletion; MAF, mutated allele frequency; MNP, multiple-nucleotide polymorphism; NGS, next-generation sequencing; NR, not reached; NSCLC, non-small-cell lung cancer; OS, overall survival; PFS, progression-free survival; RECIST, Response Evaluation Criteria in Solid Tumors; SNV, single-nucleotide variant.

References

  1. Siegel, R.L.; Miller, K.D.; Jemal, A. Cancer Statistics, 2020. CA Cancer J. Clin. 2020, 70, 7–30. [Google Scholar] [CrossRef] [PubMed]
  2. Thress, K.S.; Brant, R.; Carr, T.H.; Dearden, S.; Jenkins, S.; Brown, H.; Hammett, T.; Cantarini, M.; Barrett, J.C. EGFR Mutation Detection in CtDNA from NSCLC Patient Plasma: A Cross-Platform Comparison of Leading Technologies to Support the Clinical Development of AZD9291. Lung Cancer 2015, 90, 509–515. [Google Scholar] [CrossRef] [PubMed]
  3. Aye, P.S.; McKeage, M.J.; Tin, S.T.; Khwaounjoo, P.; Elwood, J.M. Population-Based Incidence Rates and Increased Risk of EGFR Mutated Non-Small Cell Lung Cancer in Māori and Pacifica in New Zealand. PLoS ONE 2021, 16, e0251357. [Google Scholar] [CrossRef] [PubMed]
  4. Soria, J.C.; Ohe, Y.; Vansteenkiste, J.; Reungwetwattana, T.; Chewaskulyong, B.; Lee, K.H.; Dechaphunkul, A.; Imamura, F.; Nogami, N.; Kurata, T.; et al. Osimertinib in Untreated EGFR-Mutated Advanced Non-Small-Cell Lung Cancer. N. Engl. J. Med. 2018, 378, 113–125. [Google Scholar] [CrossRef] [PubMed]
  5. Yang, J.C.H.; Camidge, D.R.; Yang, C.T.; Zhou, J.; Guo, R.; Chiu, C.H.; Chang, G.C.; Shiah, H.S.; Chen, Y.; Wang, C.C.; et al. Safety, Efficacy, and Pharmacokinetics of Almonertinib (HS-10296) in Pretreated Patients with EGFR-Mutated Advanced NSCLC: A Multicenter, Open-Label, Phase 1 Trial. J. Thorac. Oncol. 2020, 15, 1907–1918. [Google Scholar] [CrossRef]
  6. Ahn, M.J.; Han, J.Y.; Lee, K.H.; Kim, S.W.; Kim, D.W.; Lee, Y.G.; Cho, E.K.; Kim, J.H.; Lee, G.W.; Lee, J.S.; et al. Lazertinib in Patients with EGFR Mutation-Positive Advanced Non-Small-Cell Lung Cancer: Results from the Dose Escalation and Dose Expansion Parts of a First-in-Human, Open-Label, Multicentre, Phase 1-2 Study. Lancet Oncol. 2019, 20, 1681–1690. [Google Scholar] [CrossRef]
  7. Zhou, Q.; Wu, L.; Feng, L.; An, T.; Cheng, Y.; Zhou, J.; Li, J.; Feng, J.F.; Zhang, L.; Han, B.; et al. Safety and Efficacy of Abivertinib (AC0010), a Third-Generation EGFR Tyrosine Kinase Inhibitor, in Chinese Patients with EGFR-T790M Positive Non-Small Cell Lung Cancer (NCSLC). J. Clin. Oncol. 2019, 37, 9091. [Google Scholar] [CrossRef]
  8. Du, X.; Yang, B.; An, Q.; Assaraf, Y.G.; Cao, X.; Xia, J. Acquired Resistance to Third-Generation EGFR-TKIs and Emerging next-Generation EGFR Inhibitors. Innovation 2021, 2, 100103. [Google Scholar] [CrossRef]
  9. Noronha, V.; Patil, V.M.; Joshi, A.; Menon, N.; Chougule, A.; Mahajan, A.; Janu, A.; Purandare, N.; Kumar, R.; More, S.; et al. Gefitinib Versus Gefitinib Plus Pemetrexed and Carboplatin Chemotherapy in EGFR-Mutated Lung Cancer. J. Clin. Oncol. 2020, 38, 124–136. [Google Scholar] [CrossRef]
  10. Nakagawa, K.; Garon, E.B.; Seto, T.; Nishio, M.; Ponce Aix, S.; Paz-Ares, L.; Chiu, C.H.; Park, K.; Novello, S.; Nadal, E.; et al. Ramucirumab plus Erlotinib in Patients with Untreated, EGFR-Mutated, Advanced Non-Small-Cell Lung Cancer (RELAY): A Randomised, Double-Blind, Placebo-Controlled, Phase 3 Trial. Lancet Oncol. 2019, 20, 1655–1669. [Google Scholar] [CrossRef] [Green Version]
  11. Bauml, J.; Cho, B.C.; Park, K.; Lee, K.H.; CHO, E.K.; Kim, D.-W.; Kim, S.-W.; Haura, E.B.; Sabari, J.K.; Sanborn, R.E.; et al. Amivantamab in Combination with Lazertinib for the Treatment of Osimertinib-Relapsed, Chemotherapy-Naïve EGFR Mutant (EGFRm) Non-Small Cell Lung Cancer (NSCLC) and Potential Biomarkers for Response. J. Clin. Oncol. 2021, 39, 9006. [Google Scholar] [CrossRef]
  12. Provencio, M.; Serna-Blasco, R.; Franco, F.; Calvo, V.; Royuela, A.; Auglytė, M.; Sánchez-Hernández, A.; de Julián Campayo, M.; García-Girón, C.; Dómine, M.; et al. Analysis of Circulating Tumour DNA to Identify Patients with Epidermal Growth Factor Receptor–Positive Non-Small Cell Lung Cancer Who Might Benefit from Sequential Tyrosine Kinase Inhibitor Treatment. Eur. J. Cancer 2021, 149, 61–72. [Google Scholar] [CrossRef] [PubMed]
  13. Nahar, R.; Zhai, W.; Zhang, T.; Takano, A.; Khng, A.J.; Lee, Y.Y.; Liu, X.; Lim, C.H.; Koh, T.P.T.; Aung, Z.W.; et al. Elucidating the Genomic Architecture of Asian EGFR-Mutant Lung Adenocarcinoma through Multi-Region Exome Sequencing. Nat. Commun. 2018, 9, 216. [Google Scholar] [CrossRef]
  14. Hong, S.; Gao, F.; Fu, S.; Wang, Y.; Fang, W.; Huang, Y.; Zhang, L. Concomitant Genetic Alterations with Response to Treatment and Epidermal Growth Factor Receptor Tyrosine Kinase Inhibitors in Patients with EGFR-Mutant Advanced Non-Small Cell Lung Cancer. JAMA Oncol. 2018, 4, 739–742. [Google Scholar] [CrossRef] [PubMed]
  15. Blakely, C.M.; Watkins, T.B.K.; Wu, W.; Gini, B.; Chabon, J.J.; McCoach, C.E.; McGranahan, N.; Wilson, G.A.; Birkbak, N.J.; Olivas, V.R.; et al. Evolution and Clinical Impact of Co-Occurring Genetic Alterations in Advanced-Stage EGFR-Mutant Lung Cancers. Nat. Genet. 2017, 49, 1693–1704. [Google Scholar] [CrossRef]
  16. Canale, M.; Petracci, E.; Delmonte, A.; Chiadini, E.; Dazzi, C.; Papi, M.; Capelli, L.; Casanova, C.; De Luigi, N.; Mariotti, M.; et al. Impact of TP53 Mutations on Outcome in EGFR-Mutated Patients Treated with First-Line Tyrosine Kinase Inhibitors. Clin. Cancer Res. 2017, 23, 2195–2202. [Google Scholar] [CrossRef]
  17. Offin, M.; Chan, J.M.; Tenet, M.; Rizvi, H.A.; Shen, R.; Riely, G.J.; Rekhtman, N.; Daneshbod, Y.; Quintanal-Villalonga, A.; Penson, A.; et al. Concurrent RB1 and TP53 Alterations Define a Subset of EGFR-Mutant Lung Cancers at Risk for Histologic Transformation and Inferior Clinical Outcomes. J. Thorac. Oncol. 2019, 14, 1784–1793. [Google Scholar] [CrossRef]
  18. Collisson, E.A.; Campbell, J.D.; Brooks, A.N.; Berger, A.H.; Lee, W.; Chmielecki, J.; Beer, D.G.; Cope, L.; Creighton, C.J.; Danilova, L.; et al. Comprehensive Molecular Profiling of Lung Adenocarcinoma. Nature 2014, 511, 543–550. [Google Scholar]
  19. Chen, Z.; Fillmore, C.M.; Hammerman, P.S.; Kim, C.F.; Wong, K.K. Non-Small-Cell Lung Cancers: A Heterogeneous Set of Diseases. Nat. Rev. Cancer 2014, 14, 535–546. [Google Scholar] [CrossRef]
  20. Diaz, L.A.; Bardelli, A. Liquid Biopsies: Genotyping Circulating Tumor DNA. J. Clin. Oncol. 2014, 32, 579–586. [Google Scholar] [CrossRef]
  21. Li, M.M.; Datto, M.; Duncavage, E.J.; Kulkarni, S.; Lindeman, N.I.; Roy, S.; Tsimberidou, A.M.; Vnencak-Jones, C.L.; Wolff, D.J.; Younes, A.; et al. Standards and Guidelines for the Interpretation and Reporting of Sequence Variants in Cancer. J. Mol. Diagn. 2017, 19, 4–23. [Google Scholar] [CrossRef] [PubMed] [Green Version]
  22. ClinGen TP53 Expert Panel Specifications to the ACMG/AMP Variant Interpretation Guidelines Version 1 TP53 Rule Specifications for the ACMG/AMP Variant Curation Guidelines Gene Disease (MONDO ID) Clinically Significant Transcript TP53 Li-Fraumeni Syndrome (0007903) Pathogenic Criteria Criteria Original Criteria Description Specification(S). Available online: https://www.clinicalgenome.org/affiliation/50013 (accessed on 15 August 2022).
  23. Provencio, M.; Torrente, M.; Calvo, V.; Pérez-Callejo, D.; Gutiérrez, L.; Franco, F.; Pérez-Barrios, C.; Barquín, M.; Royuela, A.; García-García, F.; et al. Prognostic Value of Quantitative CtDNA Levels in Non Small Cell Lung Cancer Patients. Oncotarget 2018, 9, 488–494. [Google Scholar] [CrossRef] [PubMed]
  24. Zhang, Z.; Lee, J.C.; Lin, L.; Olivas, V.; Au, V.; Laframboise, T.; Abdel-Rahman, M.; Wang, X.; Levine, A.D.; Rho, J.K.; et al. Activation of the AXL Kinase Causes Resistance to EGFR-Targeted Therapy in Lung Cancer. Nat. Genet. 2012, 44, 852–860. [Google Scholar] [CrossRef] [PubMed]
  25. Bivona, T.G.; Hieronymus, H.; Parker, J.; Chang, K.; Taron, M.; Rosell, R.; Moonsamy, P.; Dahlman, K.; Miller, V.A.; Costa, C.; et al. FAS and NF-ΚB Signalling Modulate Dependence of Lung Cancers on Mutant EGFR. Nature 2011, 471, 523–526. [Google Scholar] [CrossRef] [PubMed]
  26. Ono, M.; Kuwano, M. Molecular Mechanisms of Epidermal Growth Factor Receptor (EGFR) Activation and Response to Gefitinib and Other EGFR-Targeting Drugs. Clin. Cancer Res. 2006, 12, 7242–7251. [Google Scholar] [CrossRef]
  27. Jackman, D.M.; Yeap, B.Y.; Sequist, L.V.; Lindeman, N.; Holmes, A.J.; Joshi, V.A.; Bell, D.W.; Huberman, M.S.; Halmos, B.; Rabin, M.S.; et al. Exon 19 Deletion Mutations of Epidermal Growth Factor Receptor Are Associated with Prolonged Survival in Non-Small Cell Lung Cancer Patients Treated with Gefitinib or Erlotinib. Clin. Cancer Res. 2006, 12, 3908–3914. [Google Scholar] [CrossRef]
  28. Yasuda, H.; Kobayashi, S.; Costa, D.B. EGFR Exon 20 Insertion Mutations in Non-Small-Cell Lung Cancer: Preclinical Data and Clinical Implications. Lancet Oncol. 2012, 13, e23–e31. [Google Scholar] [CrossRef]
  29. Piper-Vallillo, A.J.; Sequist, L.V.; Piotrowska, Z. Emerging Treatment Paradigms for EGFR-Mutant Lung Cancers Progressing on Osimertinib: A Review. J. Clin. Oncol. 2020, 38, 2926–2936. [Google Scholar] [CrossRef]
  30. Kobayashi, S.; Boggon, T.J.; Dayaram, T.; Jänne, P.A.; Kocher, O.; Meyerson, M.; Johnson, B.E.; Eck, M.J.; Tenen, D.G.; Halmos, B. EGFR Mutation and Resistance of Non-Small-Cell Lung Cancer to Gefitinib. N. Engl. J. Med. 2005, 352, 786–792. [Google Scholar] [CrossRef]
  31. Arcila, M.E.; Oxnard, G.R.; Nafa, K.; Riely, G.J.; Solomon, S.B.; Zakowski, M.F.; Kris, M.G.; Pao, W.; Miller, V.A.; Ladanyi, M. Rebiopsy of Lung Cancer Patients with Acquired Resistance to EGFR Inhibitors and Enhanced Detection of the T790M Mutation Using a Locked Nucleic Acid-Based Assay. Clin. Cancer Res. 2011, 17, 1169–1180. [Google Scholar] [CrossRef]
  32. Chen, H.J.; Mok, T.S.; Chen, Z.H.; Guo, A.L.; Zhang, X.C.; Su, J.; Wu, Y.L. Clinicopathologic and Molecular Features of Epidermal Growth Factor Receptor T790M Mutation and C-MET Amplification in Tyrosine Kinase Inhibitor-Resistant Chinese Non-Small Cell Lung Cancer. Pathol. Oncol. Res. 2009, 15, 651–658. [Google Scholar] [CrossRef] [PubMed]
  33. Matsuo, N.; Azuma, K.; Sakai, K.; Hattori, S.; Kawahara, A.; Ishii, H.; Tokito, T.; Kinoshita, T.; Yamada, K.; Nishio, K.; et al. Association of EGFR Exon 19 Deletion and EGFR-TKI Treatment Duration with Frequency of T790M Mutation in EGFR-Mutant Lung Cancer Patients. Sci. Rep. 2016, 6, 36458. [Google Scholar] [CrossRef] [PubMed]
  34. Politi, K.; Fan, P.D.; Shen, R.; Zakowski, M.; Varmus, H. Erlotinib Resistance in Mouse Models of Epidermal Growth Factor Receptor-Induced Lung Adenocarcinoma. Dis. Model. Mech. 2010, 3, 111–119. [Google Scholar] [CrossRef] [PubMed]
  35. Nanjo, S.; Arai, S.; Wang, W.; Takeuchi, S.; Yamada, T.; Hata, A.; Katakami, N.; Okada, Y.; Yano, S. MET Copy Number Gain Is Associated with Gefitinib Resistance in Leptomeningeal Carcinomatosis of EGFR-Mutant Lung Cancer. Mol. Cancer Ther. 2017, 16, 506–515. [Google Scholar] [CrossRef] [PubMed]
  36. Martinez-Marti, A.; Felip, E.; Matito, J.; Mereu, E.; Navarro, A.; Cedrés, S.; Pardo, N.; de Castro, A.M.; Remon, J.; Miquel, J.M.; et al. Dual MET and ERBB Inhibition Overcomes Intratumor Plasticity in Osimertinib-Resistant-Advanced Non-Small-Cell Lung Cancer (NSCLC). Ann. Oncol. Off. J. Eur. Soc. Med. Oncol. 2017, 28, 2451–2457. [Google Scholar] [CrossRef]
  37. Deng, L.; Kiedrowski, L.A.; Ravera, E.; Cheng, H.; Halmos, B. Response to Dual Crizotinib and Osimertinib Treatment in a Lung Cancer Patient with MET Amplification Detected by Liquid Biopsy Who Acquired Secondary Resistance to EGFR Tyrosine Kinase Inhibition. J. Thorac. Oncol. 2018, 13, e169–e172. [Google Scholar] [CrossRef]
  38. Mazières, J.; Peters, S.; Lepage, B.; Cortot, A.B.; Barlesi, F.; Beau-Faller, M.; Besse, B.; Blons, H.; Mansuet-Lupo, A.; Urban, T.; et al. Lung Cancer That Harbors an HER2 Mutation: Epidemiologic Characteristics and Therapeutic Perspectives. J. Clin. Oncol. 2013, 31, 1997–2003. [Google Scholar] [CrossRef]
  39. Planchard, D.; Loriot, Y.; André, F.; Gobert, A.; Auger, N.; Lacroix, L.; Soria, J.C. EGFR-Independent Mechanisms of Acquired Resistance to AZD9291 in EGFR T790M-Positive NSCLC Patients. Ann. Oncol. 2015, 26, 2073–2078. [Google Scholar] [CrossRef]
  40. Sun, Y.; Meyers, B.A.; Czako, B.; Leonard, P.; Mseeh, F.; Harris, A.L.; Wu, Q.; Johnson, S.; Parker, C.A.; Cross, J.B.; et al. Allosteric SHP2 Inhibitor, IACS-13909, Overcomes EGFR-Dependent and EGFR-Independent Resistance Mechanisms toward Osimertinib. Cancer Res. 2020, 80, 4840–4853. [Google Scholar] [CrossRef]
  41. Oxnard, G.R.; Hu, Y.; Mileham, K.F.; Husain, H.; Costa, D.B.; Tracy, P.; Feeney, N.; Sholl, L.M.; Dahlberg, S.E.; Redig, A.J.; et al. Assessment of Resistance Mechanisms and Clinical Implications in Patients With EGFR T790M-Positive Lung Cancer and Acquired Resistance to Osimertinib. JAMA Oncol. 2018, 4, 1527–1534. [Google Scholar] [CrossRef]
  42. Ho, C.C.; Liao, W.Y.; Lin, C.A.; Shih, J.Y.; Yu, C.J.; Chih-Hsin Yang, J. Acquired BRAF V600E Mutation as Resistant Mechanism after Treatment with Osimertinib. J. Thorac. Oncol. 2017, 12, 567–572. [Google Scholar] [CrossRef] [PubMed] [Green Version]
  43. Linardou, H.; Dahabreh, I.J.; Kanaloupiti, D.; Siannis, F.; Bafaloukos, D.; Kosmidis, P.; Papadimitriou, C.A.; Murray, S. Assessment of Somatic K-RAS Mutations as a Mechanism Associated with Resistance to EGFR-Targeted Agents: A Systematic Review and Meta-Analysis of Studies in Advanced Non-Small-Cell Lung Cancer and Metastatic Colorectal Cancer. Lancet Oncol. 2008, 9, 962–972. [Google Scholar] [CrossRef]
  44. Serna-Blasco, R.; Sánchez-Herrero, E.; Sanz-Moreno, S.; Rodriguez-Festa, A.; García-Veros, E.; Casarrubios, M.; Sierra-Rodero, B.; Laza-Briviesca, R.; Cruz-Bermúdez, A.; Mielgo-Rubio, X.; et al. KRAS p.G12C Mutation Occurs in 1% of EGFR-Mutated Advanced Non-Small-Cell Lung Cancer Patients Progressing on a First-Line Treatment with a Tyrosine Kinase Inhibitor. ESMO Open 2021, 6, 100279. [Google Scholar] [CrossRef] [PubMed]
  45. Provencio, M.; Torrente, M.; Calvo, V.; Gutiérrez, L.; Pérez-Callejo, D.; Pérez-Barrios, C.; Barquín, M.; Royuela, A.; Rodriguez-Alfonso, B.; Sotelo, M.; et al. Dynamic Circulating Tumor DNA Quantificaton for the Individualization of Non-Small-Cell Lung Cancer Patients Treatment. Oncotarget 2017, 8, 60291–60298. [Google Scholar] [CrossRef] [PubMed]
  46. Iwama, E.; Sakai, K.; Azuma, K.; Harada, T.; Harada, D.; Nosaki, K.; Hotta, K.; Ohyanagi, F.; Kurata, T.; Fukuhara, T.; et al. Monitoring of Somatic Mutations in Circulating Cell-Free DNA by Digital PCR and next-Generation Sequencing during Afatinib Treatment in Patients with Lung Adenocarcinoma Positive for EGFR Activating Mutations. Ann. Oncol. 2017, 28, 136–141. [Google Scholar] [CrossRef]
  47. Yang, M.; Forbes, M.E.; Bitting, R.L.; O’Neill, S.S.; Chou, P.C.; Topaloglu, U.; Miller, L.D.; Hawkins, G.A.; Grant, S.C.; DeYoung, B.R.; et al. Incorporating Blood-Based Liquid Biopsy Information into Cancer Staging: Time for a TNMB System? Ann. Oncol. 2018, 29, 311–323. [Google Scholar] [CrossRef] [Green Version]
Figure 1. OncoPrint plot showing the distribution of genomic alterations detected in the plasma samples collected upon disease progression. Overview of genomic alterations (legend) in particular genes (rows) for each sample (columns). Missense mutations, non-frameshift deletions or insertions, frameshift deletions or insertions, nonsense mutations, splice site mutations, and CNVs are shown as green rectangles, blue rectangles, red rectangles, black crosses, orange rectangles, and a black dots, respectively. At the bottom of the plot, the following features are presented: first-line EGFR-TKI, type of original EGFR-sensitizing mutation, and detection of the p.T790M resistance mutation at disease progression. The maximum value of MAF from all detected variants is also shown. Co-occurring mutations were not associated with smoking history and did not have an impact on overall survival (OS). CNV: copy number variant; InsDel: insertion or deletion; MAF: mutated allele frequency.
Cancers 14 04446 g001
Figure 2. Swimmer plot of PFS and OS in CNV-positive patients. The PFS bar plot appears in dark color, whereas OS is represented continuing the same bar but in attenuated color. Disease progression and exitus events are shown on bar plots as a vertical orange line and a black dot, respectively. CNV detection by NGS is represented with a yellow square.
Cancers 14 04446 g002
Figure 3. KRAS, NRAS, and HRAS mutations detected by NGS according to exon location of the original EGFR-sensitizing mutation. The EGFR gene is represented, and the region including exons 18–21 is magnified in order to show the distribution of KRAS, NRAS, and HRAS variants detected in the plasma sample upon disease progression (represented by circles, rectangles, and squares, respectively), according to exon location of the original EGFR sensitizing mutation.
Cancers 14 04446 g003
Figure 4. OS according to ctDNA levels upon disease progression. (A) Hazard ratios (HRs) for OS are depicted for each MAF cutoff value and according to the quantification approach (mean: blue circles; max: blue squares; max driver: purple triangles; sum: pink upside-down triangles). The horizontal dashed line delimits the confidence intervals. Large red rectangles highlight the MAF cutoff represented in the Kaplan–Meier curves. (BE) Kaplan–Meier curves for OS according to MAF cutoff (5%) measured using different methodological approaches. Median OS for each group; log-rank p-values and HRs are shown at the left bottom side and right upper side, respectively. Mean MAF was calculated as the mean of the MAF from the set of all variants detected for each sample. Max MAF was defined as the maximum MAF among the set of variants detected for each sample. Driver MAF was defined as the MAF of the EGFR-sensitizing mutation. This analysis was carried out using 89 samples which had detectable EGFR variants. Sum MAF was calculated as the sum of MAF from the set of variants detected for each sample. CI: confidence interval; CNV: copy number variant; HR: hazard ratio; MAF: mutant allele frequency; NA: not available; Ref.: reference category.
Cancers 14 04446 g004
Table 1. Descriptive analysis of the study cohort.
Clinicopathologic CharacteristicsN = 124
Age, mean (SD), years65.8 (11.1)
Sex, No. (%) with data
Female77 (62.1)
Male47 (37.9)
Smoking, No. (%) with data
Never-smokers71 (57.3)
Active smokers9 (7.2)
Former smokers44 (35.5)
ECOG-PS a, No. (%) with data
035 (28.2)
137 (29.8)
25 (4.0)
Stage, No. (%) with data
IVA60 (48.4)
IVB64 (51.6)
Histology, No. (%) with data
Adenocarcinoma116 (93.6)
Adenosquamous2 (1.6)
Large cell4 (3.2)
Squamous2 (1.6)
 Metastases at IV stage diagnosis b, No. (%) with data
Local88 (71)
Bone61 (49.2)
CNS18 (14.5)
Liver17 (13.7)
 Progression site c, No. (%) with data
Bone21 (16.9)
CNS13 (10.5)
Liver13 (10.5)
EGFR mutation, No. (%) with data
Del1968 (54.8)
G719X3 (2.4)
Ins206 (4.8)
L858R43 (34.7)
L861Q3 (2.4)
>1 mut.1 (0.8)
Treatment, No. (%) with data
Afatinib62 (50)
Erlotinib26 (21)
Gefitinib33 (26.6)
Osimertinib3 (2.4)
Second line treatment d, No. (%) with data
Osimertinib63 (50.8)
Others25 (20.2)
None8 (6.4)
Exitus e
Yes59 (47.6)
No32 (25.6)
a 47 patients without information; b 5 patients without information; c 52 patients without information; d 28 patients without information; e 33 patients without information. Abbreviations: CNS: central nervous system; ECOG-PS: Eastern Cooperative Oncology Group Performance Status.
Table 2. dPCR Validation and retrospective tracking of oncogenic mutations detected upon disease progression.
SampleGeneCoding Transcript ChangeProtein ChangeFunctional ClassificationPFS bOS bB≈3≈6P
400003KRASc.35G>Tp.G12VMissense5.8NA---
1000040KRASc.182A>Gp.Q61RMissense9.7NA---
8500002KRASc.34G>Ap.G12SMissense12.3NA---
03-002 aMETCNVCNVCNV2.83
11-006KRASc.34G>Tp.G12CMissense11.715.5
11-008PIK3CAc.1633G>Ap.E545KMissense7.715-
13-014BRAFc.1799T>Ap.V600EMissense15.834.2
13-015 aEGFRCNVCNVCNV9.518.5
15-012 aEGFRCNVCNVCNV3.95.9
19-001 aEGFRCNVCNVCNV21.325.5
21-005 aERBB2CNVCNVCNV7.525.9
26-004KRASc.436G>Ap.A146TMissense2.814.3--
33-001KRASc.44G>Tp.G15VMissense11.930.4
36-005KRASc.183A>Cp.Q61HMissense7.69.7
36-005KRASc.35G>Ap.G12DMissense7.69.7
a Samples from this patient were evaluated by NGS. b Calculated in months. Red dots represent that the variant was absent in the sample, green dots indicate detection of the mutation in the sample, and yellow dots are depicted when the variant could not be validated by dPCR due to the lack of sample. In this case, only the NGS data are available. Three KRAS variants (p.G15V, p.Q61H, and p.Q61R) were not confirmed by dPCR because of a lack of sample, whereas the remaining KRAS mutations were validated by dPCR. Unfortunately, there were no previous samples for the patients whose tumors harbored p.G12V, p.Q61R, and G12S mutations. Abbreviations: B: baseline sample (before the start of treatment); ≈3: sample extracted during treatment (after 3 months of treatment approximately); ≈6: sample extracted during treatment (after 6 months of treatment approximately); P: sample extracted at the moment of disease progression; PFS: progression-free survival; OS; overall survival.
Table 3. Clinicopathological features of KRAS mutated cases.
4000031000040850000211-00626-00433-00136-005
KRAS mutation by NGS (coding/protein)c.35G>T/p.G12Vc.182A>G/p.Q61Rc.34G>A/p.G12Sc.34G>T/p.G12Cc.436G>A/p.A146Tc.44G>T/p.G15Vc.183A>C/p.Q61H
c.35G>A/p.G12D
MAF KRAS mutation (%)4.150.180.6218.110.190.573.67/0.64
EGFR mutation by NGS (coding/protein)Not detectedc.2573T>G/p.L858Rc.2573T>G/p.L858Rc.2582T>A/p.L861QNot detectedNot detectedc.2573T>G/p.L858R
MAF EGFR mutation (%)-0.309.772.15--25.63
p.T790M by NGSNot detectedNot detectedDetectedNot detectedNot detectedNot detectedNot detected
EGFR mutation in tumor at stage IV diagnosisp.G719Xp.L858Rp.L858Rp.L861Qp.G719Xp.L858Rp.L858R
SexMaleFemaleMaleFemaleFemaleFemaleFemale
Age (years)74767468587952
SmokingFormer smokerFormer smokerFormer smokerSmokerNever-smokerNever-smokerNever-smoker
HistologyAdenocar.Adenocar.Adenocar.Adenocar.Adenocar.Adenocar.Adenocar.
ECOG-PSNANANA0111
Metastasis location at stage IV diagnosisThoracic and boneBoneThoracicThoracicBone and CNSThoracicCNS
StageIVBIVBIVAIVAIVBIVAIVB
First-line TKIAfatinibGefitinibAfatinibAfatinibAfatinibErlotinibAfatinib
PFS (months)5.89.712.311.72.811.97.6
Progression siteNANANACNSLiverNANA
Second-line treatmentNoneGefitinibOsimertinibNoneNoneChemoth.Osimertinib
ExitusNANANAYesYesNoYes
OS (months)NANANA15.514.330.49.7
Adenocar.: adenocarcinoma; Chemoth.: chemotherapy; CNS: central nervous system; ECOG-PS: Eastern Cooperative Oncology Group Performance Status; MAF: mutant allele frequency; NA: not available; NGS: next-generation sequencing; OS: overall survival; PFS: progression-free survival.
Table 4. HR and corresponding 95% CI according to MAF cutoff assessed using four different approaches.
MAF CutoffMean MAF aMax MAF bDriver MAF cSum MAF d
HR (95%CI)p-ValueHR (95%CI)p-ValueHR (95%CI)p-ValueHR (95%CI)p-Value
1%0.40 (0.23–0.71)0.0020.44 (0.25–0.81)0.0080.39 (0.23–0.68)0.0010.71 (0.38–1.34)0.295
2%0.40 (0.23–0.67)0.0010.39 (0.23–0.66)0.0010.44 (0.26–0.74)0.0020.47 (0.26–0.82)0.009
3%0.48 (0.29–0.81)0.0060.38 (0.23–0.65)<0.0010.45 (0.27–0.75)0.0030.39 (0.22–0.67)0.001
4%0.53 (0.31–0.91)0.0220.37 (0.22–0.63)<0.0010.43 (0.26–0.73)0.0020.40 (0.23–0.68)0.001
5%0.40 (0.23–0.69)0.0010.46 (0.28–0.78)0.0040.50 (0.30–0.84)0.0090.38 (0.22–0.65)<0.001
6%0.45 (0.25–0.79)0.0060.48 (0.29–0.82)0.0070.50 (0.30–0.85)0.0100.43 (0.26–0.73)0.002
7%0.41 (0.22–0.74)0.0030.43 (0.25–0.72)0.0020.44 (0.26–0.75)0.0030.45 (0.27–0.76)0.003
8%0.44 (0.24–0.81)0.0080.46 (0.27–0.78)0.0040.47 (0.28–0.81)0.0070.49 (0.29–0.82)0.006
9%0.44 (0.24–0.81)0.0080.40 (0.23–0.70)0.0010.42 (0.24–0.72)0.0020.43 (0.26–0.73)0.002
10%0.41 (0.22–0.77)0.0050.42 (0.25–0.73)0.0020.44 (0.25–0.76)0.0030.49 (0.29–0.82)0.007
a Mean MAF was calculated as the mean of the MAF set of variants detected for each sample. b Max MAF was defined as the maximum MAF among the set of variants detected for each sample. c Driver MAF was defined as the maximum MAF among EGFR-sensitizing variants detected for each sample. This analysis was carried out using 89 samples which had detectable EGFR variants. d Sum MAF was calculated as the summation of the MAF set of variants detected for each sample. HRs and p-values were calculated using univariate Cox model analysis. All data were estimated for overall survival. CI: confidence interval; HR: hazard ratio; MAF: mutant allele frequency.
Publisher’s Note: MDPI stays neutral with regard to jurisdictional claims in published maps and institutional affiliations.

