Simple Summary
DNA repair pathways have been implicated in hepatocellular carcinoma outcomes. We found that hepatocellular carcinomas (HCC) could be separated into two groups (high and low) based on the overall expression of genes involved in DNA repair. Among the low repair group, there were three subgroups, one of which shared features of the high repair group. Given the important role of liver in metabolism and detoxification and its regenerative capacity, proliferation and DNA damage responses are critical in subdividing major biological categories of liver tumors. High repair samples showed more proliferative and regenerative signatures and had poorer outcomes versus the low repair that were more associated with the genes involved in normal liver biology. These biological groups suggest that dysregulation in endogenous liver processes promotes a pro-tumorigenic microenvironment that may facilitate tumor progression or identify tumors that require more substantial clinical intervention.
Abstract
DNA repair pathways have been associated with variability in hepatocellular carcinoma (HCC) clinical outcomes, but the mechanism through which DNA repair varies as a function of liver regeneration and other HCC characteristics is poorly understood. We curated a panel of 199 genes representing 15 DNA repair pathways to identify DNA repair expression classes and evaluate their associations with liver features and clinicopathologic variables in The Cancer Genome Atlas (TCGA) HCC study. We identified two groups in HCC, defined by low or high expression across all DNA repair pathways. The low-repair group had lower grade and retained the expression of classical liver markers, whereas the high-repair group had more clinically aggressive features, increased p53 mutant-like gene expression, and high liver regenerative gene expression. These pronounced features overshadowed the variation in the low-repair subset, but when considered separately, the low-repair samples included three subgroups: L1, L2, and L3. L3 had high DNA repair expression with worse progression-free (HR 1.24, 95% CI 0.81–1.91) and overall (HR 1.63, 95% CI 0.98–2.71) survival. High-repair outcomes were also significantly worse compared with the L1 and L2 groups. HCCs vary in DNA repair expression, and a subset of tumors with high regeneration profoundly disrupts liver biology and poor prognosis.
1. Introduction
Hepatocellular carcinoma (HCC) is a heterogeneous type of cancer that varies vastly in clinical outcome and response to therapy. Although several studies have identified important molecular classes in HCC, uncertainty remains regarding their associations with outcomes and their complex interaction with liver regenerative processes [1,2,3,4,5,6,7,8,9,10,11,12,13]. Recently, our lab defined three distinct molecular-based subpopulations of HCC tumors, namely HCC, Blast-Like, and CCA-like, based on gene expression similarity to cholangiocarcinomas and hepatoblast cells [14]. The HCC class has prototypical HCC tumor characteristics. Blast-like has an enrichment of TP53 mutations and HBV-positive status, exposure-related mutational signatures such as the HCC class, and transcriptional patterns similar to hepatoblasts. While the CCA-like histologically resembles HCC, molecularly, they look more like cholangiocarcinomas with similar patterns of DNA mutations (IDH1/2, BAP1), DNA damage repair mutational signatures, and transcriptional patterns. These differences in key DNA repair pathways suggest the importance of DNA repair, but an exploration of DNA-repair-specific signatures and their relationships to other cellular pathways can help elucidate their significance in HCC.
Hepatocytes, the chief functional cells of the liver, are responsible for many critical liver functions, such as detoxification, carbohydrate metabolism, lipid metabolism, and protein synthesis. If any of the regulatory pathways supporting liver function are impeded, the liver becomes more susceptible to advanced liver disease, including cirrhosis, hepatitis, and eventually, HCC [15]. These changes lead to increased rates of hepatocyte proliferation and impaired G1/S checkpoint [16,17]. DNA repair plays a role in normal liver function and varies as a function of the cell cycle [18]. Dysfunction in DNA repair pathways has been linked to many cancer types, but the liver’s unique capacity to regenerate adds additional complexity to HCC.
It is well-established that the liver’s regenerative capability is tightly coupled to DNA repair processes [19,20,21,22]. Upon chronic liver damage, both processes are substantially dysregulated, and there is an increased risk of genomic instability [17,23,24,25]. This dysregulation triggers a set of DNA damage response (DDR) pathways that orchestrate hepatocyte DNA repair, cell cycle arrest, and cell death. Aberrations in DNA repair and its associated pathways, such as homologous recombination (HR), mismatch repair (MMR), and nonhomologous end joining (NHEJ), have been implicated in impairing liver genomic integrity, leading to the activation of hepatocarcinogenesis and HCC development [26,27,28,29]. Given the importance of liver regeneration and DNA damage response, they could have a joint impact on prognosis and therapeutic response. Specifically, the dysregulation of DDR may determine chemoresistance, as shown in other tumor types [30,31].
Here, we investigated DNA repair defects in the TCGA HCC study using a selected panel of 199 genes representative of 15 DNA repair pathways. We sought to understand DNA repair in the context of liver homeostasis, including liver-specific gene expression, mitosis, and liver regeneration. We hypothesized that specific DNA repair patterns, along with liver regenerative capacity, could dictate prognostic groups in HCC. The further characterization of DNA repair pathways in both low- and high-repair HCC tumors, together with the integration of genomic information and clinical data, may help to better understand HCC heterogeneity in relation to outcomes.
2. Methods
2.1. Study Population and Datasets
The upper-quartile-normalized RSEM gene expression data for TCGA hepatocellular carcinoma (HCC dataset, n = 374) were downloaded from the GDC Legacy Archive (https://portal.gdc.cancer.gov/legacy-archive/, Last Accessed Date 2 June 2022) and log2-transformed. The data were median centered across the samples.
The mutation data, including DNA variant allele frequency (VAF), were downloaded from Ellrott et al. [32] (https://gdc.cancer.gov/about-data/publications/mc3-2017, Last Accessed Date 7 June 2022). The processed RNA data were retrieved from TCGA PanCancer (https://gdc.cancer.gov/about-data/publications/pancanatlas, Last Accessed Date 7 June 2022) [33]. For each somatic mutation in the VAF file, we calculated RNA fragments’ allele counts.
2.2. Classification of DNA Repair Groups in RNA Expression Data
We curated a list of 199 genes representing the regulators of many DNA repair pathways (Supplemental Table S1). The panel comprised the following DNA repair pathways: mismatch repair (MMR), nucleotide excision repair (NER), translesion synthesis (TLS), Fanconi anemia (FA), base excision repair (BER), nucleotide metabolism, template switch, poly ADP-ribose polymerases (PARP), checkpoint, DNA replication factors/cell cycle, homologous recombination (HR), nonhomologous end joining (NHEJ), alternative end joining (Alt-EJ), cancer-testis antigens (CTAs) (including HORMAD1 and MAGEA4, which are pathological cancer-specific activators of HR and TLS, respectively [34,35]), and the APOBEC cytosine deaminase family.
The 199-Repair score was calculated as the median of the DNA repair genes. We applied the R package mclust (v5.4.7) [36] to select the optimal cut point, and based on the determined cut-point value of 0.1, the samples were classified as low repair or high repair. The hepatitis B virus (HBV) was detected in HCC tumor RNAseq data via VirDetect [37]. The expression data were visualized using ComplexHeatmap (v2.8.0) [38] in R. All analyses were performed using the R Statistical Software (v4.1.0, R Core Team 2021, Vienna, Austria) [39] unless otherwise noted.
2.3. Define Mitotic and Regeneration Patterns in HCC
We calculated the mitotic index score using the median of 10 mitotic pathway genes—BUB1, BUB1B, BUB3, CDC20, CDH1, ESPL1, MAD1L1, MAD2L1, PTTG1, TRIM69—from the 199 DNA repair gene panel. A regeneration score from Colak et al. [40] was derived from their regeneration activation and inhibition gene sets in by multiplying the activation gene expression values by +1 and the inhibition gene expression values by −1, and after combining them, the median value was calculated. We compared the continuous mitotic and regeneration score components of DNA repair groups using the Wilcoxon signed-ranked tests.
2.4. Interrogation of the Biological States and Processes in DNA Repair Groups
Gene set enrichment analysis (GSEA) [41,42] was performed by comparing the high-repair group vs. the low-repair group for all HCC tumors, and significance was determined by using a false-discovery rate (FDR) <0.25. We utilized the MSigDB Hallmark gene set and excluded any genes overlapping (103 genes) with our DNA repair gene panel to control for the fact that the groups were derived from the RNA expression data. Normalized enrichment scores (NES) were plotted for Hallmark pathways identified as significant for the high-repair and low-repair groups. We calculated pathway scores for selected significant pathways. Hallmark pathway scores and liver-specific markers were compared, stratified by the repair groups, with tumor-adjacent normal tissues using pairwise t-tests to investigate signatures of liver’s biological function.
2.5. Association of p53 and HRD
To identify mutations associated with the DNA repair groups, we used a Fisher’s exact test between low and repair groups restricting analyses to genes mutated in at least 5% of the study. We also included ALB gene as it is involved in liver metabolic pathways and mutated in HCC. Genes in HRD pathway with mutations were selected based on Chen et al. [43]. We used a previously validated RNA signature that aggregates the information on TP53-dependent genes to classify the TP53 functional status (mutant-like or wild-type) based on a similarity-to-centroid approach. The TP53 mutational status was classified based on the presence (TP53 mut) or absence (TP53 WT) of somatic TP53 mutations. We compared the TP53 RNA variant allele frequency (VAF) vs. DNA VAF stratified by repair groups using a linear model. Homologous recombination deficiency (HRD) scores, including the loss of heterozygosity (LOH) [44], large-scale transitions (LST) [45], and the number of subchromosomal regions with allelic imbalance extending to the telomere (NtAI) [46], were extracted from supplemental data in Knijnenburg et al. [47]. The scores were dichotomized at a cut point of 20 based on the distribution of HRD scores in the liver to ensure the HRD status is tissue-specific similar to prior studies in the literature [48,49,50].
We estimated the relative frequency differences (RFDs), representative of the difference between an index group and a reference group in the proportion of individuals exhibiting a given clinical or demographic feature, between the high-repair/regenerative (index) group and the low-repair (referent) group. RFDs and 95% confidence intervals (CIs) were estimated using generalized linear models with binomial distributions and identity link functions.
2.6. Low-Repair Tumor Classification
To unmask the differences in the low-repair group, we removed the samples classified in the high-repair/regenerative group from the TCGA HCC expression data. We performed a clustering analysis using the R package ConsensusClusterPlus (v1.56.0) [51] on the low-repair group to evaluate the expression differences present in the low-repair group.
2.7. Clinical Variables and Survival Analysis
We extracted the TCGA clinicopathologic and survival data from Liu et.al [52]. The clinical data were filtered to samples with ≥94% of available clinical annotations across the study for race, gender, age, pathologic stage, pathologic primary tumor (pT), grade, and survival. The AJCC TNM Classification 2010 (7th Edition) [53] was used for pathologic primary tumor (pT) and the samples classified by the AJCC TNM Classification 6th Edition [54] were converted to those classified by the 7th edition. The samples classified based on the AJCC 4th and 5th edition TNM staging system [55,56] were excluded from our analyses due to the lack of sufficient information for conversion to the 7th edition. Kaplan–Meier curves with log-rank tests were generated using the R package survminer (v0.4.9) [57]. Univariate Cox regression was used to determine the significance of DNA repair groups, sex, race, molecular subtype, stage, grade, and HBV status. The models were stratified by pathological tumor stage and tumor grade to determine whether associations between the repair status and survival held. Continuous variable comparisons were made across the repair groups using the Wilcoxon signed-rank test or ANOVA as indicated. Statistical analyses were performed using R unless otherwise noted.
3. Results
3.1. HCC Tumors Exhibit Two Groups Based on Expression of 199 DNA Repair Genes
To characterize DNA repair patterns in TCGA hepatocellular carcinoma (HCC) samples, we calculated an RNA-based DNA repair score based on 199 DNA repair genes and identified an optimal cut point to distinguish the groups. HCC tumors were classified into two groups based on the DNA repair gene expression: low-repair (n = 216) and high-repair (n = 158) (Figure 1A, Supplemental Data). The high-repair group includes many upregulated genes across all the DNA repair pathways, pointing to the high activity of DNA repair genes. The TCGA HCC samples classified as high-repair were significantly associated with Blast-like and CCA-like molecular subtypes, Asian race, the enrichment of HBV-positive cases, and higher tumor stage, primary tumor (pT), and grade (Table 1). The median age at diagnosis was significantly lower in the high-repair group. There were no significant differences in vascular invasion between the repair groups. Low-repair samples represent prototypical HCC tumors, as most were classified in the HCC molecular subtype and were significantly enriched for lower-stage and -grade tumors.
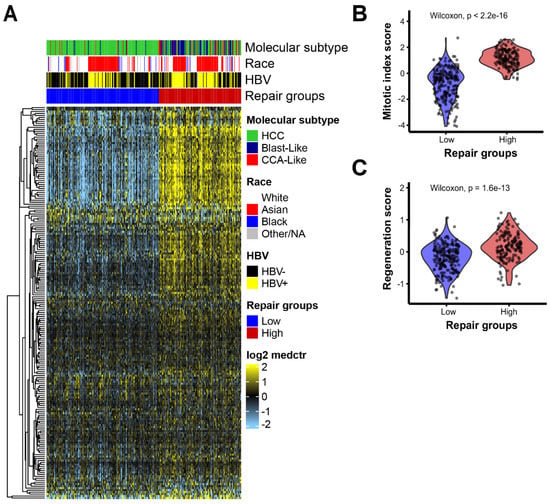
Figure 1.
HCC tumors separated into two distinct groups based on DNA repair pathway gene expression: (A) expression heatmap of 199 DNA repair genes ordered by repair groups. The heatmap scale is from low expression (light blue) to high expression (yellow). Rows represent DNA repair genes and column samples. Annotation tracks show molecular subtype, race, HBV status, and Repair groups. Violin plots of (B) mitotic index score and (C) regeneration score relative to repair groups, low repair (blue) and high repair (red); p-value based on Wilcoxon test between groups.

Table 1.
Patient characteristics of TCGA HCC study, overall and stratified by DNA repair groups. Column values in percentages.
Based on the overall high DNA repair expression seen in the high-repair group, we hypothesized that this group may have a high activity of mitotic and liver regenerative pathways. To investigate, we examined the mitotic and liver regenerative pathway patterns stratified by the repair groups. The mitotic index score and regenerative score were significantly increased in the high-repair group compared with the low-repair group (p < 0.001, Figure 1B,C) (Supplemental Data).
To further interrogate the biological processes occurring in these groups, we performed gene set enrichment analysis (GSEA) using the Hallmark gene signature set (excluding the genes overlapping with our DNA repair gene set) to identify the differential pathway signatures between the high- and low-repair groups (Supplemental Figure S1A). The high-repair group was significantly enriched for five pathways that are characterized by cell cycle gene sets (G2M checkpoint, E2F targets, mitotic spindle), spermatogenesis, and MYC targets. By contrast, the low-repair group had eight significantly enriched pathways, all the gene sets related to liver biology and function (adipogenesis, xenobiotic metabolism, fatty acid metabolism, coagulation, bile acid metabolism, oxidative phosphorylation, peroxisome, and reactive oxygen species). We further looked at the signature scores for pathways that were of substantive interest due to their significance in liver biology and DNA repair mechanisms. The adipogenesis and fatty acid metabolism signature scores were significantly higher in the low-repair group but still not as high as the tumor-adjacent normal tissue (p < 0.001, Supplemental Figure S1B,C). MYC target genes were significantly upregulated in the high-repair samples compared with the low-repair group (p < 0.001 for all pairwise comparisons, Supplemental Figure S1D). The high-repair group displayed significantly higher expression of cell cycle and hepatoblast marker AFP than the low-repair group and tumor-adjacent normal tissues (p < 0.001 for all pairwise comparisons, Supplemental Figure S1E). The low-repair group also had significantly increased expression levels of liver markers ALB and cytochrome P450 (CYP450), but the expression levels were still not as high as those of the normal liver (p < 0.01, Supplemental Figure S1F,G). The low-repair group displayed a more preserved liver biology gene expression, while the high-repair group showed decreased liver biological gene expression and increased DNA repair dysregulation.
3.2. High-Repair Classes Are Associated with p53 Functional Status and TP53 Mutation Status
Given that ~36% of HCC tumors have TP53 mutations and considering the mutual regulation between cell cycle and p53, we hypothesized that p53 plays a vital role in liver repair dysfunction and genomic instability. We assessed the mutational landscape based on the repair groups. Of the 781 recurrently mutated genes present in at least 5% of the liver samples, only TP53 and CTNNB1 were significantly differently mutated between the repair groups. The high-repair group had a significantly higher rate of TP53 mutations (44.9%) than the low-repair group (19%, p < 0.001, Table 2). Interestingly, CTNNB1 mutations were significantly enriched in the low-repair group (32.4%) compared with those enriched in the high-repair group (18.4%) (p < 0.001). CTNNB1 mutations frequently occur in HCCs, leading to the activation of the WNT/β-catenin signaling pathway in 30–50% of HCC cases [58]. Another key liver gene, ALB, was more frequently mutated in the low-repair group (19.4%) than in the high-repair group (11.4%), though it did not reach significance. The key HRD genes (ATM, POLE, BRCA1/2, BARD1, BRIP1) exhibited less than a 5% mutation rate in both groups, except for the DNA damage response pathway gene AXIN1, which was higher in the high-repair group (9.5%) than the low-repair one (6.0%).
Table 2.
Overall mutation rate for frequently mutated, liver metabolic, and DNA repair genes in HCC stratified by DNA Repair groups.
To further consider the role of master regulator TP53, we used a previously validated RNA signature to classify tumors for the p53 functional status (mutant-like/Wild-Type [WT]) [59]. The patterns of expression for the p53 gene signature are shown across the HCC tumors in Figure 2A. Two groups are evident: one enriched for p53 mutant-like and the other enriched for p53 wild-type (WT). The high-repair group was significantly enriched for the tumors classified as p53 mutant-like, accounting for 75% of the p53 mutant-like HCC samples (p < 0.001, Supplemental Table S2).
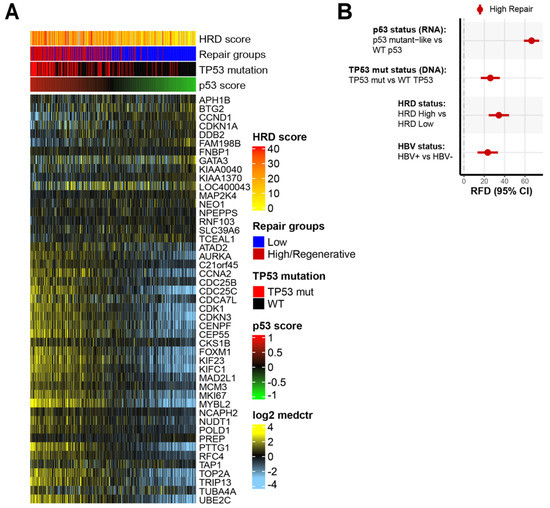
Figure 2.
High-repair classes are associated with dysfunctional p53 functional status and TP53 mutation status: (A) expression patterns of p53 gene signature with samples (columns) ordered by p53 score and genes (rows) sorted by p53 mutant-like genes. The p53 score is scaled low (green) to high (red). The heatmap scale is low expression (light blue) to high expression (yellow). Annotation tracks show HRD score, DNA repair groups, TP53 mutation status, and p53 score; (B) relative frequency difference (RFD) analysis of features in high-repair group compared with low-repair group. Features include p53 mutant status, TP53 mutation status, HRD status, and HBV status. The 95% confidence intervals (CIs) are included for each measure.
We evaluated whether the p53 status (RNA), TP53 mutational status (DNA), HRD, and HBV status were associated with the DNA repair groups. The high-repair group had enrichment for the p53 mutant-like status (RNA), TP53 mutation status (DNA), HRD-high status, and HBV-positive status (Figure 2B, Supplemental Table S2). In the high-repair group, the mutant p53 signature (RFD: 66.5%, 95% CI 58.5–73.5) was even more prevalent than the TP53 DNA mutation status (RFD: 26.0%, 95% CI 16.6–35.2) (Figure 2B). Increased HBV-positive status tracks with the correlation of increased TP53 mutations in HBV+ HCC tumors. The high-repair tumors had significantly higher p53 score and HRD scores than the low-repair tumors (p < 0.001) (Supplemental Figure S2A,B). The HRD-high tumors were unequally distributed between the low-repair and high-repair tumors (RFD: 34%, 95% CI 24.2–44.0) (Figure 2B). The high-repair samples are more likely to be p53 mutant-like and have a high DNA variant allele frequency (VAF), indicating mutation and single copy loss or loss of heterozygosity, in addition to having a high RNA expression of the mutant allele (Supplemental Figure S2C). These results imply that there was strong TP53 dysfunction in the high-repair group. The differences observed in the p53 mutant status underscored the importance of p53 in liver tissue homeostasis.
3.3. Clustering Analysis, Which Reveals Three Subgroups within Low-Repair Groups
The overall, generally high expression of DNA repair genes in the high-repair/regenerative group may mask heterogeneity within the low-repair group. To assess this, we performed a consensus clustering analysis in only the samples classified as low repair. The clustering analysis revealed three subgroups—L1, L2, and L3—with increased heterogeneity across the DNA repair genes (Figure 3A). L1 was significantly decreased for DNA repair activity compared to L2 and L3, but L3 showed greater similarities to the higher repair activity seen in the high-repair group (Figure 3B, L1 vs. rest p < 0.001). L1 and L3 had higher expression of homologous recombination (HR)-related genes (BRIP1, BRCA2, BARD1, RAD51AP1). L2 and L3 were characterized by higher expression levels of cell cycle and mitotic checkpoint genes (BUB1 and BUB1B). L2 showed higher expression levels of replication factors (POLD1, RB1, and HORMAD1). When we examined the associations between clinicopathological features and the risks between the subgroups, only race, grade, and HBV status were significant (Table 3). L1 was associated with lower-grade tumors, while L2 and L3 were significantly enriched for higher-grade tumors (p < 0.001). Asian race and HBV-positive status were more associated with L2 and L3 than with L1 (p = 0.002 (p-value based on Asian race vs. White), p = 0.001). There were no associations with pathologic tumor stage, pathologic primary tumor stage (pT), or vascular invasion across the low-repair groups. We assessed the differences in the TP53 functional status, TP53 mutational status, and HRD status in the low-repair subgroups (Supplemental Table S3). L2 and L3 were significantly enriched for the p53 mutant-like (57.8% and 42.2%, respectively) and TP53 mutations (29.3% and 61.0%, respectively), which were mostly lacking in L1 (p53 mutant-like 0%, TP53 mutation 9.7%, p < 0.001). Additionally, L2 and L3 had significantly higher HRD scores than L1 (p < 0.001). We also explored immune cell specific signatures and did not find any strong associations with DNA repair classes.
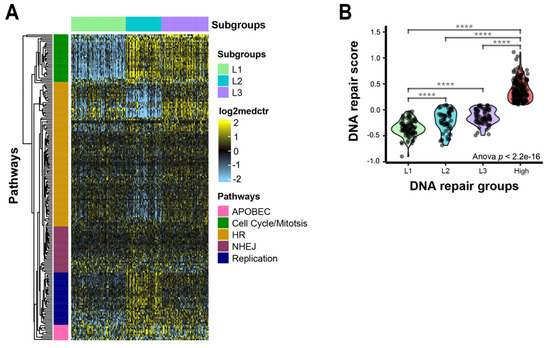
Figure 3.
DNA repair pathway gene expression heterogeneity within the low-repair group: (A) heatmap DNA repair genes in low-repair subgroups. The heatmap’s scale is low expression (light blue) to high expression (yellow). Rows are DNA repair genes, and columns are samples. Annotation track shows clusters: L1 (light green), L2 (turquoise), and L3 (purple). Major gene pathways in each gene cluster are annotated on the rows: APOBEC (pink), cell cycle/mitosis (green), HR (gold), NHEJ (plum), and replication (navy); (B) repair gene score identifies distinct features across early and advanced HCC tumors. Violin plot of repair score by repair groups; **** indicates p < 0.0001 for two-sample t-test between high-expression group and L1.
Table 3.
Clinicopathological features and risk factors of 3 subgroups in the low-repair group.
3.4. High-Repair Group Has Worse Overall Survival and Progression-Free Survival
We investigated the survival differences between the low-repair subgroups and the high-repair group. While there were molecular differences in the samples classified as L1 and L2, these features did not affect the clinical survival rate, so we combined L1+L2 samples for the survival analysis. The progression-free and overall survival rates censored at five years were compared across the low- and high-repair groups (Figure 4) (Supplemental Data). Using the Cox proportional hazards model, high-repair samples revealed significantly worse progression-free (hazard ratio (HR) 1.78, 95% CI 1.26–2.49) and overall (HR 1.97, 95% CI 1.29–2.99) survival than the L1+L2 tumors. By contrast, the L3 group showed an intermediary level of survival that was significantly worse than the progression-free (HR 1.24, 95% CI 0.81–1.91) and overall (HR 1.63, 95% CI 0.98–2.71) survival outcomes observed in the L1+L2 tumors but better than the survival rates of high-repair tumors. When we added the pathologic tumor stage and grade to the model with our repair groups, both L3 and high-repair tumors retained their significance for worse overall survival but only the high-repair tumors retained their significance for worse progression-free survival compared with the referent L1 + L2 tumors. Our DNA repair score classification schema identified a set of patients with worse outcomes based on intermediate and high DNA repair gene expression.
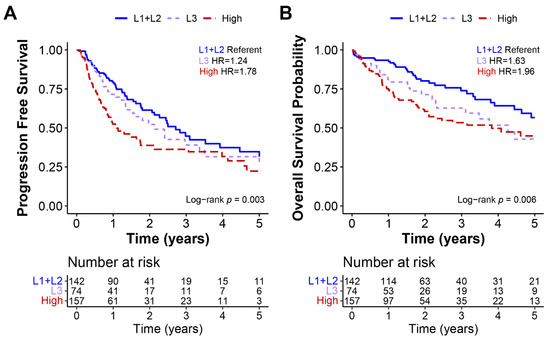
Figure 4.
Low-repair subgroups L1 and L2 had better progression-free and overall survival. Kaplan–Meier curves of TCGA HCC data for (A) progression-free and (B) overall survival. All survival data were censored at 5 years, and hazard ratios, 95% CIs, and log-rank p-values were calculated for each measure.
4. Discussion
We used a curated DNA repair panel to identify DNA repair expression classes in TCGA HCC tumors. We identified two separate DNA repair groups (low-repair and high-repair/regenerative) with distinct biological patterns. The low-repair group was characterized by classical HCC tumor features and lower grades, while the high-repair group had very high DNA repair activity, and was associated with Blast-like and CCA-like molecular subtypes, stage, Asian race, and worse prognosis. The high-repair group overshadowed subtleties in the low-repair group, and therefore, clustering solely in the low-repair group elucidated three subgroups: L1, L2, and L3. The L1 and L2 subgroups were characterized by liver pathways and lacked regenerative processes associated with the high-repair group. L3 retained the expression of liver-related genes but was more similar to the DNA repair expression and survival outcomes of the high-repair group. Based on these findings, L3 tumors may represent a transitory/transdifferentiation HCC group that may become high repair over time.
Previous studies have detected similar molecular classes. Most studies emphasized two main groups based on the DNA repair genes’ RNA expression [8,12,13,60]. Three previous studies identified two DNA repair groups: Oshi et al. found low- and high-repair groups based on a gene set that included 150 genes [12]; Lin et al. classified DNA-repair-activated and -suppressed groups using 276 genes [13]; and Chen et al. found low- and high-risk DNA repair groups based on 23 DDR-related gene pairs [60]. Across these studies, similar to our results, the high-repair-activated samples were associated with worse survival, and these authors further found that high-repair-/DDR-activated samples were associated with distinct immune profiles, poor differentiation, elevated intratumor heterogeneity, and mutation burden. Of these three studies, gene overlap with our 199-gene set varied (overlap was 26, 122, and 11 genes for Oshi et al., Lin et al., and Chen et al., respectively). The similarities observed across these studies, despite the different number of overlapping genes, underscores that these high-repair patterns are robust and can be detected with few features. One advantage of our gene list, which covers many DNA repair pathways, was that we included several essential DNA repair genes such as BUB1, BUB1B, RAD51AP1, RB1, and HORMAD1 that are known to have significant clinical relevance [61,62,63,64,65,66] and helped us to define the heterogeneity among the low DNA repair group. The mitotic and replicative factors, along with HR expression, helped to distinguish low-repair groups. While there is agreement among groups on the two-classification schema, extending beyond two groups has proven more difficult with little resolution. For example, one lab found four groups using a combination of manual and cluster-based methods. In comparison, we used a data-driven clustering approach, and while both studies found four groups, there were different gene sets utilized, and the groups considerably varied. It is clear, regardless of the size of the gene set, that we can identify high-repair groups, but more resolution is needed to identify low-repair samples.
Liver regeneration is a key liver feature that plays a role in HCC development and suggested to support a tumorigenic environment [67]. Our results suggest that liver regeneration includes the chronic activation of the DNA damage response pathway [68]. High-repair/regenerative tumor phenotypes were related to high-grade and Blast-like molecular subtypes. Similarly, samples classified within the high-repair group showed increased wound healing (i.e., increased mitotic activity), increased regenerative activity, and increased p53 dysfunction, indicating that these processes act in tandem. Many of these pathways have been implicated in micrometastases and de novo cancers following surgical resection for liver diseases and HCC [67,69,70,71], emphasizing that these pathways are interconnected and necessary for liver homeostasis.
We further contextualized DNA repair in association with other established pathways implicated in HCC (p53, HBV status, and liver inflammation) to reveal the underlying dysregulation. Prevalent p53 dysfunction was a hallmark of the high-repair group. In particular, there was a great difference in RFDs between the RNA-based p53 status (66.5%) vs. TP53 mutations (26.0%). Integration with RNA-based measures provides key insights because mutations alone do not cover the full molecular portrait, and in the setting of low-burden tumors such as in HCC, these methods allow us to still investigate pathway dysregulation. Cross-platform analysis of the p53 pathway revealed the importance of p53 regulation in HCC heterogeneity. Due to the role of p53 in mediating senescence after liver injury, it is responsible for the regulation of fibrosis and may prevent deterioration leading to HCC [72]. In addition, the mitotic activity is tightly and negatively controlled by p53 [73], and mitotic dysregulation is strongly associated with improper cell division and aneuploidy [74] and, therefore, may promote inflammatory environments [75,76,77].
With respect to HBV, TCGA includes representation from Southeast Asian patients where a major risk factor is HBV infection. HBV subverts the DNA damage repair (DDR) pathways, creating an inflammatory environment that promotes hepatocarcinogenesis and HCC development. Data have revealed a link between chronic HBV infection and immune-induced liver injury [78,79,80]. This injury can result in hyperactive DDR and, in turn, lead to a more aggressive chemoresistant unresectable liver cancer. Based on our findings, HBV-positive HCC tumors are associated with increased expression levels of cell cycle and mitotic genes. We also observed varying expression levels of DNA repair genes in HBV-negative tumors. While the previous discourse has highlighted viral hepatitis, our results suggest there is greater heterogeneity in HCC than previously appreciated, and outcomes may not be solely driven by the HBV infection status. This emphasizes the importance of expanding beyond the comparative paradigm of viral hepatitis vs. nonviral classification and evaluating other significant risk factors such as nonalcoholic fatty liver disease (NAFLD) and nonalcoholic steatohepatitis (NASH) in HCC clinical outcomes.
The major advance of our work was in showing that separating high-repair/regenerative tumors allowed the improved characterization of heterogeneity among low-repair HCCs with more intact liver signaling and homeostasis. This helped identify the L3 tumor group, which was found to have some preserved liver biology and functional status but higher HRD and DNA repair dysfunction. L3 also had a higher frequency of p53 mutant-like and TP53 mutations. We also noted differences in the racial profile, grade, HBV status, and molecular differences in L1 and L2, but these features did not dictate the differences in survival outcomes between the samples. By stratifying based on the repair status, we identified novel classes that predict outcomes. Regardless of the tumor grade and stage, L3 and high-repair groups had worse prognoses than the L1 and L2 tumors, further underscoring the HCC heterogeneity and the interaction of multiple factors that lead to the differences in outcomes. All the study participants had localized disease with very few final pathologic metastases, making them eligible for surgical intervention. TCGA has a short length of follow-ups and lacks liver disease scoring (Child Pugh classification, Ishak fibrosis stage) and treatment data, limiting our ability to investigate the role of our DNA repair classifiers in the extent of liver damage and HCC patient therapy. DNA damage response dysregulation is often enhanced in HCC, resulting in poor response to DNA-damaging anticancer therapies [25]. Researchers observed that high-repair HCC tumors treated with conventional chemotherapy resulted in worse overall survival than high-repair-status patients who received immune checkpoint inhibitors [81]. The assessment of DNA damage and repair dysregulation may pose another method of stratifying patients based on DNA repair status for improved treatment management and selection. More comprehensive and standardized annotation for clinical data elements will be essential to better understand the associations between DNA repair defects, liver regenerative mechanisms, and risk factors in HCC.
5. Conclusions
In summary, this work expands on the findings of prior studies to identify four DNA repair classes in HCC (L1, L2, L3, and high-repair/regenerative) that are associated with distinct clinical prognoses. Our data suggest that DNA repair and liver contribute to HCC heterogeneity, resulting in variable clinical outcomes. Our signature suggests potential prognostic groups in HCC with distinct biology and plausible roles in clinical utility. Future work should evaluate heterogeneity in DNA repair in association with specific chemotherapeutic regimens to address the critical need for improved treatment strategies for this poor-prognosis cancer type.
Supplementary Materials
The following supporting information can be downloaded at: https://www.mdpi.com/article/10.3390/cancers14174282/s1, Figure S1: Low-repair samples display expression of genes involved in liver function; Figure S2: TP53 dysfunction and high HRD are defining features of High-repair tumors; Table S1: DNA repair genes by pathway; Table S2: p53 and HRD-related features in HCC stratified by DNADNA Repair groups; Table S3: p53 and HRD-related features in HCC stratified by Low-repair subgroups. Supplemental Data: HCCDNArepair.
Author Contributions
Conceptualization, M.A.S., M.A.T. and K.A.H.; methodology, M.A.S., A.W., S.C.V.A., M.I.L., M.A.T. and K.A.H.; software, M.A.S.; validation M.A.S.; formal analysis, M.A.S.; investigation, M.A.S., M.A.T. and K.A.H.; resources, M.A.S., A.W., S.C.V.A., J.S.D. and K.A.H.; data curation, M.A.S. and J.S.D.; writing—original draft preparation, M.A.S., M.A.T. and K.A.H.; writing—review and editing, M.A.S., R.R.B., U.N.M., M.I.L., M.A.T. and K.A.H.; visualization, M.A.S.; supervision, R.R.B., U.N.M., M.A.T. and K.A.H.; project administration, M.A.S., M.A.T. and K.A.H.; funding acquisition, M.A.T. and K.A.H. All authors have read and agreed to the published version of the manuscript.
Funding
This work was supported by the National Institutes of Health U24 CA210988 and U24-CA264021 (to K.A.H.), P30-ES010126 (to M.A.T. and K.A.H.), P30-CA016086 (to M.A.T.) and the UNC-CH Cancer Control Education Program (T32CA057726 to A.W.).
Institutional Review Board Statement
Not applicable.
Informed Consent Statement
Not applicable. TCGA samples were collected through an IRB-approved protocol or through a TCGA specific IRB waiver. Informed consent and IRB approval were obtained for all other data by the authors of the publications in which the original datasets were published.
Data Availability Statement
The TCGA data are available through the GDC data portal, https://portal.gdc.cancer.gov/, Last Accessed Date 2 June 2022.
Acknowledgments
We thank the members of the K.A.H. and M.A.T. laboratories for useful discussions.
Conflicts of Interest
The authors declare no potential conflict of interest.
References
- Hoshida, Y.; Nijman, S.M.; Kobayashi, M.; Chan, J.A.; Brunet, J.P.; Chiang, D.Y.; Villanueva, A.; Newell, P.; Ikeda, K.; Hashimoto, M.; et al. Integrative transcriptome analysis reveals common molecular subclasses of human hepatocellular carcinoma. Cancer Res. 2009, 69, 7385–7392. [Google Scholar] [CrossRef] [PubMed]
- Cancer Genome Atlas Research Network; Wheeler, D.A.; Roberts, L.R. Comprehensive and Integrative Genomic Characterization of Hepatocellular Carcinoma. Cell 2017, 169, 1327–1341.e23. [Google Scholar] [CrossRef]
- Lee, J.S.; Heo, J.; Libbrecht, L.; Chu, I.S.; Kaposi-Novak, P.; Calvisi, D.F.; Mikaelyan, A.; Roberts, L.R.; Demetris, A.J.; Sun, Z.; et al. A novel prognostic subtype of human hepatocellular carcinoma derived from hepatic progenitor cells. Nat. Med. 2006, 12, 410–416. [Google Scholar] [CrossRef]
- Boyault, S.; Rickman, D.S.; de Reynies, A.; Balabaud, C.; Rebouissou, S.; Jeannot, E.; Herault, A.; Saric, J.; Belghiti, J.; Franco, D.; et al. Transcriptome classification of HCC is related to gene alterations and to new therapeutic targets. Hepatology 2007, 45, 42–52. [Google Scholar] [CrossRef] [PubMed]
- Sia, D.; Jiao, Y.; Martinez-Quetglas, I.; Kuchuk, O.; Villacorta-Martin, C.; Castro de Moura, M.; Putra, J.; Camprecios, G.; Bassaganyas, L.; Akers, N.; et al. Identification of an Immune-specific Class of Hepatocellular Carcinoma, Based on Molecular Features. Gastroenterology 2017, 153, 812–826. [Google Scholar] [CrossRef]
- Chaisaingmongkol, J.; Budhu, A.; Dang, H.; Rabibhadana, S.; Pupacdi, B.; Kwon, S.M.; Forgues, M.; Pomyen, Y.; Bhudhisawasdi, V.; Lertprasertsuke, N.; et al. Common Molecular Subtypes among Asian Hepatocellular Carcinoma and Cholangiocarcinoma. Cancer Cell 2017, 32, 57–70.e3. [Google Scholar] [CrossRef] [PubMed]
- Xue, R.; Chen, L.; Zhang, C.; Fujita, M.; Li, R.; Yan, S.M.; Ong, C.K.; Liao, X.; Gao, Q.; Sasagawa, S.; et al. Genomic and Transcriptomic Profiling of Combined Hepatocellular and Intrahepatic Cholangiocarcinoma Reveals Distinct Molecular Subtypes. Cancer Cell 2019, 35, 932–947.e8. [Google Scholar] [CrossRef]
- Lin, Z.; Xu, S.H.; Wang, H.Q.; Cai, Y.J.; Ying, L.; Song, M.; Wang, Y.Q.; Du, S.J.; Shi, K.Q.; Zhou, M.T. Prognostic value of DNA repair based stratification of hepatocellular carcinoma. Sci. Rep. 2016, 6, 25999. [Google Scholar] [CrossRef]
- Zhu, W.; Zhang, Q.; Liu, M.; Yan, M.; Chu, X.; Li, Y. Identification of DNA repair-related genes predicting pathogenesis and prognosis for liver cancer. Cancer Cell Int. 2021, 21, 81. [Google Scholar] [CrossRef]
- Zheng, Q.; Yang, Q.; Zhou, J.; Gu, X.; Zhou, H.; Dong, X.; Zhu, H.; Chen, Z. Immune signature-based hepatocellular carcinoma subtypes may provide novel insights into therapy and prognosis predictions. Cancer Cell Int. 2021, 21, 330. [Google Scholar] [CrossRef]
- Zhuang, W.; Sun, H.; Zhang, S.; Zhou, Y.; Weng, W.; Wu, B.; Ye, T.; Huang, W.; Lin, Z.; Shi, L.; et al. An immunogenomic signature for molecular classification in hepatocellular carcinoma. Mol. Ther. Nucleic Acids 2021, 25, 105–115. [Google Scholar] [CrossRef] [PubMed]
- Oshi, M.; Kim, T.H.; Tokumaru, Y.; Yan, L.; Matsuyama, R.; Endo, I.; Cherkassky, L.; Takabe, K. Enhanced DNA Repair Pathway is Associated with Cell Proliferation and Worse Survival in Hepatocellular Carcinoma (HCC). Cancers 2021, 13, 323. [Google Scholar] [CrossRef] [PubMed]
- Lin, P.; Gao, R.Z.; Wen, R.; He, Y.; Yang, H. DNA Damage Repair Profiles Alteration Characterize a Hepatocellular Carcinoma Subtype with Unique Molecular and Clinicopathologic Features. Front. Immunol. 2021, 12, 715460. [Google Scholar] [CrossRef] [PubMed]
- Damrauer, J.S.; Smith, M.A.; Walter, V.; Thennavan, A.; Mose, L.E.; Selitsky, S.R.; Hoadley, K.A. Genomic characterization of rare molecular subclasses of hepatocellular carcinoma. Commun. Biol. 2021, 4, 1150. [Google Scholar] [CrossRef]
- Schulze, R.J.; Schott, M.B.; Casey, C.A.; Tuma, P.L.; McNiven, M.A. The cell biology of the hepatocyte: A membrane trafficking machine. J. Cell Biol. 2019, 218, 2096–2112. [Google Scholar] [CrossRef]
- Weglarz, T.C.; Sandgren, E.P. Timing of hepatocyte entry into DNA synthesis after partial hepatectomy is cell autonomous. Proc. Natl. Acad. Sci. USA 2000, 97, 12595–12600. [Google Scholar] [CrossRef]
- Caldez, M.J.; Bjorklund, M.; Kaldis, P. Cell cycle regulation in NAFLD: When imbalanced metabolism limits cell division. Hepatol. Int. 2020, 14, 463–474. [Google Scholar] [CrossRef]
- Greenbaum, L.E. Cell cycle regulation and hepatocarcinogenesis. Cancer Biol. Ther. 2004, 3, 1200–1207. [Google Scholar] [CrossRef]
- Yang, S.Q.; Lin, H.Z.; Mandal, A.K.; Huang, J.; Diehl, A.M. Disrupted signaling and inhibited regeneration in obese mice with fatty livers: Implications for nonalcoholic fatty liver disease pathophysiology. Hepatology 2001, 34, 694–706. [Google Scholar] [CrossRef]
- Zhao, G.; Nakano, K.; Chijiiwa, K.; Ueda, J.; Tanaka, M. Inhibited activities in CCAAT/enhancer-binding protein, activating protein-1 and cyclins after hepatectomy in rats with thioacetamide-induced liver cirrhosis. Biochem. Biophys. Res. Commun. 2002, 292, 474–481. [Google Scholar] [CrossRef]
- Fausto, N.; Campbell, J.S.; Riehle, K.J. Liver regeneration. Hepatology 2006, 43, S45–S53. [Google Scholar] [CrossRef]
- Furchtgott, L.A.; Chow, C.C.; Periwal, V. A model of liver regeneration. Biophys. J. 2009, 96, 3926–3935. [Google Scholar] [CrossRef] [PubMed]
- Dewhurst, M.R.; Ow, J.R.; Zafer, G.; van Hul, N.K.M.; Wollmann, H.; Bisteau, X.; Brough, D.; Choi, H.; Kaldis, P. Loss of hepatocyte cell division leads to liver inflammation and fibrosis. PLoS Genet. 2020, 16, e1009084. [Google Scholar] [CrossRef] [PubMed]
- Miyaoka, Y.; Miyajima, A. To divide or not to divide: Revisiting liver regeneration. Cell Div. 2013, 8, 8. [Google Scholar] [CrossRef] [PubMed]
- Yang, S.F.; Chang, C.W.; Wei, R.J.; Shiue, Y.L.; Wang, S.N.; Yeh, Y.T. Involvement of DNA damage response pathways in hepatocellular carcinoma. BioMed Res. Int. 2014, 2014, 153867. [Google Scholar] [CrossRef]
- Fortini, P.; Ferretti, C.; Dogliotti, E. The response to DNA damage during differentiation: Pathways and consequences. Mutat. Res. 2013, 743–744, 160–168. [Google Scholar] [CrossRef] [PubMed]
- Chung, Y.L.; Wu, M.L. Promyelocytic leukaemia protein links DNA damage response and repair to hepatitis B virus-related hepatocarcinogenesis. J. Pathol. 2013, 230, 377–387. [Google Scholar] [CrossRef] [PubMed]
- Bayram, S.; Akkiz, H.; Bekar, A.; Akgollu, E.; Yildirim, S. The significance of Exonuclease 1 K589E polymorphism on hepatocellular carcinoma susceptibility in the Turkish population: A case-control study. Mol. Biol. Rep. 2012, 39, 5943–5951. [Google Scholar] [CrossRef] [PubMed]
- Lees-Miller, S.P.; Meek, K. Repair of DNA double strand breaks by non-homologous end joining. Biochimie 2003, 85, 1161–1173. [Google Scholar] [CrossRef]
- Okamura, R.; Kurzrock, R.; Mallory, R.J.; Fanta, P.T.; Burgoyne, A.M.; Clary, B.M.; Kato, S.; Sicklick, J.K. Comprehensive genomic landscape and precision therapeutic approach in biliary tract cancers. Int. J. Cancer 2021, 148, 702–712. [Google Scholar] [CrossRef]
- Rao, S.; Beckman, R.A.; Riazi, S.; Yabar, C.S.; Boca, S.M.; Marshall, J.L.; Pishvaian, M.J.; Brody, J.R.; Madhavan, S. Quantification and expert evaluation of evidence for chemopredictive biomarkers to personalize cancer treatment. Oncotarget 2017, 8, 37923–37934. [Google Scholar] [CrossRef]
- Ellrott, K.; Bailey, M.H.; Saksena, G.; Covington, K.R.; Kandoth, C.; Stewart, C.; Hess, J.; Ma, S.; Chiotti, K.E.; McLellan, M.; et al. Scalable Open Science Approach for Mutation Calling of Tumor Exomes Using Multiple Genomic Pipelines. Cell Syst. 2018, 6, 271–281.e7. [Google Scholar] [CrossRef]
- Hoadley, K.A.; Yau, C.; Hinoue, T.; Wolf, D.M.; Lazar, A.J.; Drill, E.; Shen, R.; Taylor, A.M.; Cherniack, A.D.; Thorsson, V.; et al. Cell-of-Origin Patterns Dominate the Molecular Classification of 10,000 Tumors from 33 Types of Cancer. Cell 2018, 173, 291–304.e6. [Google Scholar] [CrossRef]
- Gao, Y.; Mutter-Rottmayer, E.; Greenwalt, A.M.; Goldfarb, D.; Yan, F.; Yang, Y.; Martinez-Chacin, R.C.; Pearce, K.H.; Tateishi, S.; Major, M.B.; et al. A neomorphic cancer cell-specific role of MAGE-A4 in trans-lesion synthesis. Nat. Commun. 2016, 7, 12105. [Google Scholar] [CrossRef] [PubMed]
- Gao, Y.; Kardos, J.; Yang, Y.; Tamir, T.Y.; Mutter-Rottmayer, E.; Weissman, B.; Major, M.B.; Kim, W.Y.; Vaziri, C. The Cancer/Testes (CT) Antigen HORMAD1 promotes Homologous Recombinational DNA Repair and Radioresistance in Lung adenocarcinoma cells. Sci. Rep. 2018, 8, 15304. [Google Scholar] [CrossRef]
- Scrucca, L.; Fop, M.; Murphy, T.B.; Raftery, A.E. mclust 5: Clustering, Classification and Density Estimation Using Gaussian Finite Mixture Models. R J. 2016, 8, 289–317. [Google Scholar] [CrossRef]
- Selitsky, S.R.; Marron, D.; Hollern, D.; Mose, L.E.; Hoadley, K.A.; Jones, C.; Parker, J.S.; Dittmer, D.P.; Perou, C.M. Virus expression detection reveals RNA-sequencing contamination in TCGA. BMC Genom. 2020, 21, 79. [Google Scholar] [CrossRef] [PubMed]
- Gu, Z.; Eils, R.; Schlesner, M. Complex heatmaps reveal patterns and correlations in multidimensional genomic data. Bioinformatics 2016, 32, 2847–2849. [Google Scholar] [CrossRef]
- R Core Team. R: A Language and Environment for Statistical Computing. In R Foundation for Statistical Computing; R Core Team: Vienna, Austria, 2021. [Google Scholar]
- Colak, D.; Al-Harazi, O.; Mustafa, O.M.; Meng, F.; Assiri, A.M.; Dhar, D.K.; Broering, D.C. RNA-Seq transcriptome profiling in three liver regeneration models in rats: Comparative analysis of partial hepatectomy, ALLPS, and PVL. Sci. Rep. 2020, 10, 5213. [Google Scholar] [CrossRef] [PubMed]
- Mootha, V.K.; Lindgren, C.M.; Eriksson, K.F.; Subramanian, A.; Sihag, S.; Lehar, J.; Puigserver, P.; Carlsson, E.; Ridderstrale, M.; Laurila, E.; et al. PGC-1alpha-responsive genes involved in oxidative phosphorylation are coordinately downregulated in human diabetes. Nat. Genet. 2003, 34, 267–273. [Google Scholar] [CrossRef]
- Subramanian, A.; Tamayo, P.; Mootha, V.K.; Mukherjee, S.; Ebert, B.L.; Gillette, M.A.; Paulovich, A.; Pomeroy, S.L.; Golub, T.R.; Lander, E.S.; et al. Gene set enrichment analysis: A knowledge-based approach for interpreting genome-wide expression profiles. Proc. Natl. Acad. Sci. USA 2005, 102, 15545–15550. [Google Scholar] [CrossRef] [PubMed]
- Chen, J.; Huang, T.; Liu, M.; Liao, W.; Fu, M.; Yang, B.; Duan, J.; Chen, S.; Guo, Y. The prognostic value of HRD mutations in liver cancer. J. Clin. Oncol. 2020, 38, e13546. [Google Scholar] [CrossRef]
- Abkevich, V.; Timms, K.M.; Hennessy, B.T.; Potter, J.; Carey, M.S.; Meyer, L.A.; Smith-McCune, K.; Broaddus, R.; Lu, K.H.; Chen, J.; et al. Patterns of genomic loss of heterozygosity predict homologous recombination repair defects in epithelial ovarian cancer. Br. J. Cancer 2012, 107, 1776–1782. [Google Scholar] [CrossRef] [PubMed]
- Popova, T.; Manié, E.; Rieunier, G.; Caux-Moncoutier, V.; Tirapo, C.; Dubois, T.; Delattre, O.; Sigal-Zafrani, B.; Bollet, M.; Longy, M.; et al. Ploidy and large-scale genomic instability consistently identify basal-like breast carcinomas with BRCA1/2 inactivation. Cancer Res. 2012, 72, 5454. [Google Scholar] [CrossRef] [PubMed]
- Birkbak, N.J.; Wang, Z.C.; Kim, J.-Y.; Eklund, A.C.; Li, Q.; Tian, R.; Bowman-Colin, C.; Li, Y.; Greene-Colozzi, A.; Iglehart, J.D.; et al. Telomeric Allelic Imbalance Indicates Defective DNA Repair and Sensitivity to DNA-Damaging Agents. Cancer Discov. 2012, 2, 366. [Google Scholar] [CrossRef] [PubMed]
- Knijnenburg, T.A.; Wang, L.; Zimmermann, M.T.; Chambwe, N.; Gao, G.F.; Cherniack, A.D.; Fan, H.; Shen, H.; Way, G.P.; Greene, C.S.; et al. Genomic and Molecular Landscape of DNA Damage Repair Deficiency across The Cancer Genome Atlas. Cell Rep. 2018, 23, 239–254.e6. [Google Scholar] [CrossRef] [PubMed]
- Telli, M.L.; Metzger, O.; Timms, K.; Evans, B.; Vogel, D.; Wei, H.; Jones, J.T.; Wenstrup, R.J.; McKee, M.D.; Sullivan, D.M.; et al. Evaluation of homologous recombination deficiency (HRD) status with pathological response to carboplatin +/− veliparib in BrighTNess, a randomized phase 3 study in early stage TNBC. J. Clin. Oncol. 2018, 36, 519. [Google Scholar] [CrossRef]
- Takaya, H.; Nakai, H.; Takamatsu, S.; Mandai, M.; Matsumura, N. Homologous recombination deficiency status-based classification of high-grade serous ovarian carcinoma. Sci. Rep. 2020, 10, 2757. [Google Scholar] [CrossRef]
- Wen, H.; Feng, Z.; Ma, Y.; Liu, R.; Ou, Q.; Guo, Q.; Shen, Y.; Wu, X.; Shao, Y.; Bao, H.; et al. Homologous recombination deficiency in diverse cancer types and its correlation with platinum chemotherapy efficiency in ovarian cancer. BMC Cancer 2022, 22, 550. [Google Scholar] [CrossRef]
- Wilkerson, M.D.; Hayes, D.N. ConsensusClusterPlus: A class discovery tool with confidence assessments and item tracking. Bioinformatics 2010, 26, 1572–1573. [Google Scholar] [CrossRef]
- Liu, J.; Lichtenberg, T.; Hoadley, K.A.; Poisson, L.M.; Lazar, A.J.; Cherniack, A.D.; Kovatich, A.J.; Benz, C.C.; Levine, D.A.; Lee, A.V.; et al. An Integrated TCGA Pan-Cancer Clinical Data Resource to Drive High-Quality Survival Outcome Analytics. Cell 2018, 173, 400–416.e11. [Google Scholar] [CrossRef] [PubMed]
- Edge, S.B.; American Joint Committee on Cancer. AJCC Cancer Staging Manual, 7th ed.; Springer: New York, NY, USA; London, UK, 2010; Volume XIV, 648p. [Google Scholar]
- Greene, F.L.; American Joint Committee on Cancer; American Cancer Society; Sadie Jenkins Harmon Collection. AJCC Cancer Staging Manual, 6th ed.; Springer: New York, NY, USA, 2002; Volume XIV, 421p. [Google Scholar]
- Fleming, I.D.; American Joint Committee on Cancer; National Cancer Institute (U.S.); College of American Pathologists; American College of Radiology; American College of Surgeons; American Cancer Society. AJCC Cancer Staging Manual, 5th ed.; Lippincott-Raven: Philadelphia, PA, USA, 1997; Volume XV, 294p.
- Beahrs, O.H.; American Joint Committee on Cancer; National Cancer Institute (U.S.); College of American Pathologists; American College of Radiology; American College of Surgeons; American Cancer Society. AJCC Cancer Staging Manual, 4th ed.; Lippincott-Raven: Philadelphia, PA, USA, 1977; Volume XV, 293p.
- Kassambara, A.; Kosinski, M.; Biecek, P. Survminer: Drawing Survival Curves using ‘ggplot2’. In R Package Version 0.4.9; R Package: Madison, WI, USA, 2021. [Google Scholar]
- Schulze, K.; Imbeaud, S.; Letouzé, E.; Alexandrov, L.B.; Calderaro, J.; Rebouissou, S.; Couchy, G.; Meiller, C.; Shinde, J.; Soysouvanh, F.; et al. Exome sequencing of hepatocellular carcinomas identifies new mutational signatures and potential therapeutic targets. Nat. Genet. 2015, 47, 505–511. [Google Scholar] [CrossRef]
- Troester, M.A.; Herschkowitz, J.I.; Oh, D.S.; He, X.; Hoadley, K.A.; Barbier, C.S.; Perou, C.M. Gene expression patterns associated with p53 status in breast cancer. BMC Cancer 2006, 6, 276. [Google Scholar] [CrossRef] [PubMed][Green Version]
- Chen, Y.; Huang, M.; Zhu, J.; Xu, L.; Cheng, W.; Lu, X.; Yan, F. Identification of a DNA Damage Response and Repair-Related Gene-Pair Signature for Prognosis Stratification Analysis in Hepatocellular Carcinoma. Front. Pharmacol. 2022, 13, 857060. [Google Scholar] [CrossRef] [PubMed]
- Yang, W.X.; Pan, Y.Y.; You, C.G. CDK1, CCNB1, CDC20, BUB1, MAD2L1, MCM3, BUB1B, MCM2, and RFC4 May Be Potential Therapeutic Targets for Hepatocellular Carcinoma Using Integrated Bioinformatic Analysis. BioMed Res. Int. 2019, 2019, 1245072. [Google Scholar] [CrossRef]
- Zhu, L.J.; Pan, Y.; Chen, X.Y.; Hou, P.F. BUB1 promotes proliferation of liver cancer cells by activating SMAD2 phosphorylation. Oncol. Lett. 2020, 19, 3506–3512. [Google Scholar] [CrossRef]
- Qiu, J.; Zhang, S.; Wang, P.; Wang, H.; Sha, B.; Peng, H.; Ju, Z.; Rao, J.; Lu, L. BUB1B promotes hepatocellular carcinoma progression via activation of the mTORC1 signaling pathway. Cancer Med. 2020, 9, 8159–8172. [Google Scholar] [CrossRef]
- Zhuang, L.; Zhang, Y.; Meng, Z.; Yang, Z. Oncogenic Roles of RAD51AP1 in Tumor Tissues Related to Overall Survival and Disease-Free Survival in Hepatocellular Carcinoma. Cancer Control. 2020, 27, 1073274820977149. [Google Scholar] [CrossRef]
- Duan, X.; Cai, Y.; He, T.; Shi, X.; Zhao, J.; Zhang, H.; Shen, Y.; Zhang, H.; Zhang, H.; Duan, W.; et al. The effect of the TP53 and RB1 mutations on the survival of hepatocellular carcinoma patients with different racial backgrounds. J. Gastrointest. Oncol. 2021, 12, 1786–1796. [Google Scholar] [CrossRef]
- Zong, B.; Sun, L.; Peng, Y.; Wang, Y.; Yu, Y.; Lei, J.; Zhang, Y.; Guo, S.; Li, K.; Liu, S. HORMAD1 promotes docetaxel resistance in triple negative breast cancer by enhancing DNA damage tolerance. Oncol. Rep. 2021, 46, 138. [Google Scholar] [CrossRef]
- Michalopoulos, G.K.; Bhushan, B. Liver regeneration: Biological and pathological mechanisms and implications. Nat. Rev. Gastroenterol. Hepatol. 2021, 18, 40–55. [Google Scholar] [CrossRef]
- Barash, H.; Gross, E.R.; Edrei, Y.; Ella, E.; Israel, A.; Cohen, I.; Corchia, N.; Ben-Moshe, T.; Pappo, O.; Pikarsky, E.; et al. Accelerated carcinogenesis following liver regeneration is associated with chronic inflammation-induced double-strand DNA breaks. Proc. Natl. Acad. Sci. USA 2010, 107, 2207–2212. [Google Scholar] [CrossRef] [PubMed]
- Shi, J.H.; Line, P.D. Effect of liver regeneration on malignant hepatic tumors. World J. Gastroenterol. 2014, 20, 16167–16177. [Google Scholar] [CrossRef] [PubMed]
- Zhong, C.; Wei, W.; Su, X.K.; Li, H.D.; Xu, F.B.; Guo, R.P. Serum and tissue vascular endothelial growth factor predicts prognosis in hepatocellular carcinoma patients after partial liver resection. Hepatogastroenterology 2012, 59, 93–97. [Google Scholar] [CrossRef] [PubMed]
- Ding, T.; Xu, J.; Zhang, Y.; Guo, R.P.; Wu, W.C.; Zhang, S.D.; Qian, C.N.; Zheng, L. Endothelium-coated tumor clusters are associated with poor prognosis and micrometastasis of hepatocellular carcinoma after resection. Cancer 2011, 117, 4878–4889. [Google Scholar] [CrossRef]
- Krizhanovsky, V.; Yon, M.; Dickins, R.A.; Hearn, S.; Simon, J.; Miething, C.; Yee, H.; Zender, L.; Lowe, S.W. Senescence of activated stellate cells limits liver fibrosis. Cell 2008, 134, 657–667. [Google Scholar] [CrossRef]
- Ha, G.H.; Breuer, E.K. Mitotic Kinases and p53 Signaling. Biochem. Res. Int. 2012, 2012, 195903. [Google Scholar] [CrossRef]
- Bisteau, X.; Caldez, M.J.; Kaldis, P. The Complex Relationship between Liver Cancer and the Cell Cycle: A Story of Multiple Regulations. Cancers 2014, 6, 79–111. [Google Scholar] [CrossRef]
- Kay, J.; Thadhani, E.; Samson, L.; Engelward, B. Inflammation-induced DNA damage, mutations and cancer. DNA Repair 2019, 83, 102673. [Google Scholar] [CrossRef] [PubMed]
- Mei, J.; Wang, R.; Xia, D.; Yang, X.; Zhou, W.; Wang, H.; Liu, C. BRCA1 Is a Novel Prognostic Indicator and Associates with Immune Cell Infiltration in Hepatocellular Carcinoma. DNA Cell Biol. 2020, 39, 1838–1849. [Google Scholar] [CrossRef] [PubMed]
- Hou, Y.; Wang, X.; Wang, J.; Sun, X.; Liu, X.; Hu, H.; Fan, W.; Zhang, X.; Wu, D. Cyclin B1 acts as a tumor microenvironment-related cancer promoter and prognostic biomarker in hepatocellular carcinoma. J. Int. Med. Res. 2021, 49, 3000605211016265. [Google Scholar] [CrossRef] [PubMed]
- Hou, X.J.; Ye, F.; Li, X.Y.; Liu, W.T.; Jing, Y.Y.; Han, Z.P.; Wei, L.X. Immune response involved in liver damage and the activation of hepatic progenitor cells during liver tumorigenesis. Cell. Immunol. 2018, 326, 52–59. [Google Scholar] [CrossRef] [PubMed]
- Oh, I.S.; Park, S.H. Immune-mediated Liver Injury in Hepatitis B Virus Infection. Immune Netw. 2015, 15, 191–198. [Google Scholar] [CrossRef]
- Shin, E.C.; Sung, P.S.; Park, S.H. Immune responses and immunopathology in acute and chronic viral hepatitis. Nat. Rev. Immunol. 2016, 16, 509–523. [Google Scholar] [CrossRef]
- Chen, Y.; Wang, X.; Deng, X.; Zhang, Y.; Liao, R.; Li, Y.; Yang, H.; Chen, K. DNA Damage Repair Status Predicts Opposite Clinical Prognosis Immunotherapy and Non-Immunotherapy in Hepatocel-lular Carcinoma. Front. Immunol. 2021, 12, 676922. [Google Scholar] [CrossRef] [PubMed]
Publisher’s Note: MDPI stays neutral with regard to jurisdictional claims in published maps and institutional affiliations. |
© 2022 by the authors. Licensee MDPI, Basel, Switzerland. This article is an open access article distributed under the terms and conditions of the Creative Commons Attribution (CC BY) license (https://creativecommons.org/licenses/by/4.0/).