Article

The Prognostic Value of Liquid Biopsies for Benefit of Salvage Radiotherapy in Relapsed Oligometastatic Prostate Cancer

by
Natalia V. Bogdanova
1,†,
Hoda Radmanesh
1,†,
Dhanya Ramachandran
2,
Anne Caroline Knoechelmann
1,
Hans Christiansen
1,
Thorsten Derlin
3,
Christoph Alexander Joachim von Klot
4,
Roland Merten
1,*,‡ and
Christoph Henkenberens
1,‡
1
Department of Radiation Oncology, Hannover Medical School, 30625 Hannover, Germany
2
Gynecology Research Unit, Clinics of Obstetrics and Gynaecology, Hannover Medical School, 30625 Hannover, Germany
3
Department of Nuclear Medicine, Hannover Medical School, 30625 Hannover, Germany
4
Clinic for Urology, Hannover Medical School, 30625 Hannover, Germany
*
Author to whom correspondence should be addressed.
These authors contributed equally to this work.
Cancers 2022, 14(17), 4095; https://doi.org/10.3390/cancers14174095
Submission received: 16 July 2022 / Revised: 15 August 2022 / Accepted: 22 August 2022 / Published: 24 August 2022

Abstract

:

Simple Summary

Around 30% of patients with oligometastatic prostate cancer relapse will benefit from local PET/CT-guided ablative radiotherapy (RT) with improved progression-free and ADT (Androgene Deprivation Therapy)-free survivals. Therefore, there is an urgent need for predictive testing for therapeutic benefits prior to initiation. Various tests have already been established on tumor specimens for the prediction of prostate cancer’s behavior or therapy outcome. However, in imaging-proven relapse tumor tissue from the local recurrence or metastases is often not available. Hence, there is a need for a liquid biopsy-based testing. We aimed to assess the prognostic value of CTCs- associated mRNA and blood-derived RNA for the benefit of PSMA PET-guided salvage RT in oligometastatic prostate cancer relapses. Significant correlations were found between the relative transcript levels of several investigated genes and clinicopathological parameters. Furthermore, distinct “transcriptional signatures” were found in patients with temporary and long-term benefits from RT.

Abstract

To assess the prognostic value of “liquid biopsies” for the benefit of salvage RT in oligometastatic prostate cancer relapse, we enrolled 44 patients in the study between the years 2016 and 2020. All the patients were diagnosed as having an oligometastatic prostate cancer relapse on prostate-specific membrane antigen (PSMA)-targeted PET-CT and underwent irradiation at the Department of Radiotherapy at the Hannover Medical School. Tumor cells and total RNA, enriched from the liquid biopsies of patients, were processed for the subsequent quantification analysis of relative transcript levels in real-time PCR. In total, 54 gene transcripts known or suggested to be associated with prostate cancer or treatment outcome were prioritized for analysis. We found significant correlations between the relative transcript levels of several investigated genes and the Gleason score, PSA (prostate-specific antigen) value, or UICC stage (tumor node metastasis -TNM classification of malignant tumors from Union for International Cancer Control). Furthermore, a significant association of MTCO2, FOXM1, SREBF1, HOXB7, FDXR, and MTRNR transcript profiles was found with a temporary and/or long-term benefit from RT. Further studies on larger patients cohorts are necessary to prove our preliminary findings for establishing liquid biopsy tests as a predictive examination method prior to salvage RT.

1. Introduction

For the evaluation of the biological behavior and prognosis of a prostate carcinoma, the Gleason score [1], the Risk Group according to Epstein [2], and the tumor node metastasis (TNM) stage [3] have proven for decades. In recent years, molecular-genetic testing of tumor material has been shown to be an additional independent predictor [4,5]. A relapse after initial curative therapy of prostate cancer affects a significant number of patients and can be indicated biochemically by an increase in prostate-specific antigen (PSA). The level of the PSA value usually correlates with the tumor load. When later metastases or a local recurrence occur, in many cases, a genetically different tumor from the one at primary diagnosis is present [6]. While larger metastases would be accessible for a renewed biopsy, in the recurrence that is initially detected only biochemically, very small metastases are often present, which are practically inaccessible for biopsy. The localization of new tumor foci is very problematic if the PSA values are low. With the clinical introduction of prostate-specific membrane antigen ligand positron emission tomography (PSMA-ligand PET) it became possible to identify recurrences with a high diagnostic accuracy at an early stage and at low PSA values [7]. This is particularly true for lymph node recurrences [8]. In such a clinically common situation, interdisciplinary monitoring is initially carried out by durable palliative Androgene Deprivation Therapy (ADT), which is still the guideline, with or without adding docetaxel or bisphosphonates [9,10,11,12,13]. However, in this mostly oligometastatic situation, local PET/CT-guided ablative radiotherapy (RT) may represent a treatment option for some third of the patients that will profit with improved progression-free and ADT−free survival, although an RT benefit has not yet been demonstrated in prospective randomized trials. Therefore, there is an urgent need for predictive testing for a therapeutic benefit prior to the initiation of the RT of a recurrence detected in PSMA-PET. To date, no clear parameters have been identified to predict the outcome of PSMA-guided RT for oligorecurrence. Despite the defined clinical and imaging inclusion and exclusion criteria, the investigated collectives of the pre-PSMA-PET era are biologically so heterogeneous that it cannot be precisely predicted which patient will benefit greatly, which will benefit in the short to medium term, and which patients will not benefit. The most likely explanation is that current therapy concepts are based almost exclusively on the quantity of the recurrence (number of lesions). Molecular tumor biology has not yet been adequately correlated with modern imaging and the clinical course (including the therapeutic response) prospectively, since reliable molecular markers are missing in this oncological setting. Therefore, molecular hematogenous biomarkers are required that, in addition to the isolated local recurrence and the extensive polytopic metastasis, can measure an intermediate tumor stage between these “oncological poles” [14,15]. Ideally, such markers should be used with limited aggressiveness and metastatic capacity and should provide the possibility of evaluating the effectiveness of the therapy. The progression of the PSA value alone is not sufficient here. Although it reliably indicates both the failure after primary therapy and the further progress after relapse therapy, it cannot adequately predict which patients will benefit to what extent. PSA levels trigger diagnosis and treatment, but their use for predicting therapy outcomes is limited. Therefore, there is a need for biomarkers that are highly correlated with the clinical course and diagnostic imaging while measuring the aggression of the tumor disease as well as the therapy outcome. While a biopsy of the metastasis is often unavailable, the use of a “liquid biopsy”—analyzing blood-derived nucleic acids, which provide an overview of patients’ genetic background, or tumor cells, and tumor cell products in blood samples—might overcome these difficulties even for multiple metastases [16]. Thus, molecular characterization should not only quantitatively measure the number of circulating tumor cells (CTCs) in blood but also qualitatively characterize the “landscape” of these cells, for instance, by the expression of PSMA/PSA on the CTCs’ surface and tumor cell-associated mRNA. The intrinsic germline features of patients also play a very crucial role here. We aimed to assess the prognostic value of “liquid biopsies” (CTC-associated mRNA and blood-derived RNA) for the benefit of PSMA PET-guided salvage RT in oligometastatic prostate cancer relapse.

2. Materials and Methods

2.1. Study Design and Patients Selection Criteria

The protocol was reviewed and approved by the Hannover Medical School Institutional Ethics Committee Board (ethic vote no. 8265_BO_K_2021). Informed written consent was obtained from each patient prior to sample collection. Patients were informed that the results of the study may be published in scientific journals and presented at medical meetings and can be made available for other researchers to use in other research projects, but that the information that directly identifies any person would not be used.
All enrolled patients had prostatectomy or completed definitive RT (76 Gy in 38 Fractions or 60 Gy in 20 Fractions) with a curative intent for a primarily regionally localized prostate carcinoma and were admitted to the Department of Radiation Oncology at Hannover Medical School for follow-up with increasing PSA levels between the years 2016 and 2020. Patients underwent PSMA-targeted PET-CT and were diagnosed as having oligometastatic disease. Patients were selected for salvage RT with a maximum number of 4 PSMA-positive lesions, including local recurrence, pelvic lymph node metastasis, or distant metastasis. All detected lesions were irradiated. Various doses and fractionations were used as part of routine clinical treatment. Forty-four patients gave informed consent for a single sample of 15 mL of venous blood before start of RT. Blood sampling was successful for 43 patients. Median follow-up of 14.8 months was available for all patients. Upon acquiring clinical data for follow-up, we found that 13 patients additionally received ADT concurrent to RT; thus, the efficacy of RT could not be determined with certainty for these patients. Thus, statistical analysis of RT benefit was also performed with the exclusion of these patients. Acute and chronic toxicity follow-ups with PSA-determination every three months and questioning of further disease progression were performed as part of routine clinical care. The initial PSA value at the time of first diagnosis (iPSA) was 12.15 ng/mL (range 2.6–40.43 ng/mL). The PSA doubling time after primary treatment until recurrence was 22 months on average (range 2–61 months). PSA at the time of PSMA-PET-CT was 2.2 ng/mL on average (range 0.09–64 ng/mL). Gleason sum averaged 7.6 (range 6–9). T-stage was on average 2.5 (range 1–4). A total of 5/43 (11.6%) of patients had metastases to regional lymph nodes at primary therapy (N1), whereas 38/43 (88.4%) had none (N0). A total of 13/43 (30%) had no remission after RT of all PET-detected recurrences, 25/43 (58%) had remission that remained stable for 4–12 months, and 5/43 (12%) had remission that lasted longer than 12 months. The time to progression (TTP) was calculated from the start of RT until PSA increased or imaging evidence of new metastases occurred. For this cohort, TTP was 7.1 months on average with a median TTP of 6 months (range 3–19 months). Clinical characteristics of the patients are summarized in Table 1.

2.2. Gene Panel Development

We reviewed published data for gene expression profiles or gene mutations corresponding to prostate cancer. Genes known or suggested to be associated with disease or treatment outcome were browsed on NCBI (including GEO—Gene Expression Omnibus) (https://www.ncbi.nlm.nih.gov/geo/), COSMIC (https://cancer.sanger.ac.uk/cosmic), TCGA (The Cancer Genome Atlas) (https://www.cancer.gov/about-nci/organization/ccg/research/structural-genomics/tcga), and GENT (Gene Expression database of Normal and Tumor tissues, http://gent2.appex.kr/gent2/) databases, status as of march 2020.
Using QIAGEN Ingenuity Pathway Analysis and STRING database, the best candidates from the most representative (highly significant) signaling pathways for the test panel were prioritized. In total, 54 candidates were selected for our study (Figure 1, lower panel).

2.3. Samples Collection and Processing

Since liquid biopsies are relatively stable in EDTA tubes for up to 12 h before processing [17] and since our study is monocentric at this stage with no need for long storage, whole blood samples for each patient were collected in two 10-mL EDTA monovettes and immediately handled. Whole blood from one 10-mL EDTA monovette was used for isolation of CTCs (Figure 1, upper panel). Two commercial kits were employed in parallel: AdnaTest Prostate Cancer Select/Detect (Qiagen, Hilden, The Netherlands), which recognizes PSMA, PSA, and EGFR (with beta-Actin included as a control), and Dynabeads™ Epithelial Enrich Kit (EpCAM+, Thermo Fisher Scientific, Waltham, MA, USA). CTCs, isolated by Dynabeads™, were processed by Dynabeads™ mRNA DIRECT™ Purification Kit. CTCs, isolated by the AdnaTest Select, were processed by AdnaTest Prostate Cancer Detect following the manufacturer’s instructions, with minimal changes: the initial washing step was performed with PBS + 0.05% bovine serum albumin, which reduced the loss of magnetic beads to plastic surfaces [18]. After direct amplification (AdnaTest), the samples were loaded on a 2% agarose gel and semi-quantified. The method used is based on ImageJ gel analysis (ImageJ v.1.8.0), which routinely quantifies the density of the bands (the ImageJ users guide can be viewed at: https://imagej.nih.gov/ij/docs/guide/index.html, protocol used was modified from following tutorial: https://www.unige.ch/medecine/bioimaging/files/2014/1208/6025/GelAnalysis.pdf, and [19]). Our protocol enables the relative quantification of PCR product bands of interest (PSMA, PSA, and EGFR) normalized to the loading-control band (ACTB) as well as to the standard sample (positive control, provided by the manufacturer). The final quantification reflects the relative amounts as fold-changes in relation to the standard. The manufacturer defined the presence of CTCs as any one of PSMA, PSA, or EGFR expressions.
PSA positivity is assumed as successful detection of CTCs, as described in [20,21]. Thus, upon isolation by Dynabeads™ and cDNA synthesis by SuperScript™ IV VILO™ (Thermo Fisher Scientific), CTCs were identified through cytokeratin 19 (which belongs to the key components of intermediate fibers of the cytoskeleton in epithelial cells and is expressed in normal epithelial cells, epithelial tumors, and metastatic cells [22]) and KLK-3-PSA positivity in SYBR-Green qRT-PCR (quantitative Real-time PCR). Further, qRT-PCR analysis (TaqMan method) of androgen receptor (AR) and AR splice variants (AR.V3, AR.V7, AR.V9, and AR.V12- AR.V567es) was performed.
From the second 10-mL EDTA monovette, 3 mL of whole blood was aliquoted in 0.5 mL volumes and stored at −80 °C. The rest of the blood was used for plasma isolation through Ficoll density gradient. Plasma was aliquoted in 0.5 mL volumes and stored at −80 °C. Any remaining blood or plasma aliquots were submitted to the internal Biobank of Hannover Medical School for long-term storage. For isolation of total RNA from blood specimens, RiboPure™ RNA Purification Kit (ThermoScientific) was used according to the manufacturer’s instructions. Isolated biological samples were processed with SuperScript™ IV VILO™ for cDNA synthesis and the generated cDNAs were utilized for high-throughput microfluidic qRT-PCR on the Biomark HD platform (Fluidigm, South San Francisco, CA, USA) and TaqMan or SYBR-Green reactions.

2.4. Quantitative Real-Time PCR (qRT-PCR)

We performed pre-amplification of all transcripts in order to increase the available amount of cDNA template per reaction and to enhance the detection of the target transcripts for qRT-PCR analysis via SYBR-Green, TaqMan, or microfluidic techniques. All experiments included four measurements (quadruplicates) for each sample and negative cDNA-control, as well as water controls. A total of up to 40 ng of RNA was used for cDNA synthesis followed by 10 cycles of pre-amplification reaction. SsoAdvanced™ PreAmp Supermix (BioRad, Hercules, CA, USA) was used (according to the manufacturer’s instructions) with a pool containing all primers investigated by SYBR-Green and TaqMan methods, at a final concentration of 500 nM each.
SYBR-Green qPCR reactions were performed using appropriate PCR assays along with the SsoAdvanced Universal SYBR Green Supermix (BioRad) and the following PCR protocol: 95 °C × 10 min, 95 °C × 15 s, and 60 °C × 60 s for 45 cycles, followed by melting curve analysis.
TaqMan qPCR reactions were performed using appropriate PCR assays along with the TaqMan Fast Advanced Master Mix (ThermoFisher Scientific, Waltham, MA, USA) using the following protocol: 95 °C × 10 min, 95 °C × 15 s, and 60 °C × 60 s for 45 cycles.
SYBR-Green and TaqMan approaches were carried out on the CFX384 Touch Real-Time PCR Detection System (BioRad), with a reaction volume of 10 ul including 1.5 ul cDNA (after pre-amplification and two-fold dilution) per reaction.
In a nanofluidic automated real-time PCR system (Fluidigm), based on microfluidic technology, dynamic arrays of integrated fluidic circuits (IFCs) were used. IFCs possess special controlled valves and interconnected channels, which enables an automatic mix of biological samples and reagents in a controlled manner. We used a dynamic array for qPCR, in which the chip format allows for 9216 PCR reactions (96.96 chip format; 96 samples × 96 assays) in a single qPCR run (https://www.fluidigm.com/),). This cost-effective and time-saving technique reduces the reaction volume to 10 nL and requires 10 cycles of sample pre-amplification, which were performed using the Preamp Master Mix (Fluidigm) and a pool of 34 Delta Gene™ assays (Fluidigm) representing all investigated gene transcripts (except housekeepers) at a final concentration of 500 nM each. Pre-amplified cDNA samples were cleaned with an exonuclease I reaction (New England Biolabs, Ipswich, MA, USA) and were diluted two-fold prior to loading onto the chip, as per manufacturer’s recommendations (PN 68000088 N1). The qRT-PCR run was performed for 45 cycles as per manufacturer’s instructions (Protocol name: GE Fast 96 × 96 PCR + Melt v2.pcl). ACTB, B2M, GAPDH HPRT1, MRPL19, RPL13A, and RPLP0 gene transcripts were used as housekeepers. All used primers/probes are available on request.

2.5. Data Processing and Statistical Evaluations

A gene was noted to be expressed when at least three replicates of each sample (pipetted in quadruplicates) revealed detectable Ct (cycle threshold) values (≤40). Obtained qPCR results were analyzed in QBase+ software (version 3.3, Biogazelle, Gent, Belgium), whose algorithms enable the processing of data according to international guidelines (https://www.qbaseplus.com/). QBase+ software utilizes delta Ct method for the normalization to the reference genes (housekeepers) and enables the performance of this mathematical operation for multiple housekeeper genes at once followed by a calculation of the amplification efficiencies. Results were exported after logarithmic-transformation, including standard errors, and were utilized for further statistical analysis.
We used GraphPad Prism Software for statistical calculations (version 9.4.0; GraphPad, San Diego, CA, USA). In order to compare differences between two groups, a student’s t-test was performed. For multiple comparisons between consecutive groups, an ANOVA was performed followed by a linear trend test. As indicated, regression analysis or chi square test (OpenEpi—2 × 2 Table Statistics, source: Dean AG, Sullivan KM, Soe MM. OpenEpi: Open Source Epidemiologic Statistics for Public Health, Version. www.OpenEpi.com, updated 2013/04/06) was performed for assessing the correlations between clinico-pathological parameters. Pearson’s correlation analysis for RT benefit was performed with a p value < 0.05 defined as statistically significant. For evaluation of therapeutic benefit, patients with decreased or stable PSA-levels in serum and no progress in imaging longer than 12 months were defined as high responders (benefit level 2). Patients with decreased or stable PSA-levels and no progress in imaging shorter than 12 months were defined as low responders (benefit level 1). All patients with increased PSA-levels in early follow up or with progress in imaging were defined as non-responders (benefit level 0).

3. Results

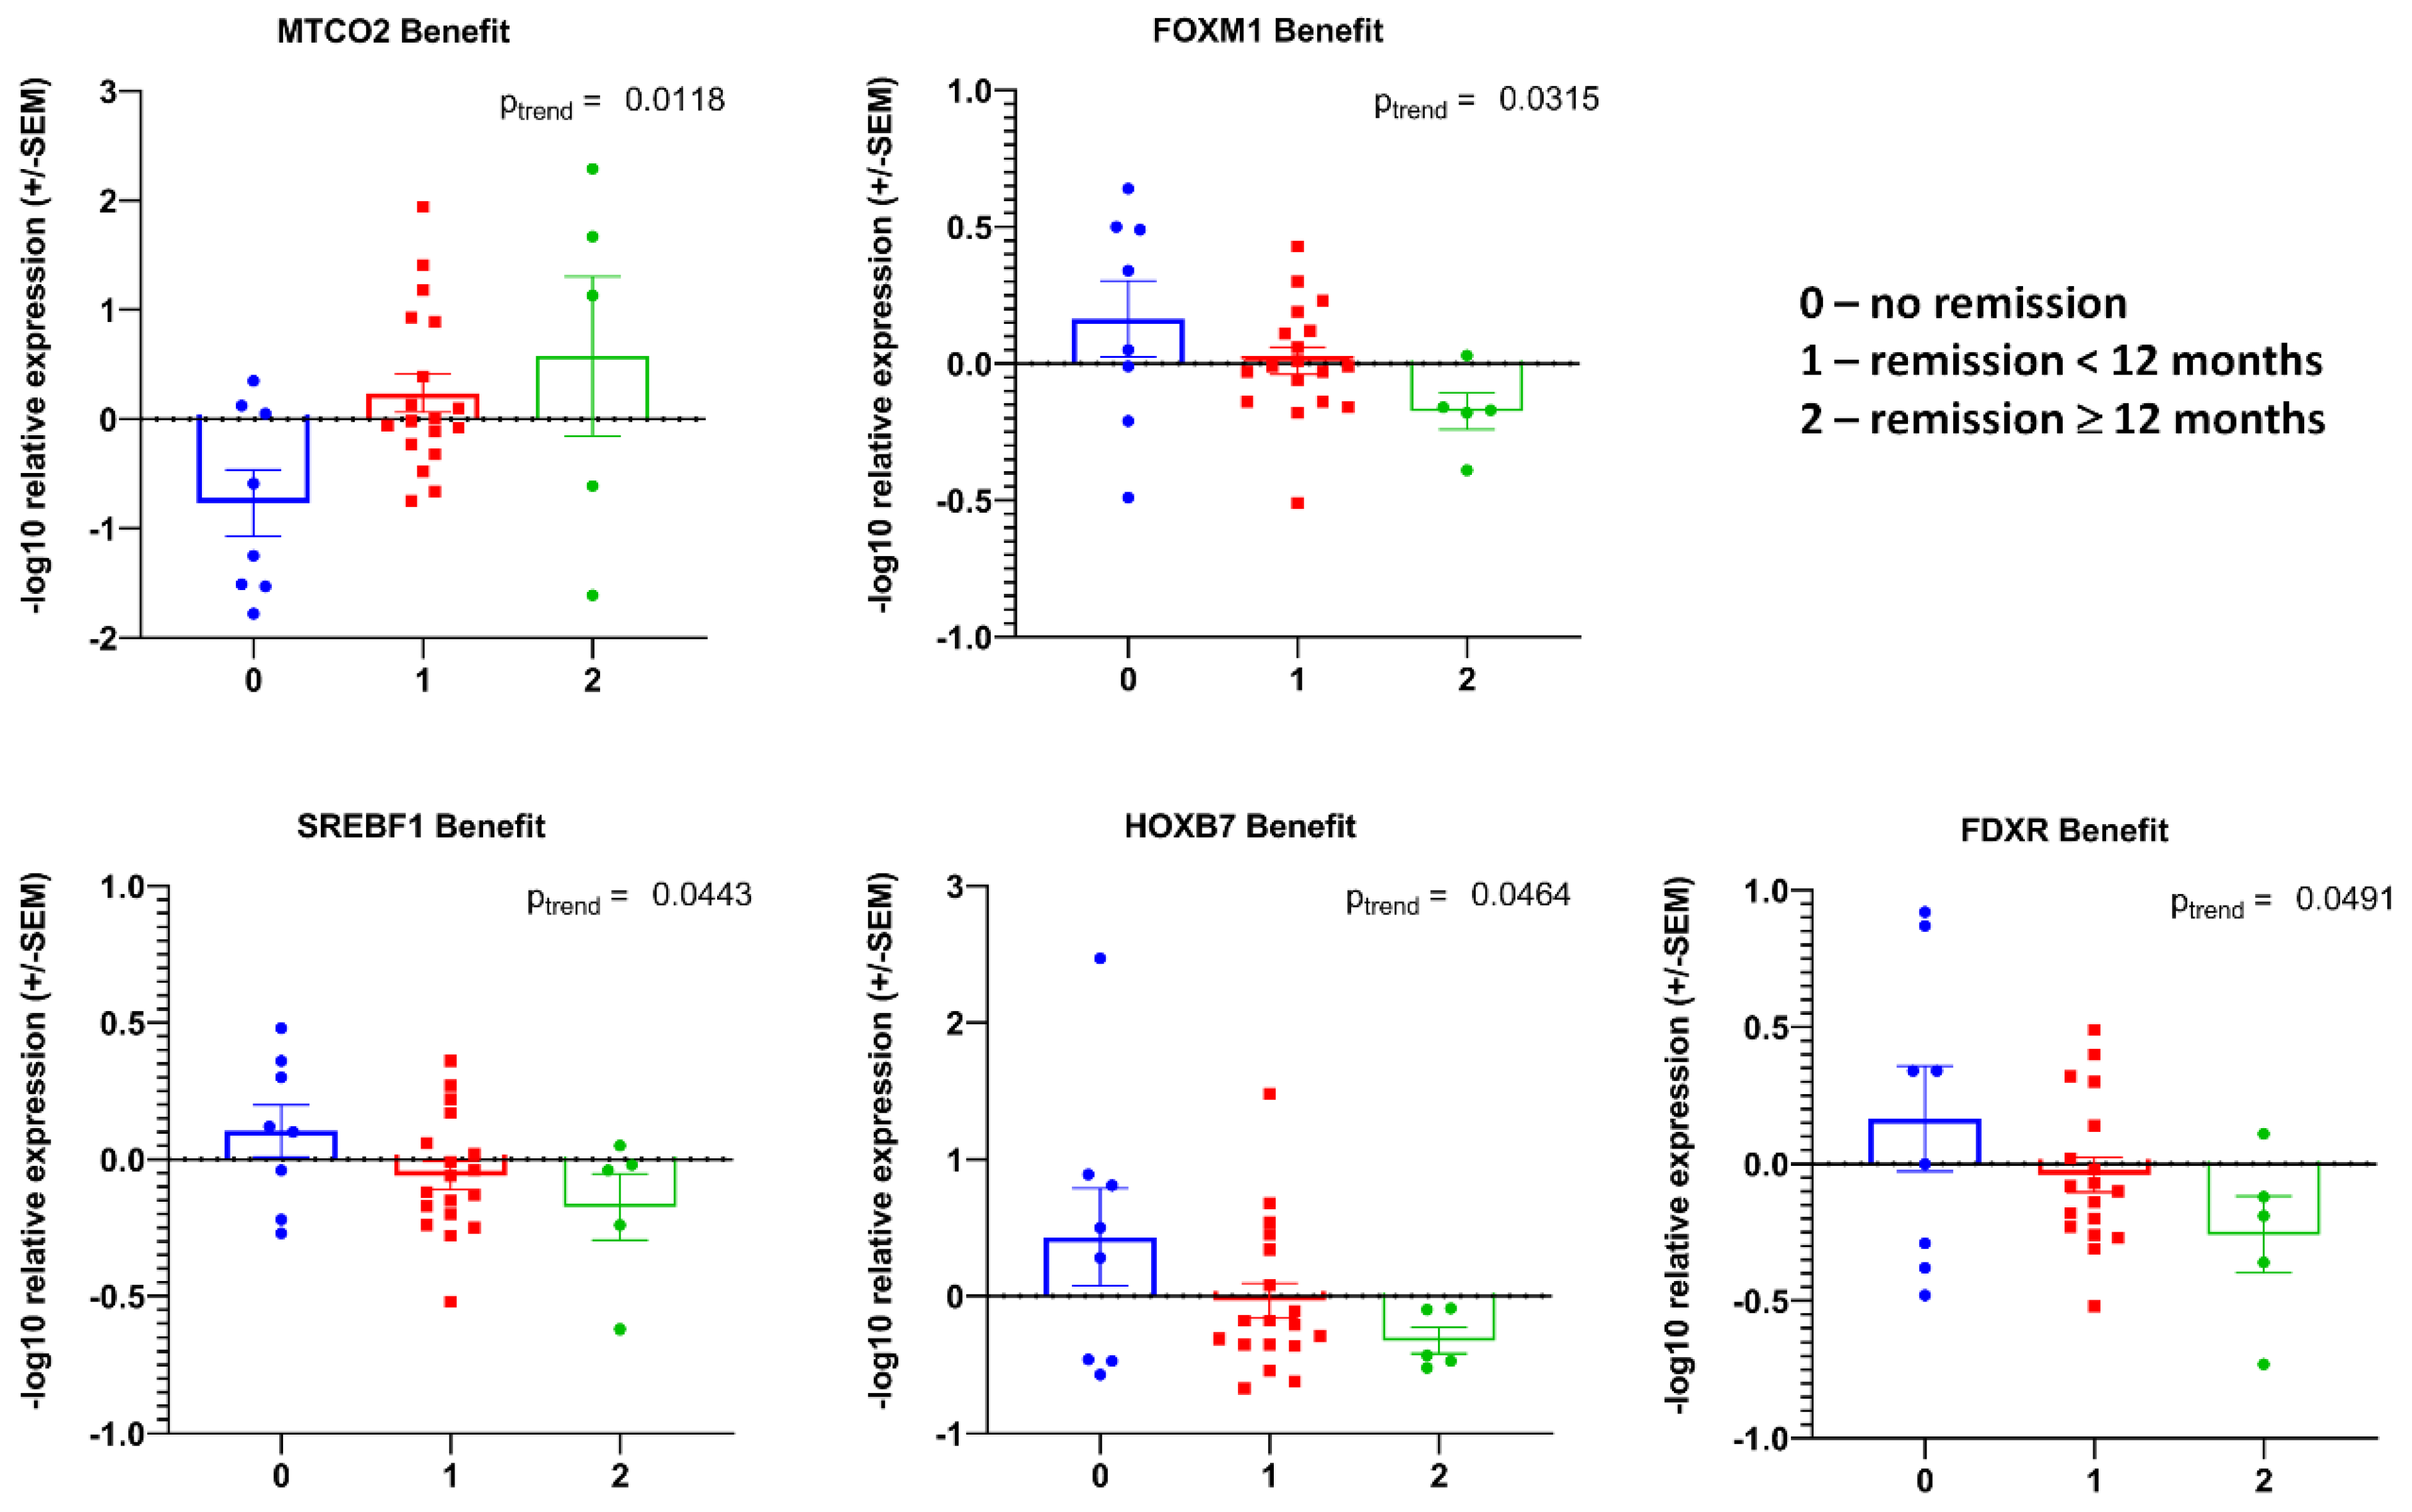
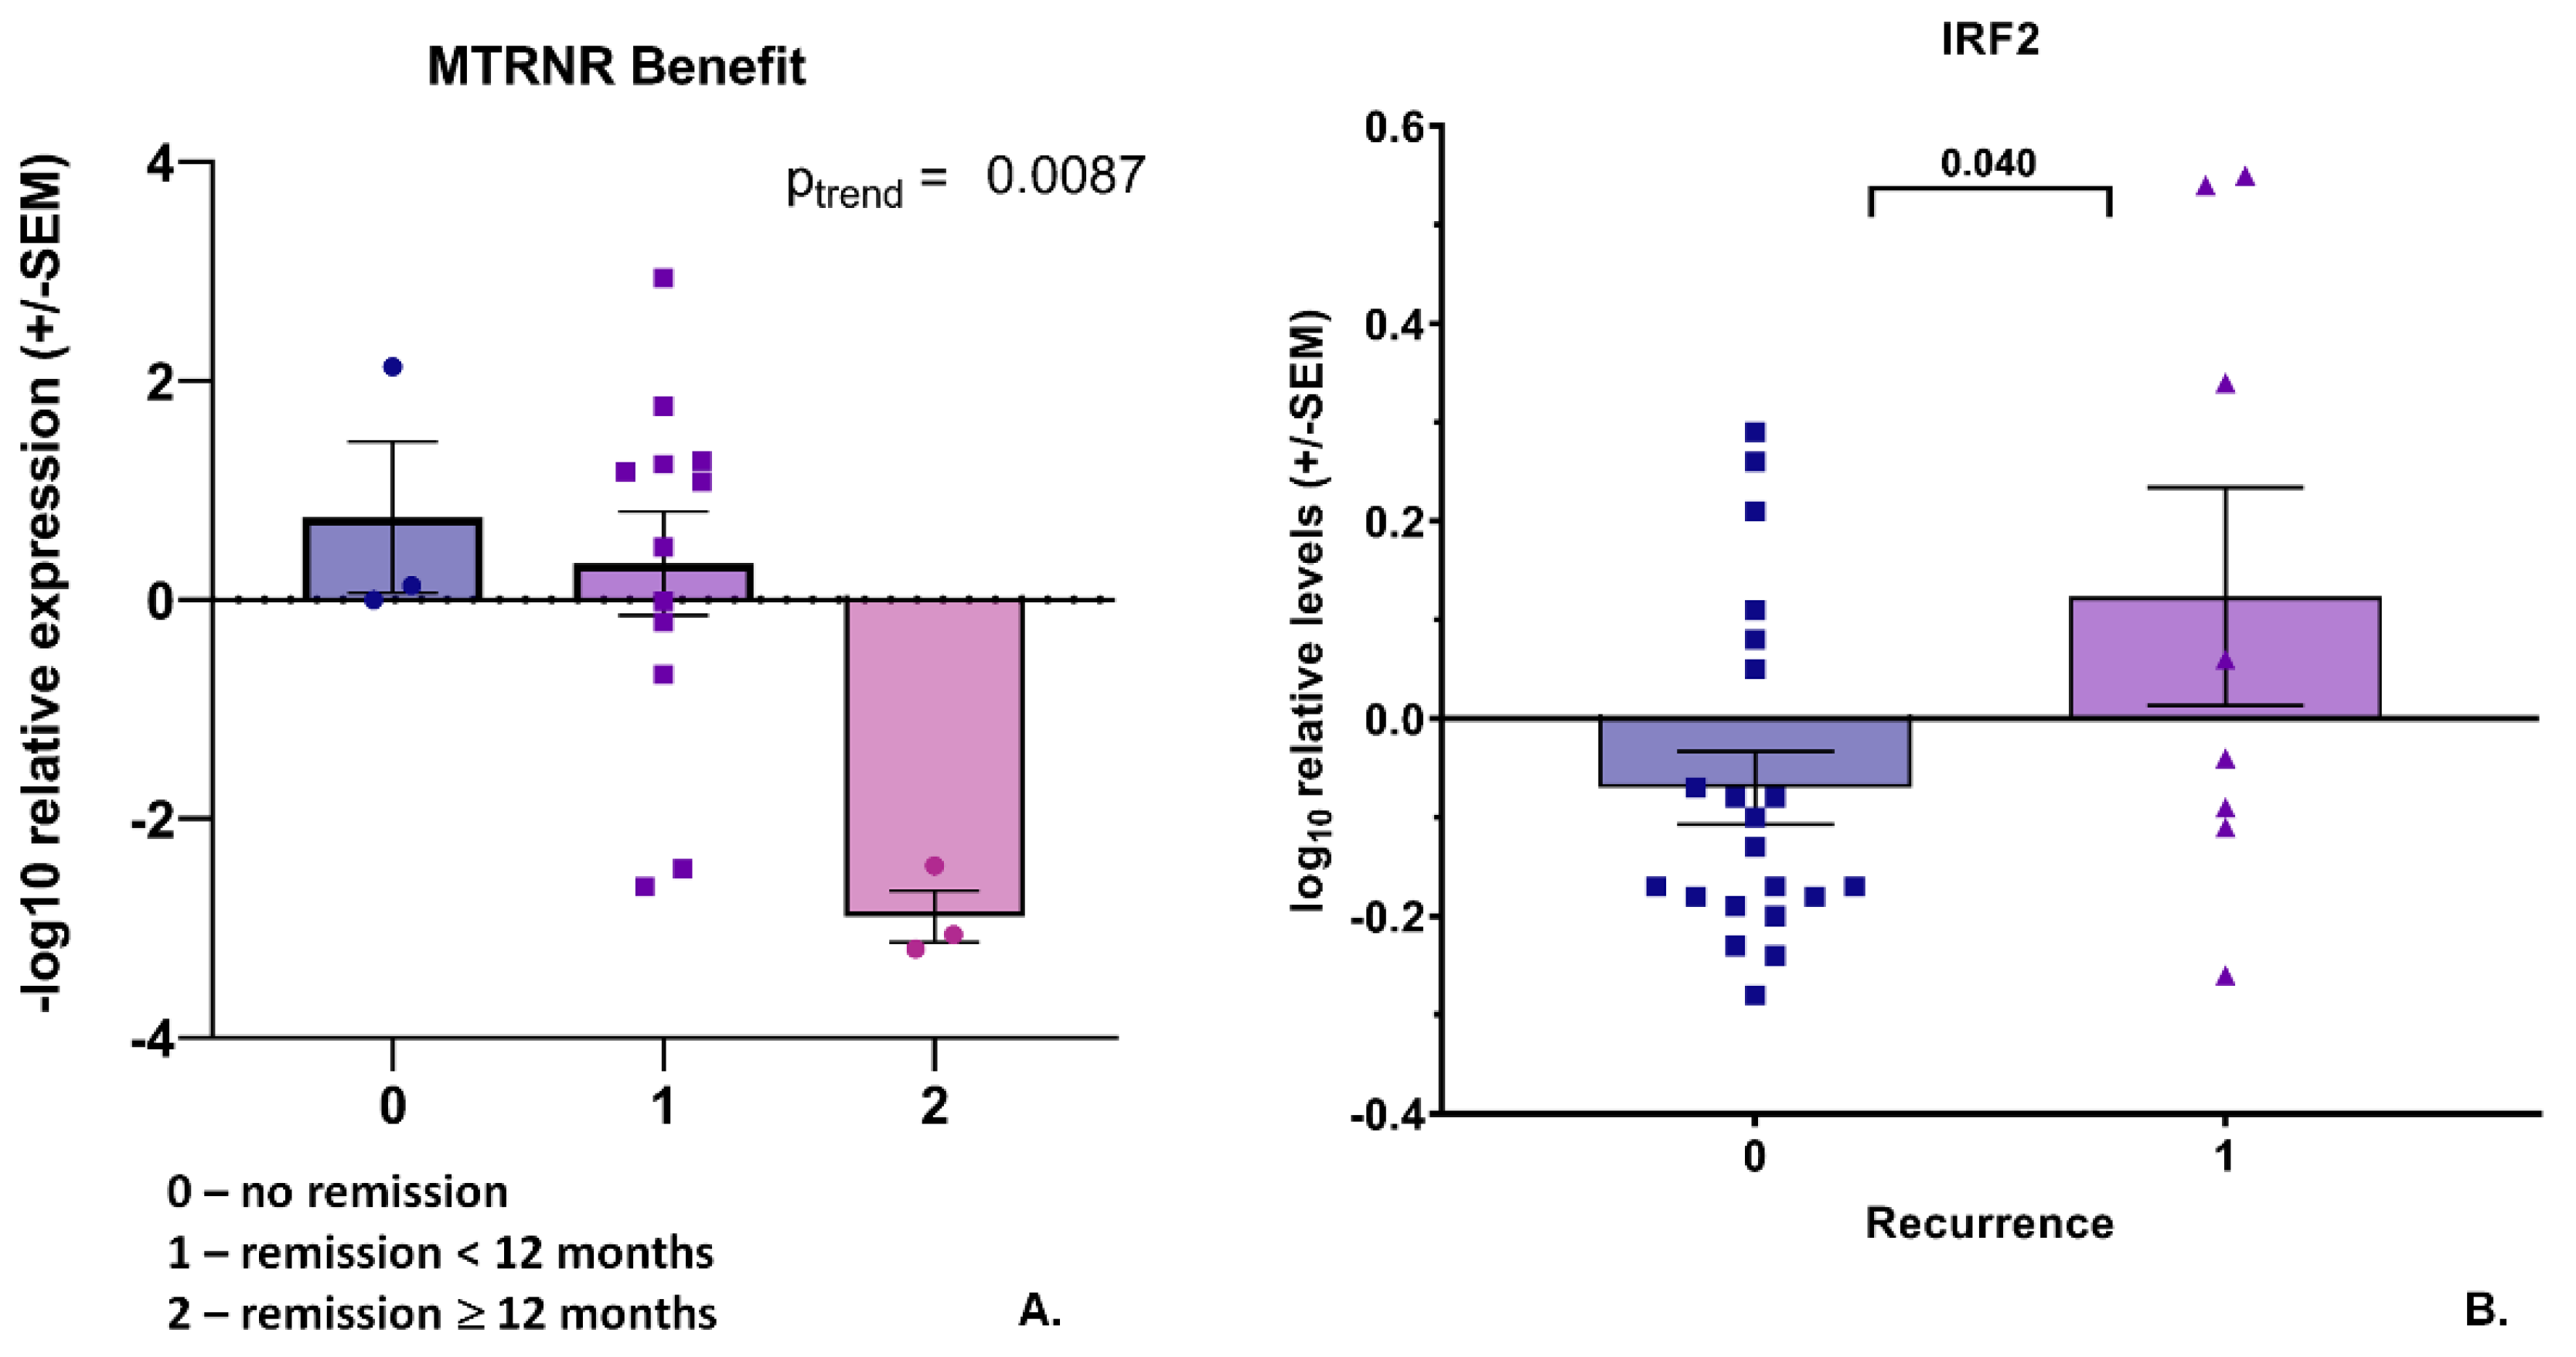
3.1. Transcript Expression of Patient-Derived CTCs—Associated mRNA

In total, 43 samples were analyzed (Figure 2). CTCs were detected in 42 samples (97.7%), as those were positive for PSA. No EGFR was detected, and 7/42 (16.7%) samples were positive for PSMA. Quantitative RT-PCR showed that AR-FL was expressed in 17 out of 42 samples (40.5%), AR.V7 was expressed in 33 samples (78.6%), and AR.V567es (three independent primer pairs: AR.V12, AR.V567-1, and AR.V567-2) was expressed in 38–40 samples (88.1–95.2%). The variability in the estimation of AR-V567es that we found has been described previously [20]. In addition, 39 out of 42 samples expressed AR.V3 (92.9%) and 41 (97.6%) samples expressed AR.V9. At least one ARV was found in all CTC-positive samples and 40 samples (95.2%) expressed both AR.V7 and AR.V567es, which are considered the most relevant variants in the ARV-dependent mechanisms of resistance to ADT [23].
A known co-expression of AR splice variants (e.g., AR.V3, AR.V7, and AR.V9) was noticeable in our settings and we performed correlation analyses for all the investigated ARVs (Figure 3, upper panel). Since 12 patients in our cohort received ADT concurrently to RT, we performed analyses not only on the whole cohort but also within two groups, patients with and without ADT (ADT+ and ADT−, respectively), and observed significant correlations with the clinical variables (Figure 3, lower panel).
The PSA transcript levels were found to correlate with the PSA values at PSMA-PET in the whole cohort (Pearson’s R = −0.33, p = 0.03), iPSA value in the ADT− patients (Pearson’s R = −0.64, p = 0.0004), and the number of active loci (Pearson’s R = −0.58, p = 0.04) or Gleason score at initial diagnosis (Pearson’s R = 0.56, p = 0.04) in the ADT+ patients. The PSA values at PSMA-PET were correlated with PSMA-positive lesions (number of active loci) in the whole cohort (Pearson’s R = 0.51, p = 0.0005), in the ADT− patients (Pearson’s R = 0.51, p = 0.004) and ADT+ patients (Pearson’s R = 0.56, p = 0.05), and with peak uptake in the whole cohort (Pearson’s R = 0.84, p = 1.8 × 10⁻¹¹) or in the ADT+ patients (Pearson’s R = 0.86, p = 0.0004). Further, the peak uptake in the whole cohort was found to correlate with the number of PSMA-positive lesions (Pearson’s R = 0.40, p = 0.01); the Gleason score at initial diagnosis was correlated with tumor relapse (Pearson’s R = 0.38, p = 0.05) in the ADT− cohort or with the number of positive lesions in the ADT+ patients (Pearson’s R = −0.56, p = 0.05). The known positive association between AR.V7 expression and ADT treatment did not manifest in our cohort, since AR.V7 expression was not associated with a history of treatment, but it was found to correlate with the PSA doubling time in the patients who received ADT (Figure 3, ADT+ Group, lower panel, Pearson’s R = 0.68, p = 0.02). AR.V576es was found to correlate overall (all patients included) with the TNM score (Pearson’s R = 0.33, p = 0.05) and PSA transcript expression in the CTCs (Pearson’s R = 0.39, p = 0.001). Further, we observed a highly significant association of TMPRSS2 transcript expression, which is commonly used as a readout for androgen activation, with the use of ADT (Mantel–Haenszel chi square 2-tailed test p-value = 0.008). TMPRSS2 transcript expression was additionally found to correlate with the Gleason score at initial diagnosis (Figure 3, Pearson’s R = 0.82, p = 0.007) and AR.V7 transcript expression (Pearson’s R = −0.67, p = 0.05) overall. Further, AR.V9 transcript expression was found to correlate with PSA transcript expression in the whole cohort (Pearson’s R = 0.43 p = 0.005) and in the ADT− group (Pearson’s R = 0.43, p = 0.03), as well as with the Gleason score in the ADT+ group (Pearson’s R = 0.60, p = 0.03). AR-FL transcript expression was found to correlate with PSMA transcript expression in the ADT− patients (Pearson’s R = −0.74, p = 0.03). Although the expression of cytokeratin 19 should just represent tumor cells as cell type-specific epithelial markers, we found correlations with Gleason scores in the whole cohort (Pearson’s R = −0.35, p = 0.02) and with the TNM score in the ADT+ group (Pearson’s R = −0.78, p = 0.008). The only parameters observed to correlate with a RT benefit were the number of PSMA-positive lesions (Pearson’s R = −0.39, Pearson p = 0.01) in the whole investigated cohort and PSA value at PSMA-PET in the whole investigated cohort (Pearson’s R = −0.39, p = 0.009) and in the ADT− cohort (Pearson’s R = −0.49, p = 0.006). We found no significant difference for RT Benefit between ADT+ and ADT− patients (Mantel–Haenszel chi square 2-tailed test p-value = 0.37).

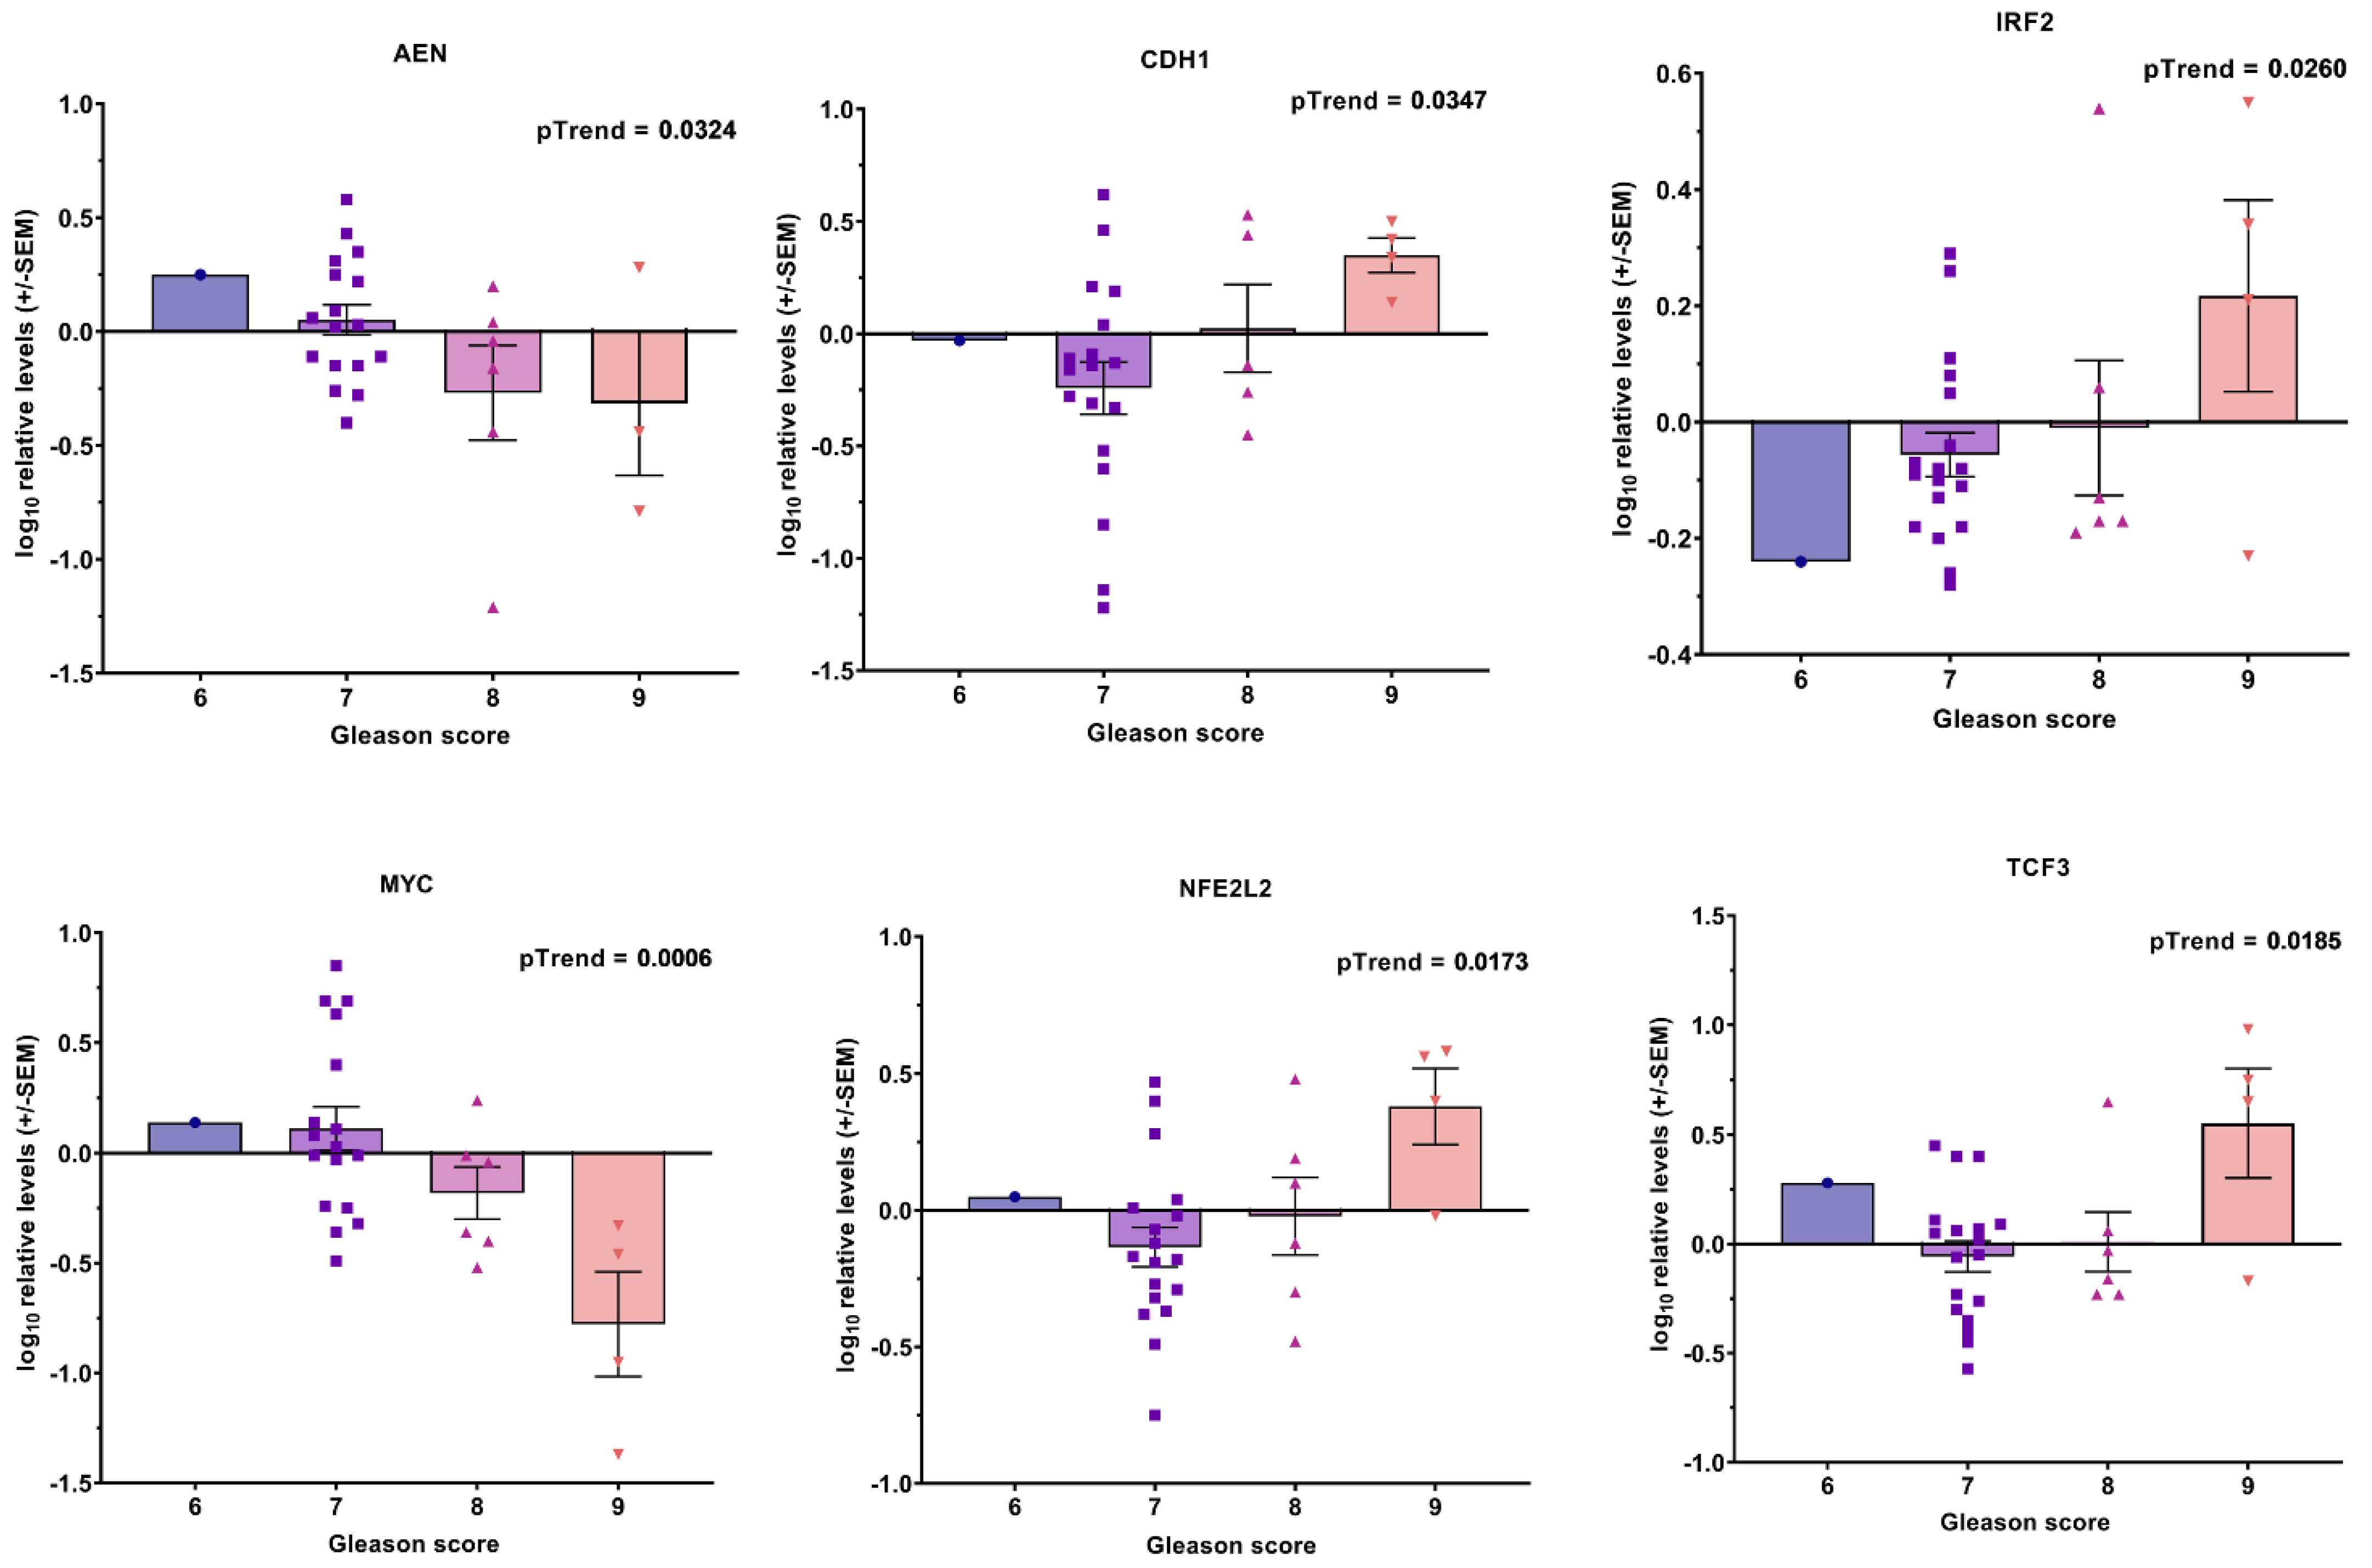
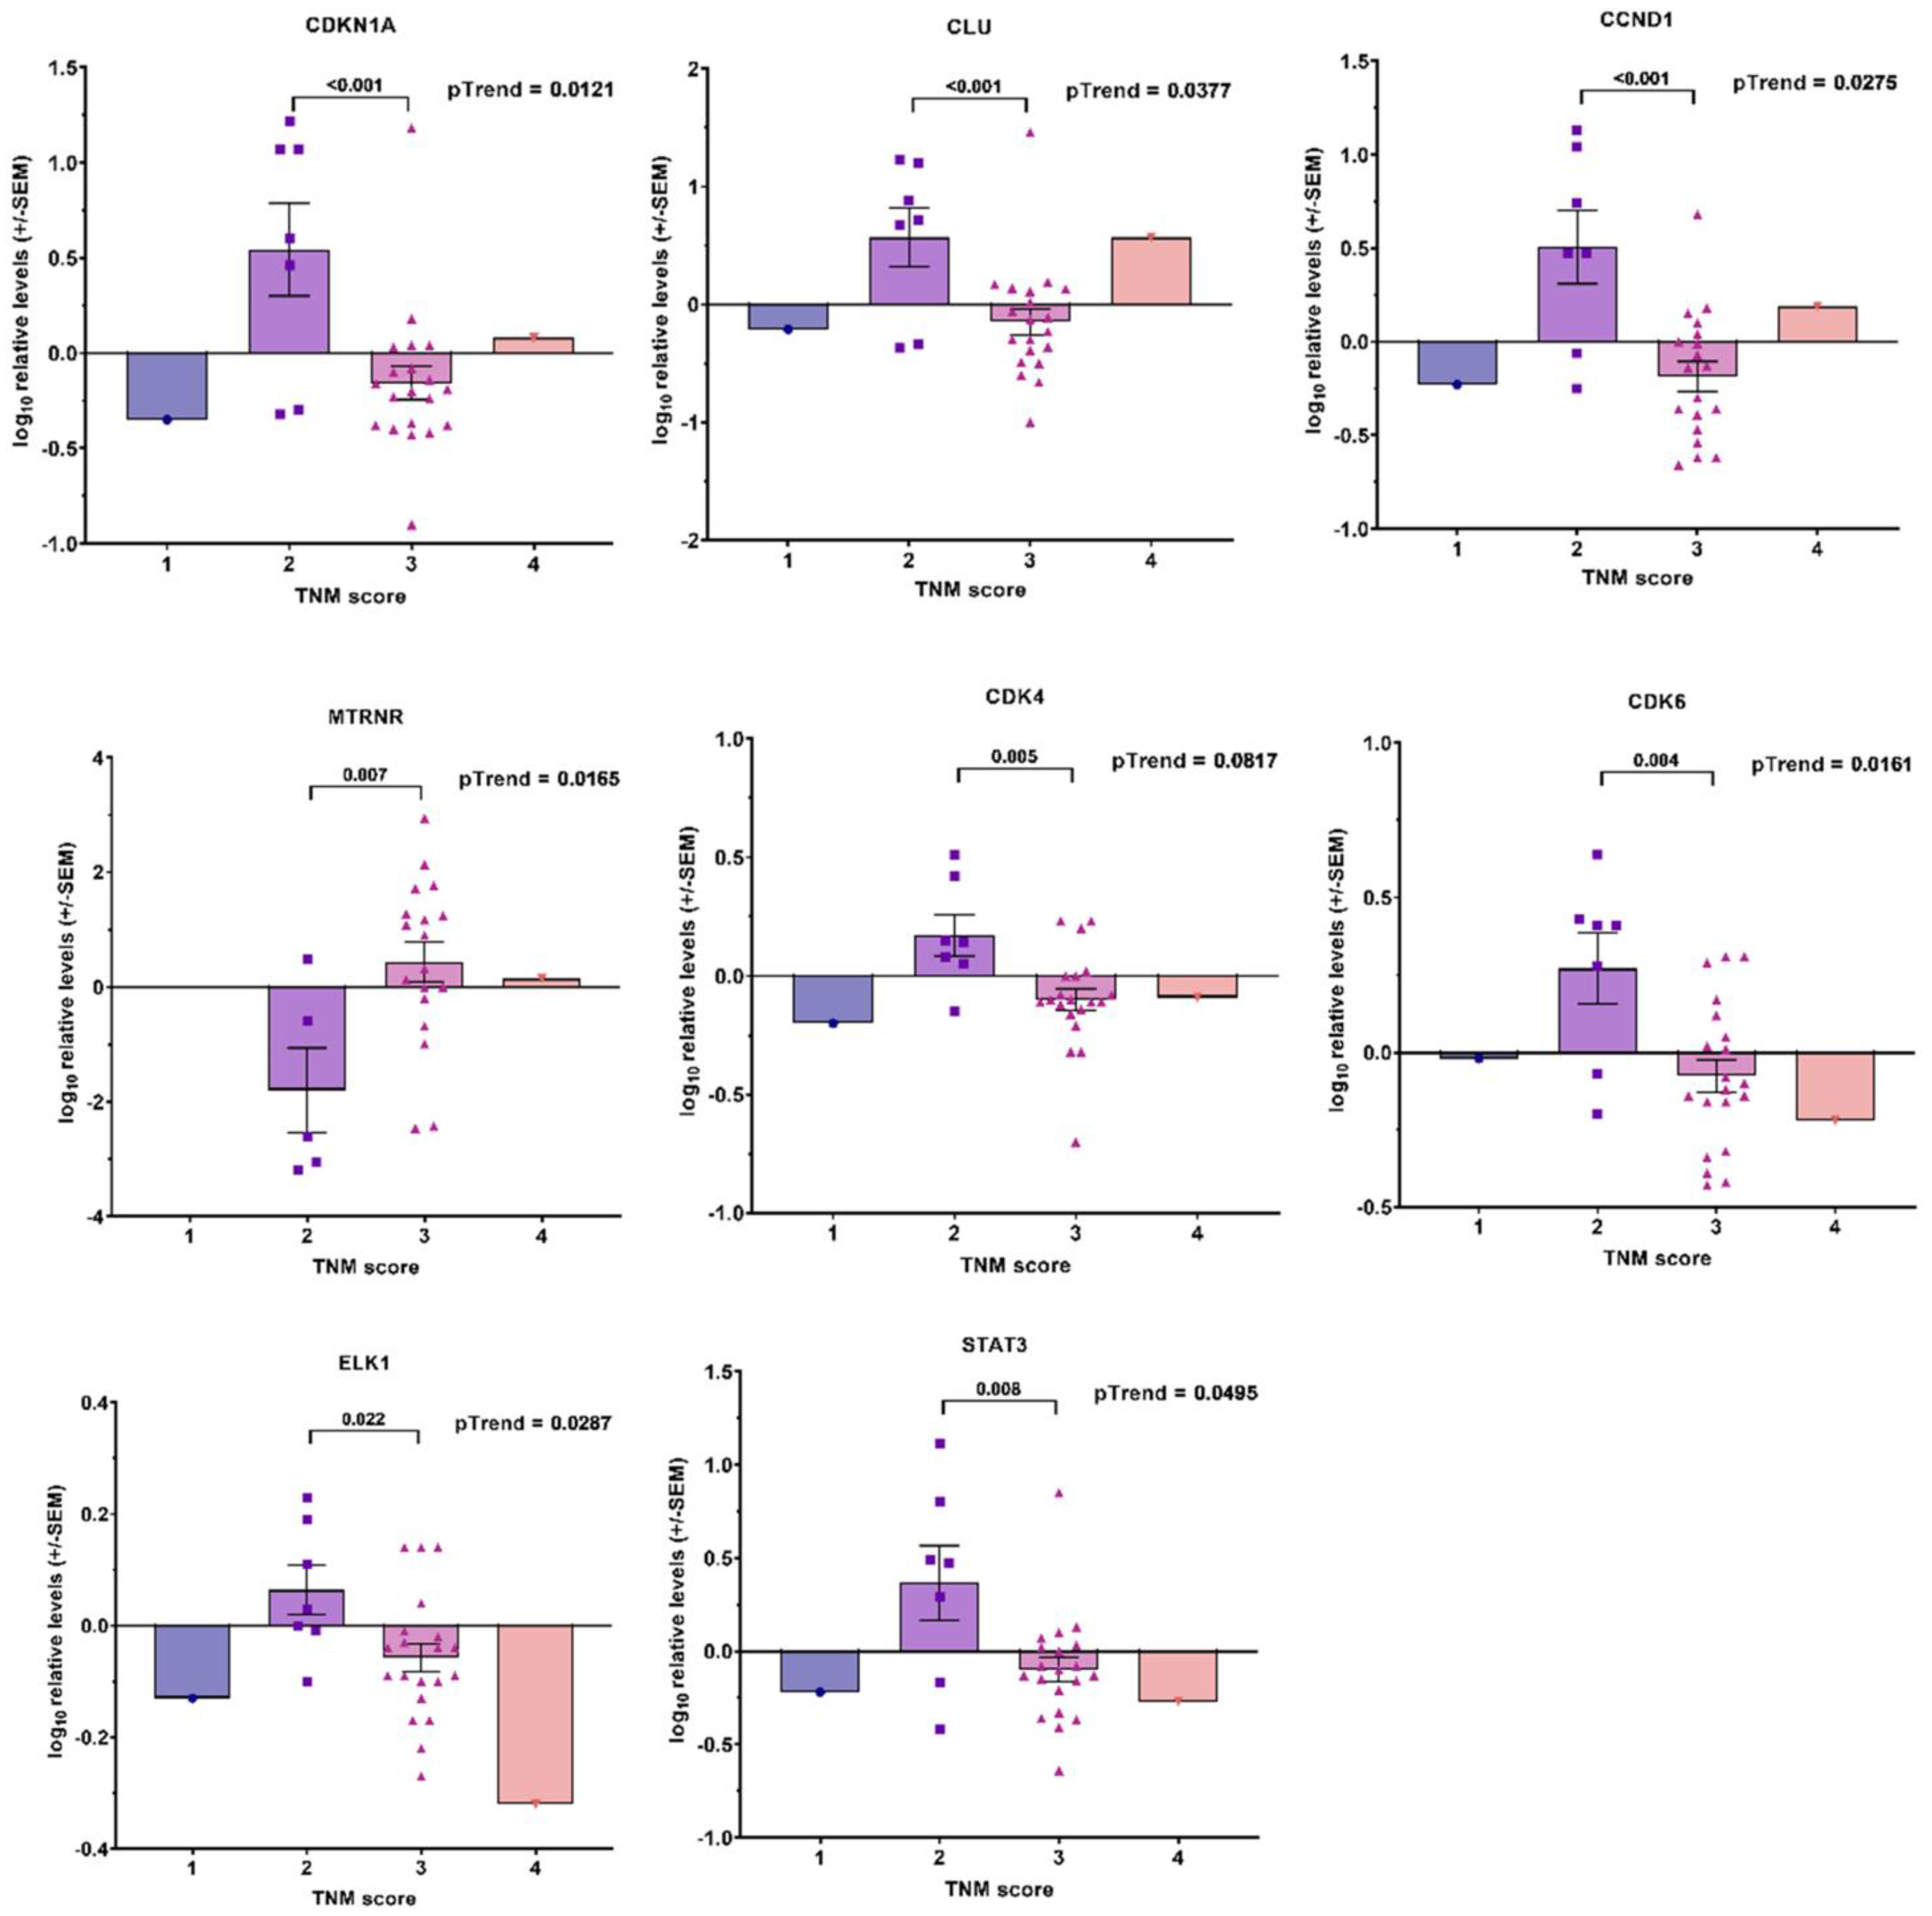
3.2. Transcript Expression in Blood-Derived mRNA

We investigated the expression of our pre-selected transcript panel (Figure 1, lower panel, set 2) in the total RNA from whole blood specimens in the investigated patient cohort. The expression levels of the analyzed transcripts were very heterogeneous, partly without a signal for some patients’ RNA samples, although the housekeeper gene transcripts revealed detectable Ct values. We found some significant associations: nine transcripts (AEN, ATM, CDH1, HOXB7, IRF2, MT-RNR1, MYC, NFE2L2, and TMPRSS2) were associated with the Gleason score at the initial diagnosis after a linear trend test (Figure A1), two (CD4 and CDKN1A) with the TNM score (Figure A2A), and one (IRF2) with disease recurrence (Figure A2B). A regression analysis revealed that MTP-ATP6 transcript levels correlate with iPSA value, KIF20A with peak uptake, and SIM2 with PSA doubling time (Figure A2C). The analysis for RT benefit disclosed that seven transcripts (MTCO2, ELK1, IRF2, MAPK4K, NFE2L2, ATM, and CDC25) were associated with disease remission (Figure 4). In the linear trend analysis, except for MTCO2, four other transcripts (FOXM1, SREBF1, HOXB, and FDXR) showed a correlation with RT benefit (Figure 5).
Although no significant difference was found regarding a RT Benefit in the ADT+ and ADT− patients (Mantel–Haenszel chi square 2-tailed p-value 0.26 or 0.99 for no benefit versus short remission or long-term over 12 month remission, respectively), we excluded patients with ADT from the analysis, since the success of salvage RT could not be clearly assessed for them. In this analysis, MT-RNR1 transcript levels were clearly associated with remission and IRF2 transcript levels with the recurrence of disease (Figure 6A,B, respectively).
Additionally, we found six transcripts (AEN, CDH1, IRF2, MYC, NFE2L2, and TCF3) correlated with the Gleason score in the linear trend analysis (Figure 7) and eight transcripts (CDKN1A, CLU, CCND1, MT-RNR1, CDK1, CDK6, ELK1, and STAT3) correlated with TNM (Figure 8); a further four transcripts (IGF1R, MAX, RAC1, and CD4) had significant differences between TNM2 and TNM3, but overall the trend was not significant (Figure A3).
Moreover, one transcript (ALAS1) was found to correlate with iPSA, two transcripts (AKT1 and CLU) were found to correlate with PSA value at PSMA-PET, and three (CDC25C, CTNNB1, and DDB2) with peak uptake (Figure 9).

4. Discussion

Treatment concepts in oncology are becoming more individualized, which necessitates the use of valid biomarkers for decision making. The biomarker used primarily to monitor any therapy response in prostate cancer is still PSA, which does not fully reflect the tumor burden, metastatic stage, or possible treatment benefit or failure. Molecular marker analysis carries prognostic performance to the next level. The importance of tumors’ genetic profiling for the prognosis of prostate cancer in treatment decisions or in monitoring therapy responses has already been demonstrated for primary therapy or for the salvage radiotherapy of the former prostate bed and for metastatic disease [4,5,24,25,26,27,28,29,30,31]. Especially in the metastatic stage of prostate cancer, the interest in using liquid biopsies such as CTCs or nucleic acids from peripheral blood is accumulating since the histology of small metastases is not always available due to a lack of tissue material, and because blood sampling can be easily performed with minimal intervention and invasion. Thus, liquid biopsies represent an attractive tool and a good alternative to tissue-based molecular profiling.
In the present study, we evaluated the usefulness of CTC-derived RNA and plasma-derived RNA for the molecular analysis of a pre-defined gene panel and its possible predictive performance for RT benefit in oligometastatic prostate cancer relapses. Although we have a heterogeneous patient cohort, as it is generally in clinical praxis, a number of the investigated transcripts—relative to other established clinical or PSMA-PET-based parameters—showed a superior predictive potential to identify patients with a better response to salvage RT of metastases.
The overall dropout rate for CTC-derived RNA in our study was under 3% since CTCs were undetectable in only one blood sample. We used a specific EpCAM-positive CTC population (as recommended by the FDA, U.S. Food and Drug Administration) and were successfully analyzed the occurrence of the AR splice variants, some of which may predict treatment strategies and/or affect the response to therapy. We found multiple correlations and associations of the investigated AR variants with each other and with histopathological parameters, such as the TNM score, the Gleason score, and the number of active loci or tumor relapses, which represent tumor features and are linked to the aggressiveness of the disease. Our results are in line with published studies focused on investigating the correlative value of ARV expression as clinical biomarkers with disease dynamics and progression [18,32,33,34,35,36]. Of note, we found variability in the estimation of AR-V567es in the CTCs from prostate cancer samples in the three different detection systems used in this study, similar to previous studies [20]. Therefore, any conclusions drawn from the correlations between AR-V567es expression and clinical responses should be treated with caution, since they may not fully reflect the biological situation.
One recent study demonstrates that beyond ARVs, a distinct transcriptional profile in the CTCs from liquid biopsies can serve as an independent prognostic marker in patients with metastatic prostate cancer [37]. Despite such promising data, CTCs are not yet accepted in clinical use. One possible reason may be the challenge of isolating CTCs efficiently and another that their prediction accuracy is potentially hampered by intra-patient tumor heterogeneity. Another potential method for screening for possible biomarkers in metastatic diseases is the use of blood-derived nucleic acids. Several studies have reported the detectability of potential therapy-response biomarkers in whole blood mRNA or cfRNA (cell-free RNA) from plasma [34,35,38]. The isolation of blood-derived nucleic acids is relatively easy compared to CTCs; however, this source does not discriminate well between “tumor” and “normal” cell-derived nucleic acids, mostly representing the intrinsic genomic pattern of patients, which is also very important, especially for exploring the therapy response. Thus, a simultaneous examination of multiple parameters or components in liquid biopsies may facilitate a broader understanding from which to construct a more comprehensive molecular profile.
High-throughput technologies and bioinformatics tools, widely used in screening biomarkers for cancer diagnosis, treatment, and prognosis, have played an important role in recent years in developing prognostic classifiers for the prediction of clinical outcomes in prostate cancer patients. Based on clinical features, genetics, transcripts’ expression, or epigenetic profiles in tumors, the tumor microenvironment, or blood-derived nucleic acids or CTCs, a number of useful biomarkers have been reported, but most published studies have focused on the prediction of the pathogenesis and prognosis of the disease [35,36,37,38,39,40,41,42,43,44,45,46,47]. With regard to the RT outcome, either clinical parameters or gene expression profiles in tumors, xenografts, or cell lines have been investigated with respect to predicting the sensitivity of prostate cancer to RT [31,48,49,50]. To the best of our knowledge, our study is the first to explore the prognostic value of “liquid biopsies” for the benefit of salvage RT in oligometastatic prostate cancer relapses.
Here, we expanded the concept of liquid biopsy on blood-derived mRNA transcripts and demonstrated the clinical value of these parameters beyond the known associations with PSA, the Gleason score, and tumor categories for predicting RT benefit in our investigated cohort. An analysis of the entire cohort revealed two clinical parameters to correlate with RT benefit: the PSA (a known biomarker used to monitor therapy responses) value in PSMA-PET and the number of PSMA-positive lesions.
Transcriptional profile combinations or defined “transcriptional signatures” were found to correlate with the Gleason score or TNM score in our study. Identifying differentially expressed transcripts stratified by the Gleason or TNM scores provides valuable data on tumors’ potential aggressiveness. Using this approach, a number of previous investigations have constructed prognostic gene expression profiles, associated with the Gleason score, relapse, and prostate cancer mortality [51,52,53,54]. In our study, nine of the investigated transcripts built a “transcriptional signature” for the Gleason score (Figure A1) and two for the TNM score in the whole cohort (Figure A2). When the patients were stratified by their ADT statuses, five of the “Gleason score transcripts” (AEN, CDH1, IRF2, MYC, and NFE2L2) and one of the “TNM score transcripts” (CDKN1A) were retained in the ADT− patients in the correlation analysis (Figure 7 and Figure 8, respectively). The same transcript—IRF2—remained associated with disease recurrence, giving credibility to our results and some diagnostic potential.
The expression patterns of a number of transcripts were correlated with different clinical variables, such as iPSA, PSA doubling time, peak uptake, or the PSA value at PSMA-PET, which was also linked to their diagnostic values. In the current study, it was important to determine a gene expression pattern that could provide prognostic information for salvage RT in oligometastatic prostate cancer relapse patients beyond the clinical and pathologic features. Distinct “transcriptional signatures” were found for patients in short-term (<12 months) or long-term (≥12 months) remission (Figure 4 and Figure 5). These results were statistically significant in the correlation analysis, making those transcript combinations good prognostic candidates. Patients with such profiles have a significantly better chance for remission after salvage RT of the metastases.
When the patients for whom the success of RT could not be clearly assessed (due to concurrent ADT during follow-up) were excluded, MT-RNR1 was found to be highly significantly correlated with RT benefit as the sole independent factor. An altered expression of this transcript had been previously observed in prostate cancer and colorectal tissues [55,56]. Of note, genetic variations in this region were found to act as prognostic markers for hepatocellular carcinoma and gastric cancer [57,58,59].
The results presented herein expanded the role of CTCs- or blood-derived RNAs and demonstrated their clinical value beyond cancer pathogenesis, providing benefits for diagnostic and/or prognostic biomarker development, as well as for improving therapeutic interventions. As examined in our study, multiple components of “liquid biopsy” provided a distinct molecular profile or “transcriptional signature” in the patients, who benefited from the salvage RT of prostate cancer metastases.
This study also has several limitations, namely, the number of patients enrolled in this study was limited, non-uniformly determined radiation doses were applied, and a number of patients received ADT in the follow-up; however, we were still able to demonstrate significant results.

5. Conclusions

In conclusion, our preliminary findings provide a pillar for exploring the prognostic value of liquid biopsies for the benefit of PSMA-PET-guided salvage radiotherapy in oligometastatic prostate cancer relapses. Further studies on larger and uniformly treated patient cohorts are necessary to validate our observations.

Author Contributions

Conceptualization, N.V.B., H.C., R.M. and C.H.; methodology, N.V.B., C.H., A.C.K. and T.D.; software, H.R. and D.R.; validation, H.R., D.R. and A.C.K.; formal analysis, N.V.B., H.R., D.R.; investigation, N.V.B., H.R., D.R. and A.C.K.; resources, A.C.K., C.H., T.D., H.C., C.A.J.v.K. and R.M.; data curation, N.V.B., H.R., D.R. and R.M.; writing—original draft preparation, N.V.B. and R.M.; writing—review and editing, D.R., H.R., T.D., H.C., C.H., C.A.J.v.K. and A.C.K.; visualization, N.V.B., D.R. and H.R.; project administration, N.V.B., H.C. and C.H.; funding acquisition, N.V.B., H.C., R.M. and C.H. All authors have read and agreed to the published version of the manuscript.

Funding

This study was funded by the Wolfgang Dieckmann Foundation. We acknowledge the support by the German Research Foundation (DFG) and the Open Access Publication Fund of Hannover Medical School (MHH).

Institutional Review Board Statement

The study protocol was reviewed and approved by the Hannover Medical School Institutional Ethics Committee Board (ethic vote no. 8265_BO_K_2021).

Informed Consent Statement

Informed written consent was obtained from each patient prior to the sample collection. Patients were informed that the results of the study may be published in scientific journals and presented at medical meetings and can be made available for other researchers to use in other research projects, but that the information that directly identifies any person will not be used.

Data Availability Statement

The data presented in this study are available upon reasonable request from the first or corresponding author.

Acknowledgments

We would like to thank all the patients for the participation in our study.

Conflicts of Interest

The authors declare no conflict of interest. The funders had no influence on the design of the study; analyses, or interpretation of data; writing of the manuscript, or decision to publish the results.

Appendix A

Figure A1. Significant associations between transcripts’ expression in blood-derived mRNA and Gleason score in overall cohort. Bar graphs showing −log10 relative expression levels of gene transcripts in different Gleason score groups. p values are indicated after linear test for trend following ANOVA.
Cancers 14 04095 g0a1
Figure A2. Significant associations and correlations between transcripts’ expression in blood-derived mRNA with TNM score, disease recurrence and standard clinicopathologic PSA-related variables in overall cohort, respectively. (A) Bar graph showing −log10 relative expression levels of gene transcripts in different TNM score groups or (B) log10 relative expression levels of IRF2 in groups with different disease recurrence. p value indicated after linear test for trend following ANOVA (A,B). (C) Scatter plots showing correlation between −log10 relative expression levels of gene transcripts (on the y-axis) and different clinical parameters (on the x-axis). Pearson correlation and R2 value are indicated, along with p values and N (number of observations/patients). In each graph, linear regression is denoted by the blue line and error bars are indicated by the red dotted lines.
Cancers 14 04095 g0a2
Figure A3. Associations between transcripts’ expression in blood-derived mRNA and TNM score in ADT− cohort with no overall significance in trend, but with statistical significance for TNM2/TNM3 comparison. Bar graphs showing −log10 relative expression levels of gene transcripts in different TNM score groups. p values are indicated after linear test for trend following ANOVA or after unpaired t-test between two groups (TNM = 2 and TNM = 3).
Cancers 14 04095 g0a3

References

  1. Gleason, D.F.; Mellinger, G.T. Prediction of prognosis for prostatic adenocarcinoma by combined histological grading and clinical staging. J. Urol. 1974, 111, 58–64. [Google Scholar] [CrossRef]
  2. Epstein, J.I.; Zelefsky, M.J.; Sjoberg, D.D.; Nelson, J.B.; Egevad, L.; Magi-Galluzzi, C.; Vickers, A.J.; Parwani, A.V.; Reuter, V.E.; Fine, S.W.; et al. A Contemporary Prostate Cancer Grading System: A Validated Alternative to the Gleason Score. Eur. Urol. 2016, 69, 428–435. [Google Scholar] [CrossRef]
  3. Brierley, J.D.; Gospodarowicz, M.K.; Wittekind, C. TNM Classification of Malignant Tumours; John Wiley & Son: Hoboken, NJ, USA, 2017. [Google Scholar]
  4. Den, R.B.; Yousefi, K.; Trabulsi, E.J.; Abdollah, F.; Choeurng, V.; Feng, F.Y.; Dicker, A.P.; Lallas, C.D.; Gomella, L.G.; Davicioni, E.; et al. Genomic classifier identifies men with adverse pathology after radical prostatectomy who benefit from adjuvant radiation therapy. J. Clin. Oncol. 2015, 33, 944–951. [Google Scholar] [CrossRef] [PubMed]
  5. Ross, A.E.; Johnson, M.H.; Yousefi, K.; Davicioni, E.; Netto, G.J.; Marchionni, L.; Fedor, H.L.; Glavaris, S.; Choeurng, V.; Buerki, C.; et al. Tissue-based Genomics Augments Post-prostatectomy Risk Stratification in a Natural History Cohort of Intermediate- and High-Risk Men. Eur. Urol. 2016, 69, 157–165. [Google Scholar] [CrossRef] [PubMed]
  6. Turajlic, S.; Swanton, C. Metastasis as an evolutionary process. Science 2016, 352, 169–175. [Google Scholar] [CrossRef]
  7. Afshar-Oromieh, A.; Holland-Letz, T.; Giesel, F.L.; Kratochwil, C.; Mier, W.; Haufe, S.; Debus, N.; Eder, M.; Eisenhut, M.; Schäfer, M.; et al. Diagnostic performance of 68Ga-PSMA-11 (HBED-CC) PET/CT in patients with recurrent prostate cancer: Evaluation in 1007 patients. Eur. J. Nucl. Med. Mol. Imaging 2017, 44, 1258–1268. [Google Scholar] [CrossRef]
  8. Rauscher, I.; Maurer, T.; Beer, A.J.; Graner, F.P.; Haller, B.; Weirich, G.; Doherty, A.; Gschwend, J.E.; Schwaiger, M.; Eiber, M. Value of 68Ga-PSMA HBED-CC PET for the Assessment of Lymph Node Metastases in Prostate Cancer Patients with Biochemical Recurrence: Comparison with Histopathology After Salvage Lymphadenectomy. J. Nucl. Med. 2016, 57, 1713–1719. [Google Scholar] [CrossRef]
  9. Hussain, M.; Daignault-Newton, S.; Twardowski, P.W.; Albany, C.; Stein, M.N.; Kunju, L.P.; Siddiqui, J.; Wu, Y.M.; Robinson, D.; Lonigro, R.J.; et al. Targeting Androgen Receptor and DNA Repair in Metastatic Castration-Resistant Prostate Cancer: Results From NCI 9012. J. Clin. Oncol. 2018, 36, 991–999. [Google Scholar] [CrossRef]
  10. Duchesne, G.M.; Woo, H.H.; Bassett, J.K.; Bowe, S.J.; D’Este, C.; Frydenberg, M.; King, M.; Ledwich, L.; Loblaw, A.; Malone, S.; et al. Timing of androgen-deprivation therapy in patients with prostate cancer with a rising PSA (TROG 03.06 and VCOG PR 01-03 [TOAD]): A randomised, multicentre, non-blinded, phase 3 trial. Lancet Oncol. 2016, 17, 727–737. [Google Scholar] [CrossRef]
  11. Magnan, S.; Zarychanski, R.; Pilote, L.; Bernier, L.; Shemilt, M.; Vigneault, E.; Fradet, V.; Turgeon, A.F. Intermittent vs Continuous Androgen Deprivation Therapy for Prostate Cancer: A Systematic Review and Meta-analysis. JAMA Oncol. 2015, 1, 1261–1269. [Google Scholar] [CrossRef] [Green Version]
  12. James, N.D.; de Bono, J.S.; Spears, M.R.; Clarke, N.W.; Mason, M.D.; Dearnaley, D.P.; Ritchie, A.W.S.; Amos, C.L.; Gilson, C.; Jones, R.J.; et al. Abiraterone for Prostate Cancer Not Previously Treated with Hormone Therapy. N. Engl. J. Med. 2017, 377, 338–351. [Google Scholar] [CrossRef] [PubMed]
  13. Vale, C.L.; Burdett, S.; Rydzewska, L.H.M.; Albiges, L.; Clarke, N.W.; Fisher, D.; Fizazi, K.; Gravis, G.; James, N.D.; Mason, M.D.; et al. Addition of docetaxel or bisphosphonates to standard of care in men with localised or metastatic, hormone-sensitive prostate cancer: A systematic review and meta-analyses of aggregate data. Lancet Oncol. 2016, 17, 243–256. [Google Scholar] [CrossRef]
  14. Ost, P.; Reynders, D.; Decaestecker, K.; Fonteyne, V.; Lumen, N.; De Bruycker, A.; Lambert, B.; Delrue, L.; Bultijnck, R.; Claeys, T.; et al. Surveillance or Metastasis-Directed Therapy for Oligometastatic Prostate Cancer Recurrence: A Prospective, Randomized, Multicenter Phase II Trial. J. Clin. Oncol. 2018, 36, 446–453. [Google Scholar] [CrossRef] [PubMed]
  15. Soldatov, A.; von Klot, C.A.J.; Walacides, D.; Derlin, T.; Bengel, F.M.; Ross, T.L.; Wester, H.J.; Derlin, K.; Kuczyk, M.A.; Christiansen, H.; et al. Patterns of Progression After 68Ga-PSMA-Ligand PET/CT-Guided Radiation Therapy for Recurrent Prostate Cancer. Int. J. Radiat. Oncol. Biol. Phys. 2019, 103, 95–104. [Google Scholar] [CrossRef] [PubMed]
  16. Mader, S.; Pantel, K. Liquid Biopsy: Current Status and Future Perspectives. Oncol. Res. Treat. 2017, 40, 404–408. [Google Scholar] [CrossRef]
  17. Ward Gahlawat, A.; Lenhardt, J.; Witte, T.; Keitel, D.; Kaufhold, A.; Maass, K.K.; Pajtler, K.W.; Sohn, C.; Schott, S. Evaluation of Storage Tubes for Combined Analysis of Circulating Nucleic Acids in Liquid Biopsies. Int. J. Mol. Sci. 2019, 20, 704. [Google Scholar] [CrossRef]
  18. Steinestel, J.; Luedeke, M.; Arndt, A.; Schnoeller, T.J.; Lennerz, J.K.; Wurm, C.; Maier, C.; Cronauer, M.V.; Steinestel, K.; Schrader, A.J. Detecting predictive androgen receptor modifications in circulating prostate cancer cells. Oncotarget 2015, 10, 4213–4223. [Google Scholar] [CrossRef]
  19. Mulcahy, D.G.; Macdonald, K.S., III; Brady, S.G.; Meyer, C.; Barker, K.B.; Coddington, J. Greater than X kb: A quantitative assessment of preservation conditions on genomic DNA quality, and a proposed standard for genome-quality DNA. PeerJ 2016, 4, e2528. [Google Scholar] [CrossRef]
  20. Bernemann, C.; Humberg, V.; Thielen, B.; Steinestel, J.; Chen, X.; Duensing, S.; Schrader, A.J.; Boegemann, M. Comparative Analysis of AR Variant AR-V567es mRNA Detection Systems Reveals Eminent Variability and Questions the Role as a Clinical Biomarker in Prostate Cancer. Clin. Cancer Res. 2019, 25, 3856–3864. [Google Scholar] [CrossRef]
  21. Nagaya, N.; Nagata, M.; Lu, Y.; Kanayama, M.; Hou, Q.; Hotta, Z.U.; China, T.; Kitamura, K.; Matsushita, K.; Isotani, S.; et al. Prostate-specific membrane antigen in circulating tumor cells is a new poor prognostic marker for castration-resistant prostate cancer. PLoS ONE 2020, 15, e0226219. [Google Scholar] [CrossRef] [Green Version]
  22. Moll, R.; Franke, W.W.; Schiller, D.L. The catalog of human cytokeratins: Patterns of expression in normal epithelia, tumors and cultured cells. Cell 1982, 31, 11–24. [Google Scholar] [CrossRef]
  23. Wadosky, K.M.; Koochekpour, S. Androgen receptor splice variants and prostate cancer: From bench to bedside. Oncotarget 2017, 8, 18550–18576. [Google Scholar] [CrossRef] [PubMed]
  24. Den, R.B.; Feng, F.Y.; Showalter, T.N.; Mishra, M.V.; Trabulsi, E.J.; Lallas, C.D.; Gomella, L.G.; Kelly, W.K.; Birbe, R.C.; McCue, P.A.; et al. Genomic prostate cancer classifier predicts biochemical failure and metastases in patients after postoperative radiation therapy. Int. J. Radiat. Oncol. Biol. Phys. 2014, 89, 1038–1046. [Google Scholar] [CrossRef]
  25. Cooperberg, M.R.; Davicioni, E.; Crisan, A.; Jenkins, R.B.; Ghadessi, M.; Karnes, R.J. Combined value of validated clinical and genomic risk stratification tools for predicting prostate cancer mortality in a high-risk prostatectomy cohort. Eur. Urol. 2015, 67, 326–333. [Google Scholar] [CrossRef] [PubMed]
  26. Klein, E.A.; Yousefi, K.; Haddad, Z.; Choeurng, V.; Buerki, C.; Stephenson, A.J.; Li, J.; Kattan, M.W.; Magi-Galluzzi, C.; Davicioni, E. A genomic classifier improves prediction of metastatic disease within 5 years after surgery in node-negative high-risk prostate cancer patients managed by radical prostatectomy without adjuvant therapy. Eur. Urol. 2015, 67, 778–786. [Google Scholar] [CrossRef]
  27. Freedland, S.J.; Choeurng, V.; Howard, L.; De Hoedt, A.; du Plessis, M.; Yousefi, K.; Lam, L.L.; Buerki, C.; Ra, S.; Robbins, B.; et al. Utilization of a Genomic Classifier for Prediction of Metastasis Following Salvage Radiation Therapy after Radical Prostatectomy. Eur. Urol. 2016, 70, 588–596. [Google Scholar] [CrossRef]
  28. Karnes, R.J.; Choeurng, V.; Ross, A.E.; Schaeffer, E.M.; Klein, E.A.; Freedland, S.J.; Erho, N.; Yousefi, K.; Takhar, M.; Davicioni, E.; et al. Validation of a Genomic Risk Classifier to Predict Prostate Cancer-specific Mortality in Men with Adverse Pathologic Features. Eur. Urol. 2018, 73, 168–175. [Google Scholar] [CrossRef]
  29. Spratt, D.E.; Dai, D.L.Y.; Den, R.B.; Troncoso, P.; Yousefi, K.; Ross, A.E.; Schaeffer, E.M.; Haddad, Z.; Davicioni, E.; Mehra, R.; et al. Performance of a Prostate Cancer Genomic Classifier in Predicting Metastasis in Men with Prostate-specific Antigen Persistence Postprostatectomy. Eur. Urol. 2018, 74, 107–114. [Google Scholar] [CrossRef]
  30. Jairath, N.K.; Dal Pra, A.; Vince, R., Jr.; Dess, R.T.; Jackson, W.C.; Tosoian, J.J.; McBride, S.M.; Zhao, S.G.; Berlin, A.; Mahal, B.A.; et al. A Systematic Review of the Evidence for the Decipher Genomic Classifier in Prostate Cancer. Eur. Urol. 2021, 79, 374–383. [Google Scholar] [CrossRef]
  31. Pra, A.D.; Ghadjar, P.; Hayoz, S.; Liu, V.Y.T.; Spratt, D.E.; Thompson, D.J.S.; Davicioni, E.; Huang, H.-C.; Zhao, X.; Liu, Y.; et al. Validation of the Decipher genomic classifier in patients receiving salvage radiotherapy without hormone therapy after radical prostatectomy—An ancillary study of the SAKK 09/10 randomized clinical trial. Ann. Oncol. 2022. [Google Scholar] [CrossRef]
  32. Antonarakis, E.S.; Lu, C.; Wang, H.; Luber, B.; Nakazawa, M.; Roeser, J.C.; Chen, Y.; Mohammad, T.A.; Chen, Y.; Fedor, H.L.; et al. AR-V7 and resistance to enzalutamide and abiraterone in prostate cancer. N. Engl. J. Med. 2014, 371, 1028–1038. [Google Scholar] [CrossRef]
  33. van der Toom, E.E.; Verdone, J.E.; Gorin, M.A.; Pienta, K.J. Technical challenges in the isolation and analysis of circulating tumor cells. Oncotarget 2016, 7, 62754–62766. [Google Scholar] [CrossRef] [PubMed]
  34. Liu, X.; Ledet, E.; Li, D.; Dotiwala, A.; Steinberger, A.; Feibus, A.; Li, J.; Qi, Y.; Silberstein, J.; Lee, B.; et al. A Whole Blood Assay for AR-V7 and ARv567es in Prostate Cancer Patients. J. Urol. 2016, 196, 1758. [Google Scholar] [CrossRef]
  35. Todenhofer, T.; Azad, A.; Stewart, C.; Gao, J.; Eigl, B.J.; Gleave, M.E.; Joshua, A.M.; Black, P.C.; Chi, K.N. AR-V7 transcripts in whole blood RNA of patients with metastatic castration resistant prostate cancer correlate with response to Abiraterone acetate. J. Urol. 2017, 197, 135–142. [Google Scholar] [CrossRef] [PubMed]
  36. Qu, F.; Xie, W.; Nakabayashi, M.; Zhang, H.; Jeong, S.H.; Wang, X.; Komura, K.; Sweeney, C.J.; Sartor, O.; Lee, G.M.; et al. Association of AR-V7 and prostate specific antigen RNA levels in blood with efficacy of abiraterone acetate and enzalutamide treatment in men with prostate cancer. Clin. Cancer Res. 2016, 23, 726–734. [Google Scholar] [CrossRef]
  37. Sperger, J.M.; Emamekhoo, H.; McKay, R.R.; Stahlfeld, C.N.; Singh, A.; Chen, X.E.; Kwak, L.; Gilsdorf, C.S.; Wolfe, S.K.; Wei, X.X.; et al. Prospective Evaluation of Clinical Outcomes Using a Multiplex Liquid Biopsy Targeting Diverse Resistance Mechanisms in Metastatic Prostate Cancer. J. Clin. Oncol. 2021, 39, 2926–2937. [Google Scholar] [CrossRef] [PubMed]
  38. Ladurner, M.; Wieser, M.; Eigentler, A.; Seewald, M.; Dobler, G.; Neuwirt, H.; Kafka, M.; Heidegger, I.; Horninger, W.; Bektic, J.; et al. Validation of Cell-Free RNA and Circulating Tumor Cells for Molecular Marker Analysis in Metastatic Prostate Cancer. Biomedicines 2021, 9, 1004. [Google Scholar] [CrossRef]
  39. Henshall, S.M.; Afar, D.E.; Hiller, J.; Horvath, L.G.; Quinn, D.I.; Rasiah, K.K.; Gish, K.; Willhite, D.; Kench, J.G.; Gardiner-Garden, M.; et al. Survival analysis of genome-wide gene expression profiles of prostate cancers identifies new prognostic targets of disease relapse. Cancer Res. 2003, 63, 4196–4203. [Google Scholar]
  40. Glinsky, G.V.; Glinskii, A.B.; Stephenson, A.J.; Hoffman, R.M.; Gerald, W.L. Gene expression profiling predicts clinical outcome of prostate cancer. J. Clin. Investig. 2004, 113, 913–923. [Google Scholar] [CrossRef]
  41. Cuzick, J.; Swanson, G.P.; Fisher, G.; Brothman, A.R.; Berney, D.M.; Reid, J.E.; Mesher, D.; Speights, V.O.; Stankiewicz, E.; Foster, C.S.; et al. Prognostic value of an RNA expression signature derived from cell cycle proliferation genes in patients with prostate cancer: A retrospective study. Lancet Oncol. 2011, 12, 245–255. [Google Scholar] [CrossRef]
  42. Rubicz, R.; Zhao, S.; Wright, J.L.; Coleman, I.; Grasso, C.; Geybels, M.S.; Leonardson, A.; Kolb, S.; April, C.; Bibikova, M.; et al. Gene expression panel predicts metastatic-lethal prostate cancer outcomes in men diagnosed with clinically localized prostate cancer. Mol. Oncol. 2017, 11, 140–150. [Google Scholar] [CrossRef] [PubMed] [Green Version]
  43. Lamy, P.J.; Allory, Y.; Gauchez, A.S.; Asselain, B.; Beuzeboc, P.; de Cremoux, P.; Fontugne, J.; Georges, A.; Hennequin, C.; Lehmann-Che, J.; et al. Prognostic Biomarkers Used for Localised Prostate Cancer Management: A Systematic Review. Eur. Urol. Focus 2018, 4, 790–803. [Google Scholar] [CrossRef] [PubMed]
  44. Johnston, W.L.; Catton, C.N.; Swallow, C.J. Unbiased data mining identifies cell cycle transcripts that predict non-indolent Gleason score 7 prostate cancer. BMC Urol. 2019, 19, 4. [Google Scholar] [CrossRef]
  45. Wang, Y.; Yang, Z.A. Gleason score-related outcome model for human prostate cancer: A comprehensive study based on weighted gene co-expression network analysis. Cancer Cell Int. 2020, 20, 159. [Google Scholar] [CrossRef] [PubMed]
  46. Liu, S.; Wang, W.; Zhao, Y.; Liang, K.; Huang, Y. Dentification of Potential Key Genes for Pathogenesis and Prognosis in Prostate Cancer by Integrated Analysis of Gene Expression Profiles and the Cancer Genome Atlas. Front. Oncol. 2020, 10, 809. [Google Scholar] [CrossRef]
  47. Meng, J.; Guan, Y.; Wang, B.; Chen, L.; Chen, J.; Zhang, M.; Liang, C.H. Risk subtyping and prognostic assessment of prostate cancer based on consensus genes. Commun. Biol. 2022, 5, 233. [Google Scholar] [CrossRef]
  48. Agemy, L.; Kela, I.; Waks, T.; Pfeffer, R.; Bar-Shira, A.; Orr-Urtreger, A.; Domany, E.; Eshhar, Z. Gene Expression Profiles Predict Sensitivity of Prostate Cancer to Radiotherapy. J. Cancer Ther. 2013, 4, 11–26. [Google Scholar] [CrossRef]
  49. Simone, C.B., 2nd; John-Aryankalayil, M.; Palayoor, S.T.; Makinde, A.Y.; Cerna, D.; Falduto, M.T.; Magnuson, S.R.; Coleman, C.N. mRNA Expression Profiles for Prostate Cancer following Fractionated Irradiation Are Influenced by p53 Status. Transl. Oncol. 2013, 6, 573–585. [Google Scholar] [CrossRef]
  50. Tseng, C.S.; Wang, Y.J.; Chen, C.H.; Wang, S.M.; Huang, K.H.; Chow, P.M.; Pu, Y.S.; Huang, C.Y.; Cheng, J.C. Outcomes and Prediction Models for Exclusive Prostate Bed Salvage Radiotherapy among Patients with Biochemical Recurrence after Radical Prostatectomy. Cancers 2021, 13, 2672. [Google Scholar] [CrossRef]
  51. Bibikova, M.; Chudin, E.; Arsanjani, A.; Zhou, L.; Garcia, E.W.; Modder, J.; Kostelec, M.; Barker, D.; Downs, T.; Fan, J.B.; et al. Expression signatures that correlated with Gleason score and relapse in prostate cancer. Genomics 2007, 89, 666–672. [Google Scholar] [CrossRef]
  52. Penney, K.L.; Sinnott, J.A.; Fall, K.; Pawitan, Y.; Hoshida, Y.; Kraft, P.; Stark, J.R.; Fiorentino, M.; Perner, S.; Finn, S.; et al. mRNA expression signature of Gleason grade predicts lethal prostate cancer. J. Clin. Oncol. 2011, 29, 2391–2396. [Google Scholar] [CrossRef] [PubMed] [Green Version]
  53. Sinnott, J.A.; Peisch, S.; Tyekucheva, S.; Gerke, T.A.; Lis, R.T.; Rider, J.R.; Fiorentino, M.; Stampfer, M.J.; Mucci, L.A.; Loda, M.; et al. Prognostic utility of a new mRNA expression signature of Gleason score. Clin. Cancer Res. 2016, 23, 81–87. [Google Scholar] [CrossRef] [PubMed]
  54. Jhun, M.A.; Geybels, M.S.; Wright, J.L.; Kolb, S.; April, C.; Bibikova, M.; Ostrander, E.A.; Fan, J.B.; Feng, Z.; Stanford, J.L. Gene expression signature of Gleason score is associated with prostate cancer outcomes in a radical prostatectomy cohort. Oncotarget 2017, 8, 43035–43047. [Google Scholar] [CrossRef]
  55. Abril, J.; De Heredia, M.L.; González, L.; Cléries, R.; Nadal, M.; Condom, E.; Aguiló, F.; Gómez-Zaera, M.; Nunes, V. Altered expression of 12S/MT-RNR1, MT-CO2/COX2, and MT-ATP6 mitochondrial genes in prostate cancer. Prostate 2008, 68, 1086–1096. [Google Scholar] [CrossRef] [PubMed]
  56. Wallace, L.; Mehrabi, S.; Bacanamwo, M.; Yao, X.; Aikhionbare, F.O. Expression of mitochondrial genes MT-ND1, MT-ND6, MT-CYB, MT-COI, MT-ATP6, and 12S/MT-RNR1 in colorectal adenopolyps. Tumor. Biol. 2016, 37, 12465–12475. [Google Scholar] [CrossRef] [PubMed]
  57. Han, C.B.; Ma, J.M.; Xin, Y.; Mao, X.Y.; Zhao, Y.J.; Wu, D.Y.; Zhang, S.M.; Zhang, Y.K. Mutations of mitochondrial 12S rRNA in gastric carcinoma and their significance. World J. Gastroenterol. 2005, 11, 31–35. [Google Scholar] [CrossRef]
  58. Lin, Y.H.; Chu, Y.D.; Lim, S.N.; Chen, C.W.; Yeh, C.T.; Lin, W.R. Impact of an MT-RNR1 gene polymorphism on hepatocellular carcinoma progression and clinical characteristics. Int. J. Mol. Sci. 2021, 22, 1119. [Google Scholar] [CrossRef]
  59. Lin, Y.H.; Lim, S.N.; Chen, C.Y.; Chi, H.C.; Yeh, C.T.; Lin, W.R. Functional Role of Mitochondrial DNA in Cancer Progression. Int. J. Mol. Sci. 2022, 23, 1659. [Google Scholar] [CrossRef]
Figure 1. Study workflow. Processing patient blood samples (upper panel), candidate transcripts’ prioritization, and sets of investigated transcripts (lower panel).
Cancers 14 04095 g001
Figure 2. Landscape of investigated molecular alterations in individual CTCs and RT benefit. The overview of 43 samples with 42 CTC-positive samples in the investigated cohort is shown in the upper panel. The overall results of CTC analysis, ADT application in follow-up, and RT response are schematically summarized. The meaning of the color and number or “+/−“ coding is as indicated.
Cancers 14 04095 g002
Figure 3. Correlation analysis. Heatmap profiles for the AR variant correlations in overall, ADT−, and ADT+ cohorts (upper panel). The overview of significant correlations for the clinical variables, stratified by ADT application or overall (lower panel). The meaning of the color-coding on the heatmaps is as indicated in the key, with 1 representing the highest positive correlation value and −1 representing highest negative correlation.
Cancers 14 04095 g003
Figure 4. The association between transcripts’ expression in blood-derived mRNA and treatment response. Log10 relative expression levels of gene transcripts were tested for association with benefit. p values are indicated after unpaired t-tests between two groups. Only the significant associations in overall cohort are depicted for RT benefit. The meaning of the number-coding is as indicated in the figure key.
Cancers 14 04095 g004
Figure 5. Trends in transcripts’ levels of expression from blood-derived mRNA and association with treatment response. Log10 relative expression levels of gene transcripts were tested for association with benefit. p values are indicated after linear test for trend following ANOVA. Only significant results in overall cohort are presented. The meaning of the number-coding is as indicated in the figure key.
Cancers 14 04095 g005
Figure 6. Associations between transcripts’ expression in blood-derived mRNA and treatment response or disease recurrence in ADT− cohort. (A) Bar graph showing −log10 relative expression levels of MT-RNR1 in different benefit groups as specified in the key. p value indicated after linear test for trend following ANOVA. (B) Log10 relative expression levels of IRF2 in groups with different disease recurrences. p value indicated after unpaired t-test between two groups.
Cancers 14 04095 g006
Figure 7. Associations between transcripts’ expression in blood-derived mRNA and Gleason score in ADT− cohort. Bar graphs showing −log10 relative expression levels of gene transcripts in different Gleason score groups. p values are indicated after linear test for trend following ANOVA.
Cancers 14 04095 g007
Figure 8. Associations between transcripts’ expression in blood-derived mRNA and TNM score in ADT− cohort. Bar graphs showing −log10 relative expression levels of gene transcripts in different TNM score groups. p values are indicated after linear test for trend following ANOVA or after unpaired t-test between two groups (TNM = 2 and TNM = 3).
Cancers 14 04095 g008
Figure 9. Correlations between transcripts’ expression in blood-derived mRNA and PSA-related standard clinicopathologic variables in ADT− cohort. Scatter plots showing correlation between −log10 relative expression levels of gene transcripts (on the y -axis) and different clinical parameters (on the x-axis). Pearson correlation R2 values are indicated, along with p values and N (number of observations/patients). In each graph, linear regression is denoted by the dark blue line and error bars are indicated by the black dotted lines.
Cancers 14 04095 g009
Table 1. Patients’ characteristics.
Total Number of Patients/Blood Samples Available44/43
Age [years, Mean (Range)]63.6 (47–80)
TNM at primary diagnosis [number of patients]
T16
T29
T327
T41
N 038
N 15
M 043
M 10
Gleason—Score at primary diagnosis [number of patients]
Gleason sum 61
Gleason sum 7a22
Gleason sum 7b3
Gleason sum 87
Gleason sum 910
Gleason sum 100
Therapy after primary diagnosis
Prostatectomy39
Radiotherapy4
PSA Level in Blood sample [ng/mL, mean (range)]
At primary diagnosis12.15 (2.6–40.4)
At relapse and PSMA-PET5.15 (0.19–64)
Doubling time at PSMA-detected relapse [month]22 (1–46)
Site of relapse [number of patients]
Former prostate region only3
Pelvic lymphatic nodes only22
Extra pelvic lymphatic nodes only0
Bone metastases only7
Metastases at lung/liver only1
Both pelvic and extra pelvic lymphatic nodes 2
Both lymphatic nodes and bone metastases 4
Both former prostate region and bone metastases 2
Both former prostate region and pelvic lymphatic nodes2
Peak uptake [mean (range)]7.7 (1.8–49.8)
Number of patients not receiving ADT during follow up (ADT−)30
Number of patients receiving ADT during follow up (ADT+)13
Treatment outcome after Radiotherapy of relapse
Time to progression [month, mean (range)]7.1 (2–19)
ADT− patients
Remission < 12 months [number of patients]20
Remission ≥ 12 months [number of patients]3
No remission7
ADT+ patients
Remission < 12 months [number of patients]5
Remission ≥ 12 months [number of patients]2
No remission6
Publisher’s Note: MDPI stays neutral with regard to jurisdictional claims in published maps and institutional affiliations.

