Article

Live Biotherapeutic Lactococcus lactis GEN3013 Enhances Antitumor Efficacy of Cancer Treatment via Modulation of Cancer Progression and Immune System

1
Department of Biomedical Science and Engineering, Gwangju Institute of Science and Technology (GIST), Gwangju 61005, Korea
2
Genome and Company, Pangyo-ro 255, Bundang-gu, Seoungnam 13486, Korea
*
Authors to whom correspondence should be addressed.
These authors contributed equally to this work.
Cancers 2022, 14(17), 4083; https://doi.org/10.3390/cancers14174083
Submission received: 7 July 2022 / Revised: 16 August 2022 / Accepted: 22 August 2022 / Published: 23 August 2022

Abstract

:

Simple Summary

Recent studies, which have revealed the strong relationship between gut microbiota and tumor progression, have driven the clinical application of microbiome-based treatments to increase the efficacy of anticancer therapies. In particular, the genome-editing Lactococcus lactis, which activates the host immune system by expressing immune-boosting cytokines or metabolites, is a candidate for microbiome treatment. While Lactococcus lactis has so far been studied in terms of its recombinant forms, we investigated the anticancer effects of the strain-specific Lactococcus lactis GEN3013 itself. In vitro cytotoxicity tests showed that L. lactis GEN3013 inhibited the cell growth of various human and murine cancer cell lines. Consistent with the in vitro results, L. lactis GEN3013 showed antitumor effects and enhanced the therapeutic efficacy of both chemotherapy and immunotherapy in syngeneic mice. In addition, the host immune system was activated both locally and systemically by the combinatorial treatment of L. lactis GEN3013 with chemotherapy and immunotherapy. For these reasons, we suggest that L. lactis GEN3013 could be utilized as a novel biotherapeutic agent for cancer treatment.

Abstract

The gut microbiota is responsible for differential anticancer drug efficacies by modulating the host immune system and the tumor microenvironment. Interestingly, this differential effect is highly strain-specific. For example, certain strains can directly suppress tumor growth and enhance antitumor immunity; however, others do not have such an effect or even promote tumor growth. Identifying effective strains that possess antitumor effects is key for developing live biotherapeutic anticancer products. Here, we found that Lactococcus lactis GEN3013 inhibits tumor growth by regulating tumor angiogenesis and directly inducing cancer cell death. Moreover, L. lactis GEN3013 enhanced the therapeutic effects of oxaliplatin and the PD-1 blockade. Comprehensive immune profiling showed that L. lactis GEN3013 augmented cytotoxic immune cell populations, such as CD4+ T cells, CD8+ effector T cells, and NK cells in the tumor microenvironment. Our results indicate that L. lactis GEN3013 is a promising candidate for potentiating cancer treatment in combination with current standard therapy.

1. Introduction

A gut microbiome and a host have a symbiotic relationship, and the gut microbiome maintains host health homeostasis [1,2,3]. Therefore, research on the association between the gut microbiome and various diseases is ongoing. In particular, the gut microbiome affects not only the gut’s immune system, but also the host’s immune system in general. For example, orally administered Bifidobacterium spp. increases the number of activated T lymphocytes in the intestines and spleen and reduces tumor-associated inflammation [4,5]. Additionally, metabolites produced by the microbiome, such as toxins, PAMPs, and short-chain fatty acids, can suppress tumor growth by having cytotoxic effects on rapidly replicating cancer cells or by inhibiting angiogenesis [6,7]. Given this evidence, the microbiome is an emerging modality for treating cancer, in combination with chemotherapy or immunotherapy [8,9,10,11,12,13,14]. Some studies have suggested that cancer chemotherapy efficacy and outcomes are associated with the gut microbiome. For instance, strain-specific Bifidobacterium breve improved the efficacy of oxaliplatin in a syngeneic mouse model, and targeting F. nucleatum in the tumor augmented the effect of chemotherapy against colorectal cancers. Other studies have shown that effective microbiota can influence the therapeutic response to immunotherapy [9,15,16]. In a study, it was found that when mice that were non-responsive to anti-PD-L1 treatment were orally given feces isolated from responding mice or Bifidobacterium alone, their response to the same therapy increased [17]. Another study revealed a positive correlation between the immunotherapy response and the relative abundance of Akkermansia muciniphila. Furthermore, supplementation with A. muciniphila restored the response to the PD-1 blockade through the stimulation of specific T lymphocyte recruitment into the tumor microenvironment, even for FMT with non-responder feces [14].
Lactococcus lactis, a lactic acid-producing bacterium, is known for its safety and efficiency in genetic engineering. Therefore, recent studies have introduced recombinant L. lactis as a live vaccine bacterium for delivering antigens to the host immune system [18]. TRAIL-expressing or IL-12-secreting recombinant L. lactis has been shown to induce the apoptosis of cancer cells or an immune response [19,20,21,22]. L. lactis itself, however, has not been considered as a live biotherapeutic product, although some studies have revealed that it inhibits the proliferation and induces the apoptosis of cancer cells in stomach and colorectal cancers [23,24,25,26].
To develop a novel anticancer therapy or improve the therapeutic efficacy of conventional approaches, immune cells such as CD4+ T cells, CD8+ cytotoxic T cells, and NK cells are critical. In particular, the immune cells must be infiltrated and activated in the tumor microenvironment. CD4+ T cells mediate antitumor immunity by assisting CD8+ cytotoxic T cells and triggering antibody responses [27]. CD8+ cytotoxic T cells play a role in directly killing cancer cells, and cancer treatment is only successful if these cells are activated [28]. These T cells exhibit antitumor immunity through the secretion of effector cytokines, such as IFN-γ [29], TNF-α [30], and interleukin-2 [31], in the tumor microenvironment. NK cells are also key immune effector cells, capable of directly killing cancer cells without MHC specificity and of triggering adaptive immune responses [32,33,34].
For these reasons, identifying effective microbiomes with antitumor effects is an important step in developing novel anticancer modalities and enhancing conventional anticancer therapies. Here, we identified that a specific L. lactis GEN3013 strain isolated from a healthy individual had antitumor immunity and cytotoxic effects against cancer. L. lactis GEN3013 inhibited the growth of various cancer cell lines in vitro and induced tumor growth retardation in a syngeneic mice model. Moreover, it enhanced the efficacy of chemotherapy and immunotherapy by increasing the number of NK and T cells in both the spleen and tumor. These results indicate that L. lactis GEN3013 could be used as a live biotherapeutic product to benefit cancer treatment.

2. Materials and Methods

2.1. Mice

All animal experiments were approved by the Institutional Animal Care and Use Committee of CHA University and KLSbio. The mice used here were maintained and handled according to policies approved by CHA University and KLSbio, respectively. Five-week-old female C57BL/6 mice were purchased from Orient Bio (Gyeonggi, Korea). For the syngeneic tumor mouse model, a total of 2 × 10⁵ MC38 cells were subcutaneously inoculated in C57BL/6 mice. The mice were orally administered the L. lactis strain daily and were intra-peritoneally treated with anti-PD-1 mAb (clone RMP1-14; BioXCell, Lebanon, NH, USA) or 3 mg/kg oxaliplatin (S1224, Selleckchem, Houston, TX, USA) on days 1, 4, 8, 11, and 14. The tumor size was monitored three times per week until the study endpoint. The tumor volume was calculated as the length × width2 × 0.5.
Nude mice were purchased from Orient Bio (Gyeonggi, Korea). Nude mice were orally administered the L. lactis strain for 14 days. Then, a total of 2 × 10⁵ CT26, 1 × 10⁶ 4T1, and 1 × 10⁶ HCT116 cells were inoculated subcutaneously into the flank of each mouse. The nude tumor mice were administered the L. lactis daily, and the tumor size was monitored three times a week until the study endpoint. The tumor volume was calculated as the length × width2 × 0.5.

2.2. Cell Culture

Human lung (H1975, H1299, A549, and HCC827), colon (LoVo and HCT116), gastric (SNU-601, MKN-1, SNU-216, and AGS), breast (MDA-MB-231, Hs578T, and BT20), and liver (HepG2) cancer cell lines were purchased from the Korean Cell Line Bank (Jongno-gu, Seoul, Korea). Mouse lung (LLC1), colon (CT26 and MC38), and breast (4T1) cancer cells were purchased from the American Type Culture Collection (Manassas, VA, USA) and Kerafast (Winston-Salem, NC, USA). All cells were free from mycoplasma contamination. All human cell lines were cultured in Roswell Park Memorial Institute medium (RPMI, GIBCO) and all mouse cell lines were cultured in Dulbecco’s modified eagle medium (DMEM, GIBCO). Each medium was supplemented with 10% fetal bovine serum (FBS, GIBCO), 100 units/mL penicillin (GIBCO), and streptomycin (GIBCO). All cells were maintained in a 5% CO2 humidified incubator at 37 °C.

2.3. Bacteria

L. lactis GEN3013 was isolated from a healthy donor. Stool samples were collected from healthy donors from the Gwangju Institute of Science and Technology with informed consent. This study was approved by the institutional review board (20192009-BR-48-02-04). Fresh fecal samples (approximately 4.0 g) were transferred into bottles containing 80 mL of PBS and resuspended by vortexing in an anaerobic chamber. The resulting fecal fluids were serially diluted 10−4–10−8-fold with PBS and 100 or 200 μL of these was spread onto various agar media: MRS (pH 6.8, 5.2, and 3.5), MRS-cysteine, TOS-propionate, brain heart infusion, Colombian base blood, Eggerth–Gagnon, Gifu anaerobic medium (GAM), M2GSC, modified YCFA, mucin, and reinforced clostridial medium. After inoculation, the plates were placed in the bacteria incubator under aerobic conditions at 37 °C for 48–72 h. Individual colonies from the incubated plates were picked and prepared to sequence the 16S rRNA regions. Colony PCR was performed using the following parameters: pre-denaturation at 95 °C for 15 min, denaturation at 95 °C for 30 s, annealing at 55 °C for 30 s, extension at 72 °C for 1 min and 45 s, and a final extension at 72 °C for 5 min. The denaturation, annealing, and extension steps were repeated 32 times. The presence of PCR bands was confirmed via agarose gel (1%) analysis, and the PCR sample was purified using a PCR purification kit. The universal primers 27F and 1492R (V1-V9 region) and 518F and 800R (V4 region) were used (Macrogen Co., Seoul, Korea). The obtained nucleotide sequences were trimmed to remove the unclear nucleotides and were assembled (5′ forward and 3′ reverse orientation). Then, the modified sequences were placed in the NCBI BLAST program to identify the phylogenetically closest 16S rRNA gene sequences.

2.4. Bacterial Sampling

For obtaining bacterial lysates, bacterial cells were collected via centrifugation at 7000× g for 5 min at 4 °C. In order to remove the bacterial culture media, bacterial cells were washed twice with PBS. The bacterial cells were re-suspended in PBS until the 600 nm optical density (OD600) was 100, and were then placed in a 2 mL lysing matrix tube (MPBio, Santa Ana, CA, USA). By using the bead-beating method with Fast-Prep-24 5G (MPBio), the bacterial cells were homogenized. The bead-beating conditions were as follows: the speed was 6.0 m/s, the beating time was 30 s, the pause time was 300 s, and this procedure was repeated three times. The bacterial lysates were centrifuged at 12,000 rpm for 10 min at 4 °C. After serially filtering the supernatants with 0.45 µm and 0.2 µm filters, they were subsequently transferred to new tubes and stored at −80 °C until further assay.
Conditioned bacterial supernatants were obtained after the bacteria had adapted to the cell culture media (RPMI or DMEM). In detail, when a bacterial culture reached the appropriate number of CFUs, the bacterial culture media was mixed with cell culture media in a ratio of 8:1, and the mixture was incubated at 37 °C overnight. The cell culture media-incubated bacteria were centrifuged at 7000× g for 5 min at 4 °C, and the supernatant was subsequently transferred to a new tube and stored at −80 °C until further assay.

2.5. Metabolic Profiling

Bacterial cells (1010 CFUs) were collected via centrifugation at 7000× g for 5 min at 4 °C. After freezing the bacterial cells at −80 °C, 200 μL of 80% methanol in water was added to each bacterial cell sample. After vortexing for 1 min at room temperature, the suspension was frozen at −80 °C for 3 h. This extraction procedure was repeated three times. The extracted samples were thawed on ice and immediately centrifuged (10,000× g) for 2 min at 4 °C. The supernatant was subsequently transferred to a new tube and stored at −80 °C until further analysis.
For the untargeted analysis, 10 μL of sulfamethoxazole (2200 μg/L) was added to 100 μL of the extracted sample as an internal standard for normalization. The supernatants were transferred to sample vials and analyzed using UHPLC-ESI-Q-TOF/MS (UHPLC: DIONEX UltiMate 3000, Dionex Corporation, Sunnyvale, CA, USA; MS: TOF 5600+, AB Sciex, Path Framingham, MA, USA). UHPLC separation was performed using a CORTECS C18 column (2.1 mm × 100 mm, 1.6 μm; Waters). Mobile phase A consisted of 5 mM ammonium acetate in water containing 0.1% acetic acid (v/v), whereas mobile phase B contained 0.05% formic acid (v/v) in acetonitrile. Samples were eluted using the following conditions: 5% of mobile phase B increased to 95% at 35 min and equilibrated for an additional 5 min. The flow rate used was 0.4 mL/min. The column temperature was maintained at 45 °C. Mass acquisition was performed in both positive (ESI+) and negative (ESI−) electrospray ionization modes using the following parameters: a collision energy of 35 ± 10 eV; a capillary voltage of 13,800 V (positive mode) and 23,800 V (negative mode), with nozzle voltages of 10 V and 20 V, respectively; a gas temperature of 300 °C; a drying gas (nitrogen) rate of 7 l/min; a nebulizer gas (nitrogen) pressure of 40 psi; a sheath gas temperature of 330 °C; and a flow rate of 10 l/min. Mass data were collected in the 80–1700 m/z range at an acquisition rate of 2 spectra/s. The injection volume used was 3 μL.
For metabolite identification, the following resources and parameters were used: the metabolites detected in each group were analyzed using Scaffold Elements v. 2.1.1 (Proteome Software, USA) for the spectrum properties and filtering (S/N > 3); peak alignment (RT ≤ 0.5 min and MT ≤ 4 ppm), feature extraction (adduct ions: [M + H]+, [M + NH4]+, [M + Na]+, and [M-nH2O + H]+ for ESI (+) and [M − H], [2M − H], [M + HCOO], and [M-nH2O-H] for ESI (−); peak with an S/N ≥ 10 and an intensity ≥ 1000), and feature grouping (RT ≤ 0.5 min and MT ≤ 4 ppm); and the MS/MS spectra of the compounds and metabolome databases, including the Human Metabolomics Database (http://www.hmdb.ca/ (accessed on 7 January 2022)), METLIN (http://metlin.scripps.edu/ (accessed on 11 January 2022)), MassBank (http://www.massbank.jp/ (accessed on 19 January 2022)), NIST (http://www.nist.gov/ (accessed on 8 February 2022)), and LIPID MAPS (http://www.lipidmaps.org/ (accessed on 14 February 2022)).

2.6. MTT Assay

The cancer cell lines were dispensed in a 96-well plate at 1–5 × 10³ cells/well, and after 24 h, the bacterial samples (bacterial lysates or conditioned bacterial supernatants) were added at 0.5% and incubated for 72 h. Next, each well was treated and incubated with 3-(4,5-dimethylthiazol-2-yl)-2,5-diphenyltetrazolium bromide thiazolyl blue (MTT) reagent for 2 h. The mitochondria of living cells converted the yellow MTT to purple formazan. Afterwards, the culture medium containing MTT was removed, and 100 μL of DMSO was added to each well. The purple color intensity was measured at 540 nm using a microplate reader.

2.7. Colony Forming Assay

Various cancer cell lines were diluted to a density of 1–2 × 10³ in each well and incubated for 24 h at 37 °C in a 5% CO2 atmosphere. L. lactis GEN3013 was cultured in MRS liquid medium (Difco) containing 0.5% glucose and 0.05% cysteine at 37 °C for 24 h, and the bacteria were disrupted. Bacterial lysates were then added to each well, and the medium was exchanged every 2–3 days. After the cells were incubated for 144 h, they were fixed with 4% formalin for 30 min and washed with PBS twice. Finally, the cells were stained with crystal violet for 5 min and observed using a cell culture microscope (CKX53; Olympus, Shinjuku City, Tokyo).

2.8. Wound Healing Assay

HCT116, A549, or MC38 cancer cells were diluted to 6 × 10⁵ cells/well on a 6-well plate. When cell confluency reached 90–95%, a scratch was made on the cell monolayer at regular intervals using a 1000 µL tip. Then, PBS or bacterial samples (lysates or conditioned bacterial supernatants) were used to treat cells for 24 h and cell mobility was observed using a cell culture microscope (Olympus, CKX53). Image processing was performed using the “wound healing size tool” plugin of ImageJ (ver. 1.8.0_172).

2.9. T Cell Proliferation Assay

PBMCs were isolated from human blood using Ficoll (GE healthcare, Chicago, IL, USA), and the red blood cells were removed using red blood cell (RBC) lysis buffer (Biolegend, San Diego, CA, USA). Monocytes were isolated from RBC-lysed PBMCs and 5 × 10³ cells were placed into each well of a 96-well plate. Then, L. lactis GEN3013 was added to each well and mixed gently to react with the monocytes for 2 h. During the reaction between the monocytes and L. lactis GEN3013, T cells were isolated from the extra PMBCs using MACS buffer and an LS column (Miltenyi Biotec, Bergisch Gladbach, Germany). The isolated T cells were diluted in RPMI medium to a concentration of 5 × 10⁴ cells per 100 μL and aliquoted into each well. They were cultured together for 48 h at 37 °C in a 5% CO2 atmosphere. Finally, the cell culture supernatant was collected and the IFN-γ and IL-10 levels in the supernatant were measured using an ELISA kit (Invitrogen, Waltham, MA, USA).
Splenocytes were isolated from the mouse spleens using 70 µm cell strainers, and red blood cells were removed using RBC lysis buffer. CD4+ or CD8+ T cells were isolated from the splenocytes using MACS buffer and an LS column (Miltenyi Biotec, Bergisch Gladbach, Germany) and stained with CellTrace CFSE (C34554, Invitrogen). Isolated T cells were diluted using RPMI media to a density of 1–2 × 10⁵ cells per 100 μL and aliquoted into each well. They were incubated with the conditioned bacterial supernatants of RPMI-incubated L. lactis GEN3013 culture supernatants for 48 h at 37 °C in a 5% CO2 atmosphere. Finally, T cell proliferation was analyzed using flow cytometry.

2.10. Immune Cell Profiling

The experimental mice were sacrificed on day 15 after tumor cell implantation. We performed the dissection of tumor tissues into small pieces and transferred them to RPMI 1640 media (GIBCO) containing collagenase I (GIBCO, 2.5 mg/mL), collagenase II (GIBCO, 1.5 mg/mL), collagenase IV (GIBCO, 1 mg/mL), DNase 1 (Thermo Fisher, Waltham, MA, USA, 50 µg/mL), and hyaluronidase type IV-S (Sigma-Aldrich, Burlington, MA, USA, 0.25 mg/mL). The tumor tissues were incubated at 37 °C for 50 min, followed by filtration using a 70 µm cell strainer (BD Bioscience, San Jose, CA, USA). After homogenizing in RPMI 1640 medium, the spleen tissues were lysed in RBC lysis buffer (eBioscience, San Diego, CA, USA) and filtered using a 70 µm cell strainer. To block the Fc receptor, both the splenocytes and tumor cells were treated with anti-mouse CD16/CD32 (BD Biosciences, San Jose, CA, USA) for 10 min at 4 °C. After the assessment of cell viability and cell number, the antibody staining for surface markers was conducted. Then, fixation and permeabilization buffer (BioLegend, San Diego, CA, USA) solution was added, followed by antibody staining for intracellular markers.
The following antibodies were used to stain splenocytes and tumor cells: anti-CD45 (Biolegend, Cat# 103116), CD3 (Biolegend, Cat# 100218), NK1.1 (Biolegend, Cat# 108708), CD49b (Biolegend, Cat# 108910), CD4 (Biolegend, Cat#100422), CD25 (Biolegend, Cat#101904), FOXP3 (Invitrogen, Waltham, MA, Cat#17-5773-82), CD44 (Biolegend, Cat# 103008), CD62L (Biolegend, Cat#104412), and CD8a (Biolegend, Cat#100706). A CANTO II flow cytometer (BD Bioscience, Franklin Lakes, NJ, USA) was used for cell acquisition, and FlowJo software version 10.8.1 (TreeStar, San Carlos, CA, USA) was used for analysis. The detailed information about the dilutions and catalog numbers of the antibodies is provided in Table 1.

2.11. Quantitative PCR (qPCR) Analysis

The total RNA extraction was conducted from cancer cells using an RNeasy Plus Mini Kit (Qiagen, Germantown, MD, USA), and reverse transcription was conducted using a PrimeScript First Strand cDNA Synthesis Kit (Takara, Mountain View, CA, USA). The qPCR analysis was performed using SYBR Premix Ex Taq (Tli RNase H Plus) (Takara) and a CFX384 Touch instrument (Bio-Rad, Hercules, CA, USA). The primers used here were as follows: Ang1, FW 5′-CATTCTTCGCTGCCATTCTG-3′ and Rev 5′-GCACATTGCCCATGTTGAATC-3′; Ang2, FW 5′-TTAGCACAAAGGATTCGGACAAT-3′ and Rev 5′-TTTTGTGGGTAGTACTGTCCATTCA-3′. The PCR conditions used were as follows: initial denaturation was performed at 95 °C for 1 min; 35 cycles of denaturation (95 °C for 30 s), annealing (60 °C for 30 s), and extension (72 °C for 1 min) were performed; and a final extension at 72 °C for 1 min was performed. The detailed information about the primers and thermal conditions is provided in Table 2.

2.12. Statistical Analysis

The statistical significance among treated groups was determined by Tukey’s multiple comparisons test using one-way or two-way ANOVA or unpaired t-tests (Prism v9, GraphPad, San Diego, CA, USA). The statistical details are provided in the figure legends.

3. Results

3.1. Lactococcus lactis GEN3013 Induces Cell Death in Various Cancer Cell Types

To identify L. lactis strains with cytotoxicity against cancer, a cell viability assay using an MC38 cancer cell line was conducted with six different L. lactis strains, including strains that are commercially available and strains that were isolated from human stools in-house. Interestingly, each bacterial lysate, despite being classified into the same species, exerted differential cytotoxicity (Supplementary Figure S1A). The most effective strain was L. lactis GEN3013, which was obtained from a healthy donor. To confirm whether L. lactis GEN3013 could affect the growth of various cancer cell types, several human cancer cell line (Figure 1A) cultures were supplemented with L. lactis GEN3013 lysates. Compared with that of the PBS control (a negative control), L. lactis GEN3013 decreased the cell viability dose-dependently (Figure 1B and Supplementary Figure S1C). When L. lactis GEN3013 lysates were added to mouse cancer cell line cultures, it reduced the cancer cell viability dose-dependently (Figure 1C). Thus, L. lactis GEN3013 induced the cell death of various human and mouse cancer cells by interacting with them. We also confirmed that the conditioned bacterial supernatants of L. lactis GEN3013 could reduce the viability of MC38 cancer cells in a dose-dependent manner (Supplementary Figure S1B), indicating that L. lactis GEN3013 releases anticancer metabolites.
To elucidate potential anticancer metabolites derived from L. lactis GEN3013, we conducted metabolic profiling of the L. lactis GEN3013-derived metabolites. We discovered anticancer metabolites derived from the L. lactis GEN3013 cell lysates (Table 3). Some metabolites, such as vaccenic acid, s-adenosylmethionine, and oleic acid, could inhibit cancer cell growth and viability [35,36,37], and other metabolites, including methylthioadenosine, citrate, and betaine, could induce cancer cell apoptosis [38,39,40]. N, N-dimethylformamide inhibits the tumor invasion of tumor-associated macrophages by reducing ROS production [41]. GABA increases oxaliplatin sensitivity in human colon cancer cells [42] (Table S1). Based on previous studies, L. lactis GEN3013 may induce cancer cell death through its antitumor metabolites.

3.2. L. lactis GEN3013 Administration Inhibits Tumor Growth by Directly Affecting Cancer Cells

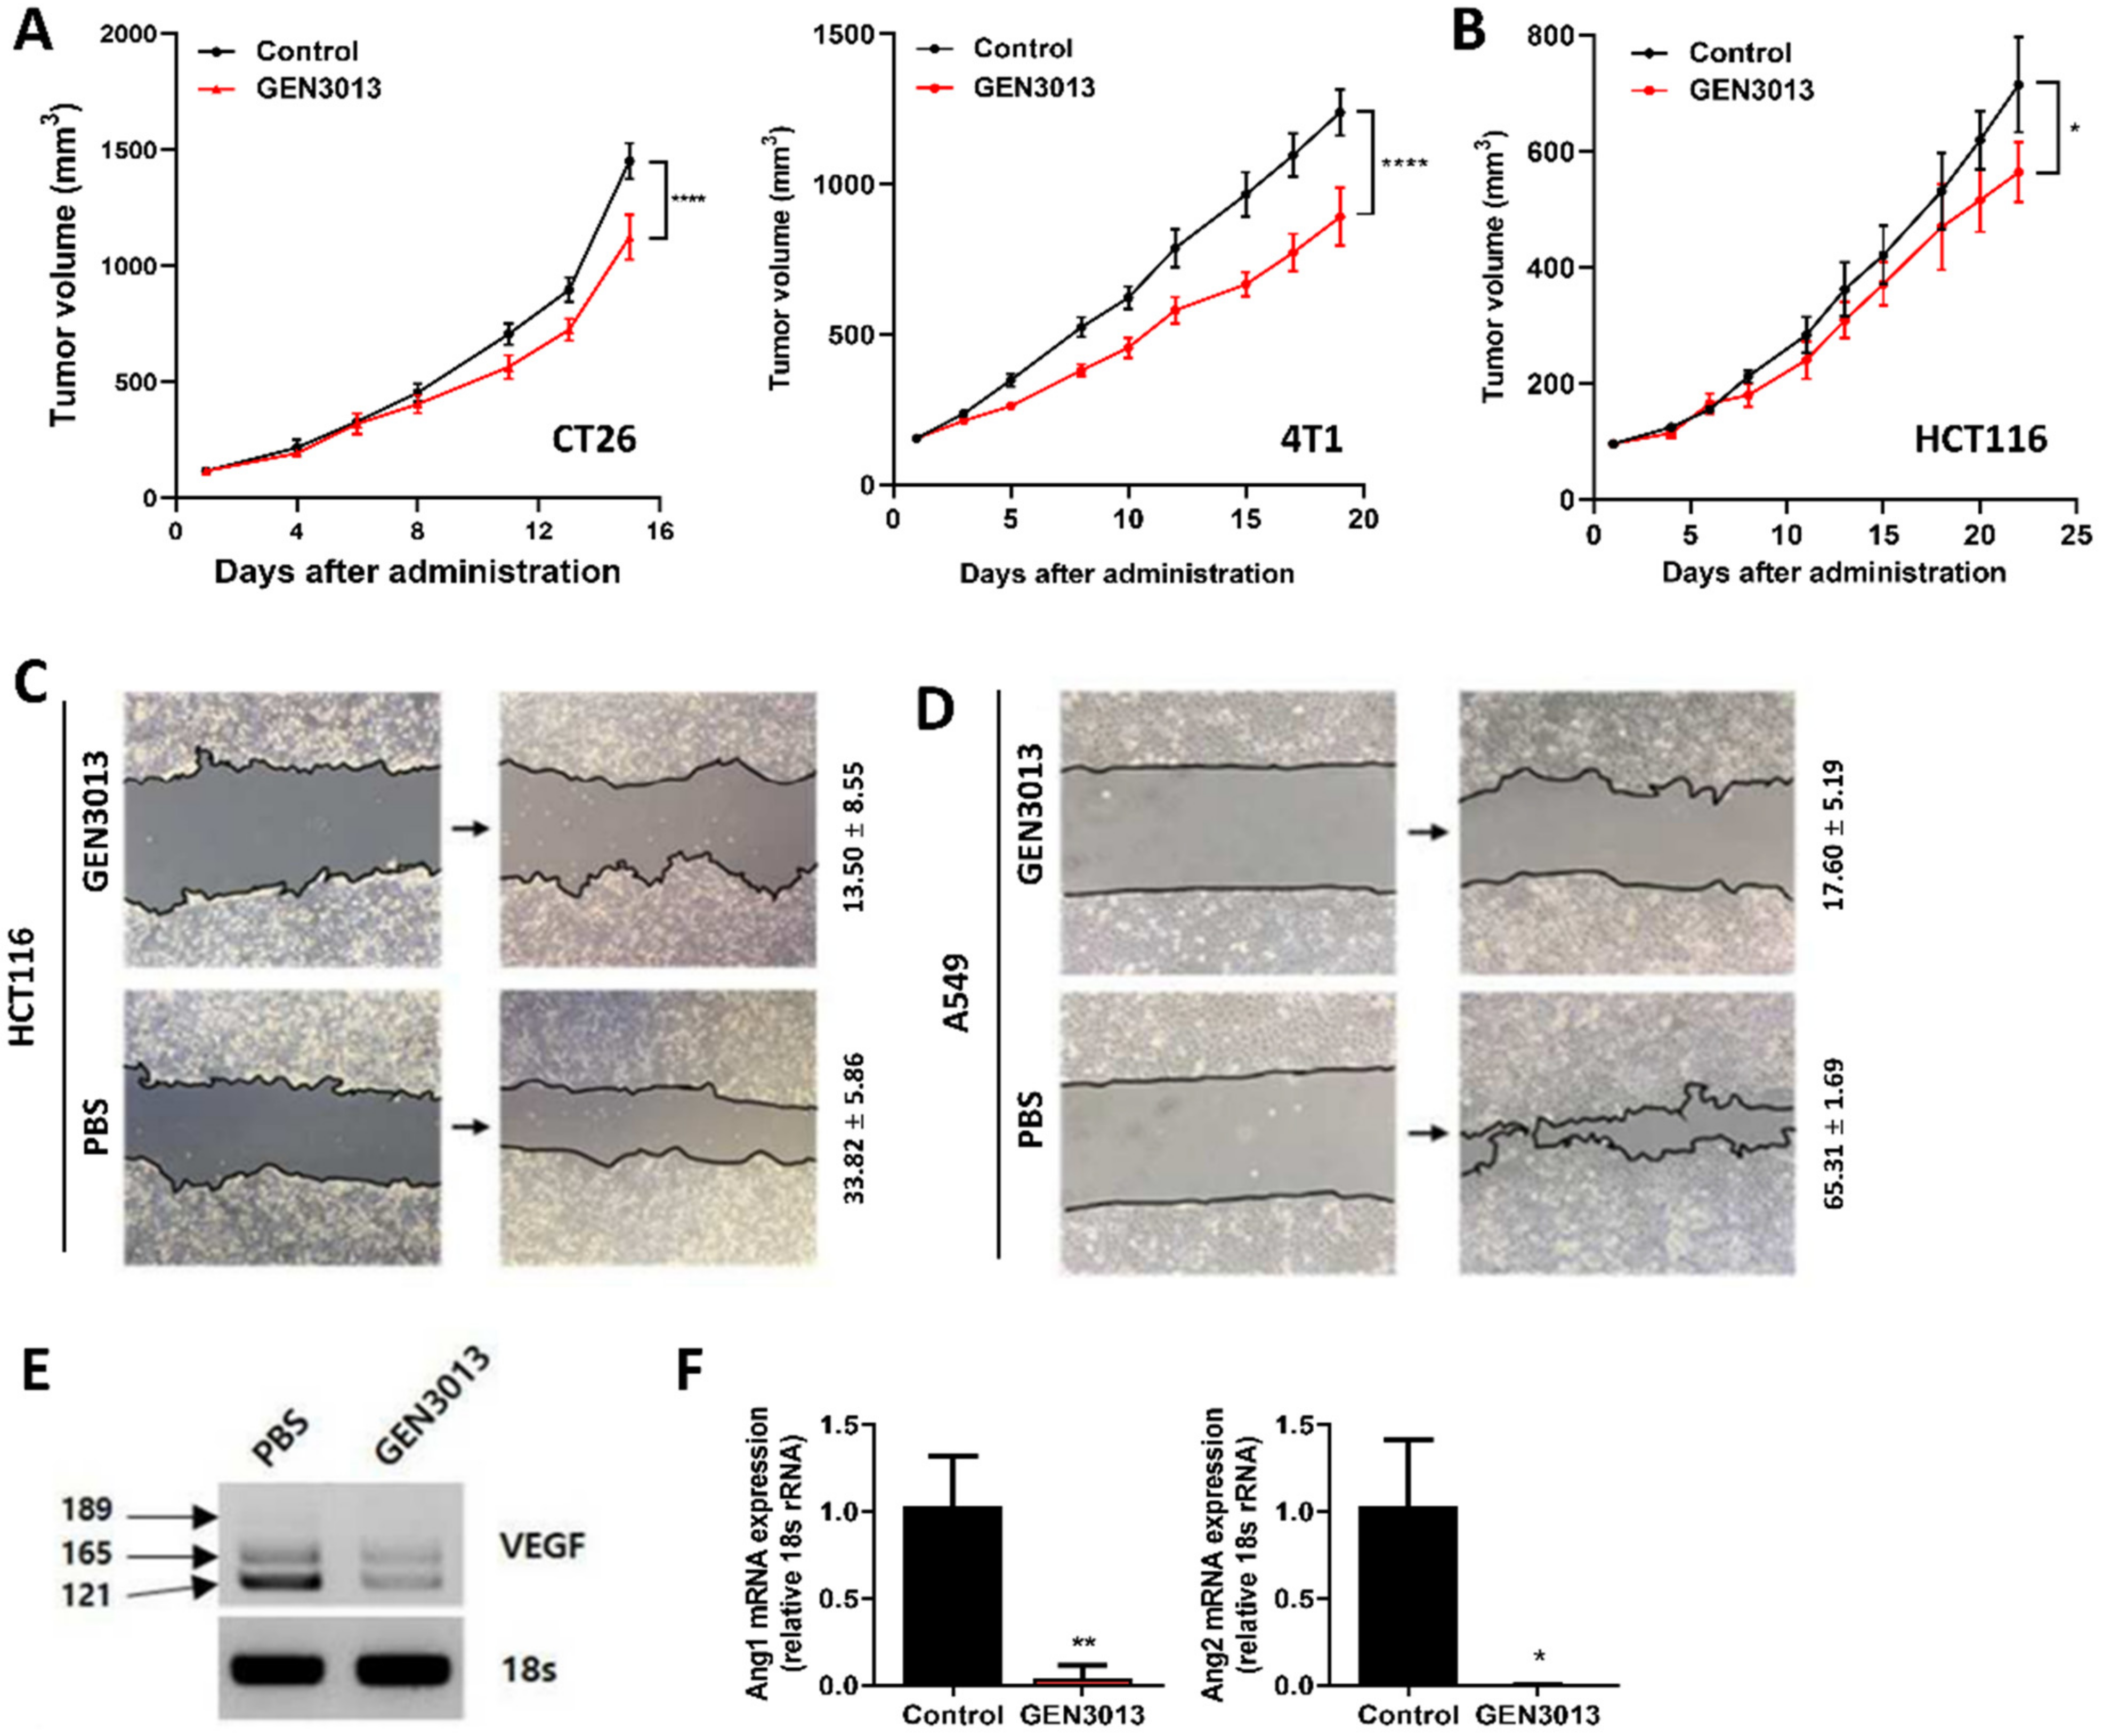
To understand whether L. lactis GEN3013 directly inhibited tumor growth in vivo similarly to the results found with in vitro assays, CT26 (mouse colon cancer) and 4T1 (mouse breast cancer) cells were subcutaneously inoculated into immune-deficient Balb/c nude mice, and then the mice were orally administered L. lactis GEN3013 daily. This showed that L. lactis GEN3013 significantly suppressed the tumor growth in both cell lines (Figure 2A). Similarly, L. lactis GEN3013 suppressed HCT116 human colon cancer cell growth in an immunodeficient mouse model (Figure 2B). Therefore, L. lactis GEN3013 could be used as a novel anticancer agent based on its direct killing effect on cancer cells.
To determine how L. lactis GEN3013 inhibits tumor growth in detail, we examined the cancer cell characteristics that were influenced by L. lactis GEN3013 treatment. Cancer cell migration is a typical process that is associated with tumor invasion and metastasis from the primary tumor to distant organs. For this reason, it was tested whether L. lactis GEN3013 affects the mobility of HCT116 and A549 cancer cells using a wound-healing assay and ImageJ processing analysis [43]. The mobility of HCT116 cancer cells markedly declined after L. lactis GEN3013 lysate treatment (13.50% ± 8.55%) compared to that after PBS treatment (33.82% ± 5.86%) (Figure 2C). In comparison to PBS treatment (65.31% ± 1.69%), the mobility of A549 cancer cells was markedly reduced after L. lactis GEN3013 lysate treatment (17.60% ± 5.19%) (Figure 2D). Treating MC38 cancer cells with the conditioned bacterial supernatant of L. lactis GEN3013 (26.91% ± 6.44%) also decreased the mobility of the cancer cells compared to the DMEM-MRS mixture control (43.59% ± 9.96%) and the no-treatment control (46.98% ± 7.62%) (Supplementary Figure S1D).
Another crucial phenotype of cancer progression is angiogenesis triggered by tumor-related signals, such as vascular endothelial growth factor (VEGF) and angiopoietin-1 and -2 (Ang1, Ang2). VEGF is involved in vasculogenesis and angiogenesis signaling. Furthermore, Ang1 is a critical factor contributing to blood vessel maturation. In contrast, Ang2 mediates tumor metastasis by enhancing vessel permeability to the point of blood vessel disruption, leading to leaky vessels. The leaky vessels enable cancer cells to penetrate the blood vessels, which is a critical step for the migration to distal organs. Therefore, we examined the expression of angiogenesis-related genes in L. lactis GEN3013-treated HCT116 cancer cells. L. lactis GEN3013 reduced the expression of VEGF, Ang1, and Ang2 (Figure 2E,F). These results suggest that L. lactis GEN3013 can prevent tumor growth by inhibiting cancer cell migration and angiogenesis.

3.3. L. lactis GEN3013 Enhances the Chemotherapy Therapeutic Effects

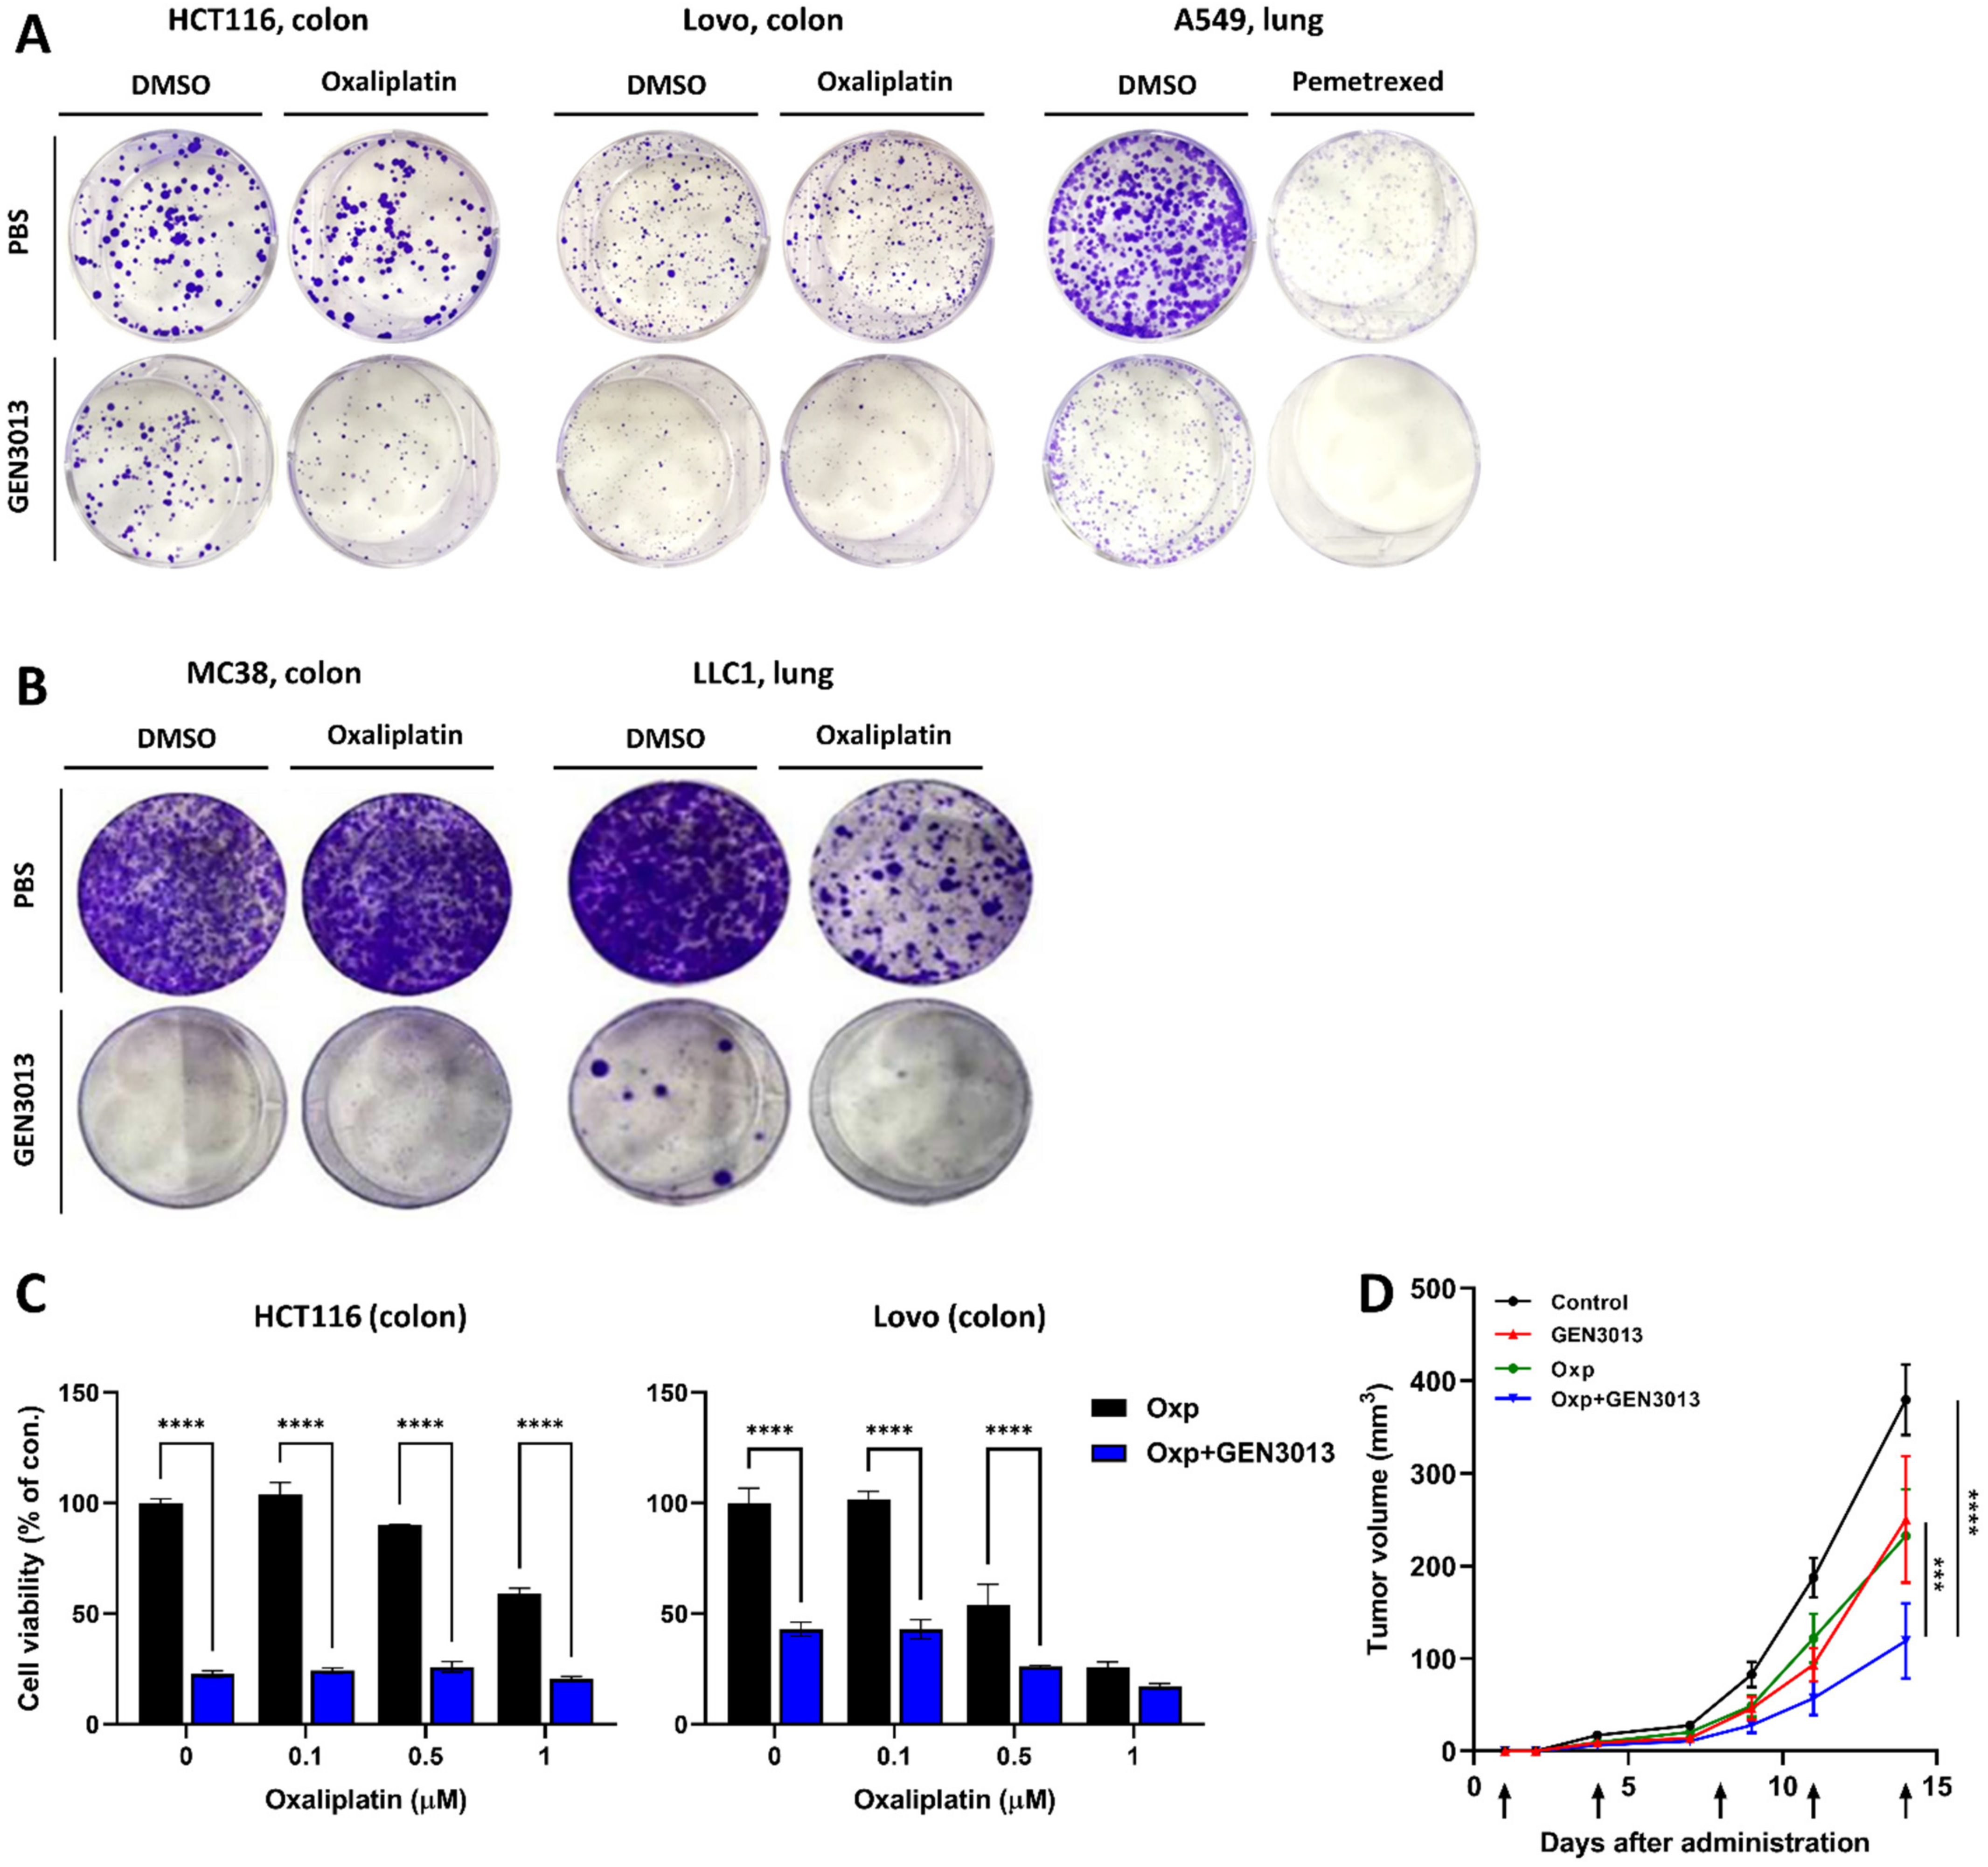
Oxaliplatin and pemetrexed have been approved by the US Food and Drug Administration as colorectal and lung cancer medication, respectively. Despite their effectiveness in treating both naïve and relapsed advanced cancer, a narrow therapeutic index limits their use; therefore, the development of combinatorial agents that can either enhance their efficacy or reduce the dose-limiting toxicity is needed. We tested whether the therapeutic effects of oxaliplatin or pemetrexed were enhanced by combination treatment with L. lactis GEN3013. The proliferation of human cancer cell lines (HCT116, colon; LoVo, colon; A549, lung) and murine cancer cell lines (MC38, colon; LLC1, lung) was inhibited by a single treatment with L. lactis GEN3013 and oxaliplatin or pemetrexed (Figure 3A,B). Moreover, a remarkable inhibitory effect was observed in the cancer cells treated with L. lactis GEN3013 and the anticancer drugs compared to the effect in those treated only with L. lactis GEN3013 or the anticancer drugs (Figure 3A,B). In the case of oxaliplatin, the dose limitation was overcome by co-treatment with L. lactis GEN3013 because it enhanced the cancer-killing effect at all concentrations in HCT116 and LoVo human colon cancer cells (Figure 3C). The combined effect of L. lactis GEN3013 and oxaliplatin was validated in a syngeneic mouse model. After prevention treatment with L. lactis GEN3013 for two weeks, the mice were subcutaneously inoculated with MC38 cancer cells. Then, the mice were orally administered L. lactis GEN3013 daily, and oxaliplatin was intra-peritoneally injected twice a week. The results showed that the anticancer effect of the L. lactis GEN3013 treatment alone was similar to that of the oxaliplatin treatment alone, and a synergetic effect occurred for the treatment with both L. lactis GEN3013 and oxaliplatin (Figure 3D).

3.4. Combination of L. lactis GEN3013 and Chemotherapy Reprograms the Host Immune System

Oxaliplatin induces immunogenic death in cancer cells [44,45], which is caused by chronic exposure to damage-associated molecular patterns. Immunogenic cell death can contribute to host antitumor immunity [46,47]. To examine whether antitumor immunity is enhanced by L. lactis GEN3013 treatment, we observed immune cell population changes in the spleen and tumor tissues. The tissues were dissected from MC38 tumor-bearing mice treated with control IgG, L. lactis GEN3013, oxaliplatin, and L. lactis GEN3013 with oxaliplatin. The levels of essential immune cells for antitumor immunity, such as CD4+ T cells, CD8+ effector T cells, and NK cells, were increased by L. lactis GEN3013 administration compared to those obtained via control IgG treatment in both the spleen and tumor microenvironments. In contrast, the number of regulatory T cells, known as suppressor T cells, was significantly decreased by the L. lactis GEN3013 treatment. These immune-boosting responses were significantly increased in the group that was administered L. lactis GEN3013 with oxaliplatin (Figure 4A,B). Therefore, L. lactis GEN3013 may be a suitable anticancer agent for combination therapy with chemotherapy to improve its therapeutic efficacy.

3.5. L. lactis GEN3013 Enhances the Therapeutic Effects of Immunotherapy

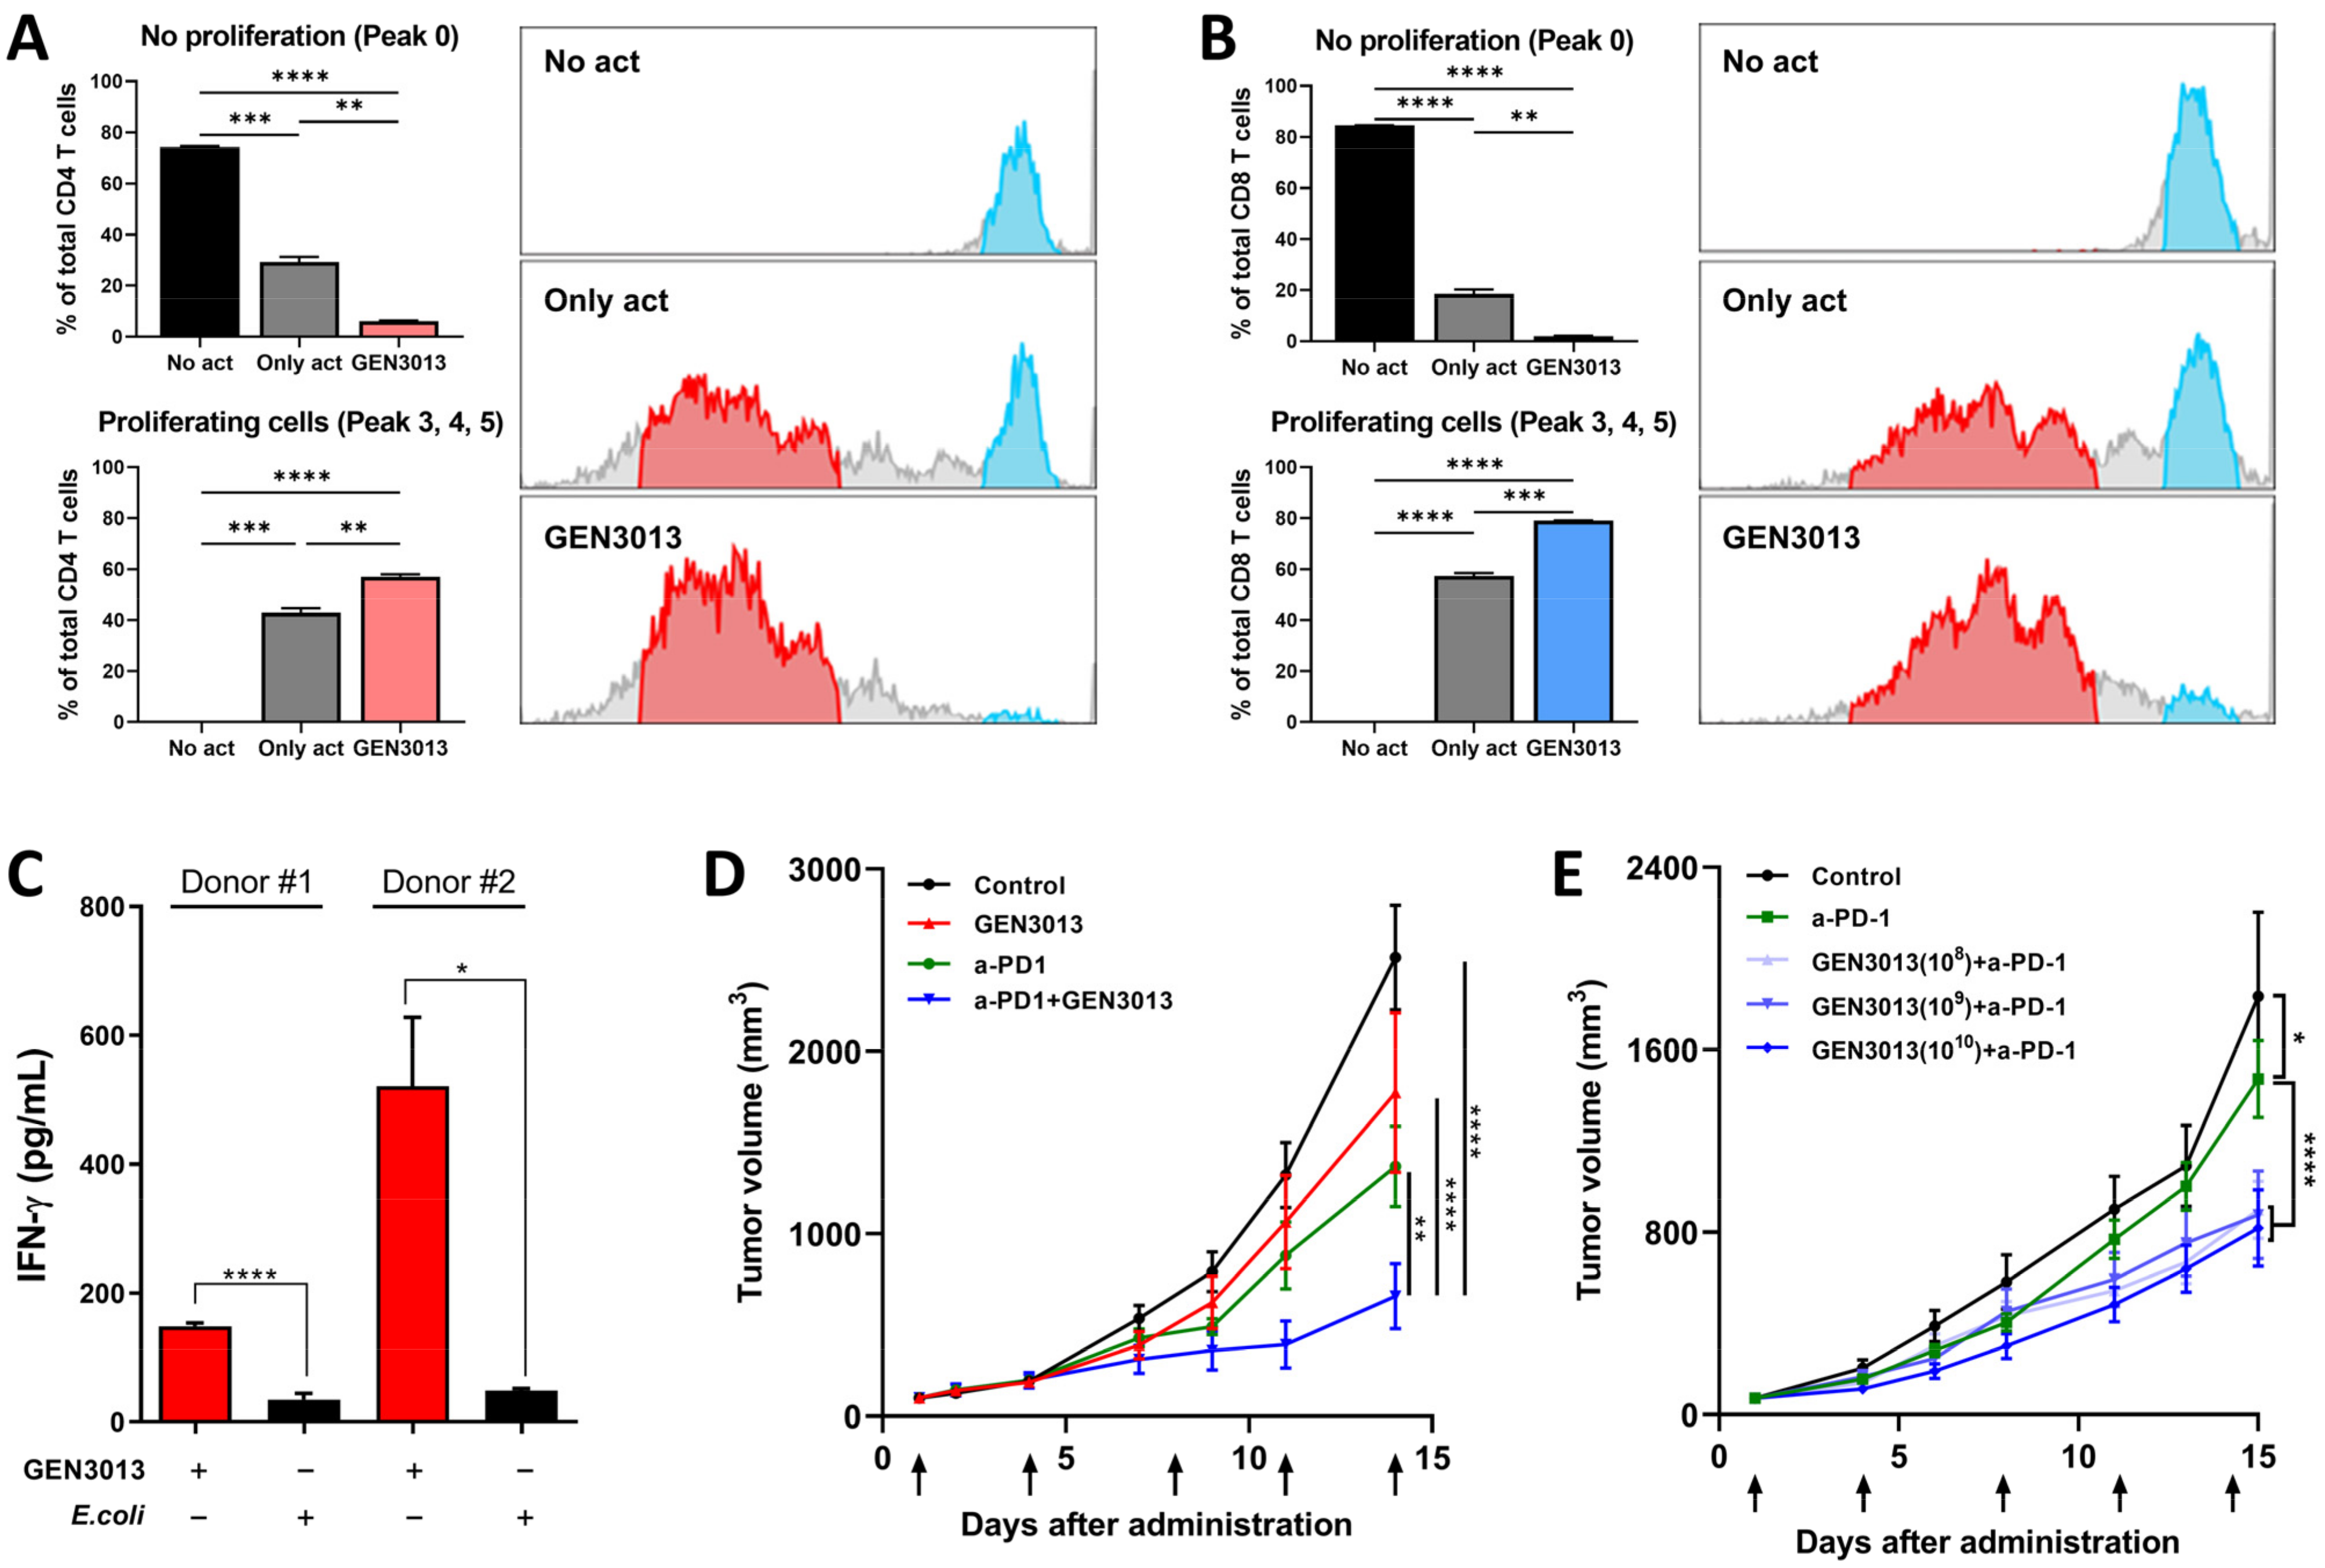
The discovery of immune checkpoints, such as PD-1, CTLA-4, LAG-3, and TIM-3, has shifted the cancer treatment paradigm by targeting cancer itself to modulate a tumor-associated immune response. Despite the dramatic antitumor efficacy of immunotherapy, almost 70–80% of patients do not respond to treatment. Specific bacterial strains improve the responsiveness to immune checkpoint inhibitors, which led us to analyze the antitumor immunity of L. lactis GEN3013. After isolating mouse CD4+ and CD8+ T cells from the spleen, the T cells were stained with CFSE dye to monitor cell proliferation. The conditioned bacterial supernatant of L. lactis GEN3013 was then added to each well and incubated with T cells for 3 days. Peak 0 (blue population) represents no proliferative cells, whereas peaks 3, 4, and 5 (red population) indicate actively proliferative cells (Figure 5A,B). In both CD4+ and CD8+ T cells, the static population decreased and the proliferative population increased after L. lactis GEN3013 treatment (Figure 5A,B). To confirm whether it was a L. lactis GEN3013-specific effect, two additional species (Eubacterium biforme and Coprococcus catus), which are known to be harmless to humans, were tested by a T cell proliferation assay. As with L. lactis GEN3013, the assay was conducted using RPMI-conditioned bacterial supernatants (Supplementary Figure S2C,D). E. biforme had no significant impact on the T cell proliferation, while C. catus suppressed the T cell proliferation, compared to the only-act control (Supplementary Figure S2E,F). This showed that not all bacteria species can activate or promote T cell proliferation; this is L. lactis GEN3013’s distinctive ability.
We tested whether L. lactis GEN3013 could boost the activity of human T cells. IFN-γ is an immune-activating cytokine secreted by cytotoxic T cells and is responsible for inhibiting tumor growth. IL-10 is an immune-suppressing cytokine secreted by regulatory T cells that is capable of disturbing cytotoxic T cell activity. L. lactis GEN3013 treatment increased the IFN-γ level by more than two times and decreased the IL-10 production by T cells compared to that of the negative control with E. coli (Figure 5C and Supplementary Figure S2A,B). These results indicate that L. lactis GEN3013 can boost immunity against tumors. Therefore, we confirmed that L. lactis GEN3013 can improve the effectiveness of conventional immunotherapy. In the same syngeneic mouse model system, a combination treatment with L. lactis GEN3013 and the PD-1 blockade reduced tumor growth more than the L. lactis GEN3013 treatment alone (Figure 5D,E). This indicates that L. lactis GEN3013 could help overcome limited responses to immunotherapy.

3.6. The Combination of L. lactis GEN3013 and Immunotherapy Reprograms the Host Immune System

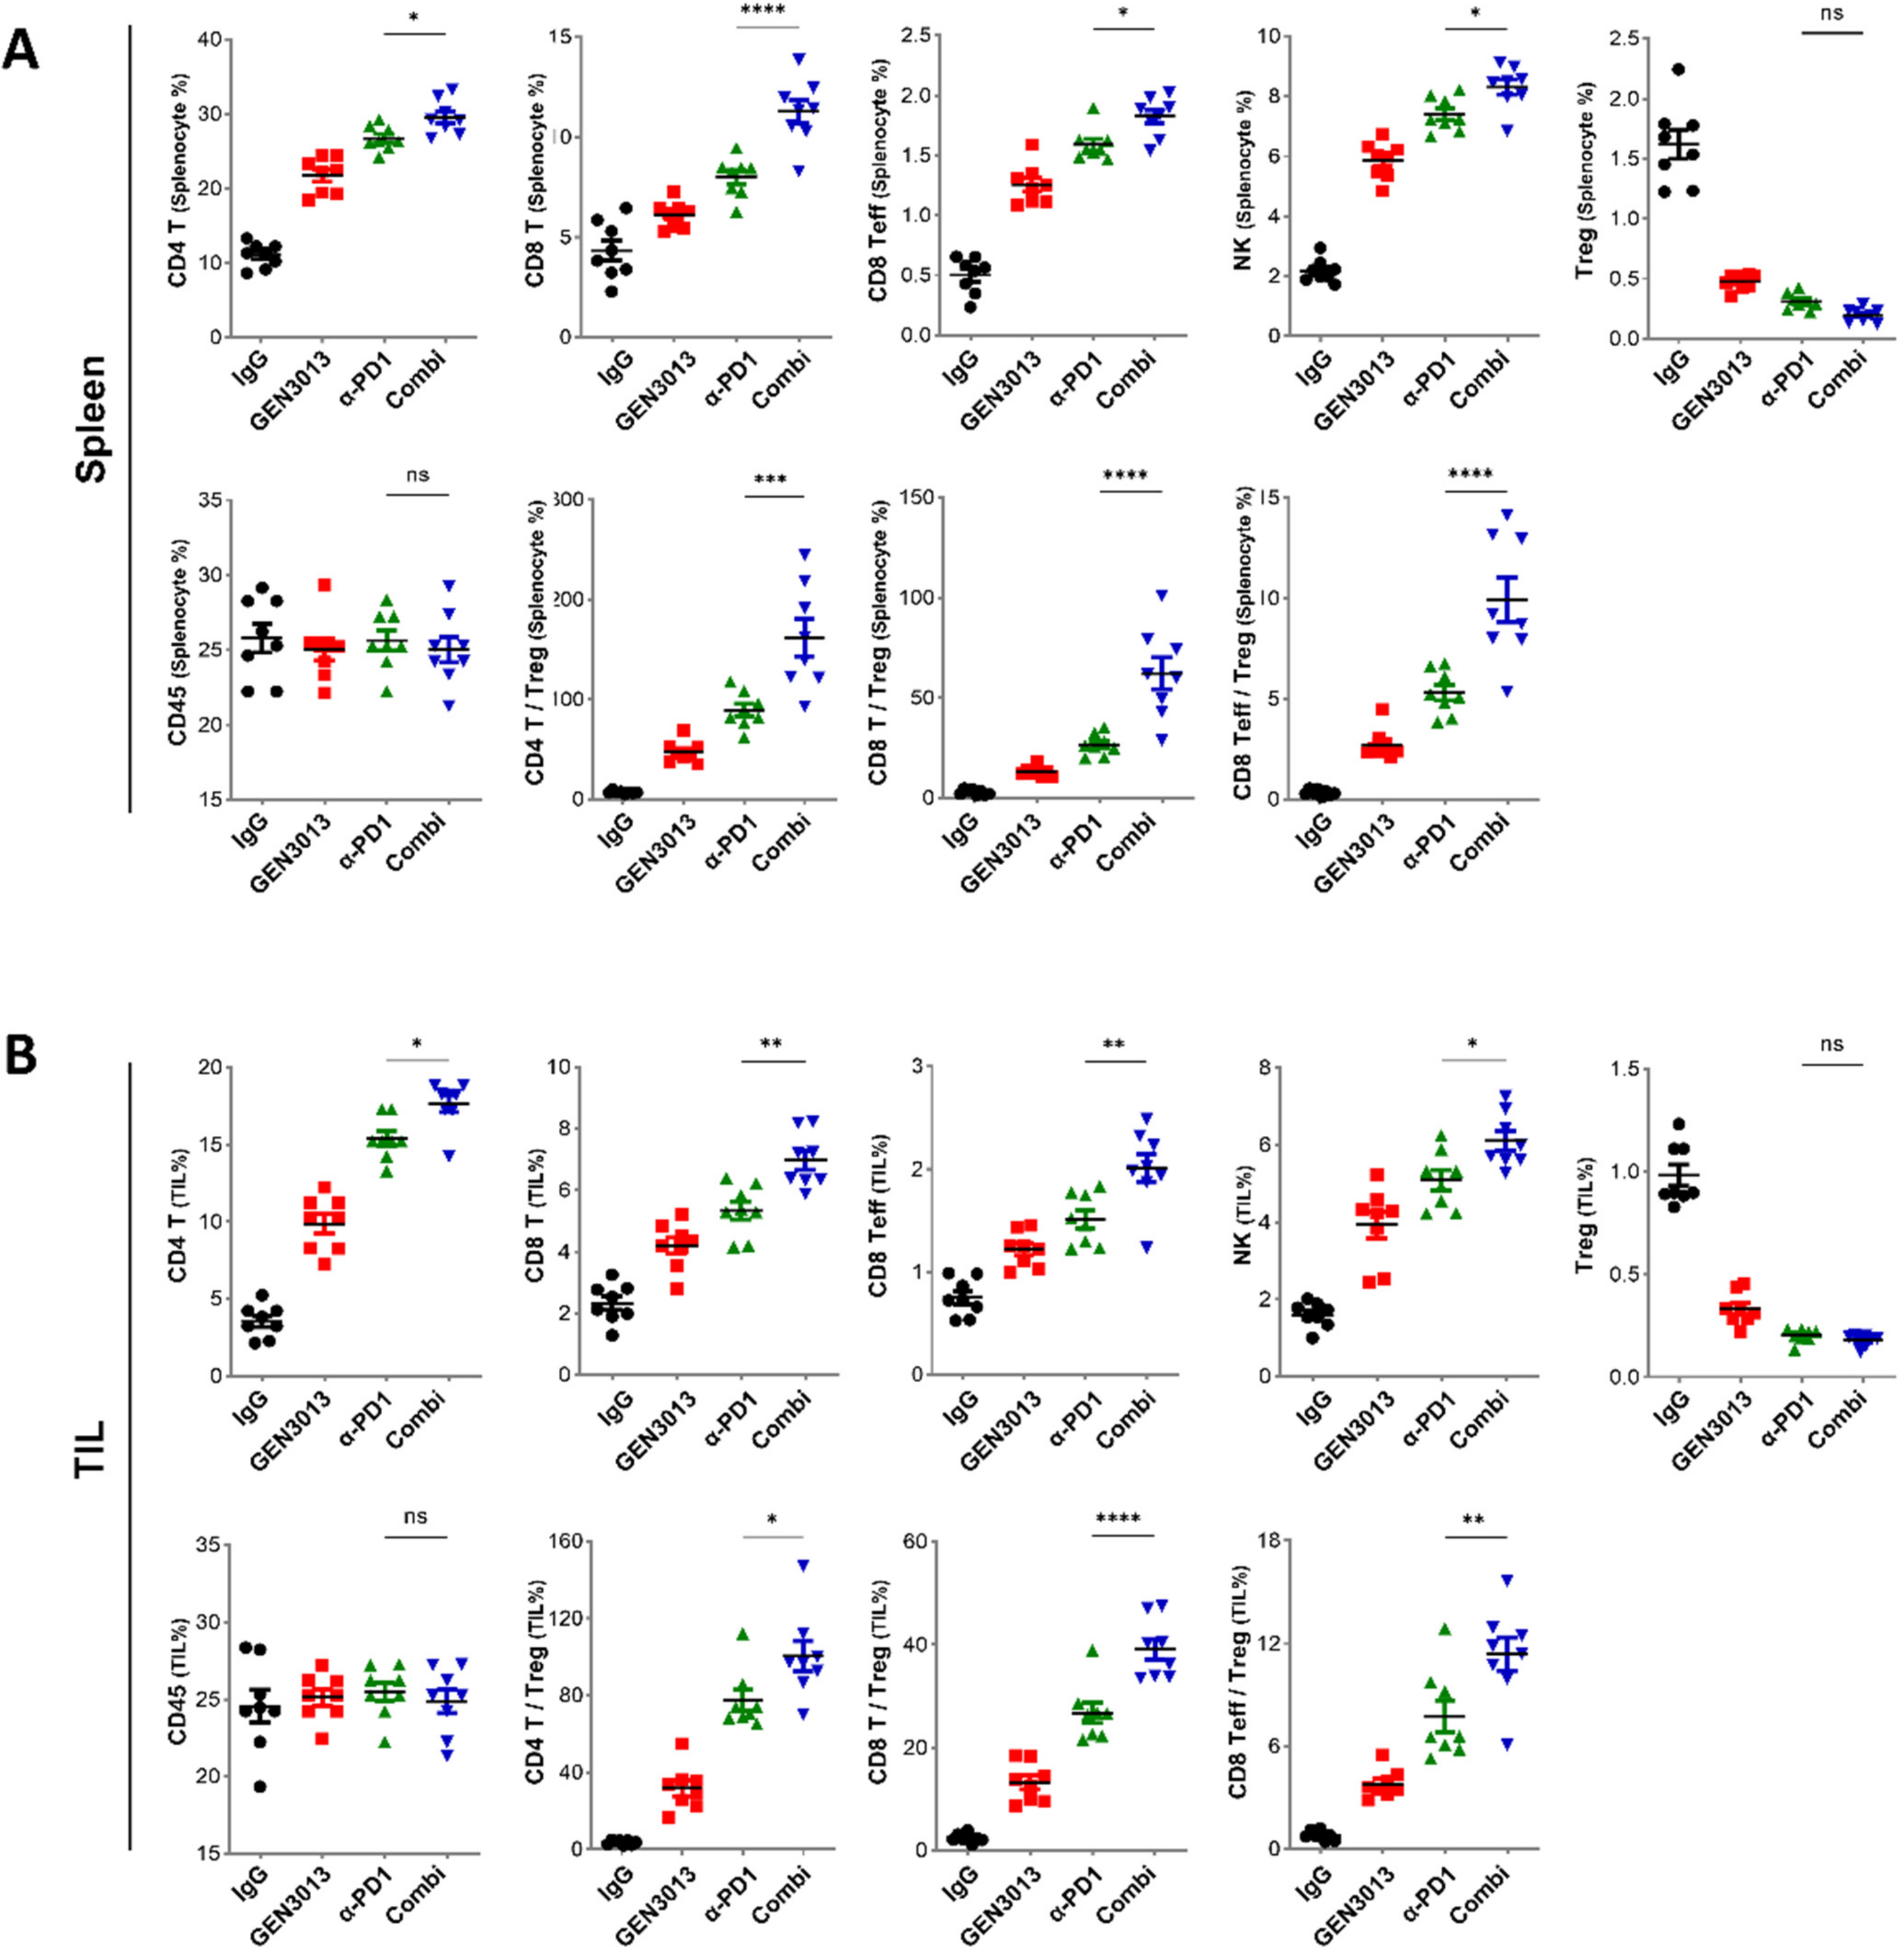
The responses to immune checkpoint (ICP) inhibitors are influenced by various factors, including the tumor’s mutational burden, neoantigens, PD-L1 expression, and tumor-infiltrating immune cells [48,49,50]. The presence of tumor-infiltrating lymphocytes (TILs) is a key factor for ICP inhibitor effectiveness [51,52]. Studies have found a longer progression-free survival or overall survival when high CD8+ TIL levels are present in patients with several cancer types [53,54]. In other studies, a specific subset of CD4+ T cells was associated with patient survival, and any loss of cells from this subset was associated with resistance to ICP inhibitor therapy [55,56]. Therefore, ICP inhibitors are believed to be more effective when cytotoxic immune cells infiltrate and are activated in the tumor microenvironment. We assessed the immune-boosting effects of L. lactis GEN3013 when administered in combination with immunotherapy. The co-treatment with L. lactis GEN3013 and the PD-1 blockade significantly increased the number of systemic immune cells in the spleen and the number of tumor-infiltrating T cells and NK cells in the tumor microenvironment (Figure 6A,B). These results indicate that L. lactis GEN3013 reprograms the host immune system to improve antitumor immunity when used alone or in combination with conventional immunotherapy. Overall, L. lactis GEN3013 may be a suitable anticancer agent for combination therapy with immunotherapy to improve its therapeutic effects.

4. Discussion

Cancer remains a major cause of death worldwide, accounting for nearly 10 million deaths in 2020 [57]. Therefore, appropriate and effective cancer treatments are required to improve the probability of survival and therapeutic efficacy. The gut microbiota is a key factor in the response to cancer therapy, since many studies have implied that gut dysbiosis contributes to carcinogenesis [58,59] and drug responsiveness [17,60]. Additionally, specific bacterial species and strains, but not all microbiota, have distinct antitumor immunity by modulating the systemic function or the function of TILs [61,62,63]. L. lactis GEN3013 showed antitumor effects by directly inhibiting the proliferation of cancer cells (Figure 1) and by improving host immunity (Figure 4 and Figure 6). Thus, L. lactis GEN3013 might be a promising antitumor agent and useful for combination therapy with other conventional cancer therapies.
Oxaliplatin and pemetrexed are well-known chemotherapy agents used for colon cancer and non-small cell lung cancer, respectively. These drugs have a narrow therapeutic index, implying that small changes in the drug dose could lead to serious side effects and treatment failure [64,65,66]. Oxaliplatin leads to dose-dependent toxicity in the hematopoietic and nervous systems, inducing anemia, thrombocytopenia, peripheral neuropathy, and pain [67]. Pemetrexed also has a dose limitation for cancer treatment because it can cause gastrointestinal side effects, such as nausea, vomiting, stomatitis, and diarrhea [68]. Up to 87% of patients given chemotherapy experienced adverse events during or after treatment [69,70]. Therefore, other modalities, such as the microbiota, are emerging to improve the efficacy of chemotherapy. A study revealed that Akkermansia muciniphila potentiated the antitumor efficacy of oxaliplatin through a specific branched-chain amino acid (BCAA) metabolite [71]. Here, L. lactis GEN3013 was identified as a reasonable combination treatment with chemotherapy because it improved the therapeutic effect of oxaliplatin (Figure 3).
Although immunotherapy has emerged as a powerful cancer treatment, only a minority of patients (20–40%) have responded to PD-1/PD-L1 blockade therapy [51,72,73]. Cytotoxic anticancer agents are frequently combined with immunotherapy to improve responsiveness, since these agents can be used to treat tumors with more mutations [74,75,76]. Recently, the microbiome has been considered a good immunotherapy combination agent because the gut microbiota can contribute to the host immune system, both locally and systemically. Bifidobacterium facilitates anti-PD-L1 efficacy by promoting antitumor immunity [17], and Bacteroides fragilis has been associated with CTLA-4 blockade efficacy [77]. Hence, we expected that L. lactis GEN3013 would enhance the antitumor efficacy of immunotherapy. It was validated that L. lactis GEN3013 boosted the host immune system (Figure 6) and increased the efficacy of the PD-1 blockade in a syngeneic mouse model (Figure 5D). Therefore, L. lactis GEN3013 is a promising anticancer agent for combination treatment with conventional immunotherapy.
Bevacizumab is a well-known anticancer agent used to treat several types of cancer, including colon, lung, and renal cancer. It is a monoclonal antibody that inhibits angiogenesis by suppressing VEGF-A expression. Despite its therapeutic effects, bevacizumab has severe side effects, such as gastrointestinal perforation, bleeding, and allergic reactions, and a limited response rate of approximately 40–50%. L. lactis GEN3013 may be used as a supplement to anti-angiogenesis agents, such as bevacizumab, because it directly reduces the expression of angiogenesis factors and the migration of cancer cells (Figure 2C–F).
Overall, we demonstrated that L. lactis GEN3013 could be used as a novel anticancer agent in monotherapy or combination therapy with chemotherapy or immunotherapy. However, there are limitations to this study. Despite discovering candidate metabolites of L. lactis GEN3013, (i) we did not identify the metabolites mainly responsible for the antitumor immunity. To understand the exact anticancer mechanism of L. lactis GEN3013, it is necessary to assess the effects of metabolites derived from L. lactis GEN3013 on cancer growth and immune activation through further investigation. These further experiments could reveal the elaborate molecular mechanisms of L. lactis GEN3013. Although we confirmed the L. lactis GEN3013 combination effects with oxaliplatin or PD-1 blockade, (ii) we did not observe the combination effects with pemetrexed or bevacizumab. In further research, we will demonstrate whether L. lactis GEN3013 can overcome the limitations of additional anticancer drugs by evaluating its combination effects.

5. Conclusions

In summary, we validated that L. lactis GEN3013 can be used as a live biotherapeutic agent without any genetic alterations. Because L. lactis GEN3013 reduced the proliferation of various cancer cells, we propose that L. lactis GEN3013 could be used as a monotherapy for cancer. Moreover, L. lactis GEN3013 could be utilized as a combination therapy agent with immunotherapy or chemotherapy. This is because it was confirmed that L. lactis GEN3013 improved the efficacy of conventional anticancer therapies in a syngeneic mouse model. Although we confirmed that L. lactis GEN3013 showed anticancer immunity, further studies on the elaborate molecular mechanisms of L. lactis GEN3013 are required for its development as an anticancer drug.

Supplementary Materials

The following supporting information can be downloaded at: https://www.mdpi.com/article/10.3390/cancers14174083/s1, Figure S1: Direct effects of Lactococcus lactis GEN3013 on cancer cell lines; Figure S2: Immune-boosting effects of Lactococcus lactis GEN3013. Table S1. Conditions for metabolic analysis of Lactococcus lactis GEN3013-derived metabolites.

Author Contributions

H.K. and H.P. designed the experiments; S.L. performed the cancer cell-based experiments; S.K. and Y.K. (Yunjae Kim) performed the immune cell-based experiments; S.L. and Y.K. (Yulha Kim) performed the mouse model-based experiments; B.J. performed the metabolic analysis for L. lactis GEN3013 lysates; H.K., S.K., Y.K. (Yunjae Kim) and H.P. wrote the manuscript. All authors have read and agreed to the published version of the manuscript.

Funding

This research received no external funding.

Institutional Review Board Statement

Animal experiments were performed with approval from the Institutional Animal Care and Use Committee of CHA University (permission number IACIC180010) and KLSbio (permission number KLSIACUC20210514-2-01, KLSIACUC20210730-3-01, KLSIACUC20210730-3-02, KLSIACUC20211115-4-01). The stool collection from healthy donors was approved by the Gwangju Institute of Science and Technology (GIST) with the institutional review board (20192009-BR-48-02-04).

Informed Consent Statement

Not applicable.

Data Availability Statement

The data that support the findings of this study are available from the corresponding author, H.P., upon reasonable request.

Acknowledgments

This work was supported by a GIST Research Institute (GRI) grant funded by the GIST in 2022 and Genome and Company (grant number GNC GR 17-01 to H.P.). This work was supported by the National Research Foundation of Korea (NRF) grant funded by the Korea government (MSIT) (No. 2022R1A2C2008976). We thank CHA Bio Complex and KLSbio for excellent guidance and assistance with the performed mouse experiments.

Conflicts of Interest

The authors declare no conflict of interest.

References

  1. Yamashiro, Y. Gut microbiota in health and disease. Ann. Nutr. Metab. 2017, 71, 242–246. [Google Scholar] [CrossRef] [PubMed]
  2. Amsterdam, D.; Ostrov, B.E. The impact of the microbiome on immunosenescence. Immunol. Investig. 2018, 47, 801–811. [Google Scholar] [CrossRef] [PubMed]
  3. Lin, L.; Zhang, J. Role of intestinal microbiota and metabolites on gut homeostasis and human diseases. BMC Immunol. 2017, 18, 2. [Google Scholar] [CrossRef]
  4. Lee, S.-H.; Cho, S.-Y.; Yoon, Y.; Park, C.; Sohn, J.; Jeong, J.-J.; Jeon, B.-N.; Jang, M.; An, C.; Lee, S. Bifidobacterium bifidum strains synergize with immune checkpoint inhibitors to reduce tumour burden in mice. Nat. Microbiol. 2021, 6, 277–288. [Google Scholar] [CrossRef] [PubMed]
  5. Gill, H.S.; Rutherfurd, K.J.; Cross, M.L.; Gopal, P.K. Enhancement of immunity in the elderly by dietary supplementation with the probiotic Bifidobacterium lactis HN019. Am. J. Clin. Nutr. 2001, 74, 833–839. [Google Scholar] [CrossRef]
  6. Zitvogel, L.; Daillère, R.; Roberti, M.P.; Routy, B.; Kroemer, G. Anticancer effects of the microbiome and its products. Nat. Rev. Microbiol. 2017, 15, 465–478. [Google Scholar] [CrossRef]
  7. Fulbright, L.E.; Ellermann, M.; Arthur, J.C. The microbiome and the hallmarks of cancer. PLoS Pathog. 2017, 13, e1006480. [Google Scholar] [CrossRef]
  8. Sethi, V.; Kurtom, S.; Tarique, M.; Lavania, S.; Malchiodi, Z.; Hellmund, L.; Zhang, L.; Sharma, U.; Giri, B.; Garg, B.; et al. Gut Microbiota Promotes Tumor Growth in Mice by Modulating Immune Response. Gastroenterology 2018, 155, 33–37.e6. [Google Scholar] [CrossRef]
  9. Gopalakrishnan, V.; Helmink, B.A.; Spencer, C.N.; Reuben, A.; Wargo, J.A. The Influence of the Gut Microbiome on Cancer, Immunity, and Cancer Immunotherapy. Cancer Cell. 2018, 33, 570–580. [Google Scholar] [CrossRef]
  10. Helmink, B.A.; Khan, M.A.W.; Hermann, A.; Gopalakrishnan, V.; Wargo, J.A. The microbiome, cancer, and cancer therapy. Nat. Med. 2019, 25, 377–388. [Google Scholar] [CrossRef]
  11. Peng, Z.; Cheng, S.; Kou, Y.; Wang, Z.; Jin, R.; Hu, H.; Zhang, X.; Gong, J.F.; Li, J.; Lu, M.; et al. The Gut Microbiome Is Associated with Clinical Response to Anti-PD-1/PD-L1 Immunotherapy in Gastrointestinal Cancer. Cancer Immunol. Res. 2020, 8, 1251–1261. [Google Scholar] [CrossRef] [PubMed]
  12. Rezasoltani, S.; Yadegar, A.; Aghdaei, H.A.; Zali, M.R. Modulatory effects of gut microbiome in cancer immunotherapy: A novel paradigm for blockade of immune checkpoint inhibitors. Cancer Med. 2021, 10, 1141–1154. [Google Scholar] [CrossRef] [PubMed]
  13. Gopalakrishnan, V.; Spencer, C.N.; Nezi, L.; Reuben, A.; Andrews, M.C.; Karpinets, T.V.; Prieto, P.A.; Vicente, D.; Hoffman, K.; Wei, S.C.; et al. Gut microbiome modulates response to anti-PD-1 immunotherapy in melanoma patients. Science 2018, 359, 97–103. [Google Scholar] [CrossRef] [PubMed]
  14. Routy, B.; Le Chatelier, E.; Derosa, L.; Duong, C.P.M.; Alou, M.T.; Daillère, R.; Fluckiger, A.; Messaoudene, M.; Rauber, C.; Roberti, M.P.; et al. Gut microbiome influences efficacy of PD-1-based immunotherapy against epithelial tumors. Science 2018, 359, 91–97. [Google Scholar] [CrossRef]
  15. Vivarelli, S.; Falzone, L.; Leonardi, G.C.; Salmeri, M.; Libra, M. Novel insights on gut microbiota manipulation and immune checkpoint inhibition in cancer. Int. J. Oncol. 2021, 59, 1–17. [Google Scholar] [CrossRef]
  16. Vivarelli, S.; Falzone, L.; Basile, M.S.; Nicolosi, D.; Genovese, C.; Libra, M.; Salmeri, M. Benefits of using probiotics as adjuvants in anticancer therapy. World Acad. Sci. J. 2019, 1, 125–135. [Google Scholar] [CrossRef]
  17. Sivan, A.; Corrales, L.; Hubert, N.; Williams, J.B.; Aquino-Michaels, K.; Earley, Z.M.; Benyamin, F.W.; Man Lei, Y.; Jabri, B.; Alegre, M.-L. Commensal Bifidobacterium promotes antitumor immunity and facilitates anti–PD-L1 efficacy. Science 2015, 350, 1084–1089. [Google Scholar] [CrossRef]
  18. Azizpour, M.; Hosseini, S.D.; Jafari, P.; Akbary, N. Lactococcus lactis: A New Strategy for Vaccination. Avicenna J. Med. Biotechnol. 2017, 9, 163–168. [Google Scholar]
  19. Bohlul, E.; Hasanlou, F.; Taromchi, A.H.; Nadri, S. TRAIL-expressing recombinant Lactococcus lactis induces apoptosis in human colon adenocarcinoma SW480 and HCT116 cells. J. Appl. Microb. 2019, 126, 1558–1567. [Google Scholar] [CrossRef]
  20. Zhang, B.; Li, A.; Zuo, F.; Yu, R.; Zeng, Z.; Ma, H.; Chen, S. Recombinant Lactococcus lactis NZ9000 secretes a bioactive kisspeptin that inhibits proliferation and migration of human colon carcinoma HT-29 cells. Microb. Cell Fact. 2016, 15, 102. [Google Scholar] [CrossRef]
  21. Bermúdez-Humarán, L.G.; Cortes-Perez, N.G.; Ah-Leung, S.; Lefèvre, F.; Yang, G.; Pang, Q.; Wu, C.; Zeng, Y.; Adel-Patient, K.; Langella, P. Current prophylactic and therapeutic uses of a recombinant Lactococcus lactis strain secreting biologically active interleukin-12. J. Mol. Microb. Biotechnol. 2008, 14, 80–89. [Google Scholar] [CrossRef] [PubMed]
  22. Liu, X.; Qi, L.; Lv, J.; Zhang, Z.; Zhou, P.; Ma, Z.; Wang, Y.; Zhang, Y.; Pan, L. The immune response to a recombinant Lactococcus lactis oral vaccine against foot-and-mouth disease virus in mice. Biotechnol. Lett. 2020, 42, 1907–1917. [Google Scholar] [CrossRef] [PubMed]
  23. Kim, S.Y.; Kim, J.E.; Lee, K.W.; Lee, H.J. Lactococcus lactis ssp. lactis inhibits the proliferation of SNU-1 human stomach cancer cells through induction of G0/G1 cell cycle arrest and apoptosis via p53 and p21 expression. Ann. N. Y. Acad. Sci. 2009, 1171, 270–275. [Google Scholar] [CrossRef]
  24. Kim, J.Y.; Woo, H.J.; Kim, Y.S.; Kim, K.H.; Lee, H.J. Cell cycle dysregulation induced by cytoplasm of Lactococcus lactis ssp lactis in SNUC2A, a colon cancer cell line. Nutr. Cancer 2003, 46, 197–201. [Google Scholar] [CrossRef] [PubMed]
  25. Kim, J.E.; Kim, S.Y.; Lee, K.W.; Lee, H.J. Arginine deiminase originating from Lactococcus lactis ssp. lactis American Type Culture Collection (ATCC) 7962 induces G1-phase cell-cycle arrest and apoptosis in SNU-1 stomach adenocarcinoma cells. Br. J. Nutr. 2009, 102, 1469–1476. [Google Scholar] [CrossRef] [PubMed]
  26. Han, K.J.; Lee, N.K.; Park, H.; Paik, H.D. Anticancer and Anti-Inflammatory Activity of Probiotic Lactococcus lactis NK34. J. Microb. Biotechnol. 2015, 25, 1697–1701. [Google Scholar] [CrossRef]
  27. Tay, R.E.; Richardson, E.K.; Toh, H.C. Revisiting the role of CD4+ T cells in cancer immunotherapy—New insights into old paradigms. Cancer Gene. Ther. 2021, 28, 5–17. [Google Scholar] [CrossRef] [PubMed]
  28. Raskov, H.; Orhan, A.; Christensen, J.P.; Gögenur, I. Cytotoxic CD8+ T cells in cancer and cancer immunotherapy. Br. J. Cancer 2021, 124, 359–367. [Google Scholar] [CrossRef]
  29. Jorgovanovic, D.; Song, M.; Wang, L.; Zhang, Y. Roles of IFN-γ in tumor progression and regression: A review. Biomark. Res. 2020, 8, 1–16. [Google Scholar] [CrossRef]
  30. Montfort, A.; Colacios, C.; Levade, T.; Andrieu-Abadie, N.; Meyer, N.; Ségui, B. The TNF paradox in cancer progression and immunotherapy. Front. Immunol. 2019, 10, 1818. [Google Scholar] [CrossRef]
  31. Jiang, T.; Zhou, C.; Ren, S. Role of IL-2 in cancer immunotherapy. Oncoimmunology 2016, 5, e1163462. [Google Scholar] [CrossRef] [PubMed]
  32. Nicholson, S.E.; Keating, N.; Belz, G.T. Natural killer cells and anti-tumor immunity. Mol. Immunol. 2019, 110, 40–47. [Google Scholar] [CrossRef] [PubMed]
  33. Ben-Shmuel, A.; Biber, G.; Barda-Saad, M. Unleashing natural killer cells in the tumor microenvironment–the next generation of immunotherapy? Front. Immunol. 2020, 11, 275. [Google Scholar] [CrossRef] [PubMed]
  34. Jewett, A.; Kos, J.; Kaur, K.; Safaei, T.; Sutanto, C.; Chen, W.; Wong, P.; Namagerdi, A.K.; Fang, C.; Fong, Y. Natural killer cells: Diverse functions in tumor immunity and defects in pre-neoplastic and neoplastic stages of tumorigenesis. Mol. Ther. Oncolytics 2020, 16, 41–52. [Google Scholar] [CrossRef]
  35. Lim, J.-N.; Oh, J.-J.; Wang, T.; Lee, J.-S.; Kim, S.-H.; Kim, Y.-J.; Lee, H.-G. Trans-11 18: 1 vaccenic acid (TVA) has a direct anti-carcinogenic effect on MCF-7 human mammary adenocarcinoma cells. Nutrients 2014, 6, 627–636. [Google Scholar] [CrossRef]
  36. Mahmood, N.; Arakelian, A.; Muller, W.J.; Szyf, M.; Rabbani, S.A. An enhanced chemopreventive effect of methyl donor S-adenosylmethionine in combination with 25-hydroxyvitamin D in blocking mammary tumor growth and metastasis. Bone Res. 2020, 8, 1–12. [Google Scholar] [CrossRef]
  37. Jiang, L.; Wang, W.; He, Q.; Wu, Y.; Lu, Z.; Sun, J.; Liu, Z.; Shao, Y.; Wang, A. Oleic acid induces apoptosis and autophagy in the treatment of Tongue Squamous cell carcinomas. Sci. Rep. 2017, 7, 11277. [Google Scholar] [CrossRef]
  38. Li, Y.; Wang, Y.; Wu, P. 5′-Methylthioadenosine and Cancer: Old molecules, new understanding. J. Cancer 2019, 10, 927. [Google Scholar] [CrossRef]
  39. Icard, P.; Coquerel, A.; Wu, Z.; Gligorov, J.; Fuks, D.; Fournel, L.; Lincet, H.; Simula, L. Understanding the central role of citrate in the metabolism of cancer cells and tumors: An update. Int. J. Mol. Sci. 2021, 22, 6587. [Google Scholar] [CrossRef]
  40. Kar, F.; Hacioglu, C.; Kacar, S.; Sahinturk, V.; Kanbak, G. Betaine suppresses cell proliferation by increasing oxidative stress–mediated apoptosis and inflammation in DU-145 human prostate cancer cell line. Cell Stress Chaperones 2019, 24, 871–881. [Google Scholar] [CrossRef]
  41. Li, Y.; Jia, Y.; Xu, Y.; Li, K. DMF Activates NRF2 to Inhibit the Pro-Invasion Ability of TAMs in Breast Cancer. Front. Oncol. 2021, 11, 706448. [Google Scholar] [CrossRef] [PubMed]
  42. Song, L.; Du, A.; Xiong, Y.; Jiang, J.; Zhang, Y.; Tian, Z.; Yan, H. γ-Aminobutyric acid inhibits the proliferation and increases oxaliplatin sensitivity in human colon cancer cells. Tumor. Biol. 2016, 37, 14885–14894. [Google Scholar] [CrossRef] [PubMed]
  43. Suarez-Arnedo, A.; Figueroa, F.T.; Clavijo, C.; Arbeláez, P.; Cruz, J.C.; Muñoz-Camargo, C. An image J plugin for the high throughput image analysis of in vitro scratch wound healing assays. PLoS ONE 2020, 15, e0232565. [Google Scholar]
  44. Tesniere, A.; Schlemmer, F.; Boige, V.; Kepp, O.; Martins, I.; Ghiringhelli, F.; Aymeric, L.; Michaud, M.; Apetoh, L.; Barault, L.; et al. Immunogenic death of colon cancer cells treated with oxaliplatin. Oncogene 2010, 29, 482–491. [Google Scholar] [CrossRef]
  45. Zhu, H.; Shan, Y.; Ge, K.; Lu, J.; Kong, W.; Jia, C. Oxaliplatin induces immunogenic cell death in hepatocellular carcinoma cells and synergizes with immune checkpoint blockade therapy. Cell Oncol. 2020, 43, 1203–1214. [Google Scholar] [CrossRef]
  46. Zhou, J.; Wang, G.; Chen, Y.; Wang, H.; Hua, Y.; Cai, Z. Immunogenic cell death in cancer therapy: Present and emerging inducers. J. Cell Mol. Med. 2019, 23, 4854–4865. [Google Scholar] [CrossRef]
  47. Aaes, T.L.; Vandenabeele, P. The intrinsic immunogenic properties of cancer cell lines, immunogenic cell death, and how these influence host antitumor immune responses. Cell Death Differ. 2021, 28, 843–860. [Google Scholar] [CrossRef]
  48. Łuksza, M.; Riaz, N.; Makarov, V.; Balachandran, V.P.; Hellmann, M.D.; Solovyov, A.; Rizvi, N.A.; Merghoub, T.; Levine, A.J.; Chan, T.A. A neoantigen fitness model predicts tumour response to checkpoint blockade immunotherapy. Nature 2017, 551, 517–520. [Google Scholar] [CrossRef]
  49. Taube, J.M.; Klein, A.; Brahmer, J.R.; Xu, H.; Pan, X.; Kim, J.H.; Chen, L.; Pardoll, D.M.; Topalian, S.L.; Anders, R.A. Association of PD-1, PD-1 ligands, and other features of the tumor immune microenvironment with response to anti–PD-1 therapy. Clin. Cancer Res. 2014, 20, 5064–5074. [Google Scholar] [CrossRef]
  50. Hwang, S.; Kwon, A.-Y.; Jeong, J.-Y.; Kim, S.; Kang, H.; Park, J.; Kim, J.-H.; Han, O.J.; Lim, S.M.; An, H.J. Immune gene signatures for predicting durable clinical benefit of anti-PD-1 immunotherapy in patients with non-small cell lung cancer. Sci. Rep. 2020, 10, 643. [Google Scholar] [CrossRef]
  51. Sharma, P.; Hu-Lieskovan, S.; Wargo, J.A.; Ribas, A. Primary, adaptive, and acquired resistance to cancer immunotherapy. Cell 2017, 168, 707–723. [Google Scholar] [CrossRef] [PubMed]
  52. Oba, T.; Long, M.D.; Keler, T.; Marsh, H.C.; Minderman, H.; Abrams, S.I.; Liu, S.; Ito, F. Overcoming primary and acquired resistance to anti-PD-L1 therapy by induction and activation of tumor-residing cDC1s. Nat. Commun. 2020, 11, 5415. [Google Scholar] [CrossRef] [PubMed]
  53. Hurkmans, D.P.; Kuipers, M.E.; Smit, J.; van Marion, R.; Mathijssen, R.H.; Postmus, P.E.; Hiemstra, P.S.; Aerts, J.G.; von der Thüsen, J.H.; van der Burg, S.H. Tumor mutational load, CD8+ T cells, expression of PD-L1 and HLA class I to guide immunotherapy decisions in NSCLC patients. Cancer Immunol. Immunother. 2020, 69, 771–777. [Google Scholar] [CrossRef] [PubMed]
  54. Emens, L.A.; Cruz, C.; Eder, J.P.; Braiteh, F.; Chung, C.; Tolaney, S.M.; Kuter, I.; Nanda, R.; Cassier, P.A.; Delord, J.-P. Long-term clinical outcomes and biomarker analyses of atezolizumab therapy for patients with metastatic triple-negative breast cancer: A phase 1 study. JAMA Oncol. 2019, 5, 74–82. [Google Scholar] [CrossRef] [PubMed]
  55. Kagamu, H.; Kitano, S.; Yamaguchi, O.; Yoshimura, K.; Horimoto, K.; Kitazawa, M.; Fukui, K.; Shiono, A.; Mouri, A.; Nishihara, F. CD4+ T-cell immunity in the peripheral blood correlates with response to anti-PD-1 therapy. Cancer Immunol. Res. 2020, 8, 334–344. [Google Scholar] [CrossRef]
  56. Borst, J.; Ahrends, T.; Bąbała, N.; Melief, C.J.; Kastenmüller, W. CD4+ T cell help in cancer immunology and immunotherapy. Nat. Rev. Immunol. 2018, 18, 635–647. [Google Scholar] [CrossRef]
  57. WHO. Assessing National Capacity for the Prevention and Control of Noncommunicable Diseases: Report of the 2019 Global Survey; WHO: Geneva, Switzerland, 2020. [Google Scholar]
  58. Garrett, W.S. Cancer and the microbiota. Science 2015, 348, 80–86. [Google Scholar] [CrossRef]
  59. Tsilimigras, M.C.; Fodor, A.; Jobin, C. Carcinogenesis and therapeutics: The microbiota perspective. Nat. Microbiol. 2017, 2, 1–10. [Google Scholar] [CrossRef]
  60. Viaud, S.; Saccheri, F.; Mignot, G.; Yamazaki, T.; Daillère, R.; Hannani, D.; Enot, D.P.; Pfirschke, C.; Engblom, C.; Pittet, M.J. The intestinal microbiota modulates the anticancer immune effects of cyclophosphamide. Science 2013, 342, 971–976. [Google Scholar] [CrossRef]
  61. Zheng, J.H.; Nguyen, V.H.; Jiang, S.-N.; Park, S.-H.; Tan, W.; Hong, S.H.; Shin, M.G.; Chung, I.-J.; Hong, Y.; Bom, H.-S. Two-step enhanced cancer immunotherapy with engineered Salmonella typhimurium secreting heterologous flagellin. Sci. Transl. Med. 2017, 9, eaak9537. [Google Scholar] [CrossRef]
  62. Kim, O.Y.; Park, H.T.; Dinh, N.T.H.; Choi, S.J.; Lee, J.; Kim, J.H.; Lee, S.-W.; Gho, Y.S. Bacterial outer membrane vesicles suppress tumor by interferon-γ-mediated antitumor response. Nat. Commun. 2017, 8, 626. [Google Scholar] [CrossRef] [PubMed]
  63. Kostic, A.D.; Chun, E.; Robertson, L.; Glickman, J.N.; Gallini, C.A.; Michaud, M.; Clancy, T.E.; Chung, D.C.; Lochhead, P.; Hold, G.L. Fusobacterium nucleatum potentiates intestinal tumorigenesis and modulates the tumor-immune microenvironment. Cell Host Microbe 2013, 14, 207–215. [Google Scholar] [CrossRef] [PubMed]
  64. Muller, P.Y.; Milton, M.N. The determination and interpretation of the therapeutic index in drug development. Nat. Rev. Drug Discov. 2012, 11, 751–761. [Google Scholar] [CrossRef] [PubMed]
  65. Tamargo, J.; Le Heuzey, J.-Y.; Mabo, P. Narrow therapeutic index drugs: A clinical pharmacological consideration to flecainide. Eur. J. Clin. Pharmacol. 2015, 71, 549–567. [Google Scholar] [CrossRef] [PubMed]
  66. Chen, L.; Chu, C.; Zhang, Y.-H.; Zheng, M.; Zhu, L.; Kong, X.; Huang, T. Identification of drug-drug interactions using chemical interactions. Curr. Bioinform. 2017, 12, 526–534. [Google Scholar] [CrossRef]
  67. Alcindor, T.; Beauger, N. Oxaliplatin: A review in the era of molecularly targeted therapy. Curr. Oncol. 2011, 18, 18–25. [Google Scholar] [CrossRef]
  68. Hanna, N.; Shepherd, F.A.; Fossella, F.V.; Pereira, J.R.; De Marinis, F.; Von Pawel, J.; Gatzemeier, U.; Tsao, T.C.Y.; Pless, M.; Muller, T. Randomized phase III trial of pemetrexed versus docetaxel in patients with non-small-cell lung cancer previously treated with chemotherapy. J. Clin. Oncol. 2004, 22, 1589–1597. [Google Scholar] [CrossRef]
  69. Pearce, A.; Haas, M.; Viney, R.; Pearson, S.-A.; Haywood, P.; Brown, C.; Ward, R. Incidence and severity of self-reported chemotherapy side effects in routine care: A prospective cohort study. PLoS ONE 2017, 12, e0184360. [Google Scholar]
  70. Montemurro, F.; Mittica, G.; Cagnazzo, C.; Longo, V.; Berchialla, P.; Solinas, G.; Culotta, P.; Martinello, R.; Foresto, M.; Gallizioli, S. Self-evaluation of adjuvant chemotherapy-related adverse effects by patients with breast cancer. JAMA Oncol. 2016, 2, 445–452. [Google Scholar] [CrossRef]
  71. Hou, X.; Zhang, P.; Du, H.; Chu, W.; Sun, R.; Qin, S.; Tian, Y.; Zhang, Z.; Xu, F. Akkermansia Muciniphila Potentiates the Antitumor Efficacy of FOLFOX in Colon Cancer. Front. Pharmacol. 2021, 12, 725583. [Google Scholar] [CrossRef]
  72. Hellmann, M.D.; Paz-Ares, L.; Caro, R.B.; Zurawski, B.; Kim, S.-W.; Costa, E.C.; Park, K.; Alexandru, A.; Lupinacci, L.; de la Mora Jimenez, E. Nivolumab plus ipilimumab in advanced non–small-cell lung cancer. New. Engl. J. Med. 2019, 381, 2020–2031. [Google Scholar] [CrossRef] [PubMed]
  73. Ferris, R.L.; Blumenschein, G., Jr.; Fayette, J.; Guigay, J.; Colevas, A.D.; Licitra, L.; Harrington, K.; Kasper, S.; Vokes, E.E.; Even, C. Nivolumab for recurrent squamous-cell carcinoma of the head and neck. N. Engl. J. Med. 2016, 375, 1856–1867. [Google Scholar] [CrossRef] [PubMed]
  74. Reck, M.; Rodríguez-Abreu, D.; Robinson, A.G.; Hui, R.; Csőszi, T.; Fülöp, A.; Gottfried, M.; Peled, N.; Tafreshi, A.; Cuffe, S. Pembrolizumab versus chemotherapy for PD-L1–positive non–small-cell lung cancer. N. Engl. J. Med. 2016, 375, 1823–1833. [Google Scholar] [CrossRef] [PubMed]
  75. Gandhi, L.; Garassino, M.C. Pembrolizumab plus chemotherapy in lung cancer. N. Engl. J. Med. 2018, 379, e18. [Google Scholar] [PubMed]
  76. Galluzzi, L.; Humeau, J.; Buqué, A.; Zitvogel, L.; Kroemer, G. Immunostimulation with chemotherapy in the era of immune checkpoint inhibitors. Nat. Rev. Clin. Oncol. 2020, 17, 725–741. [Google Scholar] [CrossRef] [PubMed]
  77. Vétizou, M.; Pitt, J.M.; Daillère, R.; Lepage, P.; Waldschmitt, N.; Flament, C.; Rusakiewicz, S.; Routy, B.; Roberti, M.P.; Duong, C.P. Anticancer immunotherapy by CTLA-4 blockade relies on the gut microbiota. Science 2015, 350, 1079–1084. [Google Scholar] [CrossRef]
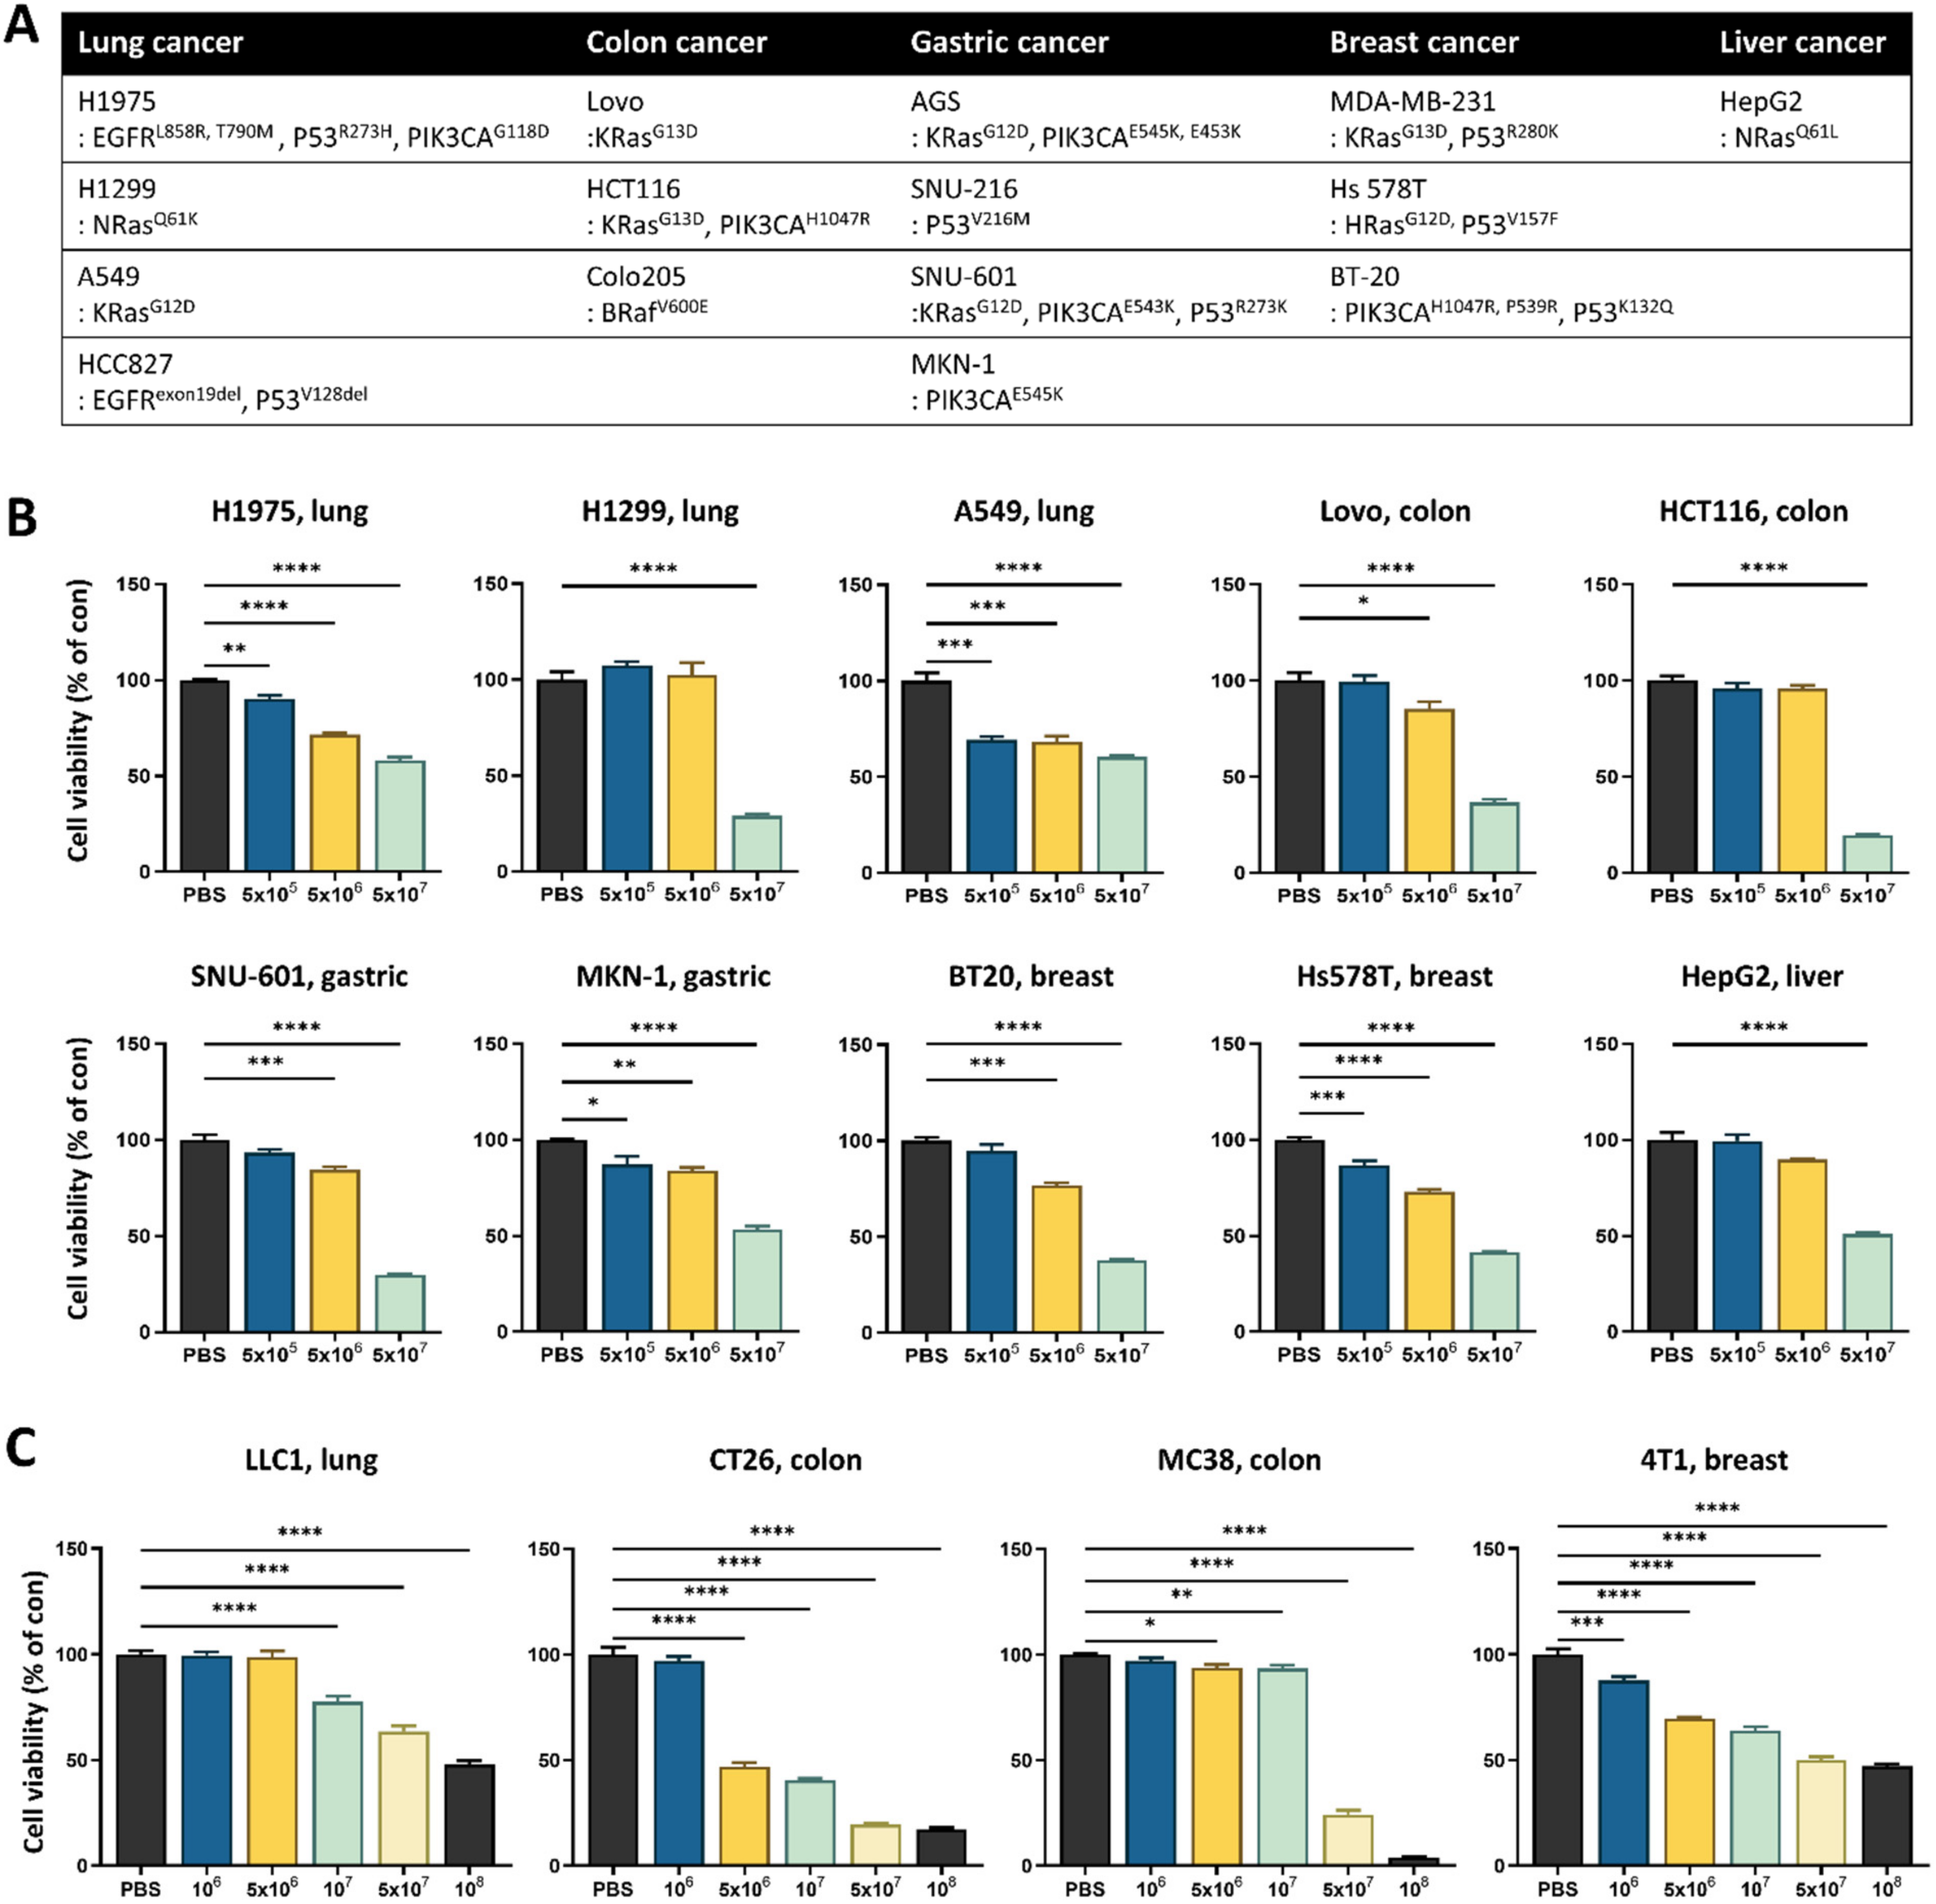
Figure 1. Lactococcus lactis GEN3013 induces the death of various cancer cells. (A) Human cancer cell lines were organized according to the cancer type and genetic characteristics. (B,C) Various human and mouse cancer cell lines were treated with 0.5% L. lactis GEN3013 dose-dependently and incubated for 72 h. Cell viability was measured using an MTT assay and calculated relative to a PBS control. All human and mouse cancer cells showed significant p-values (p ≤ 0.0001) according to one-way ANOVA tests. Data represent relative cell viability ± SEM; the p-values were calculated using one-way ANOVA with Tukey’s multiple comparison test compared to a PBS control; * p ≤ 0.05, ** p ≤ 0.01, *** p ≤ 0.001, and **** p ≤ 0.0001.
Cancers 14 04083 g001
Figure 2. Lactococcus lactis GEN3013 treatment prevents tumor growth through direct effects on cancer cells. (A) Nude mice were inoculated with mouse cancer cell lines, CT26 (N = 7 per group) and 4T1 (N = 10 per group), respectively, 14 days after the initial oral administration of L. lactis GEN3013. While L. lactis GEN3013 was orally administered daily to mice, the tumor growth was measured three times a week. L. lactis GEN3013 versus control: CT26, p ≤ 0.0001; 4T1, p ≤ 0.0001. (B) Nude mice were inoculated with HCT116 human cancer cells (N = 5 per group). L. lactis GEN3013 versus control: p = 0.0239. (C,D) The mobility of HCT116 cells or A549 cells was measured using a wound-healing assay and calculated relative to the status of the zero time point of cell damage. (C) L. lactis GEN3013 treatment, 13.50% ± 8.55%; PBS treatment, 33.82% ± 5.86%. (D) L. lactis GEN3013 treatment, 17.60% ± 5.19%; PBS treatment, 65.31% ± 1.69%. (E) VEGF expression in HCT116 cells was analyzed using a western blot. The levels of VEGF isoforms, including the 121, 165, and 189 isoforms, were detected. (F) The Ang1 and Ang2 mRNA expression was measured using quantitative PCR. L. lactis GEN3013-treated versus untreated: Ang1, p = 0.0047; Ang2, p = 0.0136. For all graphs, data are shown as the mean ± SEM and p-values are represented as * p ≤ 0.05, ** p ≤ 0.01, and **** p ≤ 0.0001. Statistical significance was determined using two-way ANOVA with Tukey’s test for multiple comparisons (A,B), or a two-sided unpaired t-test (F).
Cancers 14 04083 g002
Figure 3. Lactococcus lactis GEN3013 enhances the therapeutic effects of chemotherapy. (A,B) Cancer cell growth inhibition was observed using crystal violet staining. HCT116 and LoVo human colon cancer cells were treated with 0.1 μM oxaliplatin and A549 human lung cancer cells were treated with 0.05 μM pemetrexed. MC38 and LLC1 mouse cancer cell lines were cultured with 2 μM oxaliplatin. (C) The cell viability was measured after treating HCT116 and LoVo cancer cells with both oxaliplatin and L. lactis GEN3013. Oxaliplatin was administered dose-dependently (0, 0.1, 0.5 and 1 μM), while the L. lactis GEN3013 dose was fixed at 0.5%. All concentrations of oxaliplatin showed increased efficacy in combination with L. lactis GEN3013 in both HCT116 and LoVo cells (oxaliplatin versus oxaliplatin + L. lactis GEN3013, p ≤ 0.0001 at all concentrations, except for 1 μM oxaliplatin in LoVo cells). (D) C57BL/6 mice were inoculated with MC38 mouse cancer cells (N = 6–8 per group) 14 days after the initial oral administration of L. lactis GEN3013. While L. lactis GEN3013 was orally administered daily, oxaliplatin was intraperitoneally injected at 1, 4, 8, 11 and 14 days after tumor inoculation. Control versus oxaliplatin, p ≤ 0.0001; control versus L. lactis GEN3013, p ≤ 0.0001; control versus oxaliplatin + L. lactis GEN3013, p ≤ 0.0001; oxaliplatin versus oxaliplatin + L. lactis GEN3013, p = 0.0002; L. lactis GEN3013 versus oxaliplatin + L. lactis GEN3013, p = 0.0001, oxaliplatin versus L. lactis GEN3013, ns. For all graphs, data are shown as the mean ± SEM and p-values are represented as *** p ≤ 0.001 and **** p ≤ 0.0001. The statistical significance was determined using two-way ANOVA and Tukey’s test for multiple comparisons.
Cancers 14 04083 g003
Figure 4. Combination of Lactococcus lactis GEN3013 and chemotherapy reprograms the host immune system. (A,B) Changes in the immune cell population of the spleen (A) or the tumor microenvironment (B) were measured via immune cell profiling after the administration of L. lactis GEN3013, oxaliplatin, or their combination (N = 8 per each group). Oxaliplatin versus combination in the spleen tissues: CD4+ T cells, p = 0.0075; CD8+ T cells, p = 0.0238; effector CD8+ T cells, p = 0.0213; NK cells, p = 0.0455; Tregs, ns; CD45+ cells, ns; CD4+ T cells/Tregs ratio, p = 0.007; CD8+ T cells/Tregs ratio, p = 0.0069; effector CD8+ T cells/Tregs ratio, ns. Oxaliplatin versus combination in the tumor tissues: CD4+ T cells, p = 0.012; CD8+ T cells, p = 0.0155; effector CD8+ T cells, p = 0.0386; NK cells, p = 0.0022; Tregs, ns; CD45+ cells, ns; CD4+ T cells/Tregs ratio, p = 0.0087; CD8+ T cells/Tregs ratio, p = 0.0058; effector CD8+ T cells/Tregs ratio, p = 0.0085. For all graphs, data are shown as the mean ± SEM and p-values are represented as * p ≤ 0.05, ** p ≤ 0.01, and ns (not significant). The statistical significance was determined using one-way ANOVA and Tukey’s test for multiple comparisons.
Cancers 14 04083 g004
Figure 5. Lactococcus lactis GEN3013 enhances the therapeutic effects of immunotherapy. (A,B) Mouse T cell proliferation was measured using CFSE staining and flow cytometry. Blue population (right panel) represents no proliferative cells (peak 0), while the red population indicates actively proliferative cells (peaks 3, 4, and 5). The p-values for the peak 0 population in CD4+ T cells (p = 0.0002, p ≤ 0.0001, p = 0.0019), the peak 3, 4, and 5 populations in CD4+ T cells (p = 0.0003, p ≤ 0.0001, p = 0.0073), the peak 0 population in CD8+ T cells (p ≤ 0.0001, p ≤ 0.0001, p = 0.0033), and the peak 3, 4, and 5 populations in CD8+ T cells (p ≤ 0.0001, p ≤ 0.0001, p = 0.0004) were in the following order: no act versus only act, no act versus L. lactis GEN3013, and only act versus L. lactis GEN3013. (C) Human T cell activation was observed via ELISA of IFN-γ. E. coli versus L. lactis GEN3013: donor #1, p = 0.0001; donor #2, p = 0.0105. (D) C57BL/6 mice were inoculated with MC38 mouse cancer cells (N = 6 per group) 14 days after the initial oral administration of L. lactis GEN3013. L. lactis GEN3013 was orally administered daily, whereas the PD-1 blockade was intraperitoneally injected at 1, 4, 8, 11, and 14 days after tumor inoculation. Control versus PD-1 blockade, p ≤ 0.0001; control versus L. lactis GEN3013, p = 0.0019; control versus PD-1 blockade + L. lactis GEN3013, p ≤ 0.0001; PD-1 blockade versus PD-1 blockade + L. lactis GEN3013, p = 0.0051; L. lactis GEN3013 versus PD-1 blockade + L. lactis GEN3013, p ≤ 0.0001; PD-1 blockade versus L. lactis GEN3013, ns. (E) L. lactis GEN3013 was orally administered dose-dependently at 108, 109, and 1010 CFUs (N = 7 per group). Control versus PD-1 blockade, p = 0.0318; control versus L. lactis GEN3013 (all concentrations), p ≤ 0.0001; PD-1 blockade versus PD-1 blockade + L. lactis GEN3013 (all concentrations), p ≤ 0.0001. For all graphs, data are shown as the mean ± SEM and p-values are represented as * p ≤ 0.05, ** p ≤ 0.01, *** p ≤ 0.001, and **** p ≤ 0.0001. Statistical significance was determined using one-way (A,B) or two-way (D,E) ANOVA with Tukey’s test for multiple comparisons, or an unpaired t-test (C).
Cancers 14 04083 g005
Figure 6. Combination of Lactococcus lactis GEN3013 and immunotherapy reprograms the host immune system. (A,B) Changes in the immune cell population of the spleen (A) or the tumor microenvironment (B) were measured via immune cell profiling after the administration of L. lactis GEN3013, the PD-1 blockade, or their combination (N = 8 per each group). PD-1 blockade versus combination in the spleen tissues: CD4+ T cells, p = 0.0419; CD8+ T cells, p ≤ 0.0001; effector CD8+ T cells, p = 0.0257; NK cells, p = 0.0182; Tregs, ns; CD45+ cells, ns; CD4+ T cells/Tregs ratio, p ≤ 0.0001; CD8+ T cells/Tregs ratio, p ≤ 0.0001; effector CD8+ T cells/Tregs ratio, p ≤ 0.0001. PD-1 blockade versus combination in tumor tissues: CD4+ T cells, p = 0.019; CD8+ T cells, p = 0.0014; effector CD8+ T cells, p = 0.0031; NK cells, p = 0.0408; Tregs, ns; CD45+ cells, ns; CD4+ T cells/Tregs ratio, p = 0.021; CD8+ T cells/Tregs ratio, p ≤ 0.0001; effector CD8+ T cells/Tregs ratio, p = 0.0045. For all graphs, data are shown as the mean ± SEM and p-values are represented as * p ≤ 0.05, ** p ≤ 0.01, *** p ≤ 0.001, **** p ≤ 0.0001, and ns (not significant). Statistical significance was determined using one-way ANOVA with Tukey’s test for multiple comparisons.
Cancers 14 04083 g006
Table 1. The dilutions and catalog numbers of the antibodies of flow cytometry.
TargetConjugated FluorescentCompanyCatalog NumberUsage Dilution
CD45APC/Cyanin7Biolegend1031161/40
CD3PerCP/Cyanine5.5Biolegend1002181/20
NK1.1PEBiolegend1087081/40
CD49bAPCBiolegend1089101/40
CD4PE/Cyanine7Biolegend1004221/100
CD25PEBiolegend1019041/100
FOXP3APCInvitrogen17-5773-821/40
CD44PEBiolegend1030081/40
CD62LAPCBiolegend1044121/40
CD8aFITCBiolegend1007061/40
Table 2. The primers and thermal conditions of qPCR analysis.
TargetSequencePCR Thermal Conditions
Ang1FW5′-CATTCTTCGCTGCCATTCTG-3′95 °C1 minInitial denaturation
Rev5′-GCACATTGCCCATGTTGAATC-3′95 °C30 s35 cycles
60 °C30 s
Ang2FW5′-TTAGCACAAAGGATTCGGACAAT-3′72 °C1 min
Rev5′-TTTTGTGGGTAGTACTGTCCATTCA-3′72 °C1 minFinal extension
Table 3. Lactococcus lactis GEN3013-derived metabolites.
Composition of MRS MediaBacterial Lysatep-Value
Vaccenic acid0 ± 06.834 ± 0.023<0.001
S-Adenosylmethionine0 ± 06.759 ± 0.050<0.001
Oleic acid0 ± 05.014 ± 0.041<0.001
N,N-Dimethylformamide0 ± 05.206 ± 0.057<0.001
Methylthioadenosine0 ± 07.305 ± 0.027<0.001
Indole lactic acid0 ± 07.442 ± 0.088<0.001
GABA (gamma-aminobutyric acid)0 ± 05.425 ± 0.068<0.001
Citrate0 ± 06.443 ± 0.085<0.001
Betaine0 ± 05.802 ± 0.102<0.001
Normalized log10 and 5 technical replicates; statistical analysis was determined by Student’s t-test. Data are expressed as means ± SEMs.
Publisher’s Note: MDPI stays neutral with regard to jurisdictional claims in published maps and institutional affiliations.