Article

Molecular Profiles of Serum-Derived Extracellular Vesicles in High-Grade Serous Ovarian Cancer

1
Department of Genomic Medicine, The University of Texas MD Anderson Cancer Center, Houston, TX 77030, USA
2
Department of Gynecologic Oncology and Reproductive Medicine, The University of Texas MD Anderson Cancer Center, Houston, TX 77030, USA
3
Department of Genetics, The University of Texas MD Anderson Cancer Center, Houston, TX 77030, USA
*
Authors to whom correspondence should be addressed.
These authors equally contributed.
Current address: Department of Gynecologic Oncology, Sun Yat-sen Memorial Hospital, Sun Yat-sen University, Guangzhou 510275, China.
Cancers 2022, 14(15), 3589; https://doi.org/10.3390/cancers14153589
Submission received: 6 July 2022 / Revised: 18 July 2022 / Accepted: 20 July 2022 / Published: 23 July 2022
(This article belongs to the Special Issue Advances in Translational Ovarian Cancer Research)

Abstract

:

Simple Summary

Ovarian cancer is the deadliest gynecological malignancy worldwide, and the biggest issue faced by patients is disease relapse after primary treatment. Understanding up front how patients will respond to therapy is an important and compelling challenge. On these premises, our goal was to understand if a simple blood sample can give us this information, before the patients start chemotherapy. We determined that circulating extracellular vesicles isolated at diagnosis can distinguish between patients who will respond differently to the treatment. These results, if corroborated, will pave the way for a novel, much needed predictive marker of response.

Abstract

Patients with high-grade serous ovarian cancer (HGSC) who have no visible residual disease (R0) after primary surgery have the best clinical outcomes, followed by patients who undergo neoadjuvant chemotherapy (NACT) and have a response enabling interval cytoreductive surgery. Clinically useful biomarkers for predicting these outcomes are still lacking. Extracellular vesicles (EVs) have been recognized as liquid biopsy-based biomarkers for early cancer detection and disease surveillance in other disease settings. In this study, we performed extensive molecular characterization of serum-derived EVs and correlated the findings with therapeutic outcomes in patients with HGSC. Using EV-DNA whole-genome sequencing and EV-RNA sequencing, we identified distinct somatic EV-DNA alterations in cancer-hallmark genes and in ovarian cancer genes, as well as significantly altered oncogenic pathways between the R0 group and NACT groups. We also found significantly altered EV-RNA transcriptomic variations and enriched pathways between the groups. Taken together, our data suggest that the molecular characteristics of EVs could enable prediction of patients with HGSC who could undergo R0 surgery or respond to chemotherapy.

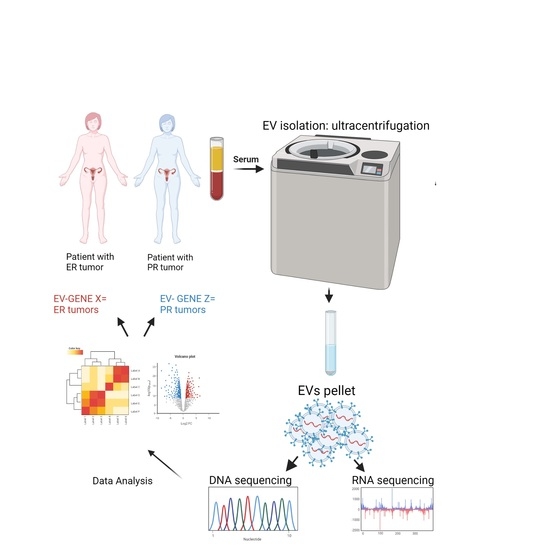
Graphical Abstract

1. Introduction

High-grade serous ovarian cancer (HGSC) is a deadly malignancy that lacks reliable biomarkers for diagnosis and prediction of chemotherapy response [1,2]. Patients with HGSC with no visible residual disease after primary surgery (complete gross resection, R0) have the best clinical outcomes, followed by patients who undergo neoadjuvant chemotherapy (NACT) and have a R0 resection at the interval surgery; the worse outcomes tend to occur in patients with residual disease at interval tumor reductive surgery [3,4]. However, the genomic features that best predict R0 surgery and drug response remain unclear, and practical methods for identifying such predictive biomarkers in clinical settings are lacking.
Through comprehensive multi-omics approaches, we have recently discovered significant distinct molecular abnormalities, cellular differences, and immune cell repertoire alterations between highly clinically defined groups of patients who had R0 resection versus those triaged to NACT [5,6]. Our results in tumor specimens point to important underlying biological differences in HGSCs considered resectable versus non-resectable, and in those that respond versus do not respond to NACT. However, identifying these molecular abnormalities and cellular changes requires a tumor tissue specimen. Thus, here, we explore options for testing a more practical liquid biopsy-based approach.
Late diagnosis at advanced stages and a high rate of recurrence after primary therapy represent major factors affecting poor prognosis, which makes compelling the identification of markers for early diagnosis and for patient stratification at primary assessment. Importantly, liquid biopsies have recently emerged as an effective and cost-efficient alternative or companion to the classic radiological and histological assessments in the diagnosis and monitoring of several cancer types. A series of tumor-derived liquid biopsy markers have been identified, and among them, extracellular vesicles (EVs) are quickly becoming one of the most prominent [7,8,9]. These membrane-coated vesicles are formed intracellularly and secreted extracellularly [7], and are generally distinguished according to their size as small EVs (also called exosomes, 50 to 150 nm in diameter), medium EVs (150 to 300 nm in diameter), and large EVs (300 to 1000 nm in diameter) [8]. EVs have brought enthusiasm to the field of translational biomarker research because of their potential for early detection and disease surveillance. EVs, which can be detected in serum, plasma, and ascites, carry molecules such as oncoproteins and oncopeptides; RNA species such as microRNAs (miRNAs), mRNAs, and long non-coding RNAs (ncRNAs); lipids; and DNA fragments. EVs have crucial roles in cancer development and cell-to-cell communication [9].
Despite the existence of FDA-approved tests that detect other liquid-biopsy components (such as circulating cancer cells) for use as diagnostic companions, these applications are often biased by the low specificity of the assays and by the potential confounding factor represented by hematopoietic precursors with clonal mutations [10]. Therefore, EVs represent a novel source of cancer-derived material, whose abundance and relative cancer specificity make them particularly attractive as diagnostic and prognostic markers. The purpose of the current study was to perform extensive molecular characterization of serum-derived EVs and correlate them with therapeutic outcomes in patients with HGSC. We identified distinct EV-DNA genomic and EV-RNA transcriptomic variations, as well as oncogenic pathways in whole-genome sequencing (WGS) and RNA-sequencing (RNA-seq) analyses of serum-derived EVs from clinically well-defined groups of patients with HGSC.

2. Materials and Methods

2.1. Patient Sample Collection

Blood samples for 24 patients treated under a systematic surgical algorithm at The University of Texas MD Anderson Cancer Center (Houston, TX, USA) were obtained from the Gynecologic Tumor Bank. The cohort considered for this study was composed of patients with advanced stage ovarian cancer who underwent a laparoscopic assessment to assess primary resectability; the algorithm and patient eligibility were previously described [5,6]. Patients had provided written informed consent under an approved protocol by the Institutional Review Board (LAB10-0850). Patients were classified into three groups based on treatment and response: primary surgery with complete gross resection (R0, n = 9); NACT (carboplatin and paclitaxel) with excellent tumor response, which was defined as optimal interval debulking surgery, with complete response according to the response evaluation criteria in solid tumors (RECIST 1.1) or only microscopic disease left at the time of interval surgery and/or pathology from interval surgery (NACT-ER, n = 8); or NACT with poor tumor response, defined as stable or progressive disease according to RECIST criteria and/or suboptimal interval cytoreduction after 3–4 cycles of NACT (NACT-PR, n = 7). Patient clinicopathological characteristics are reported in Supplementary Table S1.

2.2. Medium and Large EV Isolation from Serum

Serum-derived medium/large EVs (m/lEVs) from patient blood samples, obtained before treatment, were isolated following standard methods according to the International Society for Extracellular Vesicles [11]. In brief, 9 mL of PBS was added to 1 mL of serum per patient and lightly shaken overnight at 4 °C. After a first centrifugation at 300 relative centrifugal force (rcf) for 10 min, the supernatant was transferred to a new tube and subsequently spun at 2000 rcf for 20 min. The supernatant underwent ultracentrifugation at 10,000 rcf for 40 min, and the pellet, composed of m/lEVs, was collected. A final ultracentrifugation step at 10,000 rcf for 40 min was used to wash the pellet, which was then stored at –80 °C until DNA and RNA isolation was performed.

2.3. Medium and Large EV Characterization and Quantification

The patient-derived m/lEVs were characterized by both nanoparticle tracking analysis (NTA) and transmission electron microscopy (TEM) (Supplementary Figure S1). Isolated EV fractions were diluted and analyzed using NTA, to record their number and size. TEM was performed at MD Anderson’s High-Resolution Electron Microscopy Facility and was described previously [11,12]. In brief, formvar/carbon-coated mesh nickel grids were treated with a poly-L-lysine solution for 5 min, and excess solution was blotted with filter paper, to allow the grids to dry. The fixed samples were then added onto the grids, to allow small EVs to absorb for 1 h. Grids were rinsed with several drops of PBS five times, 3 min each, and incubated with 2% glutaraldehyde in PBS for 15 min. Grids were then rinsed with distilled water and incubated with 1% uranyl acetate, and they were allowed to dry before TEM examination. Samples were examined under a JEM 1010 transmission electron microscope (JEOL USA, Peabody, MA, USA) at an accelerating voltage of 80 kV.

2.4. Nucleic Acid Isolation from m/lEVs

EV-DNA was isolated using an XCF exosomal DNA isolation kit (catalogue no. XCF200A-1, System Biosciences, Palo Alto, CA, USA), and EV-RNA was isolated from the same patients using ExoRNeasy Midi and Maxi kits (catalogue no. 77023, Qiagen, Hilden, Germany), according to the manufacturer’s instructions. Samples were quantified and sent for analysis.

2.5. Whole-Genome Sequencing

Exosome whole-genome sequencing (WGS) was performed at the Advanced Technology Genomics Core at MD Anderson Cancer Center. Illumina libraries were prepared from 1 ng–200 ng of Diagenode Bioruptor Pico sheared exosome DNA, using a KAPA Hyper Library Preparation Kit (KAPA Biosystems, Inc., Wilmington, MA, USA). DNA fragmentation was performed. Libraries were amplified by eight cycles of PCR and assessed for size distribution (4200 TapeStation platform and High Sensitivity D1000 ScreenTape assay from Agilent Technologies, Santa Clara, CA, USA). Quantification of libraries was performed using a Qubit dsDNA HS Assay Kit (Thermo Fisher Scientific, Waltham, MA, USA). Multiplexing of equimolar quantities of the indexed libraries was performed, with four libraries per pool. A qPCR using a KAPA Library Quantification Kit (KAPA Biosystems, Wilmington, MA, USA) was used to quantify the pool, which was then sequenced on a NovaSeq 6000 SP Flow Cell (Illumina, San Diego, CA, USA) using the 100-nt paired-end format. The quality of extracted EV DNA was assessed using a High Sensitivity DNA TapeStation and quantified using a Qubit 2.0 RNA HS assay. DNA was sheared with an LE220 ultrasonicator (Covaris, Woburn, MA, USA), and a library was generated with a NEBNext Ultra II DNA Library Prep Kit for Illumina (New England Biolabs, Ipswich, MA, USA), following the manufacturer’s instructions. The quantity of final libraries was determined using Qubit 2.0; the quality was assessed using the TapeStation D1000/ScreenTape. The size of the final library was about 430 bp, with an insert size of about 300 bp. Equimolar pooling of libraries was performed based on QC (quality control) values, and the libraries were sequenced on an Illumina NovaSeq S4 (read-length configuration of 150 paired ends for 1B paired-end reads per sample). Pair-end sequencing reads in FASTQ format were generated from BCL raw data using Illumina CASAVA software (v1.8.2). The reads were aligned to the hg19 human reference genome using the BWA tool (v0.7.5) [13]. The duplicate reads were removed using Picard tools (unpublished, http://broadinstitute.github.io/picard/ accessed on 18 November 2021), and local realignments were performed using GATK software (v4.1.1.0) [14]. The BAM files were then used for downstream analysis.

2.6. Mutation Calling and CNV Identification

The MuTect method (v1.1.4) [15] was used to identify somatic point variants, and the Pindel program (v0.2.4) [16] was used to identify somatic insertions and deletions. To eliminate common polymorphisms, we generated common normal sequence using in-house pooled normal sequence. A series of post-calling filtering was applied for somatic mutations: (a) variant allele frequency (VAF) ≥0.05 in the EV sample and ≤0.02 in the common normal sample, and (b) a population frequency threshold of 0.5%, to filter out common variants in the databases dbSNP129 [17], 1000 Genome Project [18], Exome Aggregation Consortium [19], and ESP6500 [20]. To understand the potential functional consequences of the detected variants, we annotated them using the Annovar tool [21] and the dbNSFP database [22] and compared them with dbSNP [23], ClinVar [24], COSMIC [25], and The Cancer Genome Atlas databases. Copy number variations (CNVs) were identified using the package HMMcopy [26]. The copy number log2 ratios of EV-DNA versus control were calculated across the entire capture regions and then subjected to segmentation using the Circular Binary Segmentation (CBS) method [27]. A cutoff of log2 ratio ≤−0.5 was applied to identify copy losses, and a log2 ratio ≥0.5 was applied for copy gains.

2.7. RNA Sequencing

Illumina-compatible low-input total RNA libraries were prepared using a SMARTer Stranded Total RNA-Seq Kit v2—Pico Input Mammalian (Takara Bio, San Jose, CA, USA) at the MD Anderson Cancer Genomics Core Laboratory. Briefly, 2–10 ng of total RNA was converted to cDNA using Takara’s SMART (Switching Mechanism at 5′ End of RNA Template) technology. Illumina adapters with specific barcodes were then added to the ds (double-stranded) cDNA using 12 cycles of PCR. The PCR products were purified using AmPure Beads (Beckman Coulter, Brea, CA, USA), and then ribosomal cDNA was depleted. The cDNA fragments were further enriched by 14 cycles of PCR using Illumina universal library primers, then purified to yield the final cDNA library. Libraries were pooled, four per pool, then sequenced on a NextSeq500 sequencer (Illumina) using the mid-output 150-cycle flow cell with the 75-nt paired-end format. The NGS library was built with SMARter Low-Input Total RNA-Seq. Raw sequencing data were converted to FASTQ files and aligned to the reference genome (hg19) using the Spliced Transcripts Alignment to a Reference (STAR) algorithm [28]. The HTSeq-count package was then utilized to generate raw read counts for each gene [29]. The DESeq2 package was used for data processing, normalization, and differential expression analysis following standard procedures [30]. The differentially expressed genes were selected by the criterion of log2 fold change (L2FC) ≤−1 or ≥1, and the cutoff for adjusted p-value was 0.05. The GSEA tool [31] was used for gene set enrichment analysis.

2.8. Statistical Analysis

As we previously described [6], to evaluate the statistical significance, Student’s t-test was used if the data fit a normal distribution. Otherwise, a Wilcoxon rank-sum test was used to test the differences between groups. The Benjamini–Hochberg method was used to control the false discovery rate. In transcriptomic analysis, the differential expression was evaluated using a negative binomial generalized linear model, as described by DESeq2, and logarithmic fold change and adjusted p-values were used for differentially expressed gene assessment.

3. Results

3.1. Patient Groups and Sequencing Data

The patient cohort and groups were previously reported [5,6]. In brief, a total of 24 patients were included in this study: nine patients who had no visible residual disease after primary surgery (R0), eight who had an excellent response to NACT (NACT-ER), and seven who had a poor response to NACT (NACT-PR) (Supplementary Table S1). For each patient, the isolated EV-DNA and EV-RNA were subjected to WGS and RNA-seq, respectively. The average coverage for WGS of EV-DNA was 10×, and the average coverage for RNA-seq of EV-RNA was 15×.

3.2. Somatic Alterations in EV-DNA

Somatic variants and CNVs were identified by comparing the EV-DNA versus a pooled common-normal sample. An average of 153 nonsynonymous somatic variants were identified from each sample. Based on a known list of ovarian cancer driver genes and cancer-hallmark genes (https://cancer.sanger.ac.uk/census#cl_sub_tables accessed on 6 December 2021), the somatic alteration landscape was plotted (Figure 1). Overall, seven ovarian cancer-associated genes were found to be altered among nine (38%) of the 24 EV-DNA samples (Figure 1A): TP53 (4, 17%), FAT3 (2, 8%), MLH1 (2, 8%), ARID1A (1, 4%), JAG2 (1, 4%), NOTCH3 (1, 4%), and PTEN (1, 4%). Figure 1B shows the altered cancer-hallmark genes; alterations were seen in 22 (92%) of the 24 samples. The most frequently altered genes were KMT2C (6, 25%), HNRNPA2B1 (4, 17%), NOTCH1 (4, 17%), and TP53 (4, 17%). The oncogenic pathway analysis (Figure 1C) further showed that the most frequently altered pathways were the RTK-RAS pathway (16, 67%), Hippo pathway (13, 54%), WNT pathway (13, 54%), and NOTCH pathway (12, 24%).
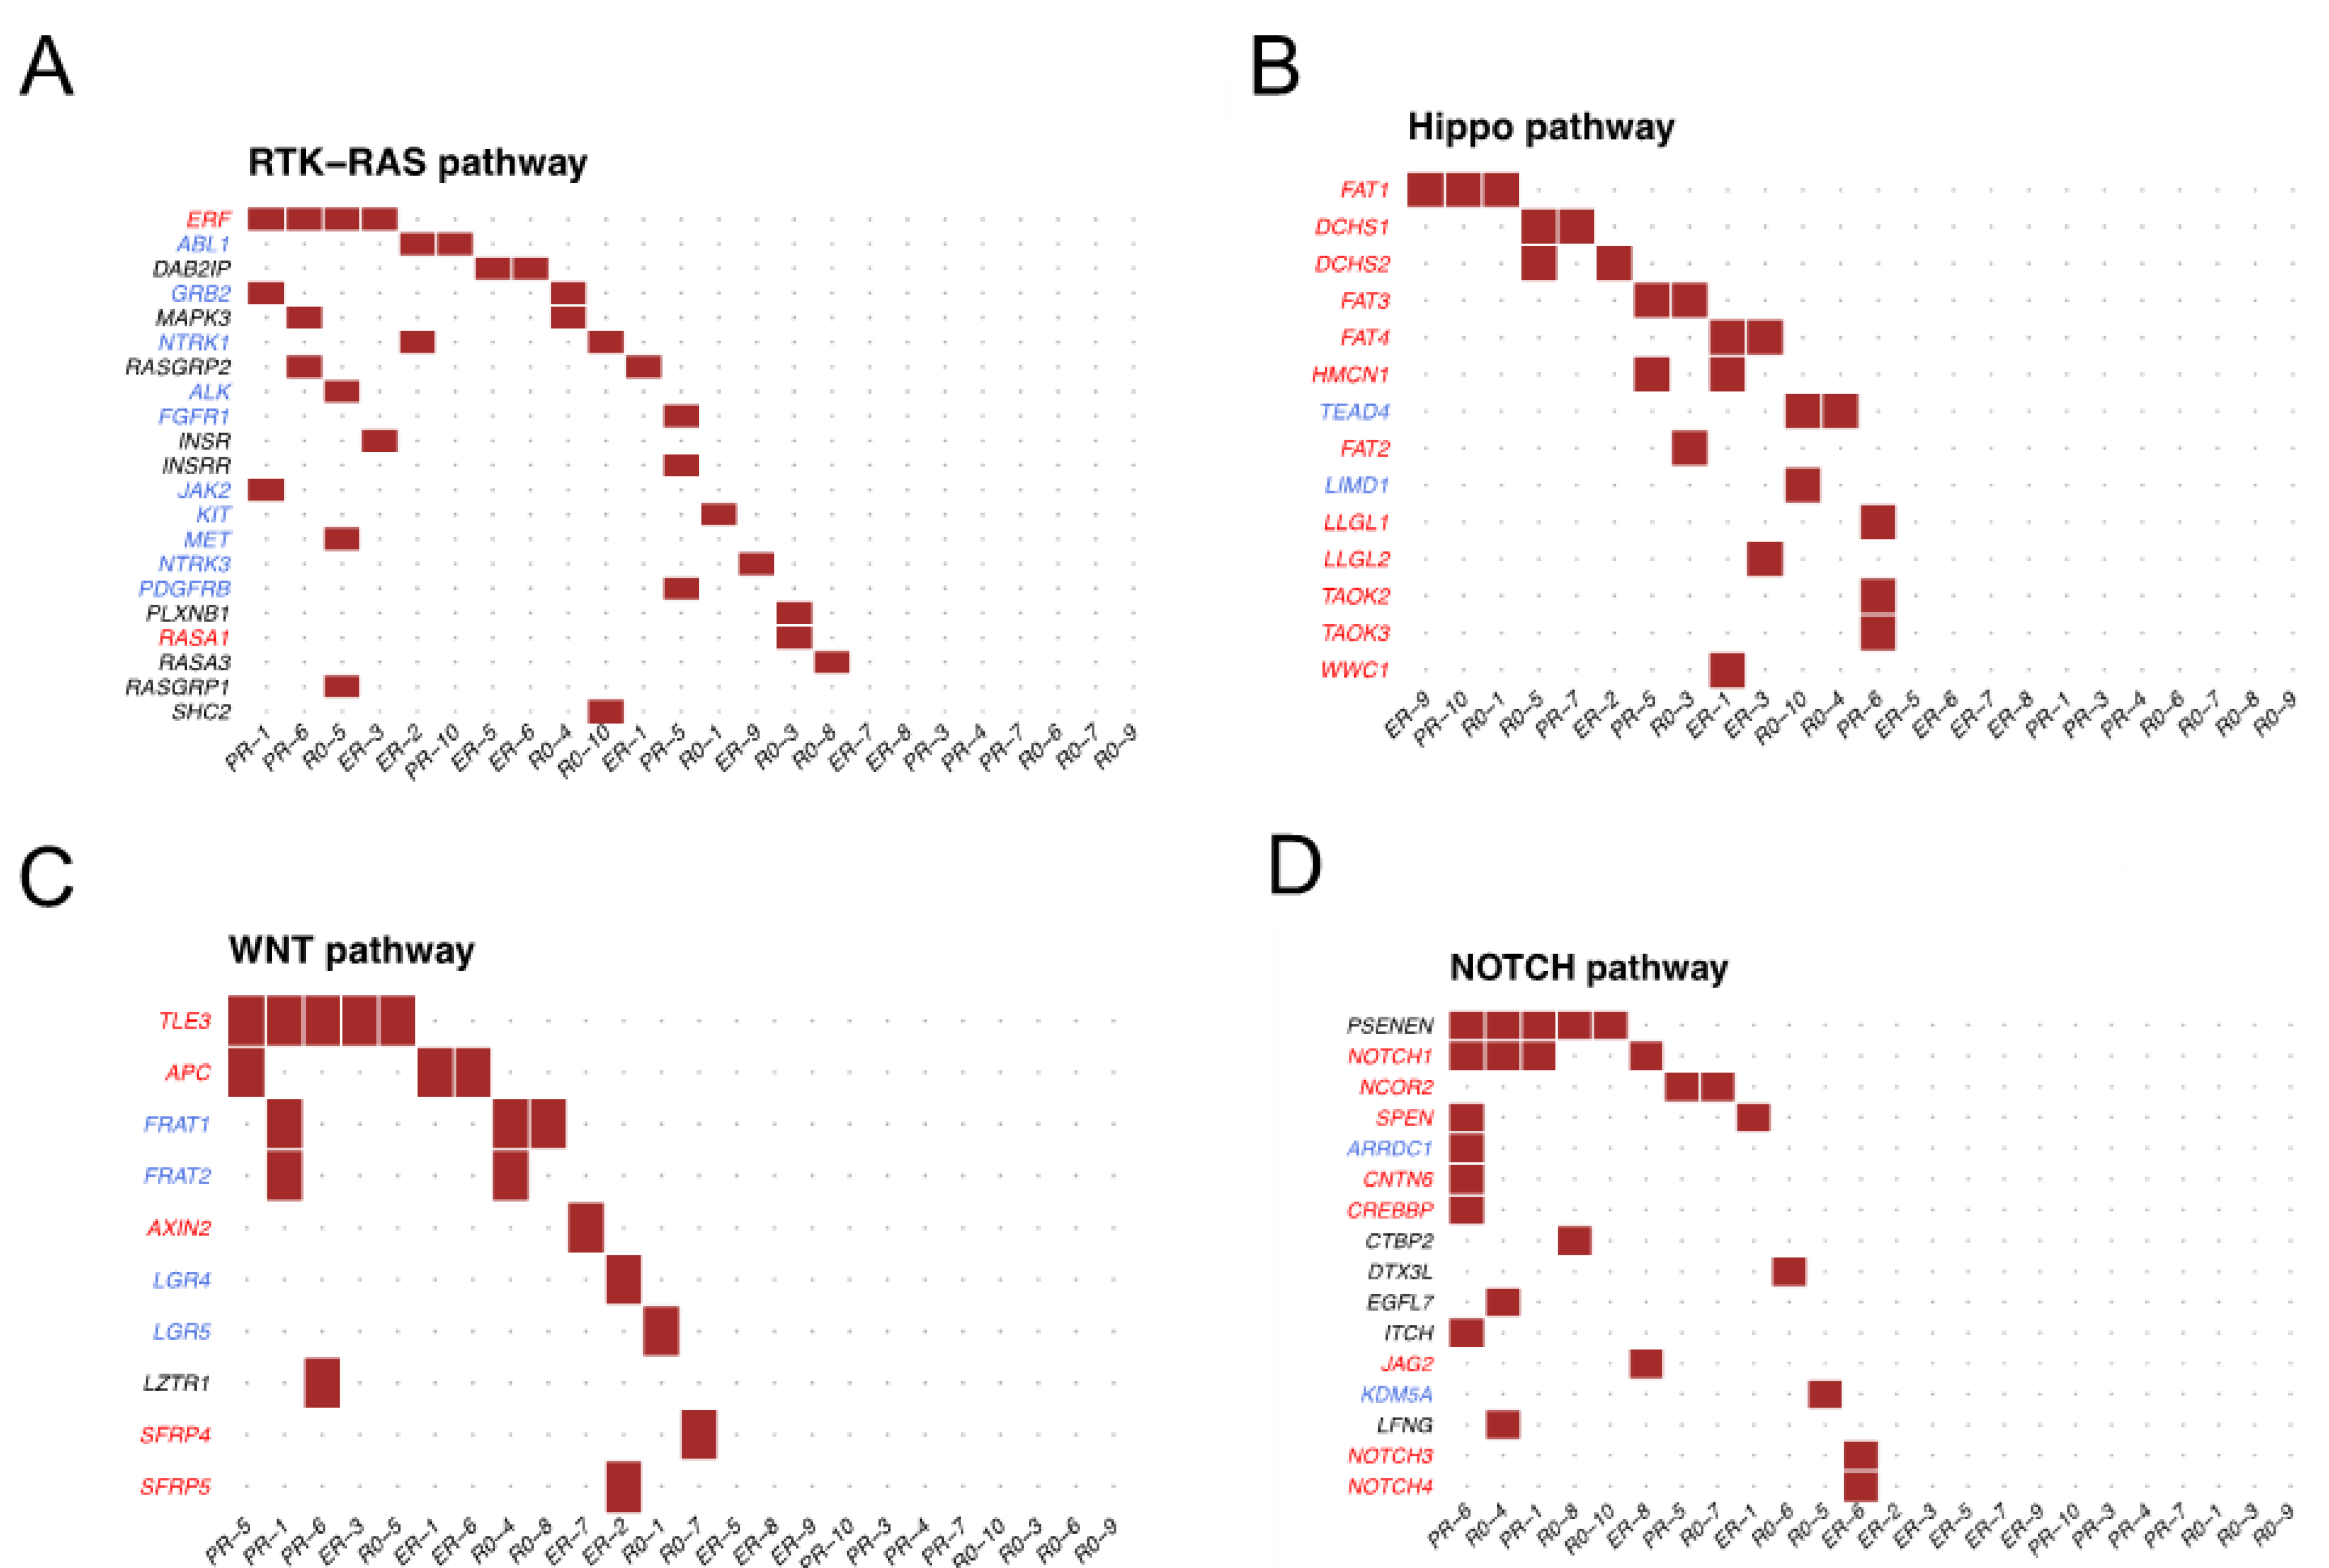
Figure 2 shows the details of the most frequently altered oncogenic pathways. As shown in Figure 2A, 21 genes in the RTK-RAS pathway were altered, including ERF (4, 17%), ABL1 (2, 8%), and DAB2IP (2, 8%). In the Hippo pathway (Figure 2B), 14 genes were altered, with FAT1 as the most common (3, 13%), as well as DCHS1 (2, 8%) and DCHS2 (2, 8%). In the WNT pathway (Figure 2C), 10 genes were altered, including TLE3 (5, 21%), APC (3, 13%), and FRAT1 (3, 13%). In the NOTCH pathway (Figure 2D), 16 genes were altered, including PSENEN (5, 21%), NOTCH1 (4, 17%), and NCOR2 (2, 8%). When comparing patient groups, no statistically significant differences for variants and pathways were found between the R0 and the NACT groups, nor between NACT-ER and NACT-PR.

3.3. Comparison between EV-DNA and Tumor DNA

We compared the somatic genomic alterations in EV-DNA and tumor DNA from the same patients and found no overlaps of mutations and CNVs. We further investigated the genomic alteration enrichment in ovarian cancer genes and cancer-hallmark genes in EV-DNA compared with tumor DNA. As shown in Supplementary Figure S2A, 14 ovarian cancer genes were found to be enriched with alterations in tumor DNA, including TP53 (p < 0.0001, adj-p < 0.0001), PIK3CA (p < 0.0001, adj-p = 0.008), CSMD3 (p = 0.0002, adj-p = 0.01), CCND2 (p = 0.0007, adj-p = 0.03), ERBB2 (p = 0.003, adj-p = 0.06), and CCNE1 (p = 0.003, adj-p = 0.06), and no ovarian cancer genes were enriched with alterations in EV-DNA. It is interesting to note that among the cancer-hallmark genes (Supplementary Figure S2B), two genes, H3F3B (p < 0.0001, adj-p < 0.0001) and B2M (p = 0.0003, adj-p = 0.018), were enriched with alterations in EV-DNA, while 55 genes were enriched with alterations in tumor DNA.

3.4. Transcriptomic Expression Profiles in EV-RNA

Next, we investigated the gene expression patterns in EV-RNA samples. Overall, a total of 28,246 genes were found to be expressed in the EV-RNA samples. Sample-to-sample distance was calculated, and the patient samples were clustered, as shown in Figure 3A. Samples from the same groups were relatively clustered together, indicating that the EV-RNA expression profiles were more similar within each group than across different groups. Unsupervised clustering using the top 10,000 most variable genes (Figure 3B) identified two main clusters, of which one cluster only included samples from the NACT-ER and NACT-PR groups, while samples from the R0 group were enriched in the other cluster. This suggests distinct expression patterns of the R0 group compared to the NACT groups.

3.5. Differential Expression and Enriched Pathways between the R0 and NACT Groups

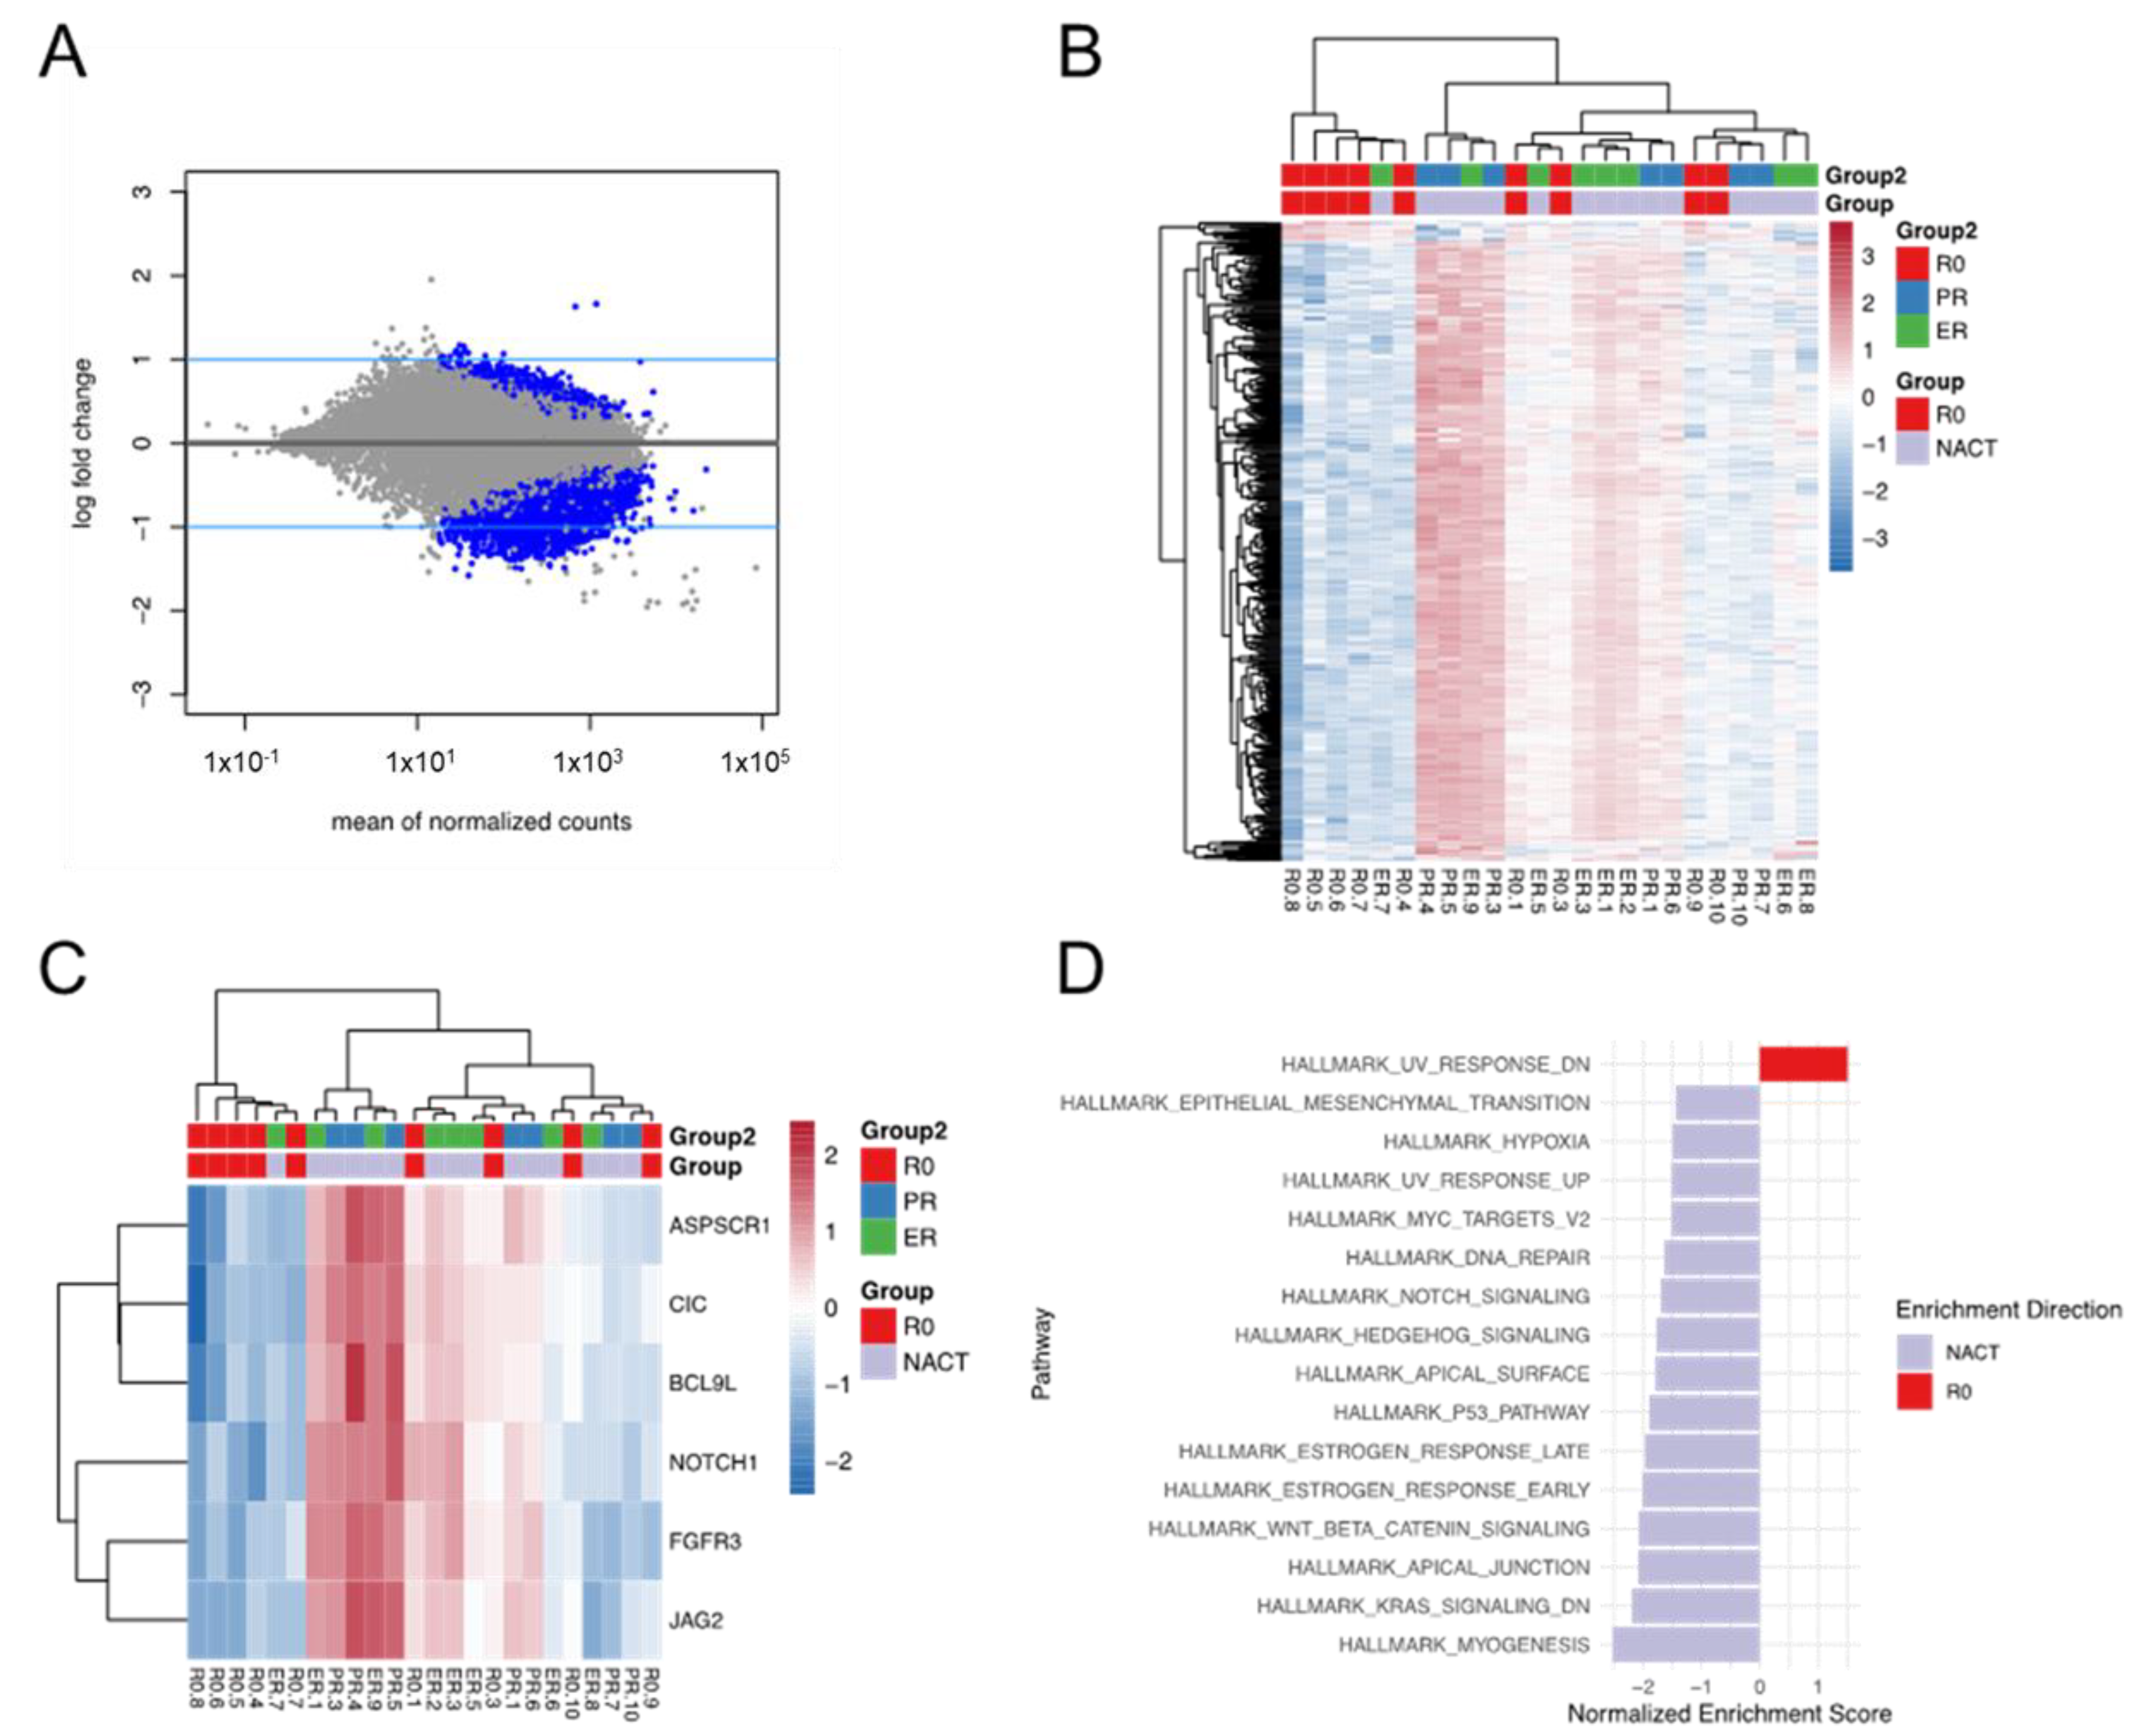
We identified 574 differentially expressed genes (DEGs) with an adj-p <0.05 and absolute L2FC ≥1 in the R0 compared with the NACT groups (Figure 4A,B). Among these, 18 genes were upregulated in the R0 group, and 556 genes were upregulated in the NACT group. Interestingly, six cancer-hallmark genes were found to be significantly downregulated in the EV-RNA samples from the R0 group (Figure 4C): ASPSCR1 (L2FC = −1.3, adj-p = 0.004), CIC (L2FC = −1.0, adj-p = 0.006), BCL9L (L2FC = −1.1, adj-p = 0.005), NOTCH1 (L2FC = −1.1, adj-p = 0.01), FGFR3 (L2FC = −1.2, adj-p = 0.004), and JAG2 (L2FC = −1.2, adj-p = 0.005).
Gene set enrichment analysis (GSEA) was performed, to evaluate the enriched pathways between the R0 and the NACT groups. As shown in Figure 4D, 15 pathways were significantly enriched in the NACT group, and the ones with the most significant normalized enrichment scores (NESs) were hallmark myogenesis (NES = −2.5, adj-p < 0.0001), hallmark KRAS signaling DN (downregulated) (NES = −2.2, adj-p < 0.0001), hallmark apical junction (NES = −2.1, adj-p < 0.0001), and hallmark WNT/beta-catenin signaling (NES = −2.1, adj-p = 0.0003). In contrast, one pathway was found to be enriched in the R0 group: hallmark UV response DN (NES = 1.5, adj-p = 0.02).

3.6. Differential Expression and Enriched Pathways between the NACT-ER and NACT-PR

Groups

We further compared the EV-RNA expression between the NACT-ER and NACT-PR groups; however, no DEGs were found (Supplementary Figure S3A). GSEA analysis identified eight significantly enriched pathways (Supplementary Figure S3B). Six pathways were significantly enriched in the NACT-ER group: hallmark MYC targets V1 (NES = 2.2, adj-p < 0.0001), hallmark unfolded protein response (NES = 1.9, adj-p = 0.001), hallmark MTORC1 signaling (NES = 1.8, adj-p = 0.0001), hallmark oxidative phosphorylation (NES = 1.7, adj-p = 0.0004), hallmark MYC targets V2 (NES = 1.7, adj-p = 0.02), and hallmark interferon-gamma response (NES = 1.5, adj-p = 0.006). In contrast, two pathways were significantly enriched in the NACT-PR group: hallmark apical junction (NES = −1.7, adj-p = 0.002) and hallmark KRAS signaling DN (NES = −1.5, adj-p = 0.01).

3.7. Comparison between EV-RNA and Tumor RNA

EV-RNA and tumor RNA were compared from the same patient cohort. The PCA (principal component analysis) plot (Supplementary Figure S4A) shows a clear separation between EV-RNA samples and tumor RNA samples, regardless of the response groups, suggesting a distinct transcriptomic pattern between EVs and tumor tissues. Compared to EV-RNA samples, the tumor RNA samples were more widely distributed on the PCA plot, indicating profound heterogeneity among tumor tissue samples. Furthermore, the pathway analysis (Supplementary Figure S4B,C) shows that the most enriched pathways in EV-RNA samples were hallmark MYC targets V2 and hallmark inflammatory response. The most enriched pathways in the tumor RNA samples were hallmark hedgehog signaling and hallmark TGF-beta signaling.

4. Discussion

In the present study, we identified distinct EV genomic and transcriptomic alterations from clinically well-defined HGSC patient groups. We found several oncogenic pathways significantly altered in WGS of the EV-DNA from all 24 samples analyzed. Through RNA-seq, we found 18 genes upregulated in the R0 group and 556 genes upregulated in the NACT group, which mostly mapped to KRAS signaling and hallmark WNT/beta-catenin signaling. Moreover, among the significantly enriched pathways in patients with excellent response to NACT, we identified pathways connected to metabolism and ATP production, such as oxidative phosphorylation, and to immune activation, such as interferon-gamma response.
EV genomic analysis has been performed mostly for detection of cancer-derived mutations and protein alterations, as possible diagnostic companions. In most cancer types, such as prostate cancer [32], pancreatic cancer [33], and glioblastoma [34], EV-DNA analysis has been tested for cancer detection more than for prognosis and treatment prediction. When a prognostic value was attributed to EV-DNA in previous studies, end-points such as progression-free survival were chosen for the analysis [35]. In ovarian cancer, this is one of the first reported studies in which a comprehensive genomic analysis was applied to circulating EVs in patients stratified according to response to treatment. Here, we focused on a specific cohort of patients undergoing standard surgical and chemotherapy treatment whose surgical resection and NACT outcomes were evaluated according to strict and well-established criteria [3]. To answer the question of whether liquid-biopsy markers might help to predict treatment outcome, our findings demonstrate that there are substantial differences in the circulating EV-RNA of patients who underwent R0 tumor debulking versus patients stratified to receive NACT. Many studies evaluating EVs as predictive biomarkers focused only on detection of single genes [36,37,38], while we applied a more comprehensive transcriptomic analysis. Nonetheless, due to the highly standardized criteria, our study was limited by the relatively small sample size, which calls for validation in bigger cohorts.
EV-DNA sequencing showed that not all samples displayed alteration of cancer-associated genes; in particular, TP53 was found to be altered in only 4 of the 24 EV-DNA samples. Instead, when oncogenic pathway analysis was performed, the pathway altered throughout the majority of samples (16 of 24) was the RTK-RAS pathway. Interestingly, RAS mutation—and in general, RAS activity—seems to be involved in the regulation of EV biogenesis rate in cancer cells [39,40]. Similarly, the WNT pathway was among the most frequently altered. EV-mediated delivery of Wnt ligands is known to induce migratory and proliferative potential in recipient cells [41,42,43]. Despite the absence of overlap between somatic alterations in EV-DNA and matched tumor-tissue DNA in our cohort, we believe that circulating EV-DNA still reflects the complex genomic landscape of the tumor microenvironment. EVs’ cargo might not reflect the original cell content but might be regulated by the activation or overexpression of certain genes in the cell of origin. For example, activation of epidermal growth factor receptor (EGFR) signaling by prostate cancer cells in vitro has been associated with the formation of a specific subtype of larger EVs (up to 10 µM in diameter) [31], while in glioblastoma cells, overexpression of EGFR vIII promoted release of EVs enriched with focal adhesion and pro-invasive proteins [32]. Therefore, the clonal diversity present in the tumors might be reflected in the EVs’ composition and cargo, and not necessarily in the overlapping of their genome with the cell of origin. Our analysis of the EV transcriptomic variations instead revealed specific alterations in gene expression directly related to the treatment outcome. The R0 and the NACT groups independently clustered according to gene expression in two distinct groups. Among the specific cancer genes downregulated in the EV-RNA from the R0 group, NOTCH1 stands out for its specific role in ovarian cancer chemoresistance [44]. Among the enriched pathways in the NACT group, KRAS signaling and WNT/beta-catenin signaling are notably connected to oncogenic potential and tumor progression [45,46].
It is noteworthy that the comparison between tumor tissue DNA and EV-DNA did not report any overlap between the patterns of mutation; similarly, the comparison between EV-RNA and tumor RNA showed a quite different transcriptomic pattern, almost suggesting that the nucleic acids incorporated into EVs are not generated by a casual segregation, but by a well-defined loading program.

5. Conclusions

In-depth analysis of liquid biopsy-based circulating markers represents the most accurate approach to identifying specific biomarkers of response in ovarian cancer; in line with that, our finding of a significant variation between gene expression in EV-RNA from patients with different responses to primary treatment may have deep therapeutic and prognostic implications for patients with HGSC.

Supplementary Materials

The following supporting information can be downloaded at: https://www.mdpi.com/article/10.3390/cancers14153589/s1, Figure S1: Nanotracking particle analysis and transmission electron microscopy. Figure S2: Somatic alteration comparison between EV-DNA and tumor DNA. Figure S3: Differential expression analysis in the NACT-ER vs. NACT-PR groups. Figure S4: RNA expression profile comparison between EV-RNA and tumor RNA. Table S1: Description of the cohort and clinicopathological characteristics.

Author Contributions

S.L and A.K.S. supervised the study. S.L., L.Z., S.M. and A.K.S. conceived and designed the study. S.L. and S.C. took the lead in writing the manuscript. S.L., L.Z. and S.C. wrote the manuscript. S.L. and L.Z. analyzed, managed, and interpreted the sequencing data. E.J.T., H.T., J.Z. and P.A.F. helped with producing and analyzing the sequencing data. S.M., A.L.A. and N.B.J. isolated EV-DNA and -RNA. S.L., S.N.W., R.A.H., N.D.F., J.C., A.A.J. and A.K.S. contributed to the acquisition of clinical samples and data. All authors have read and agreed to the published version of the manuscript.

Funding

This work was supported in part by the MD Anderson Ovarian Cancer Moon Shot Program; National Institutes of Health/National Cancer Institute grants P50CA217685, R35CA209904, and P30CA016672 (using the Advanced Technology Genomics Core and the High-Resolution Electron Microscopy Facility); and the MD Anderson Center for Translational and Public Health Genomics (Biospecimen Extraction Facility). S.L. is supported in part by a Sprint for Life Research Award and Kaleidoscope of Hope Ovarian Cancer Foundation Research Grant. S.N.W. is supported by the Andrew Sabin Family Fellowship and a GOG Foundation Scholar Investigator Award. A.K.S. is supported by an American Cancer Society Research Professor Award and the Frank McGraw Memorial Chair in Cancer Research. S.C. is supported by the Foundation for Women’s Cancer (Amy Krouse Rosenthal Foundation and Judy’s Mission to End Ovarian Cancer) and by the Foundation for Women’s Cancer, Clovis Oncology Post-Doctoral Fellowship Award.

Institutional Review Board Statement

The study was conducted according to the guidelines of the Declaration of Helsinki and approved by the Institutional Review Board of UT MD Anderson Cancer Center (IRB Study ID no. LAB10-0850).

Informed Consent Statement

Patient consent was waived due to retrospective nature of the study.

Data Availability Statement

The WGS and RNA-seq data in this study have been deposited in the European Genome-phenome Archive. Study ID: EGAS00001006350 (Dataset ID for WGS: EGAD00001008973; for RNA-seq: EGAD00001008972).

Acknowledgments

We thank S. Patterson (Editing Services, Research Medical Library, MD Anderson Cancer Center) for editorial assistance, the MD Anderson Advanced Technology Genomics Core for help with the sequencing, and Kenneth Dunner Jr. at MD Anderson’s High-Resolution Electron Microscopy Facility for assistance in performing the electron microscopy analysis. We acknowledge Biorender for figure production.

Conflicts of Interest

A.K.S. received research support from MTrap, is a shareholder of BioPath, and is a consultant for Merck, AstraZeneca, Onxeo, GSK, and Kiyatec. N.D.F. consults with Tesaro/GSK and Immunogen. S.N.W.; has clinical research grants from AstraZeneca, ArQule, Bayer, Clovis Oncology, Cotinga Pharmaceuticals, the National Comprehensive Cancer Network, Novartis, Roche/Genentech, and Tesaro; and consults with AstraZeneca, Circulogene, Clovis Oncology, Merck, Novartis, Pfizer, Roche/Genentech, Takeda, and Tesaro. A.A.J. reports paid consulting for Macrogenics, Avenge Bio, NuProbe, Guidepoint Consulting, and Gerson Lehrman Group; and research support from Ziopharm, Immactics, Iovance, Merch, AstraZeneca, Eli Lilly, Aravive, and Marcogenics.

References

  1. Lheureux, S.; Gourley, C.; Vergote, I.; Oza, A.M. Epithelial ovarian cancer. Lancet 2019, 393, 1240–1253. [Google Scholar] [CrossRef] [Green Version]
  2. Lisio, M.A.; Fu, L.L.; Goyeneche, A.; Gao, Z.H.; Telleria, C. High-Grade Serous Ovarian Cancer: Basic Sciences, Clinical and Therapeutic Standpoints. Int. J. Mol. Sci. 2019, 20, 925. [Google Scholar] [CrossRef] [PubMed] [Green Version]
  3. Fleming, N.D.; Nick, A.M.; Coleman, R.L.; Westin, S.N.; Ramirez, P.T.; Soliman, P.T.; Fellman, B.; Meyer, L.A.; Schmeler, K.M.; Lu, K.H.; et al. Laparoscopic Surgical Algorithm to Triage the Timing of Tumor Reductive Surgery in Advanced Ovarian Cancer. Obstet. Gynecol. 2018, 132, 545–554. [Google Scholar] [CrossRef] [PubMed]
  4. Nick, A.M.; Coleman, R.L.; Ramirez, P.T.; Sood, A.K. A framework for a personalized surgical approach to ovarian cancer. Na.t Rev. Clin. Oncol. 2015, 12, 239–245. [Google Scholar] [CrossRef] [Green Version]
  5. Lee, S.; Zhao, L.; Little, L.D.; Westin, S.N.; Jazarei, A.A.; Fleming, N.D.; Zhang, J.; Futreal, P.A.; Sood, A.K. Distinct T cell receptor repertoire diversity of clinically defined high-grade serous ovarian cancer treatment subgroups. iScience 2021, 24, 102053. [Google Scholar] [CrossRef]
  6. Lee, S.; Zhao, L.; Rojas, C.; Bateman, N.W.; Yao, H.; Lara, O.D.; Celestino, J.; Morgan, M.B.; Nguyen, T.V.; Conrads, K.A.; et al. Molecular Analysis of Clinically Defined Subsets of High-Grade Serous Ovarian Cancer. Cell Rep. 2020, 31, 107502. [Google Scholar] [CrossRef]
  7. Thery, C.; Zitvogel, L.; Amigorena, S. Exosomes: Composition, biogenesis and function. Nat. Rev. Immunol. 2002, 2, 569–579. [Google Scholar] [CrossRef]
  8. Thery, C.; Witwer, K.W.; Aikawa, E.; Alcaraz, M.J.; Anderson, J.D.; Andriantsitohaina, R.; Antoniou, A.; Arab, T.; Archer, F.; Atkin-Smith, G.K.; et al. Minimal information for studies of extracellular vesicles 2018 (MISEV2018): A position statement of the International Society for Extracellular Vesicles and update of the MISEV2014 guidelines. J. Extracell. Vesicles. 2018, 7, 1535750. [Google Scholar] [CrossRef] [Green Version]
  9. Xu, R.; Rai, A.; Chen, M.; Suwakulsiri, W.; Greening, D.W.; Simpson, R.J. Extracellular vesicles in cancer - implications for future improvements in cancer care. Nat. Rev. Clin. Oncol. 2018, 15, 617–638. [Google Scholar] [CrossRef]
  10. Abbosh, C.; Swanton, C.; Birkbak, N.J. Clonal haematopoiesis: A source of biological noise in cell-free DNA analyses. Ann. Oncol. 2019, 30, 358–359. [Google Scholar] [CrossRef]
  11. Ma, S.; McGuire, M.H.; Mangala, L.S.; Lee, S.; Stur, E.; Hu, W.; Bayraktar, E.; Villar-Prados, A.; Ivan, C.; Wu, S.Y.; et al. Gain-of-function p53 protein transferred via small extracellular vesicles promotes conversion of fibroblasts to a cancer-associated phenotype. Cell Rep. 2021, 34, 108726. [Google Scholar] [CrossRef] [PubMed]
  12. Yokoi, A.; Villar-Prados, A.; Oliphint, P.A.; Zhang, J.; Song, X.; De Hoff, P.; Morey, R.; Liu, J.; Roszik, J.; Clise-Dwyer, K.; et al. Mechanisms of nuclear content loading to exosomes. Sci. Adv. 2019, 5, eaax8849. [Google Scholar] [CrossRef] [PubMed] [Green Version]
  13. Li, H.; Durbin, R. Fast and accurate short read alignment with Burrows-Wheeler transform. Bioinformatics 2009, 25, 1754–1760. [Google Scholar] [CrossRef] [Green Version]
  14. McKenna, A.; Hanna, M.; Banks, E.; Sivachenko, A.; Cibulskis, K.; Kernytsky, A.; Garimella, K.; Altshuler, D.; Gabriel, S.; Daly, M.; et al. The Genome Analysis Toolkit: A MapReduce framework for analyzing next-generation DNA sequencing data. Genome Res. 2010, 20, 1297–1303. [Google Scholar] [CrossRef] [PubMed] [Green Version]
  15. Cibulskis, K.; Lawrence, M.S.; Carter, S.L.; Sivachenko, A.; Jaffe, D.; Sougnez, C.; Gabriel, S.; Meyerson, M.; Lander, E.S.; Getz, G. Sensitive detection of somatic point mutations in impure and heterogeneous cancer samples. Nat. Biotechnol. 2013, 31, 213–219. [Google Scholar] [CrossRef]
  16. Ye, K.; Schulz, M.H.; Long, Q.; Apweiler, R.; Ning, Z. Pindel: A pattern growth approach to detect break points of large deletions and medium sized insertions from paired-end short reads. Bioinformatics 2009, 25, 2865–2871. [Google Scholar] [CrossRef]
  17. Sachidanandam, R.; Weissman, D.; Schmidt, S.C.; Kakol, J.M.; Stein, L.D.; Marth, G.; Sherry, S.; Mullikin, J.C.; Mortimore, B.J.; Willey, D.L.; et al. A map of human genome sequence variation containing 1.42 million single nucleotide polymorphisms. Nature 2001, 409, 928–933. [Google Scholar] [CrossRef] [Green Version]
  18. Genomes Project, C.; Abecasis, G.R.; Auton, A.; Brooks, L.D.; DePristo, M.A.; Durbin, R.M.; Handsaker, R.E.; Kang, H.M.; Marth, G.T.; McVean, G.A. An integrated map of genetic variation from 1,092 human genomes. Nature 2012, 491, 56–65. [Google Scholar] [CrossRef] [Green Version]
  19. Lek, M.; Karczewski, K.J.; Minikel, E.V.; Samocha, K.E.; Banks, E.; Fennell, T.; O’Donnell-Luria, A.H.; Ware, J.S.; Hill, A.J.; Cummings, B.B.; et al. Analysis of protein-coding genetic variation in 60,706 humans. Nature 2016, 536, 285–291. [Google Scholar] [CrossRef] [Green Version]
  20. Fu, W.; O’Connor, T.D.; Jun, G.; Kang, H.M.; Abecasis, G.; Leal, S.M.; Gabriel, S.; Rieder, M.J.; Altshuler, D.; Shendure, J.; et al. Analysis of 6,515 exomes reveals the recent origin of most human protein-coding variants. Nature 2013, 493, 216–220. [Google Scholar] [CrossRef] [Green Version]
  21. Wang, K.; Li, M.; Hakonarson, H. ANNOVAR: Functional annotation of genetic variants from high-throughput sequencing data. Nucleic Acids Res. 2010, 38, e164. [Google Scholar] [CrossRef] [PubMed]
  22. Liu, X.; Li, C.; Mou, C.; Dong, Y.; Tu, Y. dbNSFP v4: A comprehensive database of transcript-specific functional predictions and annotations for human nonsynonymous and splice-site SNVs. Genome Med. 2020, 12, 103. [Google Scholar] [CrossRef] [PubMed]
  23. Smigielski, E.M.; Sirotkin, K.; Ward, M.; Sherry, S.T. dbSNP: A database of single nucleotide polymorphisms. Nucleic Acids Res. 2000, 28, 352–355. [Google Scholar] [CrossRef] [PubMed] [Green Version]
  24. Landrum, M.J.; Lee, J.M.; Riley, G.R.; Jang, W.; Rubinstein, W.S.; Church, D.M.; Maglott, D.R. ClinVar: Public archive of relationships among sequence variation and human phenotype. Nucleic Acids Res. 2014, 42, D980–D985. [Google Scholar] [CrossRef] [Green Version]
  25. Tate, J.G.; Bamford, S.; Jubb, H.C.; Sondka, Z.; Beare, D.M.; Bindal, N.; Boutselakis, H.; Cole, C.G.; Creatore, C.; Dawson, E.; et al. COSMIC: The Catalogue Of Somatic Mutations In Cancer. Nucleic Acids Res. 2019, 47, D941–D947. [Google Scholar] [CrossRef] [Green Version]
  26. Lai, D.; Ha, G.; Shah, S. HMMcopy: Copy Number Prediction With correction for GC and Mappability Bias for HTS Data. R package Version 1.38.0. 2022. Available online: https://rdrr.io/bioc/HMMcopy/ (accessed on 18 November 2021).
  27. Olshen, A.B.; Venkatraman, E.S.; Lucito, R.; Wigler, M. Circular binary segmentation for the analysis of array-based DNA copy number data. Biostatistics 2004, 5, 557–572. [Google Scholar] [CrossRef]
  28. Dobin, A.; Davis, C.A.; Schlesinger, F.; Drenkow, J.; Zaleski, C.; Jha, S.; Batut, P.; Chaisson, M.; Gingeras, T.R. STAR: Ultrafast universal RNA-seq aligner. Bioinformatics 2013, 29, 15–21. [Google Scholar] [CrossRef]
  29. Anders, S.; Pyl, P.T.; Huber, W. HTSeq--a Python framework to work with high-throughput sequencing data. Bioinformatics 2015, 31, 166–169. [Google Scholar] [CrossRef]
  30. Love, M.I.; Huber, W.; Anders, S. Moderated estimation of fold change and dispersion for RNA-seq data with DESeq2. Genome Biol. 2014, 15, 550. [Google Scholar] [CrossRef] [Green Version]
  31. Subramanian, A.; Tamayo, P.; Mootha, V.K.; Mukherjee, S.; Ebert, B.L.; Gillette, M.A.; Paulovich, A.; Pomeroy, S.L.; Golub, T.R.; Lander, E.S.; et al. Gene set enrichment analysis: A knowledge-based approach for interpreting genome-wide expression profiles. Proc. Natl. Acad.Sci. USA 2005, 102, 15545–15550. [Google Scholar] [CrossRef] [Green Version]
  32. Vagner, T.; Spinelli, C.; Minciacchi, V.R.; Balaj, L.; Zandian, M.; Conley, A.; Zijlstra, A.; Freeman, M.R.; Demichelis, F.; De, S.; et al. Large extracellular vesicles carry most of the tumour DNA circulating in prostate cancer patient plasma. J. Extracell. Vesicles 2018, 7, 1505403. [Google Scholar] [CrossRef] [PubMed] [Green Version]
  33. Allenson, K.; Castillo, J.; San Lucas, F.A.S.; Scelo, G.; Kim, D.U.; Bernard, V.; Davis, G.; Kumar, T.; Katz, M.; Overman, M.J.; et al. High prevalence of mutant KRAS in circulating exosome-derived DNA from early-stage pancreatic cancer patients. Ann. Oncol. 2017, 28, 741–747. [Google Scholar] [CrossRef] [PubMed]
  34. Garcia-Romero, N.; Carrion-Navarro, J.; Esteban-Rubio, S.; Lazaro-Ibanez, E.; Peris-Celda, M.; Alonso, M.M.; Guzman-De-Villoria, J.; Fernandez-Carballal, C.; de Mendivil, A.O.; Garcia-Duque, S.; et al. DNA sequences within glioma-derived extracellular vesicles can cross the intact blood-brain barrier and be detected in peripheral blood of patients. Oncotarget 2017, 8, 1416–1428. [Google Scholar] [CrossRef] [PubMed] [Green Version]
  35. Bernard, V.; Kim, D.U.; San Lucas, F.A.; Castillo, J.; Allenson, K.; Mulu, F.C.; Stephens, B.M.; Huang, J.; Semaan, A.; Guerrero, P.A.; et al. Circulating Nucleic Acids Are Associated With Outcomes of Patients With Pancreatic Cancer. Gastroenterology 2019, 156, 108. [Google Scholar] [CrossRef] [Green Version]
  36. Del Re, M.; Marconcini, R.; Pasquini, G.; Rofi, E.; Vivaldi, C.; Bloise, F.; Restante, G.; Arrigoni, E.; Caparello, C.; Bianco, M.G.; et al. PD-L1 mRNA expression in plasma-derived exosomes is associated with response to anti-PD-1 antibodies in melanoma and NSCLC. Brit. J. Cancer 2018, 118, 820–824. [Google Scholar] [CrossRef] [Green Version]
  37. Shao, H.; Chung, J.; Balaj, L.; Charest, A.; Bigner, D.D.; Carter, B.S.; Hochberg, F.H.; Breakefield, X.O.; Weissleder, R.; Lee, H. Protein Typing of Circulating Microvesicles Allows Real-time Monitoring of Glioblastoma Therapy. Eur. J. Cancer 2012, 48, 137–138. [Google Scholar] [CrossRef] [Green Version]
  38. Tucci, M.; Passarelli, A.; Mannavola, F.; Stucci, L.S.; Ascierto, P.A.; Capone, M.; Madonna, G.; Lopalco, P.; Silvestris, F. Serum exosomes as predictors of clinical response to ipilimumab in metastatic melanoma. Oncoimmunology 2018, 7, e1387706. [Google Scholar] [CrossRef]
  39. Datta, A.; Kim, H.; Lal, M.; Mcgee, L.; Johnson, A.; Moustafa, A.A.; Jones, J.C.; Mondal, D.; Ferrer, M.; Abdel-Mageed, A.B. Manumycin A suppresses exosome biogenesis and secretion via targeted inhibition of Ras/Raf/ERK1/2 signaling and hnRNP H1 in castration-resistant prostate cancer cells. Cancer Lett. 2017, 408, 73–81. [Google Scholar] [CrossRef]
  40. Lee, T.H.; Chennakrishnaiah, S.; Audemard, E.; Montermini, L.; Meehan, B.; Rak, J. Oncogenic ras-driven cancer cell vesiculation leads to emission of double-stranded DNA capable of interacting with target cells. Biochem. Bioph. Res. Co. 2014, 451, 295–301. [Google Scholar] [CrossRef] [Green Version]
  41. Harada, T.; Yamamoto, H.; Kishida, S.; Kishida, M.; Awada, C.; Takao, T.; Kikuchi, A. Wnt5b-associated exosomes promote cancer cell migration and proliferation. Cancer Sci. 2017, 108, 42–52. [Google Scholar] [CrossRef]
  42. McBride, J.D.; Rodriguez-Menocal, L.; Guzman, W.; Candanedo, A.; Garcia-Contreras, M.; Badiavas, E.V. Bone Marrow Mesenchymal Stem Cell-Derived CD63(+) Exosomes Transport Wnt3a Exteriorly and Enhance Dermal Fibroblast Proliferation, Migration, and Angiogenesis In Vitro. Stem. Cells Dev. 2017, 26, 1384–1398. [Google Scholar] [CrossRef] [PubMed]
  43. Zhang, B.; Wu, X.D.; Zhang, X.; Sun, Y.X.; Yan, Y.M.; Shi, H.; Zhu, Y.H.; Wu, L.J.; Pan, Z.J.; Zhu, W.; et al. Human Umbilical Cord Mesenchymal Stem Cell Exosomes Enhance Angiogenesis Through the Wnt4/beta-Catenin Pathway. Stem. Cell Transl. Med. 2015, 4, 513–522. [Google Scholar] [CrossRef] [PubMed]
  44. McAuliffe, S.M.; Morgan, S.L.; Wyant, G.A.; Tran, L.T.; Muto, K.W.; Chen, Y.S.; Chin, K.T.; Partridge, J.C.; Poole, B.B.; Cheng, K.H.; et al. Targeting Notch, a key pathway for ovarian cancer stem cells, sensitizes tumors to platinum therapy. Proc. Natl. Acad. Sci. USA 2012, 109, E2939–E2948. [Google Scholar] [CrossRef] [PubMed] [Green Version]
  45. Ryan, M.B.; Corcoran, R.B. Therapeutic strategies to target RAS-mutant cancers. Nat. Rev. Clin. Oncol. 2018, 15, 709–720. [Google Scholar] [CrossRef] [PubMed]
  46. Zhan, T.; Rindtorff, N.; Boutros, M. Wnt signaling in cancer. Oncogene 2017, 36, 1461–1473. [Google Scholar] [CrossRef] [PubMed]
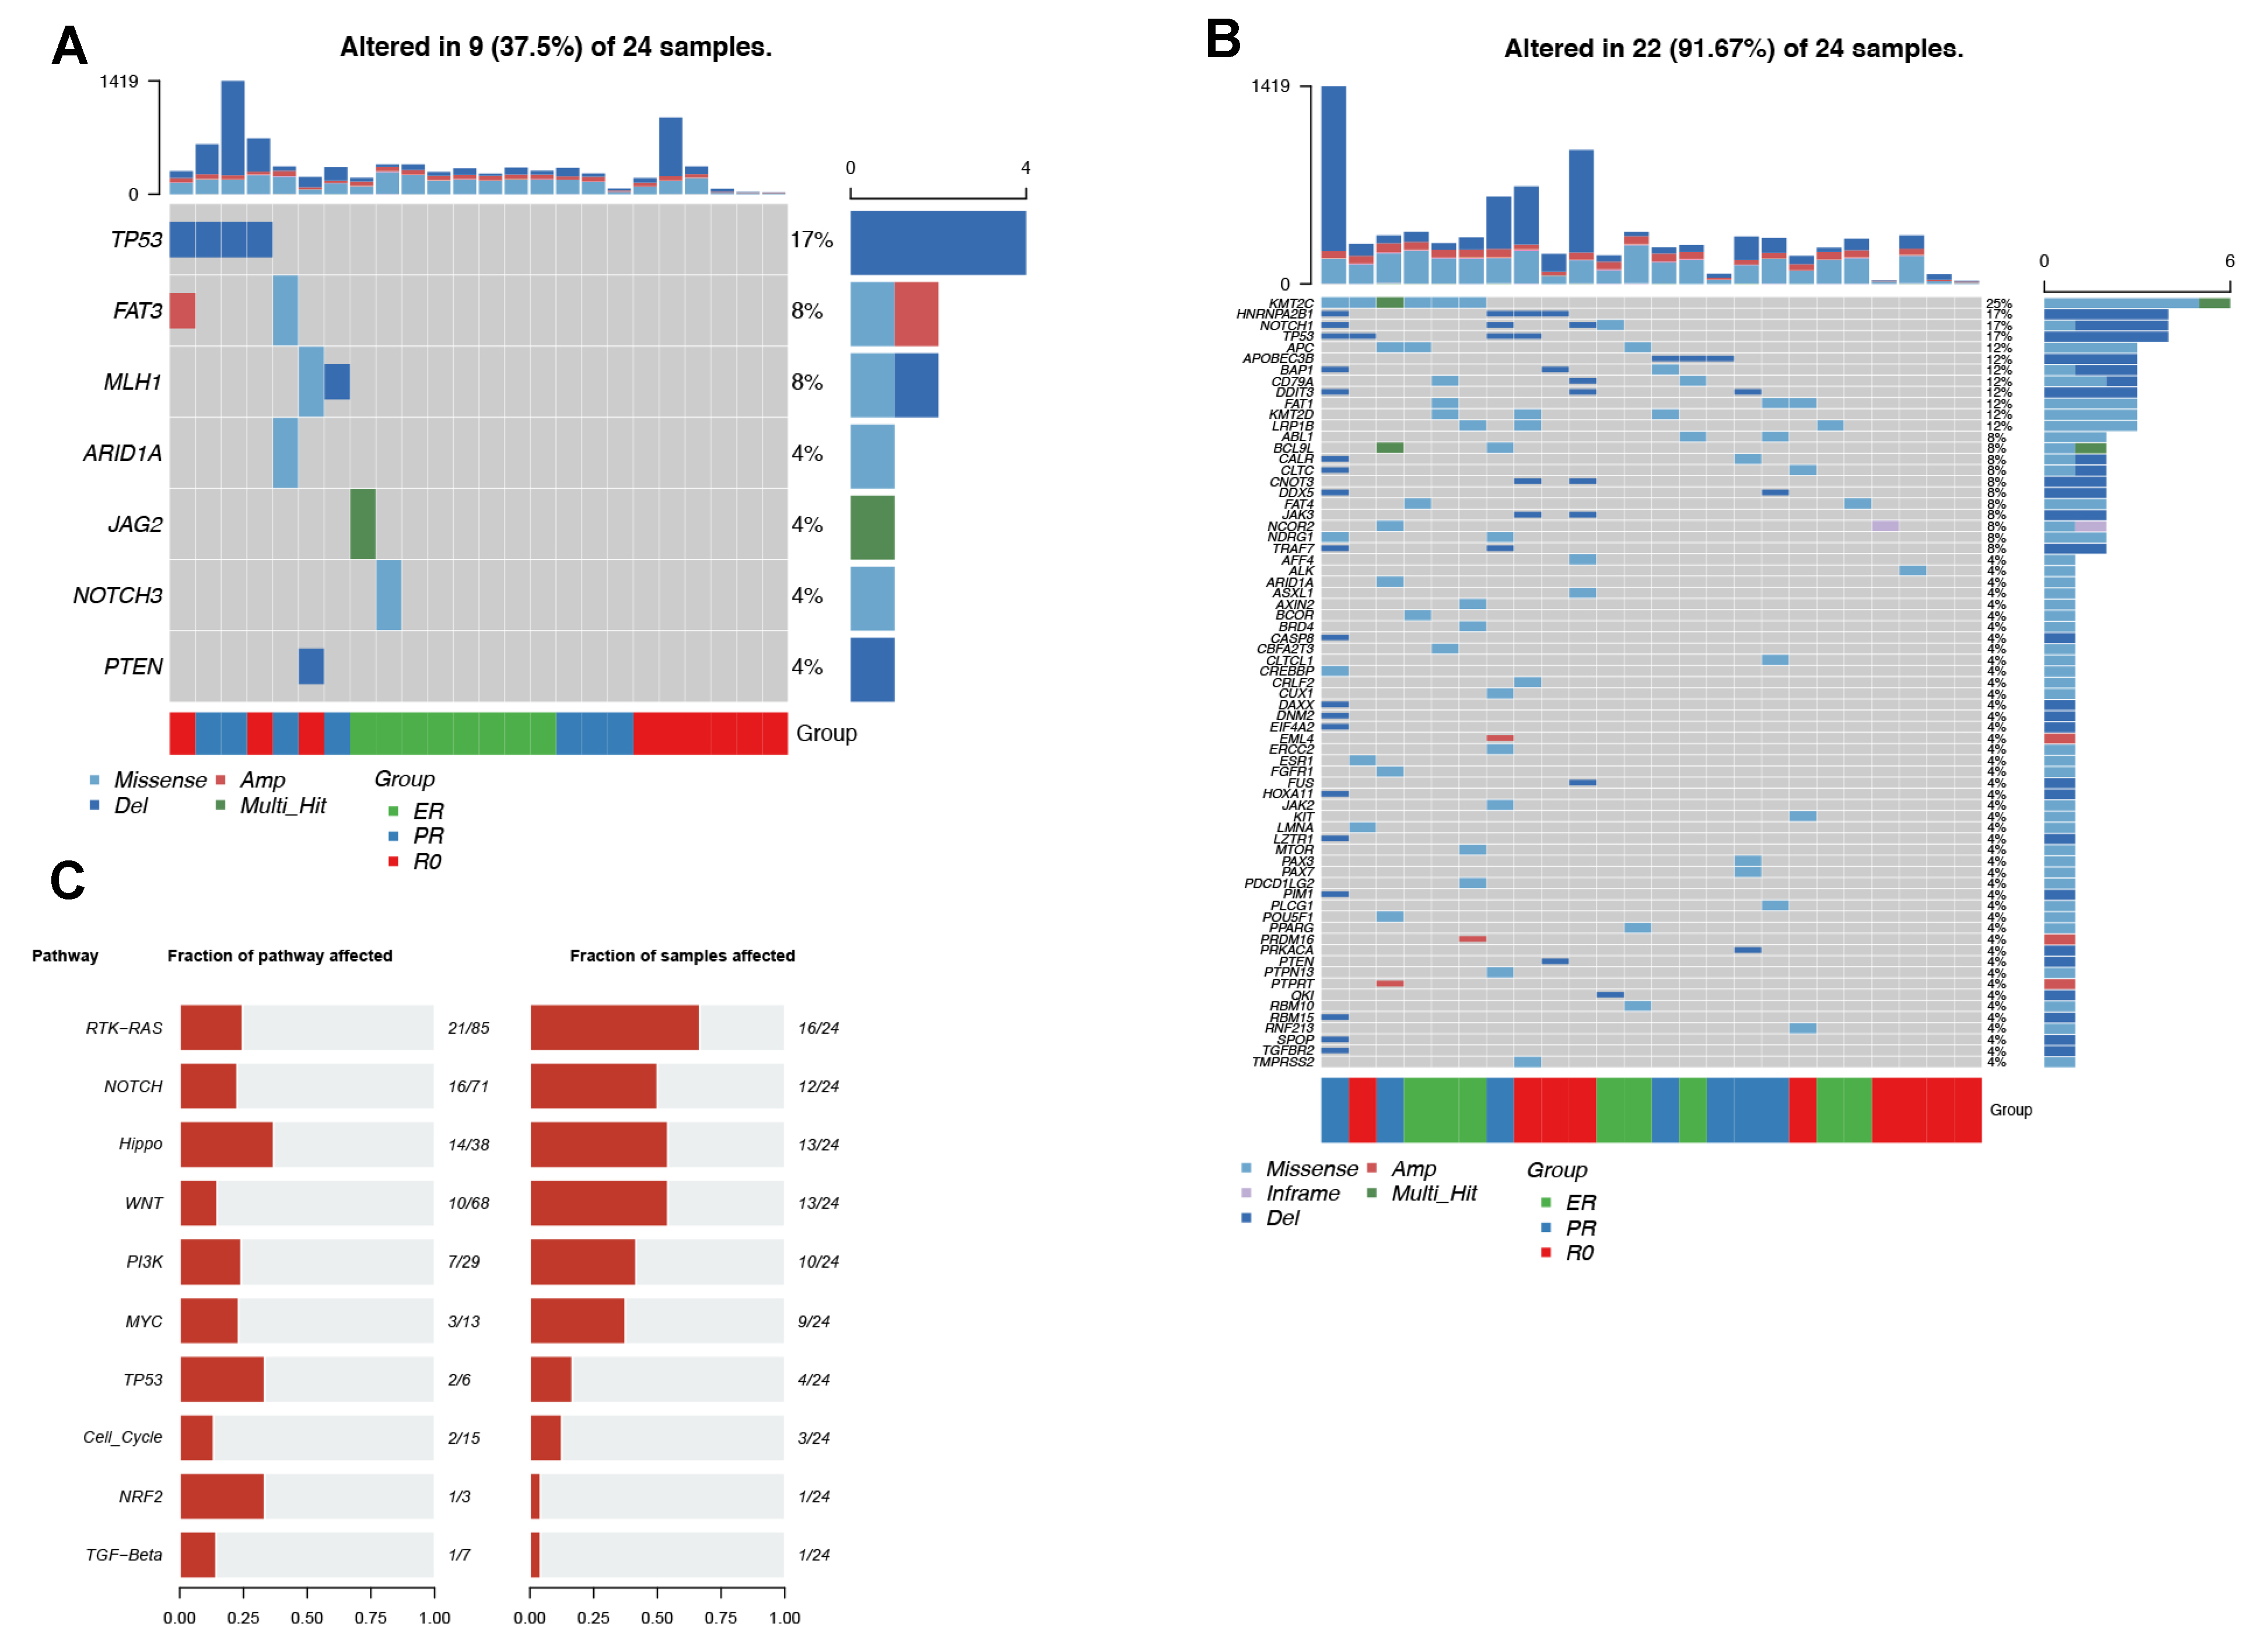
Figure 1. Somatic alterations were identified in 24 EV-DNA samples. The plots show the presence of alterations in cancer-associated and cancer-hallmark genes, and the most frequently altered pathways. (A) Oncoplot showing the frequency of each type of somatic alteration in ovarian cancer genes. Each column represents one sample. Patient groups are represented by the colored bars at the bottom, labeled “Group.” (B) Oncoplot showing the somatic alterations identified in cancer-hallmark genes. (C) Barplots showing the altered oncogenic pathways. Left: The fraction of genes altered in the pathways. Right: The fraction of EV-DNA samples carrying alterations in the pathways. ER = excellent response to neoadjuvant chemotherapy (NACT); PR = poor response to NACT; R0 = no residual disease; EV = extracellular vesicles.
Cancers 14 03589 g001
Figure 2. Altered genes for each patient in the four most frequently altered pathways. (A) RTK-RAS pathway, (B) Hippo pathway, (C) WNT pathway, (D) NOTCH pathway. Tumor suppressor genes are in red, and oncogenes are in blue.
Cancers 14 03589 g002
Figure 3. Sequencing analysis for 24 EV-RNA samples. Clustering of samples according to EV-RNA expression is shown; samples tend to cluster according to R0 and NACT groups. (A) Heatmap of sample-to-sample distance. (B) Unsupervised clustering of the top 10,000 most variable genes. ER = excellent response to neoadjuvant chemotherapy (NACT); PR = poor response to NACT; R0 = no residual disease; EV = extracellular vesicles.
Cancers 14 03589 g003
Figure 4. Differential expression analysis of EV-RNA in the R0 vs. NACT groups: The plots show differentially expressed genes between patients who had R0 tumor reductive surgery upfront and those who had neoadjuvant chemotherapy (NACT), with six cancer-hallmark genes found to be significantly downregulated in the R0 group. (A) MA plot showing the identified genes, with the blue lines representing the cutoffs for differentially expressed genes (DEGs) between the R0 group and the combined NACT groups. The absolute value of L2FC ≥1 was used as the cutoff for DEGs. The blue dots represent the genes with adjusted p-values (adj-p) <0.05. (B) Heatmap of 547 identified DEGs. (C) Heatmap of differentially expressed cancer-hallmark genes. (D) GSEA analysis shows the enriched cancer-hallmark pathways in the R0 vs. NACT groups. ER = excellent response; PR = poor response; R0 = radical surgery.
Cancers 14 03589 g004
Publisher’s Note: MDPI stays neutral with regard to jurisdictional claims in published maps and institutional affiliations.