
Dietary Patterns and Prostate Cancer: CAPLIFE Study

 , ,
, ,  , ,
, ,  , and
, and
Abstract
Simple Summary
Abstract
1. Introduction
2. Materials and Methods
2.1. Study Design and Participants
2.2. Data Collection
2.3. Clinical Characteristics of PCa Cases
2.4. Statistical Analysis
3. Results
3.1. Study Population
3.2. Identification of Dietary Patterns
3.3. Association between Dietary Patterns and PCa
4. Discussion
5. Conclusions
Supplementary Materials
Author Contributions
Funding
Institutional Review Board Statement
Informed Consent Statement
Data Availability Statement
Acknowledgments
Conflicts of Interest
References
- Sung, H.; Ferlay, J.; Siegel, R.L.; Laversanne, M.; Soerjomataram, I.; Jemal, A.; Bray, F. Global Cancer Statistics 2020: GLOBOCAN Estimates of Incidence and Mortality Worldwide for 36 Cancers in 185 Countries. CA Cancer J. Clin. 2021, 71, 209–249. [Google Scholar] [CrossRef] [PubMed]
- Rawla, P. Epidemiology of Prostate Cancer. World J. Oncol. 2019, 10, 63–89. [Google Scholar] [CrossRef] [PubMed]
- World Cancer Research Fund/American Institute for Cancer Research. Diet, Nutrition, Physical Activity and Cancer: A Global Perspective. Continuous Update Project Expert Report; World Cancer Research Fund International: London, UK, 2018. [Google Scholar]
- International Agency for Research on Cancer. List of Classifications by Cancer Sites with Sufficient or Limited Evidence in Humans, IARC Monographs Volumes 1–131. A Cancer Site Carcinogenic Agents with Sufficient Evidence in Humans; World Health Organization: Geneva, Switzerland, 2022. [Google Scholar]
- Cui, R.; Liu, Z.-Q.; Xu, Q. Blood α-Tocopherol, γ-Tocopherol Levels and Risk of Prostate Cancer: A Meta-Analysis of Prospective Studies. PLoS ONE 2014, 9, e93044. [Google Scholar] [CrossRef] [PubMed]
- Rowles, J.L., 3rd; Ranard, K.M.; Smith, J.W.; An, R.; Erdman, J.W., Jr. Increased dietary and circulating lycopene are associated with reduced prostate cancer risk: A systematic review and meta-analysis. Prostate Cancer Prostatic Dis. 2017, 20, 361–377. [Google Scholar] [CrossRef] [PubMed]
- Hurst, R.; Hooper, L.; Norat, T.; Lau, R.; Aune, D.; Greenwood, D.C.; Vieira, R.; Collings, R.; Harvey, L.J.; Sterne, J.A.; et al. Selenium and prostate cancer: Systematic review and meta-analysis. Am. J. Clin. Nutr. 2012, 96, 111–122. [Google Scholar] [CrossRef] [PubMed]
- Aune, D.; Rosenblatt, D.A.N.; Chan, D.S.M.; Vieira, A.R.; Vieira, R.; Greenwood, D.C.; Vatten, L.J.; Norat, T. Dairy products, calcium, and prostate cancer risk: A systematic review and meta-analysis of cohort studies. Am. J. Clin. Nutr. 2014, 101, 87–117. [Google Scholar] [CrossRef]
- Travis, R.C.; Perez-Cornago, A.; Appleby, P.N.; Albanes, D.; Joshu, C.E.; Lutsey, P.L.; Mondul, A.M.; Platz, E.A.; Weinstein, S.J.; Layne, T.M.; et al. A Collaborative Analysis of Individual Participant Data from 19 Prospective Studies Assesses Circulating Vitamin D and Prostate Cancer Risk. Cancer Res. 2019, 79, 274–285. [Google Scholar] [CrossRef]
- Gutiérrez-González, E.; Castelló, A.; Fernández-Navarro, P.; Castaño-Vinyals, G.; Llorca, J.; Salas-Trejo, D.; Salcedo-Bellido, I.; Aragonés, N.; Fernández-Tardón, G.; Alguacil, J.; et al. Dietary Zinc and Risk of Prostate Cancer in Spain: MCC-Spain Study. Nutrients 2018, 11, 18. [Google Scholar] [CrossRef]
- Steck, E.S.; Omofuma, O.O.; Su, L.J.; Maise, A.A.; Woloszynska-Read, A.; Johnson, C.S.; Zhang, H.; Bensen, J.T.; Fontham, E.T.H.; Mohler, J.L.; et al. Calcium, magnesium, and whole-milk intakes and high-aggressive prostate cancer in the North Carolina–Louisiana Prostate Cancer Project (PCaP). Am. J. Clin. Nutr. 2018, 107, 799–807. [Google Scholar] [CrossRef]
- Sinha, R.; Park, Y.; Graubard, B.I.; Leitzmann, M.F.; Hollenbeck, A.; Schatzkin, A.; Cross, A.J. Meat and Meat-related Compounds and Risk of Prostate Cancer in a Large Prospective Cohort Study in the United States. Am. J. Epidemiol. 2009, 170, 1165–1177. [Google Scholar] [CrossRef]
- Perez-Cornago, A.; Travis, R.C.; Appleby, P.N.; Tsilidis, K.K.; Tjonneland, A.; Olsen, A.; Overvad, K.; Katzke, V.; Kuehn, T.; Trichopoulou, A.; et al. Fruit and vegetable intake and prostate cancer risk in the European Prospective Investigation into Cancer and Nutrition (EPIC). Int. J. Cancer 2017, 141, 287–297. [Google Scholar] [CrossRef]
- Lin, P.-H.; Aronson, W.; Freedland, S.J. An update of research evidence on nutrition and prostate cancer. Urol. Oncol. Semin. Orig. Investig. 2019, 37, 387–401. [Google Scholar] [CrossRef] [PubMed]
- Ballon-Landa, E.; Parsons, J.K. Nutrition, physical activity, and lifestyle factors in prostate cancer prevention. Curr. Opin. Urol. 2018, 28, 55–61. [Google Scholar] [CrossRef]
- Jacobs, D.R.; Tapsell, L.C. Food synergy: The key to a healthy diet. Proc. Nutr. Soc. 2013, 72, 200–206. [Google Scholar] [CrossRef] [PubMed]
- Solans, M.; Coenders, G.; Marcos-Gragera, R.; Castelló, A.; Gràcia-Lavedan, E.; Benavente, Y.; Moreno, V.; Pérez-Gómez, B.; Amiano, P.; Fernández-Villa, T.; et al. Compositional analysis of dietary patterns. Stat. Methods Med. Res. 2018, 28, 2834–2847. [Google Scholar] [CrossRef]
- Kelly, O.J.; Gilman, J.C.; Ilich, J.Z. Utilizing Dietary Micronutrient Ratios in Nutritional Research May be More Informative than Focusing on Single Nutrients. Nutrients 2018, 10, 107. [Google Scholar] [CrossRef] [PubMed]
- Murakami, K.; Shinozaki, N.; Fujiwara, A.; Yuan, X.; Hashimoto, A.; Fujihashi, H.; Wang, H.-C.; Livingstone, M.B.E.; Sasaki, S. A Systematic Review of Principal Component Analysis–Derived Dietary Patterns in Japanese Adults: Are Major Dietary Patterns Reproducible within a Country? Adv. Nutr. 2019, 10, 237–249. [Google Scholar] [CrossRef]
- Schwedhelm, C.; Iqbal, K.; Knüppel, S.; Schwingshackl, L.; Boeing, H. Contribution to the understanding of how principal component analysis–derived dietary patterns emerge from habitual data on food consumption. Am. J. Clin. Nutr. 2018, 107, 227–235. [Google Scholar] [CrossRef]
- Trudeau, K.; Rousseau, M.-C.; Barul, C.; Csizmadi, I.; Parent, M. Dietary Patterns Are Associated with Risk of Prostate Cancer in a Population-Based Case-Control Study in Montreal, Canada. Nutrients 2020, 12, 1907. [Google Scholar] [CrossRef]
- Castelló, A.; Boldo, E.; Amiano, P.; Castaño-Vinyals, G.; Aragones, N.; Gomez-Acebo, I.; Peiró, R.; Jimenez-Moleon, J.J.; Alguacil, J.; Tardon, A.; et al. Mediterranean Dietary Pattern is Associated with Low Risk of Aggressive Prostate Cancer: MCC-Spain Study. J. Urol. 2018, 199, 430–437. [Google Scholar] [CrossRef]
- Rosato, V.; Edefonti, V.; Bravi, F.; Bosetti, C.; Bertuccio, P.; Talamini, R.; Maso, L.D.; Montella, M.; Ferraroni, M.; La Vecchia, C.; et al. Nutrient-based dietary patterns and prostate cancer risk: A case-control study from Italy. Cancer Causes Control 2014, 25, 525–532. [Google Scholar] [CrossRef] [PubMed]
- Pou, S.A.; Niclis, C.; Aballay, L.R.; Tumas, N.; Roman, M.D.; Munoz, E.S.; Coquet, J.B.; Diaz, M.D.P. Cancer and Its Association with Dietary Patterns in Córdoba (Argentina). Nutr. Hosp. 2014, 29, 618–628. [Google Scholar] [CrossRef] [PubMed]
- Ambrosini, G.L.; Fritschi, L.; de Klerk, N.H.; Mackerras, D.; Leavy, J. Dietary Patterns Identified Using Factor Analysis and Prostate Cancer Risk: A Case Control Study in Western Australia. Ann. Epidemiol. 2008, 18, 364–370. [Google Scholar] [CrossRef] [PubMed]
- Shin, S.; The JPHC Study Group; Saito, E.; Sawada, N.; Ishihara, J.; Takachi, R.; Nanri, A.; Shimazu, T.; Yamaji, T.; Iwasaki, M.; et al. Dietary patterns and prostate cancer risk in Japanese: The Japan Public Health Center-based Prospective Study (JPHC Study). Cancer Causes Control 2018, 29, 589–600. [Google Scholar] [CrossRef]
- Jalilpiran, Y.; Dianatinasab, M.; Zeighami, S.; Bahmanpour, S.; Ghiasvand, R.; Mohajeri, S.A.R.; Faghih, S. Western Dietary Pattern, but not Mediterranean Dietary Pattern, Increases the Risk of Prostate Cancer. Nutr. Cancer 2018, 70, 851–859. [Google Scholar] [CrossRef]
- Bagheri, A.; Nachvak, S.M.; Rezaei, M.; Moravridzade, M.; Moradi, M.; Nelson, M. Dietary patterns and risk of prostate cancer: A factor analysis study in a sample of Iranian men. Health Promot. Perspect. 2018, 8, 133–138. [Google Scholar] [CrossRef]
- Niclis, C.; Román, M.D.; Osella, A.R.; Eynard, A.R.; Diaz, M.D.P. Traditional Dietary Pattern Increases Risk of Prostate Cancer in Argentina: Results of a Multilevel Modeling and Bias Analysis from a Case-Control Study. J. Cancer Epidemiol. 2015, 2015, 179562. [Google Scholar] [CrossRef]
- Alva, A.; Hussain, M. The Changing Natural History of Metastatic Prostate Cancer. Cancer J. 2013, 19, 19–24. [Google Scholar] [CrossRef]
- Albertsen, P.C. Observational studies and the natural history of screen-detected prostate cancer. Curr. Opin. Urol. 2015, 25, 232–237. [Google Scholar] [CrossRef]
- Maggi, M.; Cowan, J.E.; Fasulo, V.; Washington, S.L.; Lonergan, P.E.; Sciarra, A.; Nguyen, H.G.; Carroll, P.R. The Long-Term Risks of Metastases in Men on Active Surveillance for Early Stage Prostate Cancer. J. Urol. 2020, 204, 1222–1228. [Google Scholar] [CrossRef]
- Jackson, M.; Tulloch-Reid, M.; Walker, S.; McFarlane-Anderson, N.; Bennett, F.; Francis, D.; Coard, K. Dietary Patterns as Predictors of Prostate Cancer in Jamaican Men. Nutr. Cancer 2013, 65, 367–374. [Google Scholar] [CrossRef] [PubMed]
- Muller, D.C.; Severi, G.; Baglietto, L.; Krishnan, K.; English, D.R.; Hopper, J.L.; Giles, G.G. Dietary Patterns and Prostate Cancer Risk. Cancer Epidemiol. Biomark. Prev. 2009, 18, 3126–3129. [Google Scholar] [CrossRef] [PubMed]
- Rocío, O.-R.; Macarena, L.-L.; Inmaculada, S.-B.; Antonio, J.-P.; Fernando, V.-A.; Marta, G.-C.; María-José, S.; José-Juan, J.-M. Compliance with the 2018 World Cancer Research Fund/American Institute for Cancer Research Cancer Prevention Recommendations and Prostate Cancer. Nutrients 2020, 12, 768. [Google Scholar] [CrossRef] [PubMed]
- Lozano-Lorca, M.; Olmedo-Requena, R.; Vega-Galindo, M.-V.; Vázquez-Alonso, F.; Jiménez-Pacheco, A.; Salcedo-Bellido, I.; Sánchez, M.-J.; Jiménez-Moleón, J.-J. Night Shift Work, Chronotype, Sleep Duration, and Prostate Cancer Risk: CAPLIFE Study. Int. J. Environ. Res. Public Health 2020, 17, 6300. [Google Scholar] [CrossRef]
- International Statistical Classification of Diseases and Related Health Problems 10th Revision. ICD-10 Version: 2016. Available online: https://icd.who.int/browse10/2016/en (accessed on 20 January 2020).
- Willett, W. Nutritional Epidemiology; Oxford University Press: Oxford, UK, 2013; ISBN 9780199979448. [Google Scholar]
- Viñas, B.R.; Barba, L.R.; Ngo, J.; Majem, L.S. Validación en población catalana del cuestionario internacional de actividad física. Gac. Sanit. 2013, 27, 254–257. [Google Scholar] [CrossRef]
- Fernández-Ballart, J.D.; Piñol, J.L.; Zazpe, I.; Corella, D.; Carrasco, P.; Toledo, E.; Perez-Bauer, M.; Martínez-González, M.Á.; Salas-Salvadó, J.; Martín-Moreno, J.M. Relative validity of a semi-quantitative food-frequency questionnaire in an elderly Mediterranean population of Spain. Br. J. Nutr. 2010, 103, 1808–1816. [Google Scholar] [CrossRef]
- Martin-Moreno, J.M.; Boyle, P.; Gorgojo, L.; Maisonneuve, P.; Fernandez-Rodriguez, J.C.; Salvini, S.; Willett, W.C. Development and Validation of a Food Frequency Questionnaire in Spain. Int. J. Epidemiol. 1993, 22, 512–519. [Google Scholar] [CrossRef]
- Moreiras, O.; Carbajal, Á.; Cabrera, L.; Cuadrado, C. Tablas de Composición de Alimentos; Ediciones Pirámide: Madrid, Spain, 2003. [Google Scholar]
- Neuzillet, Y.; Raynaud, J.-P.; Dreyfus, J.-F.; Radulescu, C.; Rouanne, M.; Schneider, M.; Krish, S.; Rouprêt, M.; Drouin, S.J.; Comperat, E.; et al. Aggressiveness of Localized Prostate Cancer: The Key Value of Testosterone Deficiency Evaluated by Both Total and Bioavailable Testosterone: AndroCan Study Results. Horm. Cancer 2018, 10, 36–44. [Google Scholar] [CrossRef]
- Epstein, J.I.; Egevad, L.; Amin, M.B.; Delahunt, B.; Srigley, J.R.; Humphrey, P.A. The 2014 International Society of Urological Pathology (ISUP) Consensus Conference on Gleason Grading of Prostatic Carcinoma: Definition of Grading Patterns and Proposal for a New Grading System. Am. J. Surg. Pathol. 2015, 40, 244–252. [Google Scholar] [CrossRef]
- Mottet, N.; van den Bergh, R.C.N.; Vice-Chair, P.C.; de Santis, M.; Gillessen, S.; Govorov, A.; Grummet, J.; Henry, A.M.; Lam, T.B.; Mason, M.D.; et al. EAU-ESTRO-ESUR-SIOG Guidelines on Prostate Cancer. Eur. Assoc. Urol. 2018, 73, e134–e135. [Google Scholar]
- Martínez-González, M.A.; Sánchez-Villegas, A.; Toledo Atucha, E.; Faulín, F.J. Bioestadística Amigable; Elsevier: Madrid, Spain, 2014; p. 596. [Google Scholar]
- Tseng, M.; Breslow, R.A.; DeVellis, R.F.; Ziegler, R.G. Dietary Patterns and Prostate Cancer Risk in the National Health and Nutrition Examination Survey Epidemiological Follow-up Study Cohort. Cancer Epidemiol. Biomark. Prev. 2004, 13, 71–77. [Google Scholar] [CrossRef] [PubMed]
- De Stefani, E.; Deneo-Pellegrini, H.; Boffetta, P.; Ronco, A.L.; Aune, D.; Acosta, G.; Mendilaharsu, M.; Brennan, P.; Ferro, G. Dietary patterns and risk of cancer: A factor analysis in Uruguay. Int. J. Cancer 2008, 124, 1391–1397. [Google Scholar] [CrossRef] [PubMed]
- Walker, M.; Aronson, K.J.; King, W.; Wilson, J.W.L.; Fan, W.; Heaton, J.P.W.; MacNeily, A.; Nickel, J.C.; Morales, A. Dietary patterns and risk of prostate cancer in Ontario, Canada. Int. J. Cancer 2005, 116, 592–598. [Google Scholar] [CrossRef] [PubMed]
- Pan, S.Y.; DesMeules, M. Energy Intake, Physical Activity, Energy Balance, and Cancer: Epidemiologic Evidence. Methods Mol. Biol. 2009, 472, 191–215. [Google Scholar] [CrossRef] [PubMed]
- Hsieh, L.J.; Carter, H.B.; Landis, P.K.; Tucker, K.L.; Metter, E.J.; Newschaffer, C.J.; Platz, E.A. Association of energy intake with prostate cancer in a long-term aging study: Baltimore Longitudinal Study of Aging (United States). Urology 2003, 61, 297–301. [Google Scholar] [CrossRef]
- Sadeghi, A.; Sadeghi, O.; Khodadost, M.; Pirouzi, A.; Hosseini, B.; Saedisomeolia, A. Dietary Glycemic Index and Glycemic Load and the Risk of Prostate Cancer: An Updated Systematic Review and Dose-Response Meta-Analysis. Nutr. Cancer 2019, 72, 5–14. [Google Scholar] [CrossRef]
- Lozano-Lorca, M.; Salcedo-Bellido, I.; Olmedo-Requena, R.; Castaño-Vinyals, G.; Amiano, P.; Shivappa, N.; Hébert, J.R.; Pérez-Gómez, B.; Gracia-Lavedan, E.; Gómez-Acebo, I.; et al. Dietary inflammatory index and prostate cancer risk: MCC-Spain study. Prostate Cancer Prostatic Dis. 2022, 1–8. [Google Scholar] [CrossRef]
- Jensen, O.M.; Wahrendorf, J.; Rosenqvist, A.; Geser, A. The Reliability of Questionnaire-Derived Historical Dietary Information and Temporal Stability of Food Habits in Individuals. Am. J. Epidemiol. 1984, 120, 281–290. [Google Scholar] [CrossRef]
- Bahrami, A.; Movahed, M.; Teymoori, F.; Mazandaranian, M.R.; Rashidkhani, B.; Hekmatdoost, A.; Hejazi, E. Dietary Nutrient Patterns and Prostate Cancer Risk: A Case-Control Study from Iran. Asian Pac. J. Cancer Prev. 2019, 20, 1415–1420. [Google Scholar] [CrossRef]
- De Stefani, E.; Boffetta, P.L.; Ronco, A.L.; Deneo-Pellegrini, H. Meat Consumption, Related Nutrients, Obesity and Risk of Prostate Cancer: A Case-Control Study in Uruguay. Asian Pac. J. Cancer Prev. 2016, 17, 1937–1945. [Google Scholar] [CrossRef][Green Version]


| Controls n = 393 | PCa Cases n = 428 | p-Value | |
|---|---|---|---|
| Age (years), median (IQR) | 66.5 (61.3–72.3) | 68.5 (62.8–73.9) | 0.005 |
| Education, n (%) | 0.377 | ||
| Primary | 109 (27.8) | 124 (28.9) | |
| Secondary | 199 (50.6) | 228 (53.3) | |
| University | 85 (21.6) | 76 (17.8) | |
| Employment status, n (%) | 0.602 | ||
| Retired | 264 (67.1) | 298 (69.7) | |
| Currently working | 103 (26.2) | 99 (23.1) | |
| Unemployed | 26 (6.6) | 30 (7.0) | |
| Missing | - | 1 (0.2) | |
| Marital status, n (%) | 0.760 | ||
| Married | 330 (83.9) | 356 (83.2) | |
| Not married | 63 (16.1) | 72 (16.8) | |
| Comorbidities, n (%) | 0.740 | ||
| 0–2 | 364 (92.9) | 399 (93.4) | |
| ≥3 | 28 (7.1) | 28 (6.6) | |
| Missing | 1 | 1 | |
| Smoking status, n (%) | 0.853 | ||
| Never smoker | 104 (26.4) | 112 (26.2) | |
| Former smoker | 217 (55.2) | 231 (53.9) | |
| Current smoker | 72 (18.4) | 85 (19.9) | |
| BMI, n (%) | 0.758 | ||
| Normal weight | 72 (18.4) | 87 (20.3) | |
| Overweight | 207 (52.6) | 219 (51.2) | |
| Obesity | 114 (29.0) | 121 (28.3) | |
| Missing | - | 1 (0.2) | |
| Physical activity, n (%) | 0.158 | ||
| High | 133 (33.8) | 166 (38.7) | |
| Moderate | 201 (51.2) | 214 (50.0) | |
| Low | 59 (15.0) | 48 (11.3) | |
| Sedentary behavior (h/day), median (IQR) | 7.0 (5.0–9.0) | 7.0 (5.0–10.0) | 0.268 |
| Energy intake (Kcal/day), median (IQR) | 2290.3 (1943.1–2809.4) | 2428.9 (2057.5–2918.9) | 0.021 |
| Alcohol consumption (g/day), median (IQR) | 7.3 (1.4–15.9) | 8.0 (1.5–18.5) | 0.349 |
| First-degree family history of PCa, n (%) | <0.001 | ||
| No | 350 (89.1) | 333 (77.8) | |
| Yes | 43 (10.9) | 94 (22.0) | |
| Missing | - | 1 (0.2) | |
| ISUP grade *, n (%) | - | ||
| 1–2 | - | 321 (75.2) | |
| 3–5 | - | 106 (24.8) | |
| Staging of PCa, n (%) | |||
| Localized | - | 369 (86.2) | |
| Locally advanced | - | 35 (8.2) | |
| Metastatic | - | 24 (5.6) |
| Food and Beverage Groups | Mediterranean Pattern | Western Pattern | Unhealthy Pattern |
|---|---|---|---|
| High-fat dairy | - | 0.37 | - |
| Eggs | 0.38 | - | - |
| Red meat | - | 0.71 | - |
| Processed meat | - | 0.72 | |
| White fish | 0.30 | - | - |
| Oily fish | 0.27 | - | - |
| Leafy vegetables | 0.75 | - | - |
| Fruiting vegetables | 0.79 | - | - |
| Root vegetables | 0.74 | - | - |
| Other vegetables | 0.68 | −0.27 | - |
| Legumes | 0.21 | - | - |
| Potatoes | 0.30 | −0.38 | - |
| Fruits | 0.35 | - | - |
| Nuts | 0.21 | - | - |
| Refined cereals | - | 0.22 | - |
| Other edible fats | - | - | 0.69 |
| Sweets | - | - | 0.62 |
| Sugary | - | - | 0.65 |
| Convenience food and sauces | - | 0.40 | 0.42 |
| Alcohol | - | 0.36 | - |
| Proportion of variance explained (%) | 10.4 | 6.4 | 5.7 |
| Cumulative variance explained (%) | 10.4 | 16.9 | 22.6 |
| Dietary Pattern | Controls/PCa Cases | aOR (95% CI) |
|---|---|---|
| Mediterranean pattern | ||
| Tertile 1 | 131/136 | Ref. |
| Tertile 2 | 131/140 | 0.92 (0.65–1.31) |
| Tertile 3 | 131/152 | 0.90 (0.63–1.29) |
| p-trend | 0.578 | |
| Western pattern | ||
| Tertile 1 | 131/124 | Ref. |
| Tertile 2 | 131/157 | 1.33 (0.93–1.90) |
| Tertile 3 | 131/147 | 1.25 (0.83–1.87) |
| p-trend | 0.289 | |
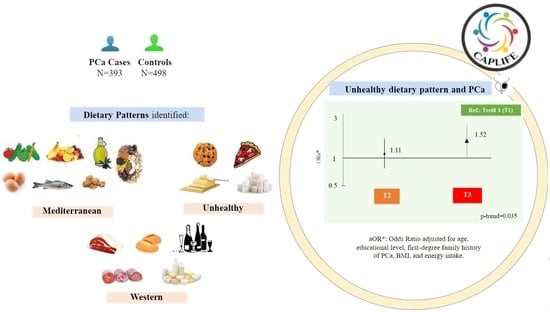
| Unhealthy pattern | ||
| Tertile 1 | 131/116 | Ref. |
| Tertile 2 | 131/133 | 1.11 (0.77–1.60) |
| Tertile 3 | 131/179 | 1.52 (1.02–2.27) |
| p-trend | 0.035 |
| Dietary Pattern | PCa Cases (n) | aOR (95% CI) | PCa Cases (n) | aOR (95% CI) | PCa Cases (n) | aOR (95% CI) | PCa Cases (n) | aOR (95% CI) |
|---|---|---|---|---|---|---|---|---|
| ISUP 1–2 | ISUP 3–5 | Localized PCa | Locally Advanced and/or Metastatic PCa | |||||
| Mediterranean pattern | ||||||||
| Tertile 1 | 102 | Ref. | 33 | Ref. | 115 | Ref. | 21 | Ref. |
| Tertile 2 | 105 | 0.94 (0.64–1.37) | 35 | 0.92 (0.53–1.62) | 122 | 0.96 (0.67–1.38) | 18 | 0.70 (0.35–1.40) |
| Tertile 3 | 114 | 0.94 (0.63–1.39) | 38 | 0.86 (0.49–1.51) | 132 | 0.94 (0.65–1.37) | 20 | 0.69 (0.34–1.38) |
| p-trend | 0.746 | 0.605 | 0.754 | 0.293 | ||||
| Western pattern | ||||||||
| Tertile 1 | 97 | Ref. | 27 | Ref. | 104 | Ref. | 29 | Ref. |
| Tertile 2 | 113 | 1.23 (0.84–1.82) | 45 | 1.54 (0.86–2.75) | 135 | 1.37 (0.94–1.99) | 42 | 1.10 (0.55–2.20) |
| Tertile 3 | 113 | 1.26 (0.81–1.94) | 34 | 1.19 (0.60–2.34) | 130 | 1.30 (0.86–1.98) | 33 | 0.93 (0.40–2.15) |
| p-trend | 0.302 | 0.642 | 0.223 | 0.881 | ||||
| Unhealthy pattern | ||||||||
| Tertile 1 | 82 | Ref. | 34 | Ref. | 98 | Ref. | 18 | Ref. |
| Tertile 2 | 103 | 1.22 (0.82–1.81) | 29 | 0.81 (0.45–1.46) | 115 | 1.11 (0.76–1.63) | 18 | 1.01 (0.49–2.09) |
| Tertile 3 | 136 | 1.67 (1.09–2.57) | 43 | 1.16 (0.63–2.13) | 156 | 1.56 (1.03–2.36) | 23 | 1.31 (0.61–2.84) |
| p-trend | 0.018 | 0.638 | 0.032 | 0.488 | ||||
Publisher’s Note: MDPI stays neutral with regard to jurisdictional claims in published maps and institutional affiliations. |
© 2022 by the authors. Licensee MDPI, Basel, Switzerland. This article is an open access article distributed under the terms and conditions of the Creative Commons Attribution (CC BY) license (https://creativecommons.org/licenses/by/4.0/).
Share and Cite
Lozano-Lorca, M.; Rodríguez-González, M.; Salcedo-Bellido, I.; Vázquez-Alonso, F.; Arrabal, M.; Martín-Castaño, B.; Sánchez, M.-J.; Jiménez-Moleón, J.-J.; Olmedo-Requena, R. Dietary Patterns and Prostate Cancer: CAPLIFE Study. Cancers 2022, 14, 3475. https://doi.org/10.3390/cancers14143475
Lozano-Lorca M, Rodríguez-González M, Salcedo-Bellido I, Vázquez-Alonso F, Arrabal M, Martín-Castaño B, Sánchez M-J, Jiménez-Moleón J-J, Olmedo-Requena R. Dietary Patterns and Prostate Cancer: CAPLIFE Study. Cancers. 2022; 14(14):3475. https://doi.org/10.3390/cancers14143475
Chicago/Turabian StyleLozano-Lorca, Macarena, Margarita Rodríguez-González, Inmaculada Salcedo-Bellido, Fernando Vázquez-Alonso, Miguel Arrabal, Benita Martín-Castaño, María-José Sánchez, José-Juan Jiménez-Moleón, and Rocío Olmedo-Requena. 2022. "Dietary Patterns and Prostate Cancer: CAPLIFE Study" Cancers 14, no. 14: 3475. https://doi.org/10.3390/cancers14143475
APA StyleLozano-Lorca, M., Rodríguez-González, M., Salcedo-Bellido, I., Vázquez-Alonso, F., Arrabal, M., Martín-Castaño, B., Sánchez, M.-J., Jiménez-Moleón, J.-J., & Olmedo-Requena, R. (2022). Dietary Patterns and Prostate Cancer: CAPLIFE Study. Cancers, 14(14), 3475. https://doi.org/10.3390/cancers14143475