Impact of Anti-Angiogenic Treatment on Bone Vascularization in a Murine Model of Breast Cancer Bone Metastasis Using Synchrotron Radiation Micro-CT

 ,
,  ,
,
Abstract
:Simple Summary
Abstract
1. Introduction
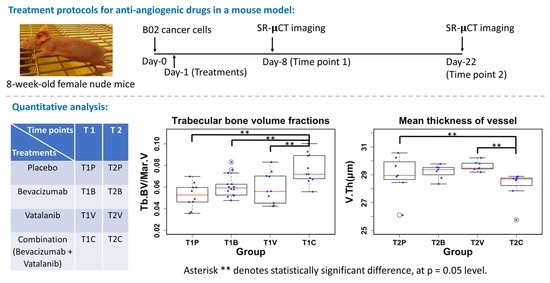
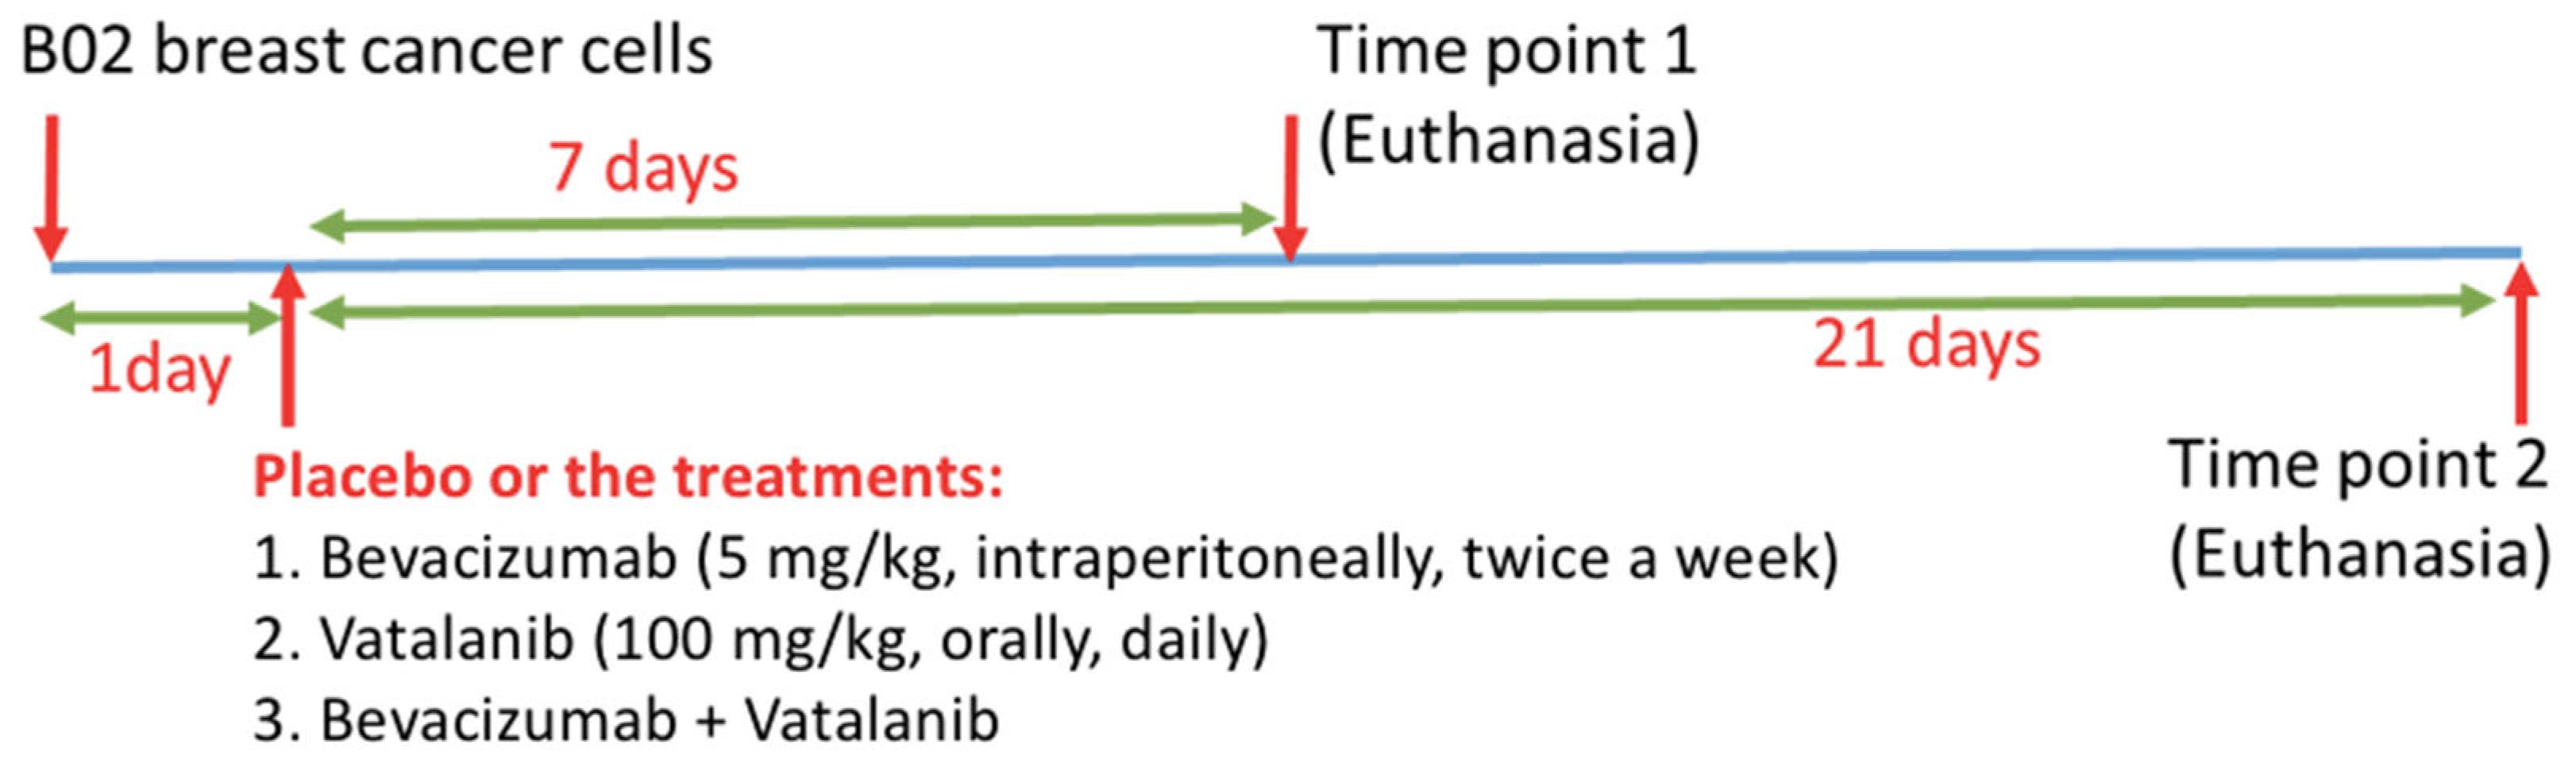
2. Methods
2.1. Sample Preparation
2.2. Synchrotron Radiation Microcomputed Tomography (SR-µCT)
2.3. Image Pre-Processing
2.4. Image Segmentation
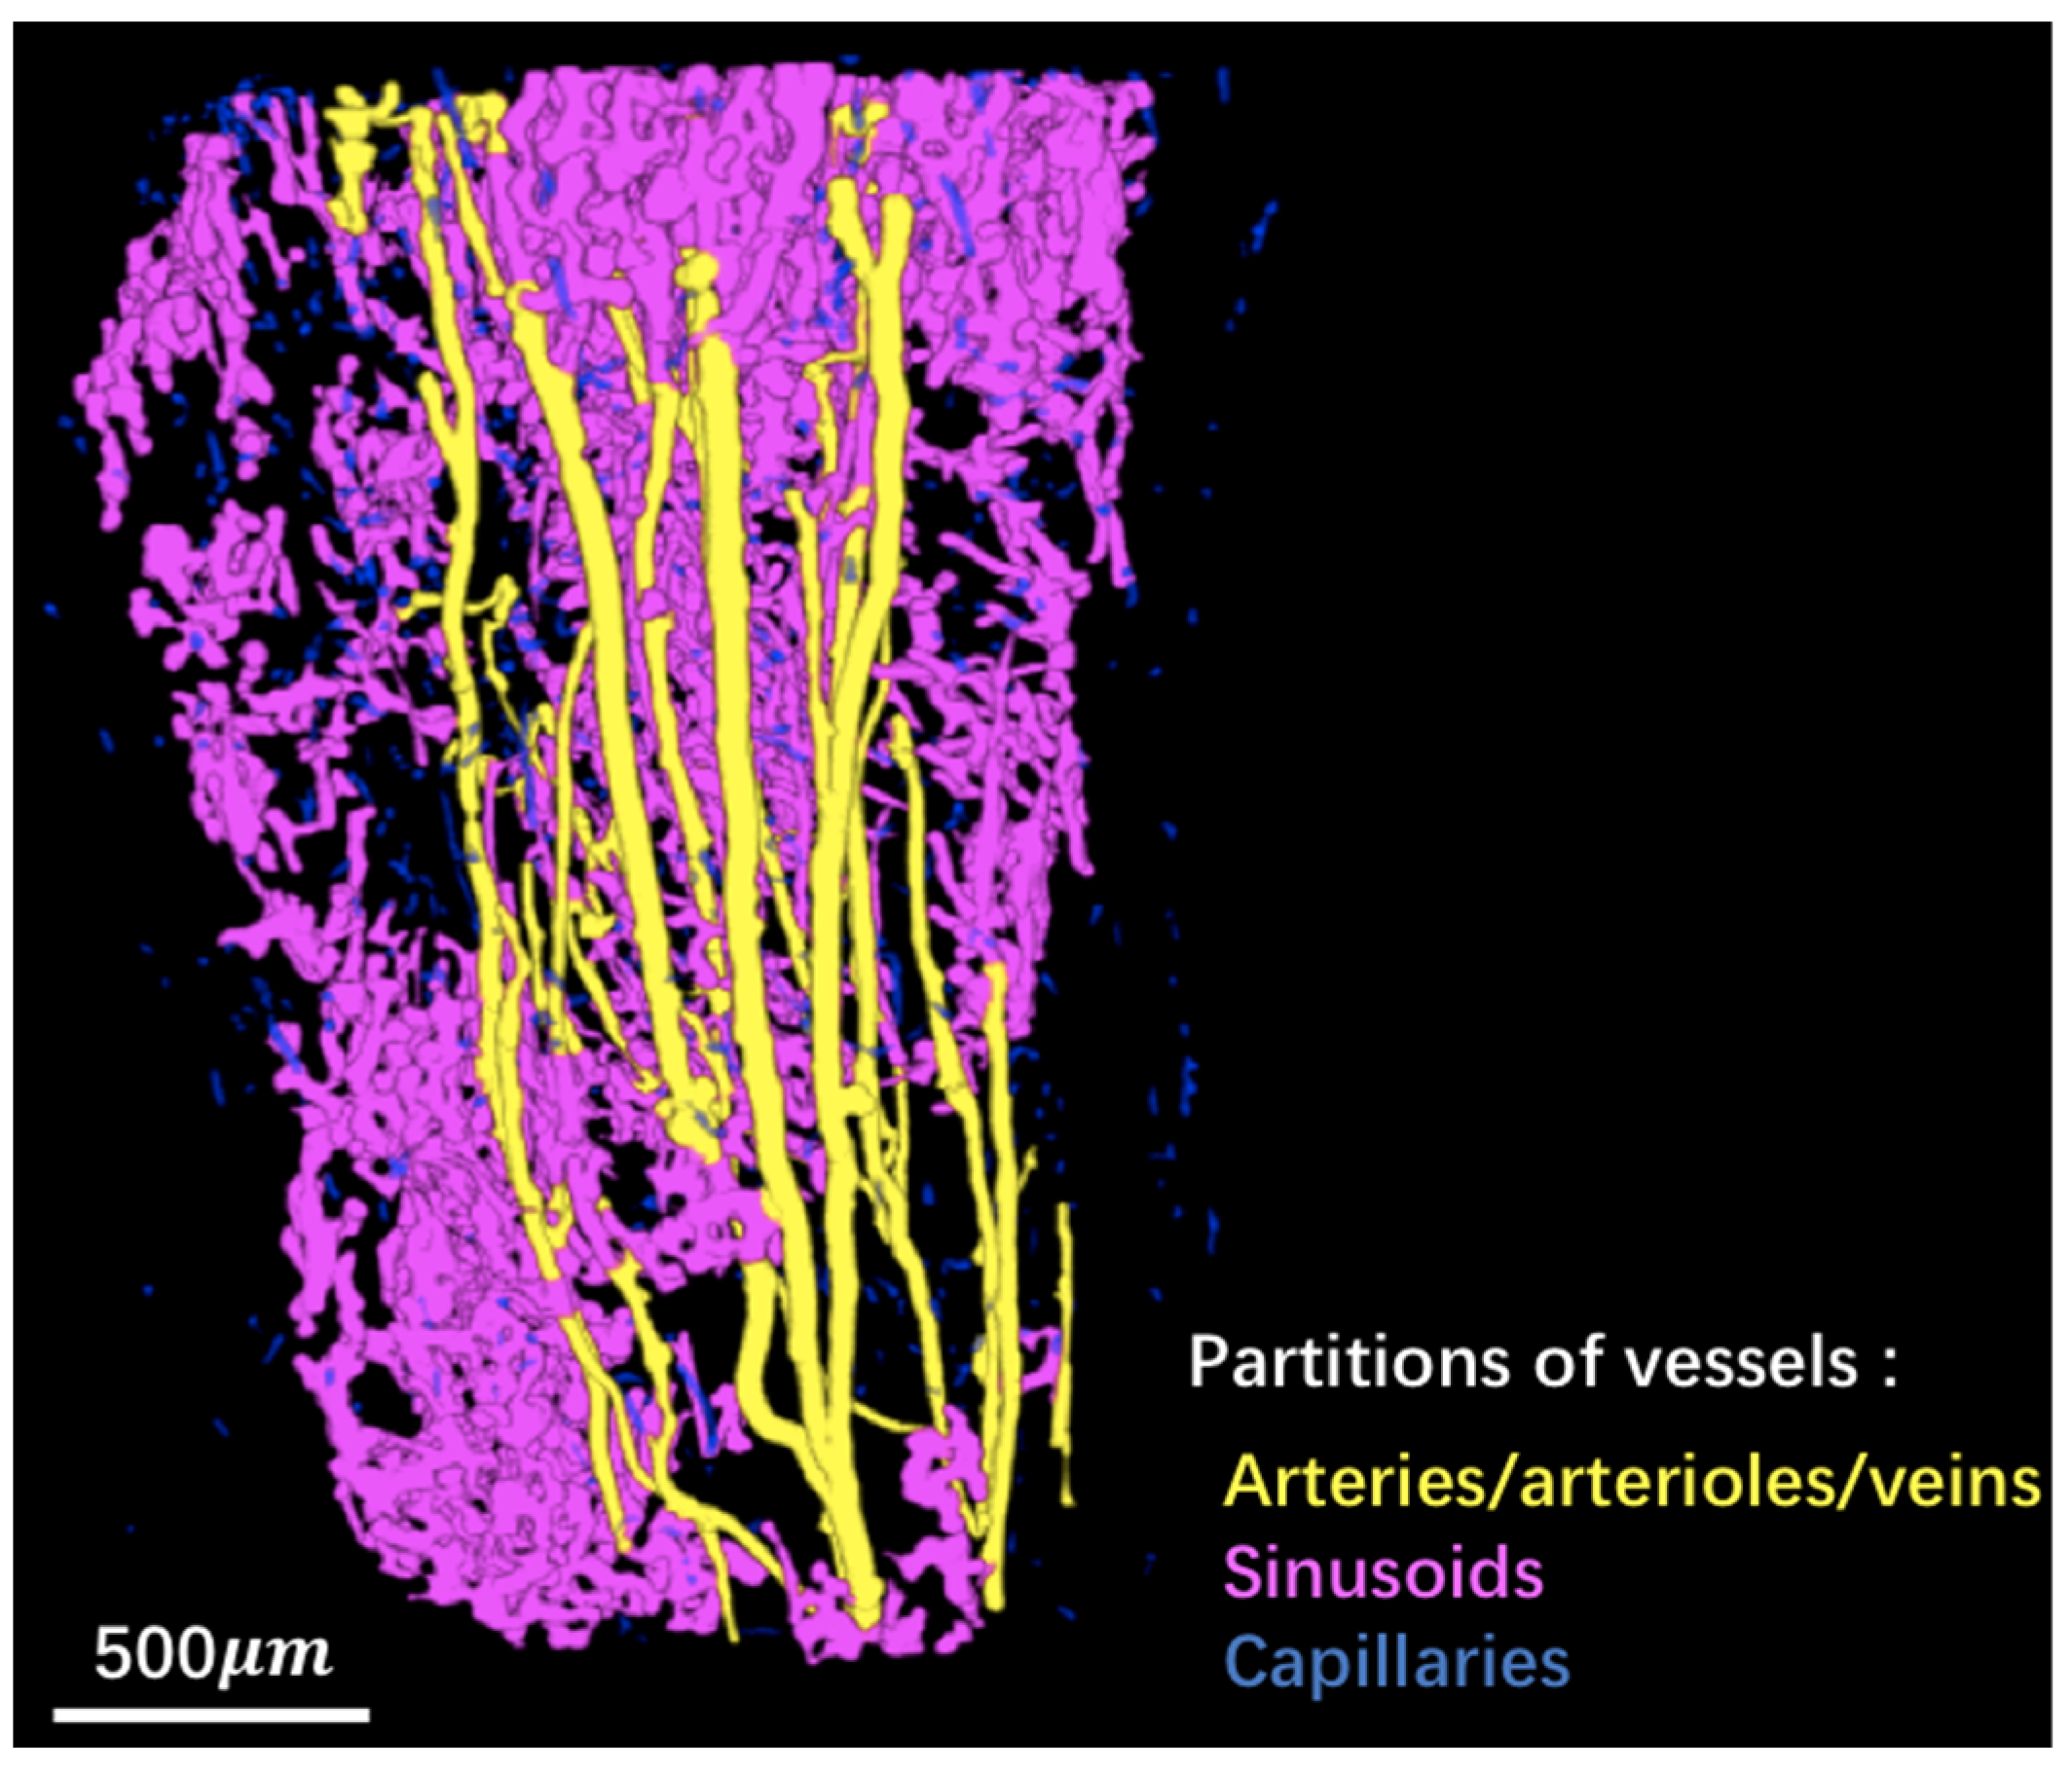
2.5. Enhancement of the Vascular Network
2.6. Quantitative Parameters
2.6.1. Volume Fraction
- Bone volume (BV): the entire bone volume (cortex + trabeculae).
- Vessel volume (VV)
- Total volume (TV): volume inside the outer contour of the cortical bone.
- Trabecular bone volume (Tb.BV)
- Marrow cavity volume (Mar.V)
2.6.2. Local Thickness
2.6.3. Fractal Dimension
2.6.4. Structure Model Index
2.6.5. Connectivity Density
2.7. Statistical Analysis
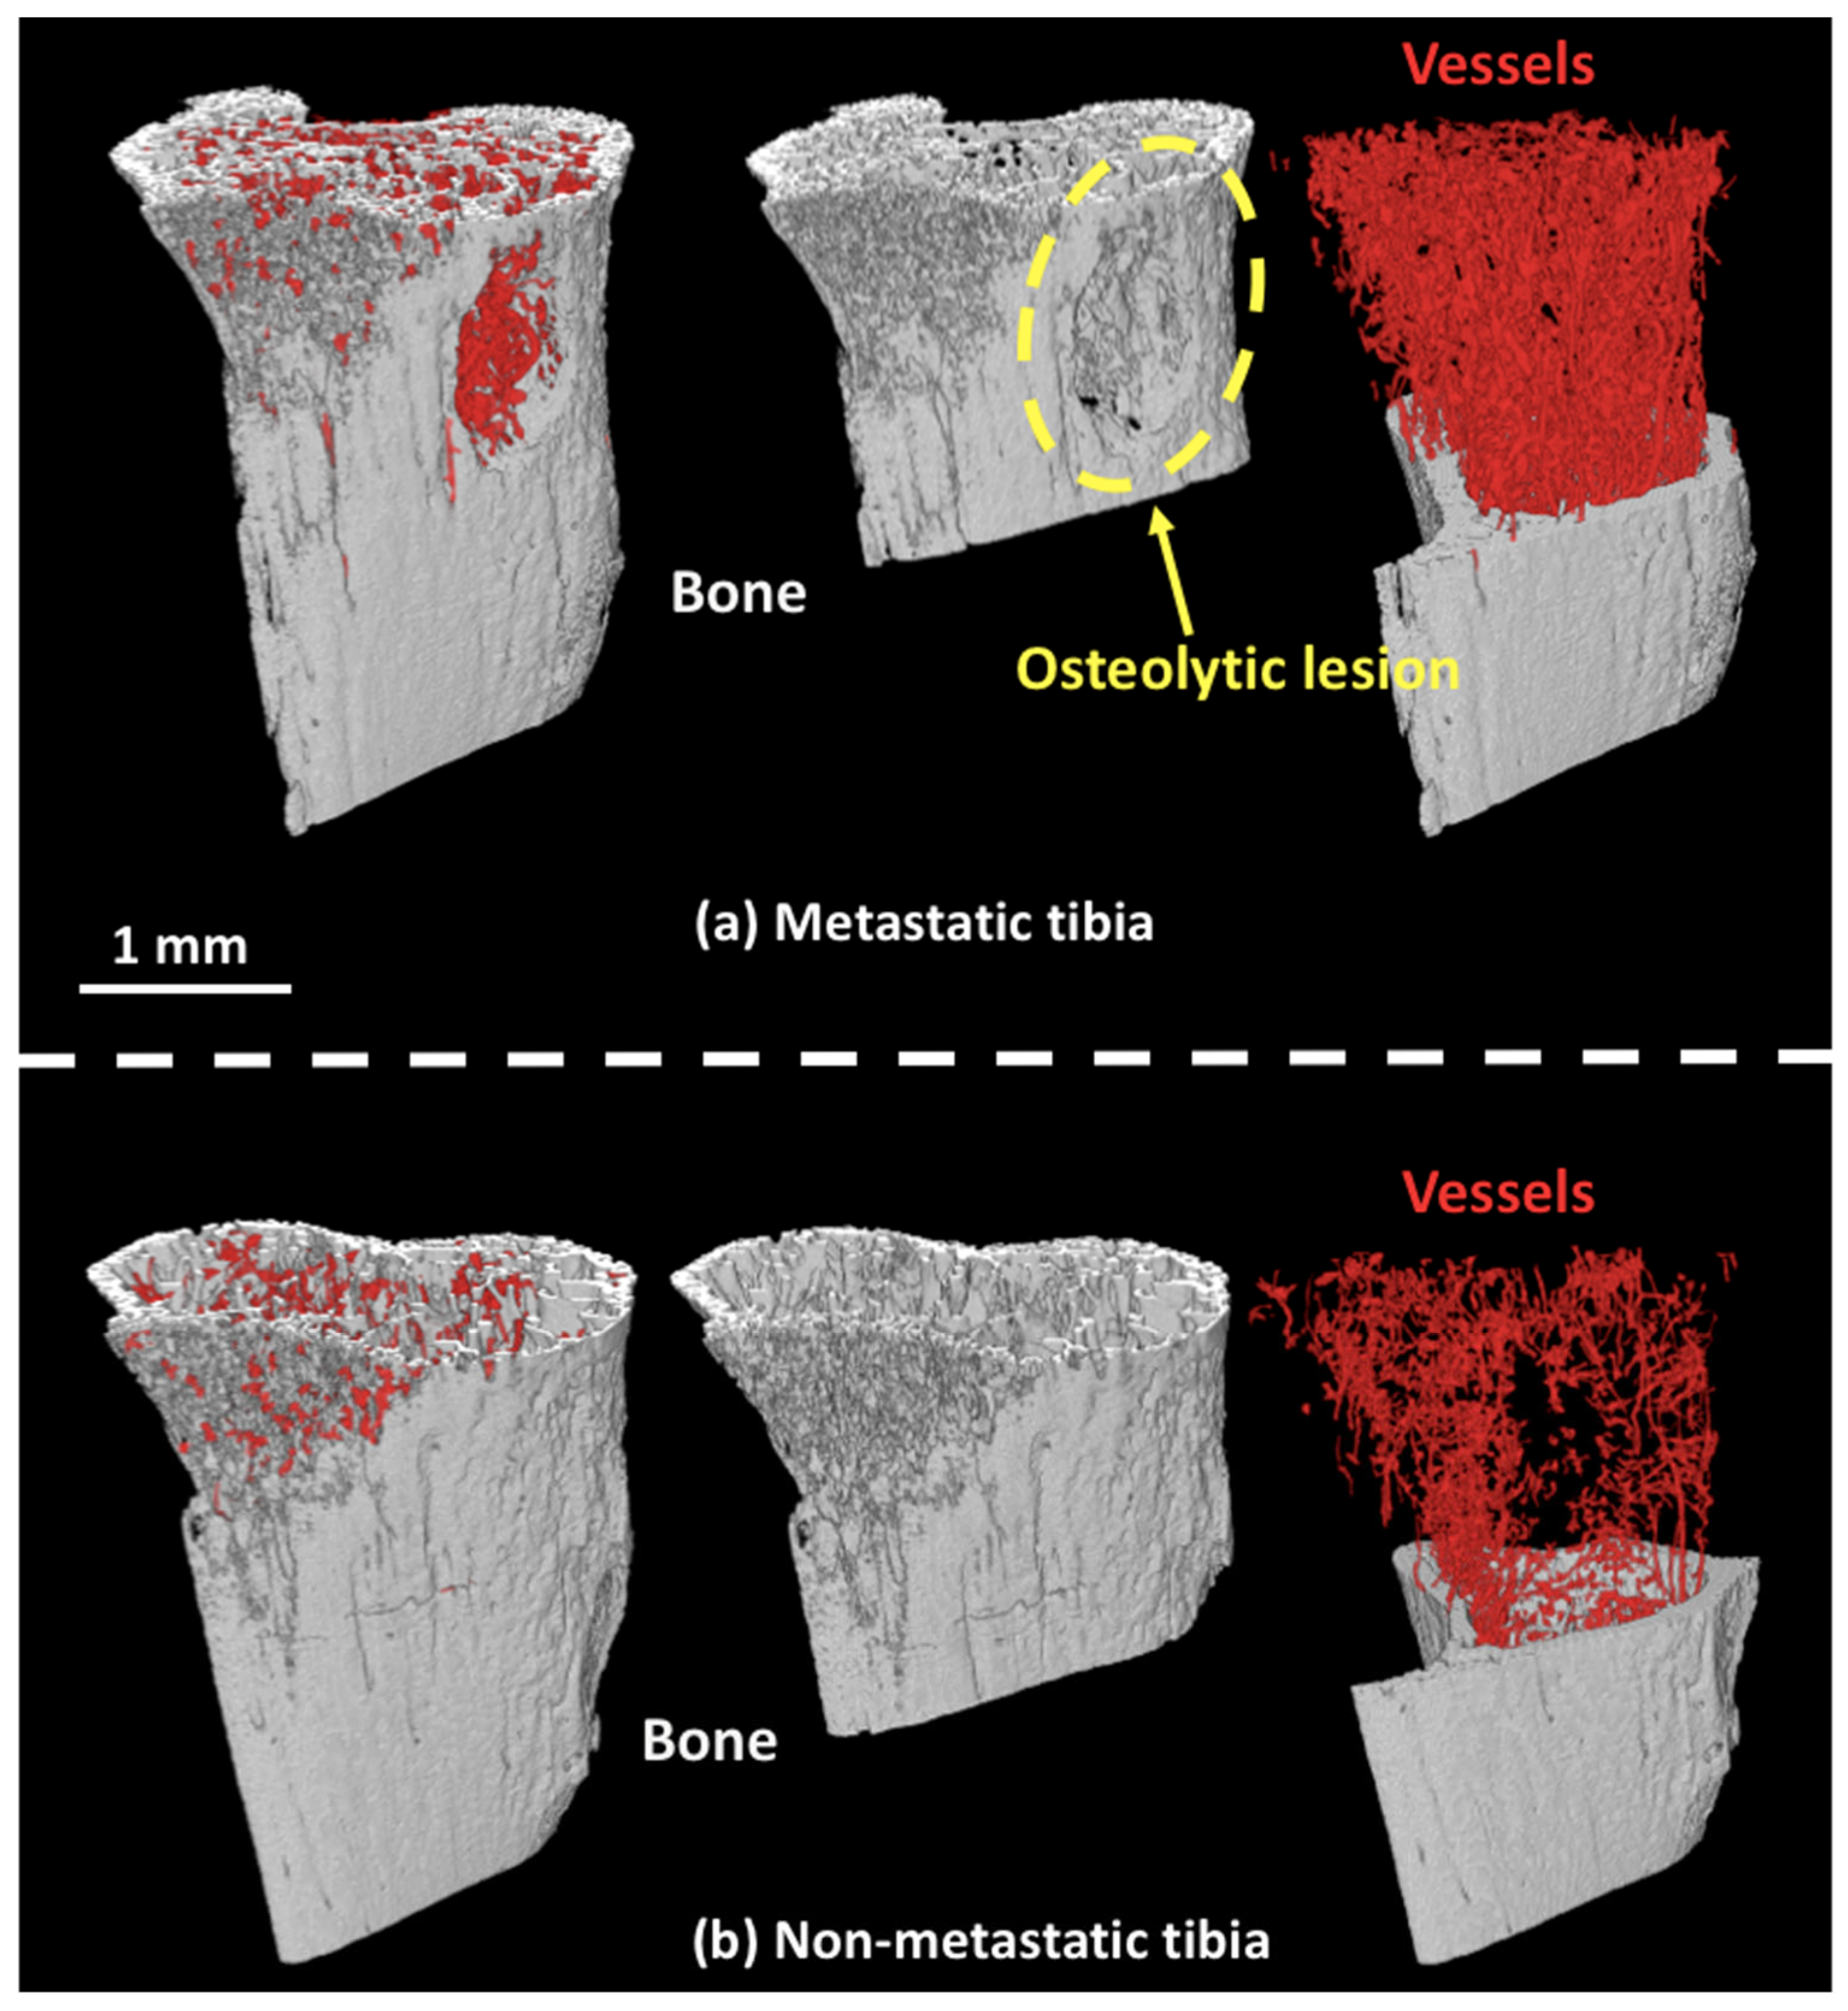
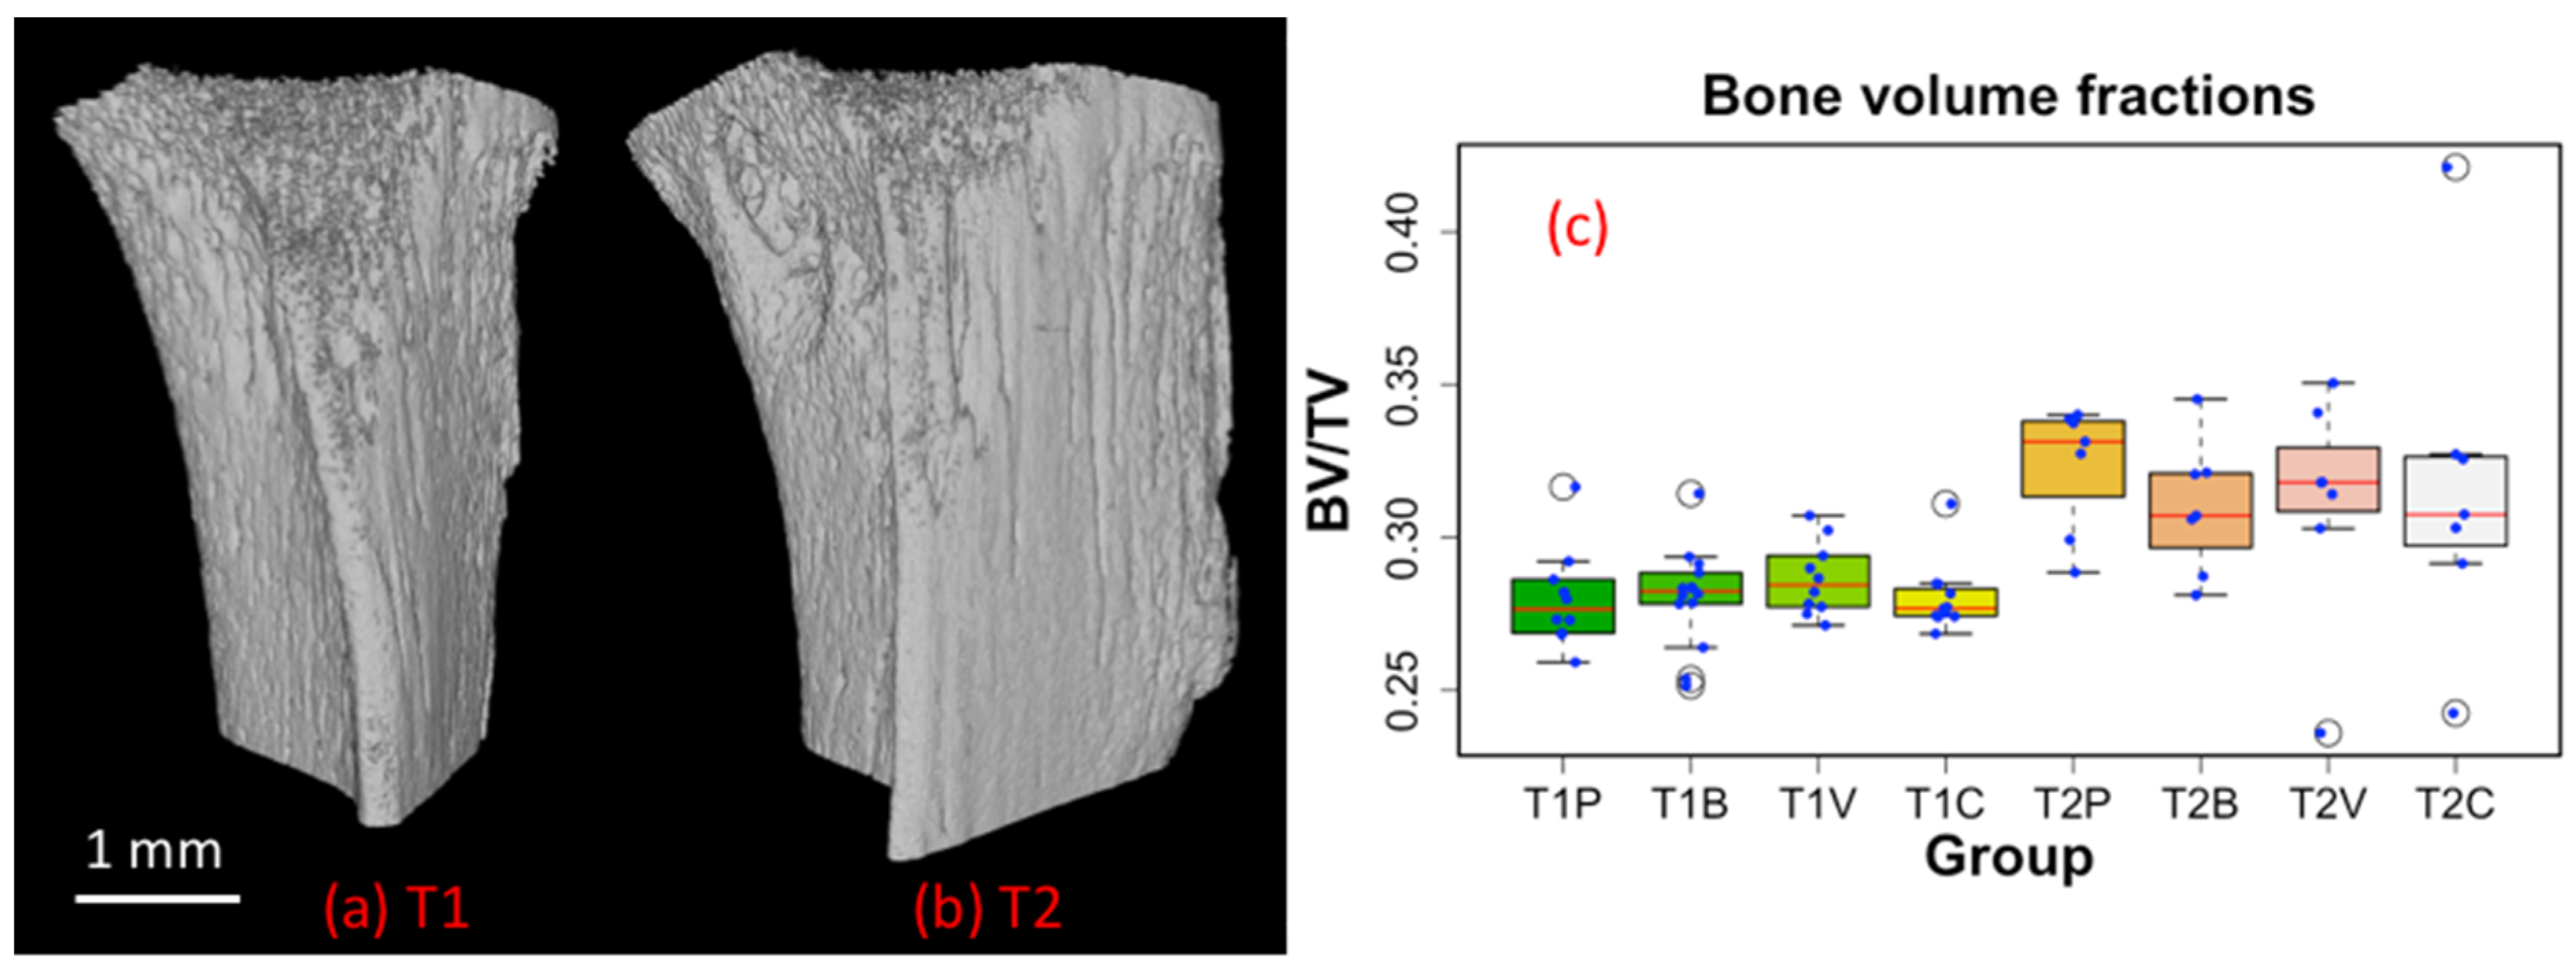
3. Results
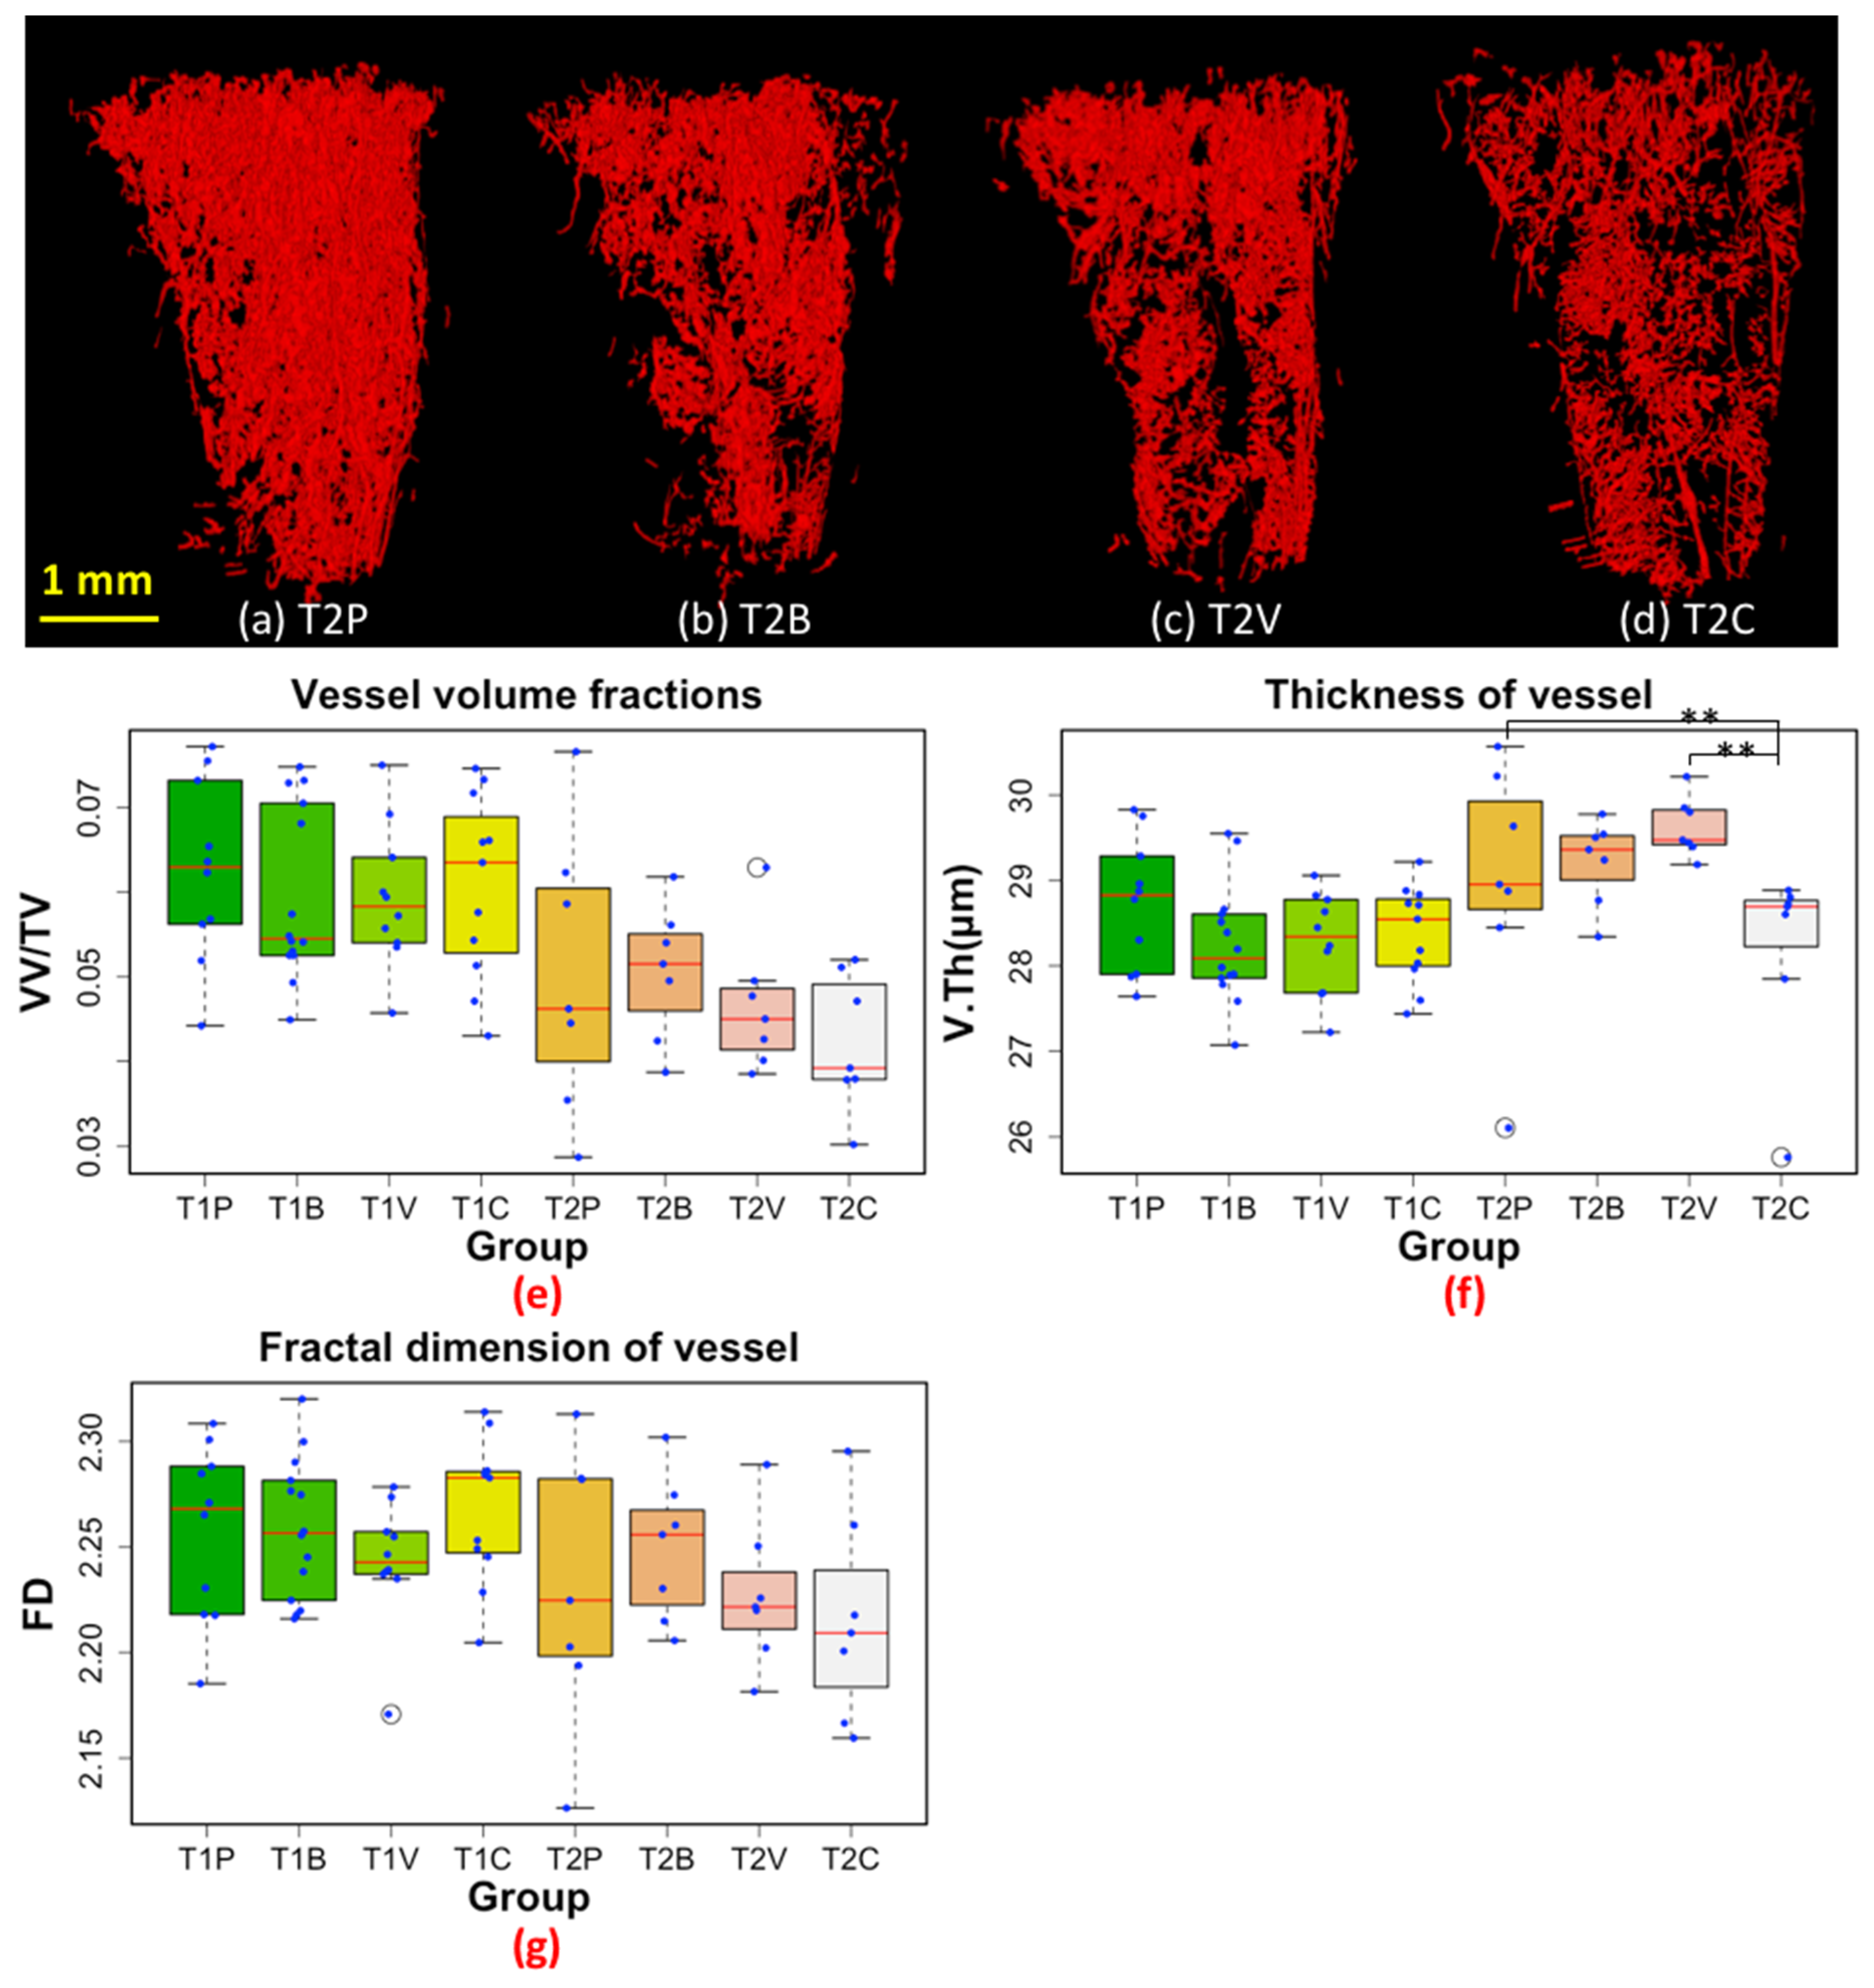
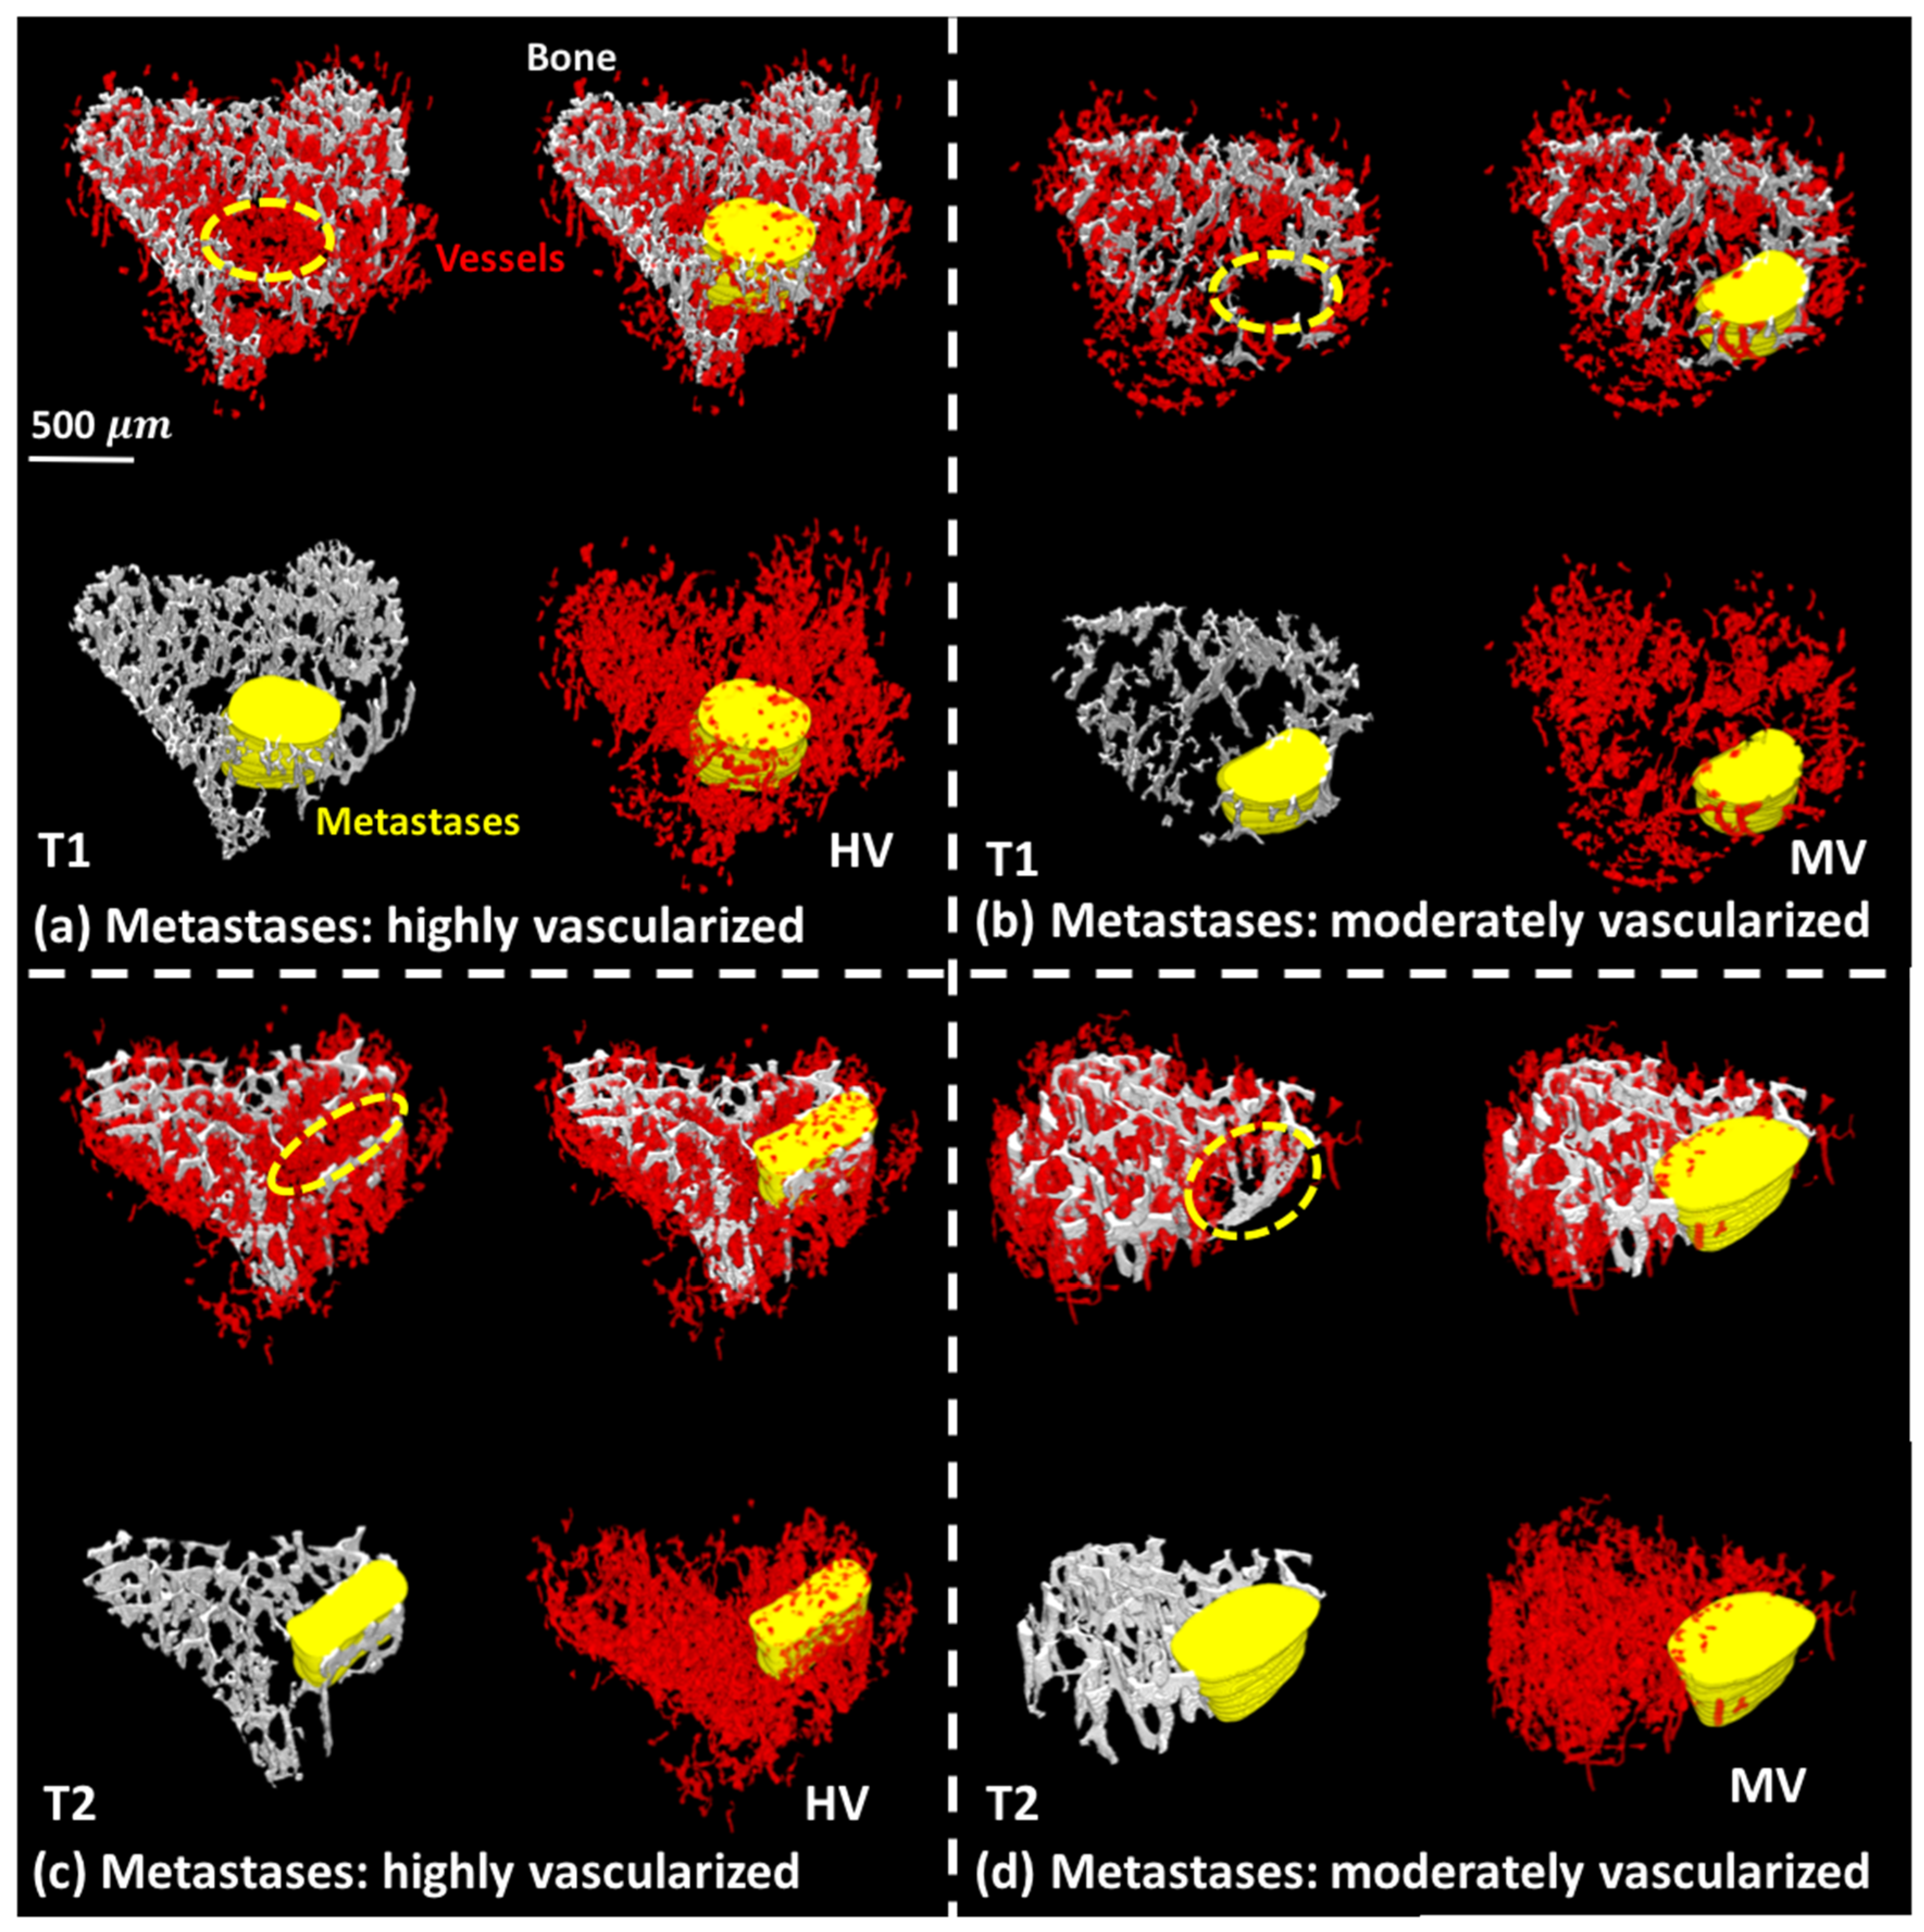
3.1. 3D Displays of the Segmented Bone and Blood Vessels
3.2. 3D-Measurements of Entire Bone and Blood Vasculature
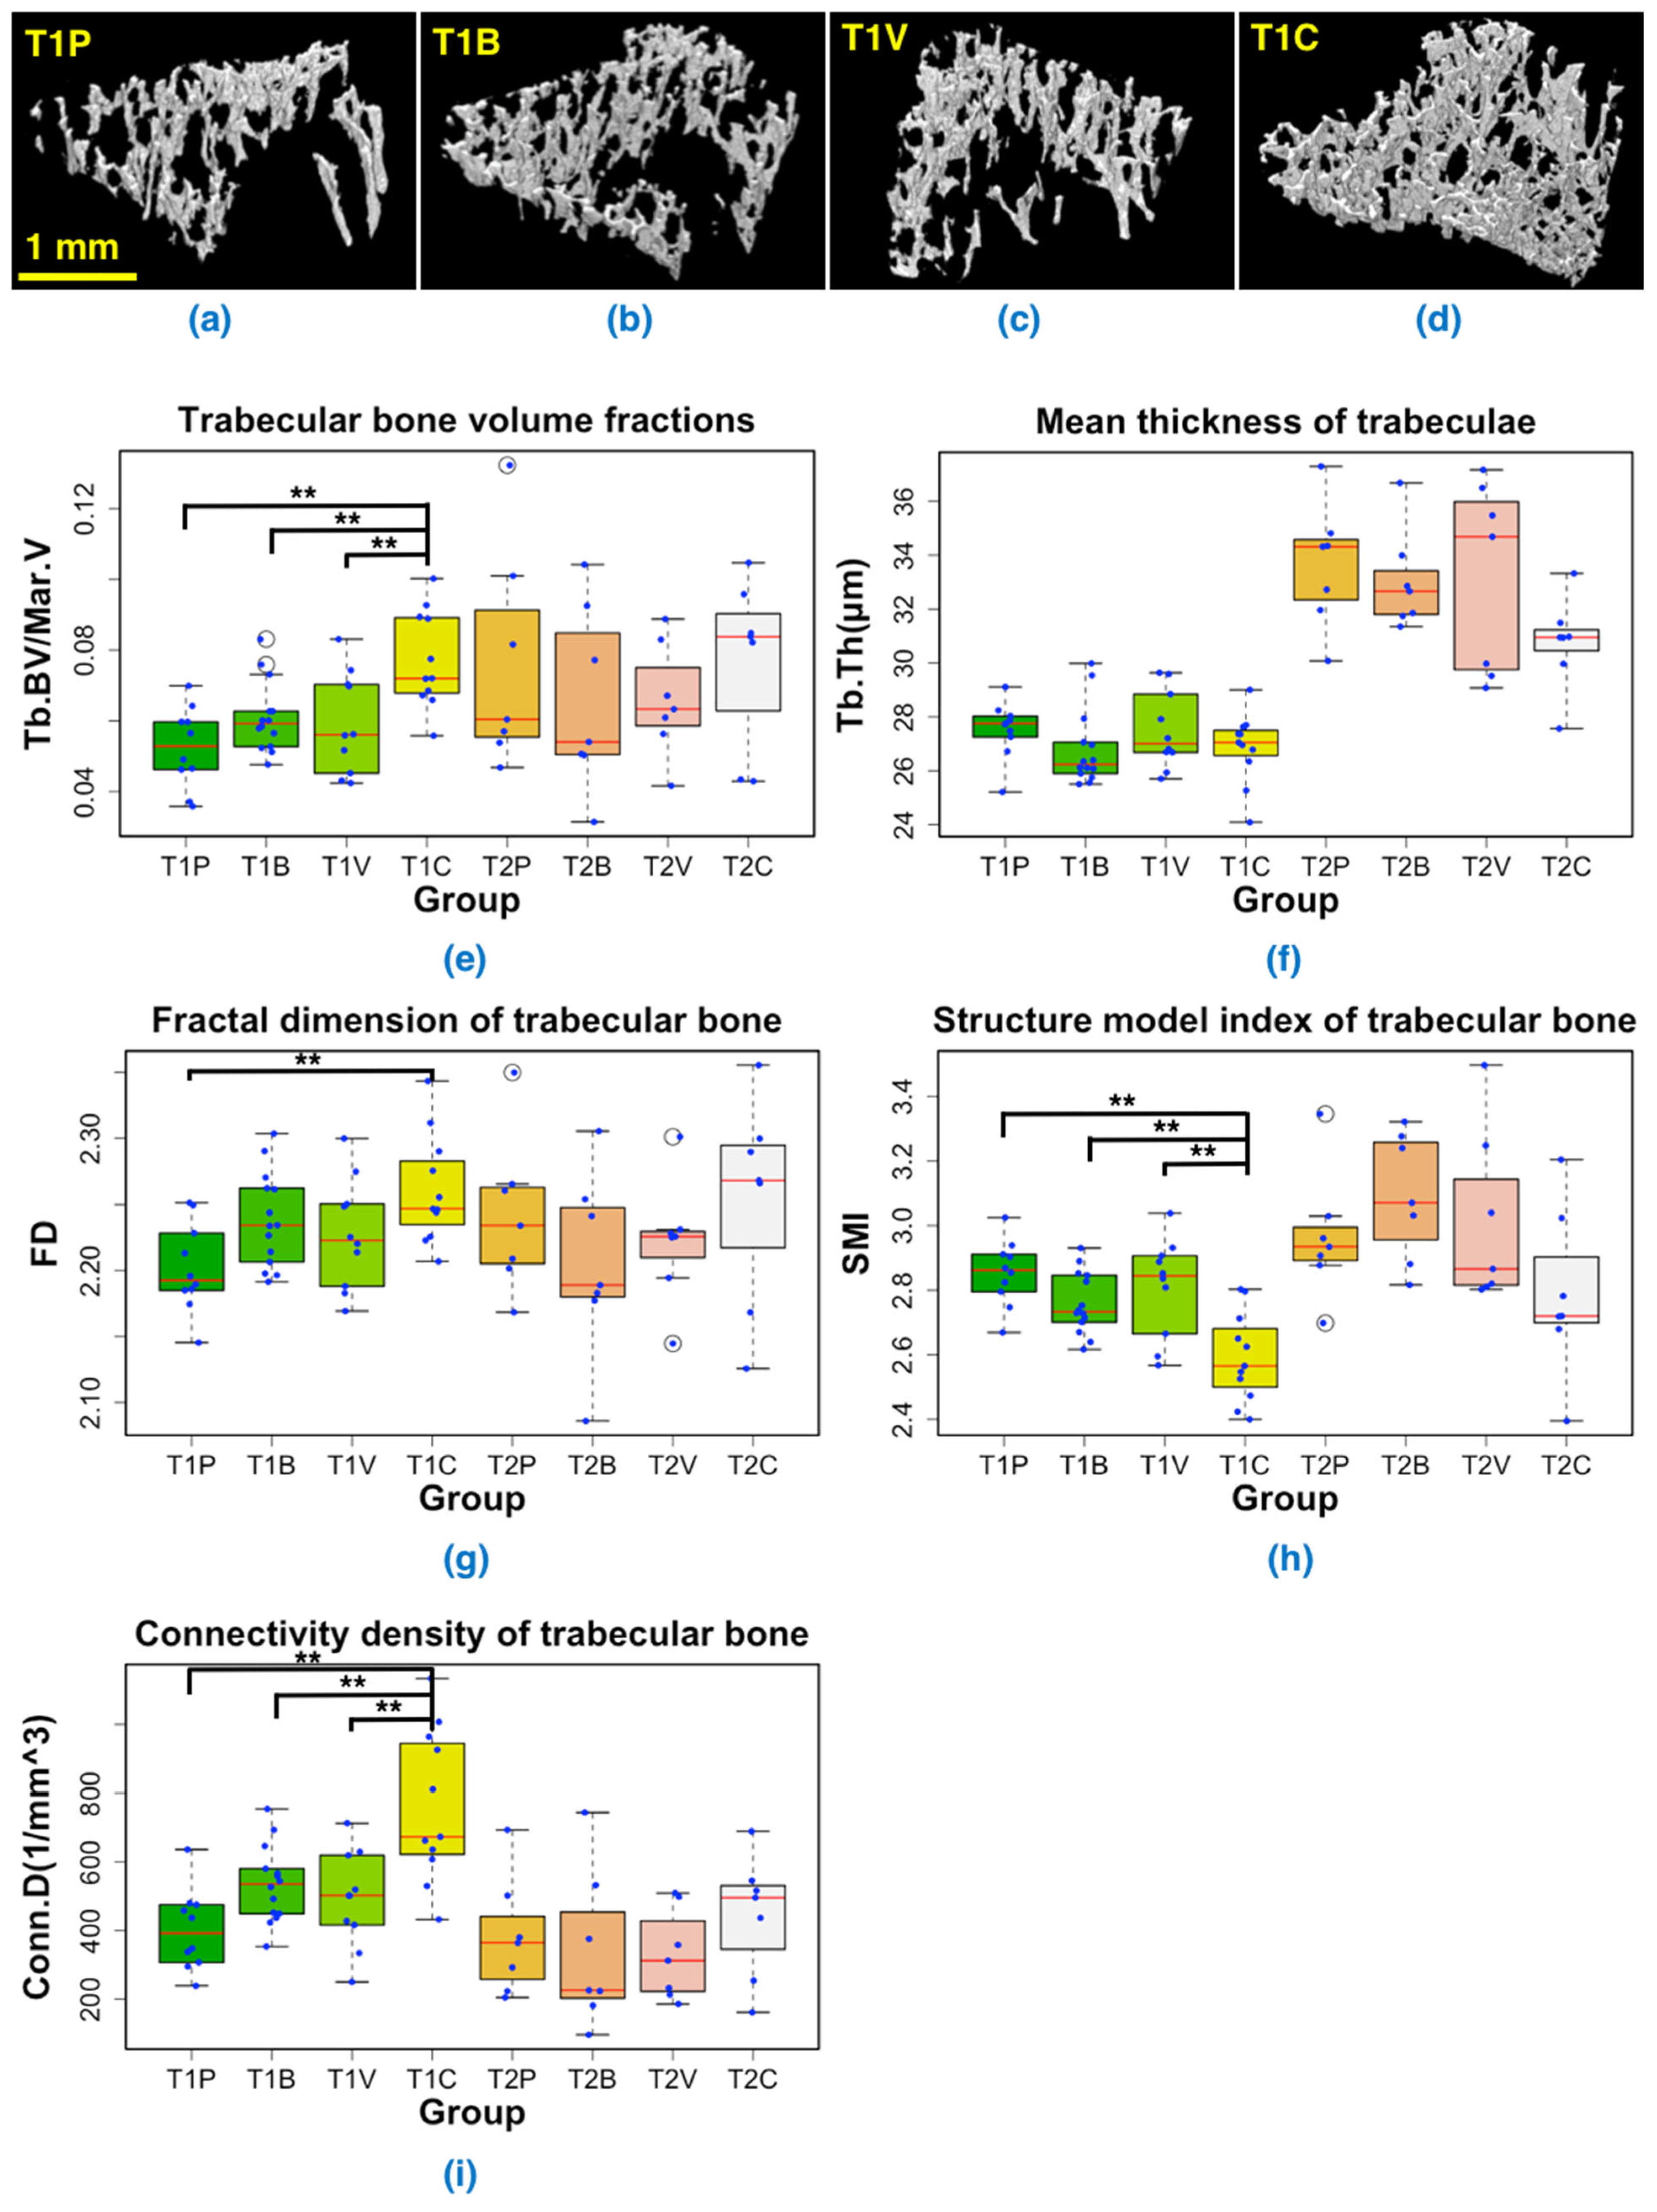
3.3. 3D-Measurements of the Trabecular Bone in Tibial Metaphysis
4. Discussion
5. Conclusions
Supplementary Materials
Author Contributions
Funding
Institutional Review Board Statement
Informed Consent Statement
Data Availability Statement
Acknowledgments
Conflicts of Interest
References
- Bray, F.; Ferlay, J.; Soerjomataram, I.; Siegel, R.L.; Torre, L.A.; Jemal, A. Global cancer statistics 2018: GLOBOCAN estimates of incidence and mortality worldwide for 36 cancers in 185 countries. CA Cancer J. Clin. 2018, 68, 394–424. [Google Scholar] [CrossRef] [PubMed] [Green Version]
- Coleman, R.E.; Croucher, P.I.; Padhani, A.R.; Clézardin, P.; Chow, E.; Fallon, M.; Guise, T.; Colangeli, S.; Capanna, R.; Costa, L. Bone metastases. Nat. Rev. Dis. Primer 2020, 6, 83. [Google Scholar] [CrossRef] [PubMed]
- Clézardin, P.; Coleman, R.; Puppo, M.; Ottewell, P.; Bonnelye, E.; Paycha, F.; Confavreux, C.B.; Holen, I. Bone metastasis: Mechanisms, therapies, and biomarkers. Physiol. Rev. 2021, 101, 797–855. [Google Scholar] [CrossRef]
- Folkman, J. Tumor angiogenesis: Therapeutic implications. N. Engl. J. Med. 1971, 285, 1182–1186. [Google Scholar] [PubMed]
- Abdollahi, A.; Folkman, J. Evading tumor evasion: Current concepts and perspectives of anti-angiogenic cancer therapy. Drug Resist. Updat. 2010, 13, 16–28. [Google Scholar] [CrossRef]
- Ebos, J.M.; Kerbel, R.S. Antiangiogenic therapy: Impact on invasion, disease progression, and metastasis. Nat. Rev. Clin. Oncol. 2011, 8, 210–221. [Google Scholar] [CrossRef] [Green Version]
- Jayson, G.C.; Hicklin, D.J.; Ellis, L.M. Antiangiogenic therapy—evolving view based on clinical trial results. Nat. Rev. Clin. Oncol. 2012, 9, 297. [Google Scholar] [CrossRef]
- Welti, J.; Loges, S.; Dimmeler, S.; Carmeliet, P. Recent molecular discoveries in angiogenesis and antiangiogenic therapies in cancer. J. Clin. Investig. 2013, 123, 3190–3200. [Google Scholar] [CrossRef] [Green Version]
- Bachelier, R.; Confavreux, C.B.; Peyruchaud, O.; Croset, M.; Goehrig, D.; van der Pluijm, G.; Clézardin, P. Combination of anti-angiogenic therapies reduces osteolysis and tumor burden in experimental breast cancer bone metastasis. Int. J. Cancer 2014, 135, 1319–1329. [Google Scholar] [CrossRef]
- David, M.; Ribeiro, J.; Descotes, F.; Serre, C.-M.; Barbier, M.; Murone, M.; Clézardin, P.; Peyruchaud, O. Targeting lysophosphatidic acid receptor type 1 with Debio 0719 inhibits spontaneous metastasis dissemination of breast cancer cells independently of cell proliferation and angiogenesis. Int. J. Oncol. 2012, 40, 1133–1141. [Google Scholar] [CrossRef] [Green Version]
- Zhao, D.; Tu, Y.; Wan, L.; Bu, L.; Huang, T.; Sun, X.; Wang, K.; Shen, B. In vivo monitoring of angiogenesis inhibition via down-regulation of mir-21 in a VEGFR2-luc murine breast cancer model using bioluminescent imaging. PLoS ONE 2013, 8, e71472. [Google Scholar] [CrossRef] [PubMed]
- Ubellacker, J.M.; Haider, M.-T.; DeCristo, M.J.; Allocca, G.; Brown, N.J.; Silver, D.P.; Holen, I.; McAllister, S.S. Zoledronic acid alters hematopoiesis and generates breast tumor-suppressive bone marrow cells. Breast Cancer Res. 2017, 19, 1–15. [Google Scholar] [CrossRef] [PubMed] [Green Version]
- Moore, D.C.; Leblanc, C.W.; Müller, R.; Crisco III, J.J.; Ehrlich, M.G. Physiologic weight-bearing increases new vessel formation during distraction osteogenesis: A micro-tomographic imaging study. J. Orthop. Res. 2003, 21, 489–496. [Google Scholar] [CrossRef]
- Zhang, X.; Xie, C.; Lin, A.S.; Ito, H.; Awad, H.; Lieberman, J.R.; Rubery, P.T.; Schwarz, E.M.; O’Keefe, R.J.; Guldberg, R.E. Periosteal progenitor cell fate in segmental cortical bone graft transplantations: Implications for functional tissue engineering. J. Bone Miner. Res. 2005, 20, 2124–2137. [Google Scholar] [CrossRef]
- Lafage-Proust, M.-H.; Roche, B.; Langer, M.; Cleret, D.; Bossche, A.V.; Olivier, T.; Vico, L. Assessment of bone vascularization and its role in bone remodeling. BoneKEy Rep. 2015, 4, 662. [Google Scholar] [CrossRef] [Green Version]
- Salomé, M.; Peyrin, F.; Cloetens, P.; Odet, C.; Laval-Jeantet, A.-M.; Baruchel, J.; Spanne, P. A synchrotron radiation microtomography system for the analysis of trabecular bone samples. Med. Phys. 1999, 26, 2194–2204. [Google Scholar] [CrossRef]
- Langer, M.; Prisby, R.; Peter, Z.; Guignandon, A.; Lafage-Proust, M.-H.; Peyrin, F. Simultaneous 3D imaging of bone and vessel microstructure in a rat model. IEEE Trans. Nucl. Sci. 2010, 58, 139–145. [Google Scholar] [CrossRef]
- Prisby, R.; Guignandon, A.; Vanden-Bossche, A.; Mac-Way, F.; Linossier, M.-T.; Thomas, M.; Laroche, N.; Malaval, L.; Langer, M.; Peter, Z.-A. Intermittent PTH (1–84) is osteoanabolic but not osteoangiogenic and relocates bone marrow blood vessels closer to bone-forming sites. J. Bone Miner. Res. 2011, 26, 2583–2596. [Google Scholar] [CrossRef]
- Roche, B.; David, V.; Vanden-Bossche, A.; Peyrin, F.; Malaval, L.; Vico, L.; Lafage-Proust, M.-H. Structure and quantification of microvascularisation within mouse long bones: What and how should we measure? Bone 2012, 50, 390–399. [Google Scholar] [CrossRef]
- Roche, B.; Vanden-Bossche, A.; Malaval, L.; Normand, M.; Jannot, M.; Chaux, R.; Vico, L.; Lafage-Proust, M.-H. Parathyroid hormone 1–84 targets bone vascular structure and perfusion in mice: Impacts of its administration regimen and of ovariectomy. J. Bone Miner. Res. 2014, 29, 1608–1618. [Google Scholar] [CrossRef]
- Goceri, E.; Shah, Z.K.; Gurcan, M.N. Vessel segmentation from abdominal magnetic resonance images: Adaptive and reconstructive approach. Int. J. Numer. Methods Biomed. Eng. 2017, 33, e2811. [Google Scholar] [CrossRef] [PubMed]
- Fohst, S. 3D Image Analysis of Capillary Vessels in Mouse Organs. Biology 2018, 10, 306. [Google Scholar]
- Xu, H.; Langer, M.; Peyrin, F. Quantitative analysis of bone microvasculature in mouse model using the monogenic signal phase asymmetry and marker-controlled watershed. Phys. Med. Biol. 2021, 66, 125005. [Google Scholar] [CrossRef] [PubMed]
- Zhang, Z.; Yao, Y.; Yuan, Q.; Lu, C.; Zhang, X.; Yuan, J.; Hou, K.; Zhang, C.; Du, Z.; Gao, X. Gold clusters prevent breast cancer bone metastasis by suppressing tumor-induced osteoclastogenesis. Theranostics 2020, 10, 4042. [Google Scholar] [CrossRef] [PubMed]
- Zuo, H.; Yang, D.; Yang, Q.; Tang, H.; Fu, Y.-X.; Wan, Y. Differential regulation of breast cancer bone metastasis by PARP1 and PARP2. Nat. Commun. 2020, 11, 1–10. [Google Scholar] [CrossRef] [Green Version]
- Chiou, A.E.; Liu, C.; Moreno-Jiménez, I.; Tang, T.; Wagermaier, W.; Dean, M.N.; Fischbach, C.; Fratzl, P. Breast cancer–secreted factors perturb murine bone growth in regions prone to metastasis. Sci. Adv. 2021, 7, eabf2283. [Google Scholar] [CrossRef]
- Yuan, X.; Qian, N.; Ling, S.; Li, Y.; Sun, W.; Li, J.; Du, R.; Zhong, G.; Liu, C.; Yu, G.; et al. Breast cancer exosomes contribute to pre-metastatic niche formation and promote bone metastasis of tumor cells. Theranostics 2021, 11, 1429–1445. [Google Scholar] [CrossRef]
- Krzeszinski, J.Y.; Wei, W.; Huynh, H.; Jin, Z.; Wang, X.; Chang, T.-C.; Xie, X.-J.; He, L.; Mangala, L.S.; Lopez-Berestein, G. miR-34a blocks osteoporosis and bone metastasis by inhibiting osteoclastogenesis and Tgif2. Nature 2014, 512, 431–435. [Google Scholar] [CrossRef]
- Yan, L.; Nielsen, F.H.; Sundaram, S.; Cao, J. Monocyte chemotactic protein-1 deficiency attenuates and high-fat diet exacerbates bone loss in mice with Lewis lung carcinoma. Oncotarget 2017, 8, 23303. [Google Scholar] [CrossRef] [Green Version]
- Arnold, E.L.; Clement, J.; Rogers, K.D.; Garcia-Castro, F.; Greenwood, C. The use of μCT and fractal dimension for fracture prediction in osteoporotic individuals. J. Mech. Behav. Biomed. Mater. 2020, 103, 103585. [Google Scholar] [CrossRef]
- Ichim, L.; Dobrescu, R. Characterization of tumor angiogenesis using fractal measures. In Proceedings of the 2013 19th International Conference on Control Systems and Computer Science, Bucharest, Romania, 29–31 May 2013; pp. 345–349. [Google Scholar]
- Reishofer, G.; Koschutnig, K.; Enzinger, C.; Ebner, F.; Ahammer, H. Fractal dimension and vessel complexity in patients with cerebral arteriovenous malformations. PLoS ONE 2012, 7, e41148. [Google Scholar] [CrossRef] [PubMed]
- Brown, H.K.; Allocca, G.; Ottewell, P.D.; Wang, N.; Brown, N.J.; Croucher, P.I.; Eaton, C.L.; Holen, I. Parathyroid Hormone (PTH) increases skeletal tumour growth and alters tumour distribution in an in vivo model of breast cancer. Int. J. Mol. Sci. 2018, 19, 2920. [Google Scholar] [CrossRef] [PubMed] [Green Version]
- Allocca, G.; Hughes, R.; Wang, N.; Brown, H.K.; Ottewell, P.D.; Brown, N.J.; Holen, I. The bone metastasis niche in breast cancer: Potential overlap with the haematopoietic stem cell niche in vivo. J. Bone Oncol. 2019, 17, 100244. [Google Scholar] [CrossRef]
- Haider, M.-T.; Saito, H.; Zarrer, J.; Uzhunnumpuram, K.; Nagarajan, S.; Kari, V.; Horn-Glander, M.; Werner, S.; Hesse, E.; Taipaleenmäki, H. Breast cancer bone metastases are attenuated in a Tgif1-deficient bone microenvironment. Breast Cancer Res. 2020, 22, 1–16. [Google Scholar] [CrossRef] [Green Version]
- Mirone, A.; Brun, E.; Gouillart, E.; Tafforeau, P.; Kieffer, J. The PyHST2 hybrid distributed code for high speed tomographic reconstruction with iterative reconstruction and a priori knowledge capabilities. Nucl. Instrum. Methods Phys. Res. Sect. B Beam Interact. Mater. At. 2014, 324, 41–48. [Google Scholar] [CrossRef] [Green Version]
- Sato, Y.; Nakajima, S.; Shiraga, N.; Atsumi, H.; Yoshida, S.; Koller, T.; Gerig, G.; Kikinis, R. Three-dimensional multi-scale line filter for segmentation and visualization of curvilinear structures in medical images. Med. Image Anal. 1998, 2, 143–168. [Google Scholar] [CrossRef]
- Hildebrand, T.; Rüegsegger, P. A new method for the model-independent assessment of thickness in three-dimensional images. J. Microsc. 1997, 185, 67–75. [Google Scholar] [CrossRef]
- Martın-Badosa, E.; Elmoutaouakkil, A.; Nuzzo, S.; Amblard, D.; Vico, L.; Peyrin, F. A method for the automatic characterization of bone architecture in 3D mice microtomographic images. Comput. Med. Imaging Graph. 2003, 27, 447–458. [Google Scholar] [CrossRef]
- Alberich-Bayarri, A.; Marti-Bonmati, L.; Pérez, M.A.; Sanz-Requena, R.; Lerma-Garrido, J.J.; García-Martí, G.; Moratal, D. Assessment of 2D and 3D fractal dimension measurements of trabecular bone from high-spatial resolution magnetic resonance images at 3 T. Med. Phys. 2010, 37, 4930–4937. [Google Scholar] [CrossRef]
- Helmberger, M.; Pienn, M.; Urschler, M.; Kullnig, P.; Stollberger, R.; Kovacs, G.; Olschewski, A.; Olschewski, H.; Balint, Z. Quantification of tortuosity and fractal dimension of the lung vessels in pulmonary hypertension patients. PLoS ONE 2014, 9, e87515. [Google Scholar] [CrossRef] [Green Version]
- Ward, W.O.; Ding, Y.; Bai, L. Analysis of three-dimensional vasculature using multifractal theory. In Proceedings of the 2014 IEEE Symposium on Computational Intelligence in Healthcare and e-health (CICARE), Orlando, FL, USA, 9–12 December 2014; pp. 64–68. [Google Scholar]
- Hildebrand, T.O.R.; Rüegsegger, P. Quantification of bone microarchitecture with the structure model index. Comput. Methods Biomech. Bio Med. Eng. 1997, 1, 15–23. [Google Scholar] [CrossRef] [PubMed]
- Ohser, J.; Redenbach, C.; Schladitz, K. Mesh free estimation of the structure model index. Image Anal. Stereol. 2009, 28, 179–185. [Google Scholar] [CrossRef]
- Odgaard, A.; Gundersen, H.J.G. Quantification of connectivity in cancellous bone, with special emphasis on 3-D reconstructions. Bone 1993, 14, 173–182. [Google Scholar] [CrossRef]
- Toriwaki, J.; Yonekura, T. Euler number and connectivity indexes of a three dimensional digital picture. Forma 2002, 17, 183–209. [Google Scholar]
- Albers, C.; Lakens, D. When power analyses based on pilot data are biased: Inaccurate effect size estimators and follow-up bias. J. Exp. Soc. Psychol. 2018, 74, 187–195. [Google Scholar] [CrossRef] [Green Version]
- Cohen, J. Statistical Power Analysis for the Behavioral Sciences; Routledge Academic: New York, NY, USA, 1988. [Google Scholar]
- Aldridge, S.E.; Lennard, T.W.J.; Williams, J.R.; Birch, M.A. Vascular endothelial growth factor acts as an osteolytic factor in breast cancer metastases to bone. Br. J. Cancer 2005, 92, 1531–1537. [Google Scholar] [CrossRef] [Green Version]
- Kuczynski, E.A.; Reynolds, A.R. Vessel co-option and resistance to anti-angiogenic therapy. Angiogenesis 2020, 23, 55–74. [Google Scholar] [CrossRef]
- Acar, M.; Kocherlakota, K.S.; Murphy, M.M.; Peyer, J.G.; Oguro, H.; Inra, C.N.; Jaiyeola, C.; Zhao, Z.; Luby-Phelps, K.; Morrison, S.J. Deep imaging of bone marrow shows non-dividing stem cells are mainly perisinusoidal. Nature 2015, 526, 126–130. [Google Scholar] [CrossRef] [Green Version]
- Zhang, J.; Wu, Q.; Johnson, C.B.; Pham, G.; Kinder, J.M.; Olsson, A.; Slaughter, A.; May, M.; Weinhaus, B.; D’Alessandro, A.; et al. In situ mapping identifies distinct vascular niches for myelopoiesis. Nature 2021, 590, 457–462. [Google Scholar] [CrossRef]
- Chen, F.; Han, Y.; Kang, Y. Bone marrow niches in the regulation of bone metastasis. Br. J. Cancer 2021, 124, 1912–1920. [Google Scholar] [CrossRef]
- Eelen, G.; Treps, L.; Li, X.; Carmeliet, P. Basic and Therapeutic Aspects of Angiogenesis Updated. Circ. Res. 2020, 127, 310–329. [Google Scholar] [CrossRef] [PubMed]


| Treatments | Placebo | Bevacizumab | Vatalanib | Combination (Bevacizumab + Vatalanib) | |
|---|---|---|---|---|---|
| Time Point (T) Number of Mice (n) | |||||
| T1 (day 8 after tumor cell injection) n | T1P 10 | T1B 14 | T1V 10 | T1C 11 | |
| T2 (day 22 after tumor cell injection) n | T2P 7 | T2B 7 | T2V 7 | T2C 7 | |
Publisher’s Note: MDPI stays neutral with regard to jurisdictional claims in published maps and institutional affiliations. |
© 2022 by the authors. Licensee MDPI, Basel, Switzerland. This article is an open access article distributed under the terms and conditions of the Creative Commons Attribution (CC BY) license (https://creativecommons.org/licenses/by/4.0/).
Share and Cite
Xu, H.; Lafage-Proust, M.-H.; Bouazza, L.; Geraci, S.; Clezardin, P.; Roche, B.; Peyrin, F.; Langer, M. Impact of Anti-Angiogenic Treatment on Bone Vascularization in a Murine Model of Breast Cancer Bone Metastasis Using Synchrotron Radiation Micro-CT. Cancers 2022, 14, 3443. https://doi.org/10.3390/cancers14143443
Xu H, Lafage-Proust M-H, Bouazza L, Geraci S, Clezardin P, Roche B, Peyrin F, Langer M. Impact of Anti-Angiogenic Treatment on Bone Vascularization in a Murine Model of Breast Cancer Bone Metastasis Using Synchrotron Radiation Micro-CT. Cancers. 2022; 14(14):3443. https://doi.org/10.3390/cancers14143443
Chicago/Turabian StyleXu, Hao, Marie-Hélène Lafage-Proust, Lamia Bouazza, Sandra Geraci, Philippe Clezardin, Bernard Roche, Françoise Peyrin, and Max Langer. 2022. "Impact of Anti-Angiogenic Treatment on Bone Vascularization in a Murine Model of Breast Cancer Bone Metastasis Using Synchrotron Radiation Micro-CT" Cancers 14, no. 14: 3443. https://doi.org/10.3390/cancers14143443
APA StyleXu, H., Lafage-Proust, M.-H., Bouazza, L., Geraci, S., Clezardin, P., Roche, B., Peyrin, F., & Langer, M. (2022). Impact of Anti-Angiogenic Treatment on Bone Vascularization in a Murine Model of Breast Cancer Bone Metastasis Using Synchrotron Radiation Micro-CT. Cancers, 14(14), 3443. https://doi.org/10.3390/cancers14143443