
An Integrated Bioinformatics Analysis towards the Identification of Diagnostic, Prognostic, and Predictive Key Biomarkers for Urinary Bladder Cancer


Abstract
Simple Summary
Abstract

1. Introduction
1.1. Bladder Cancer towards Biomarker-Directed Management
1.2. Reuse of Public Genome-Wide Gene Expression Data
2. Materials and Methods
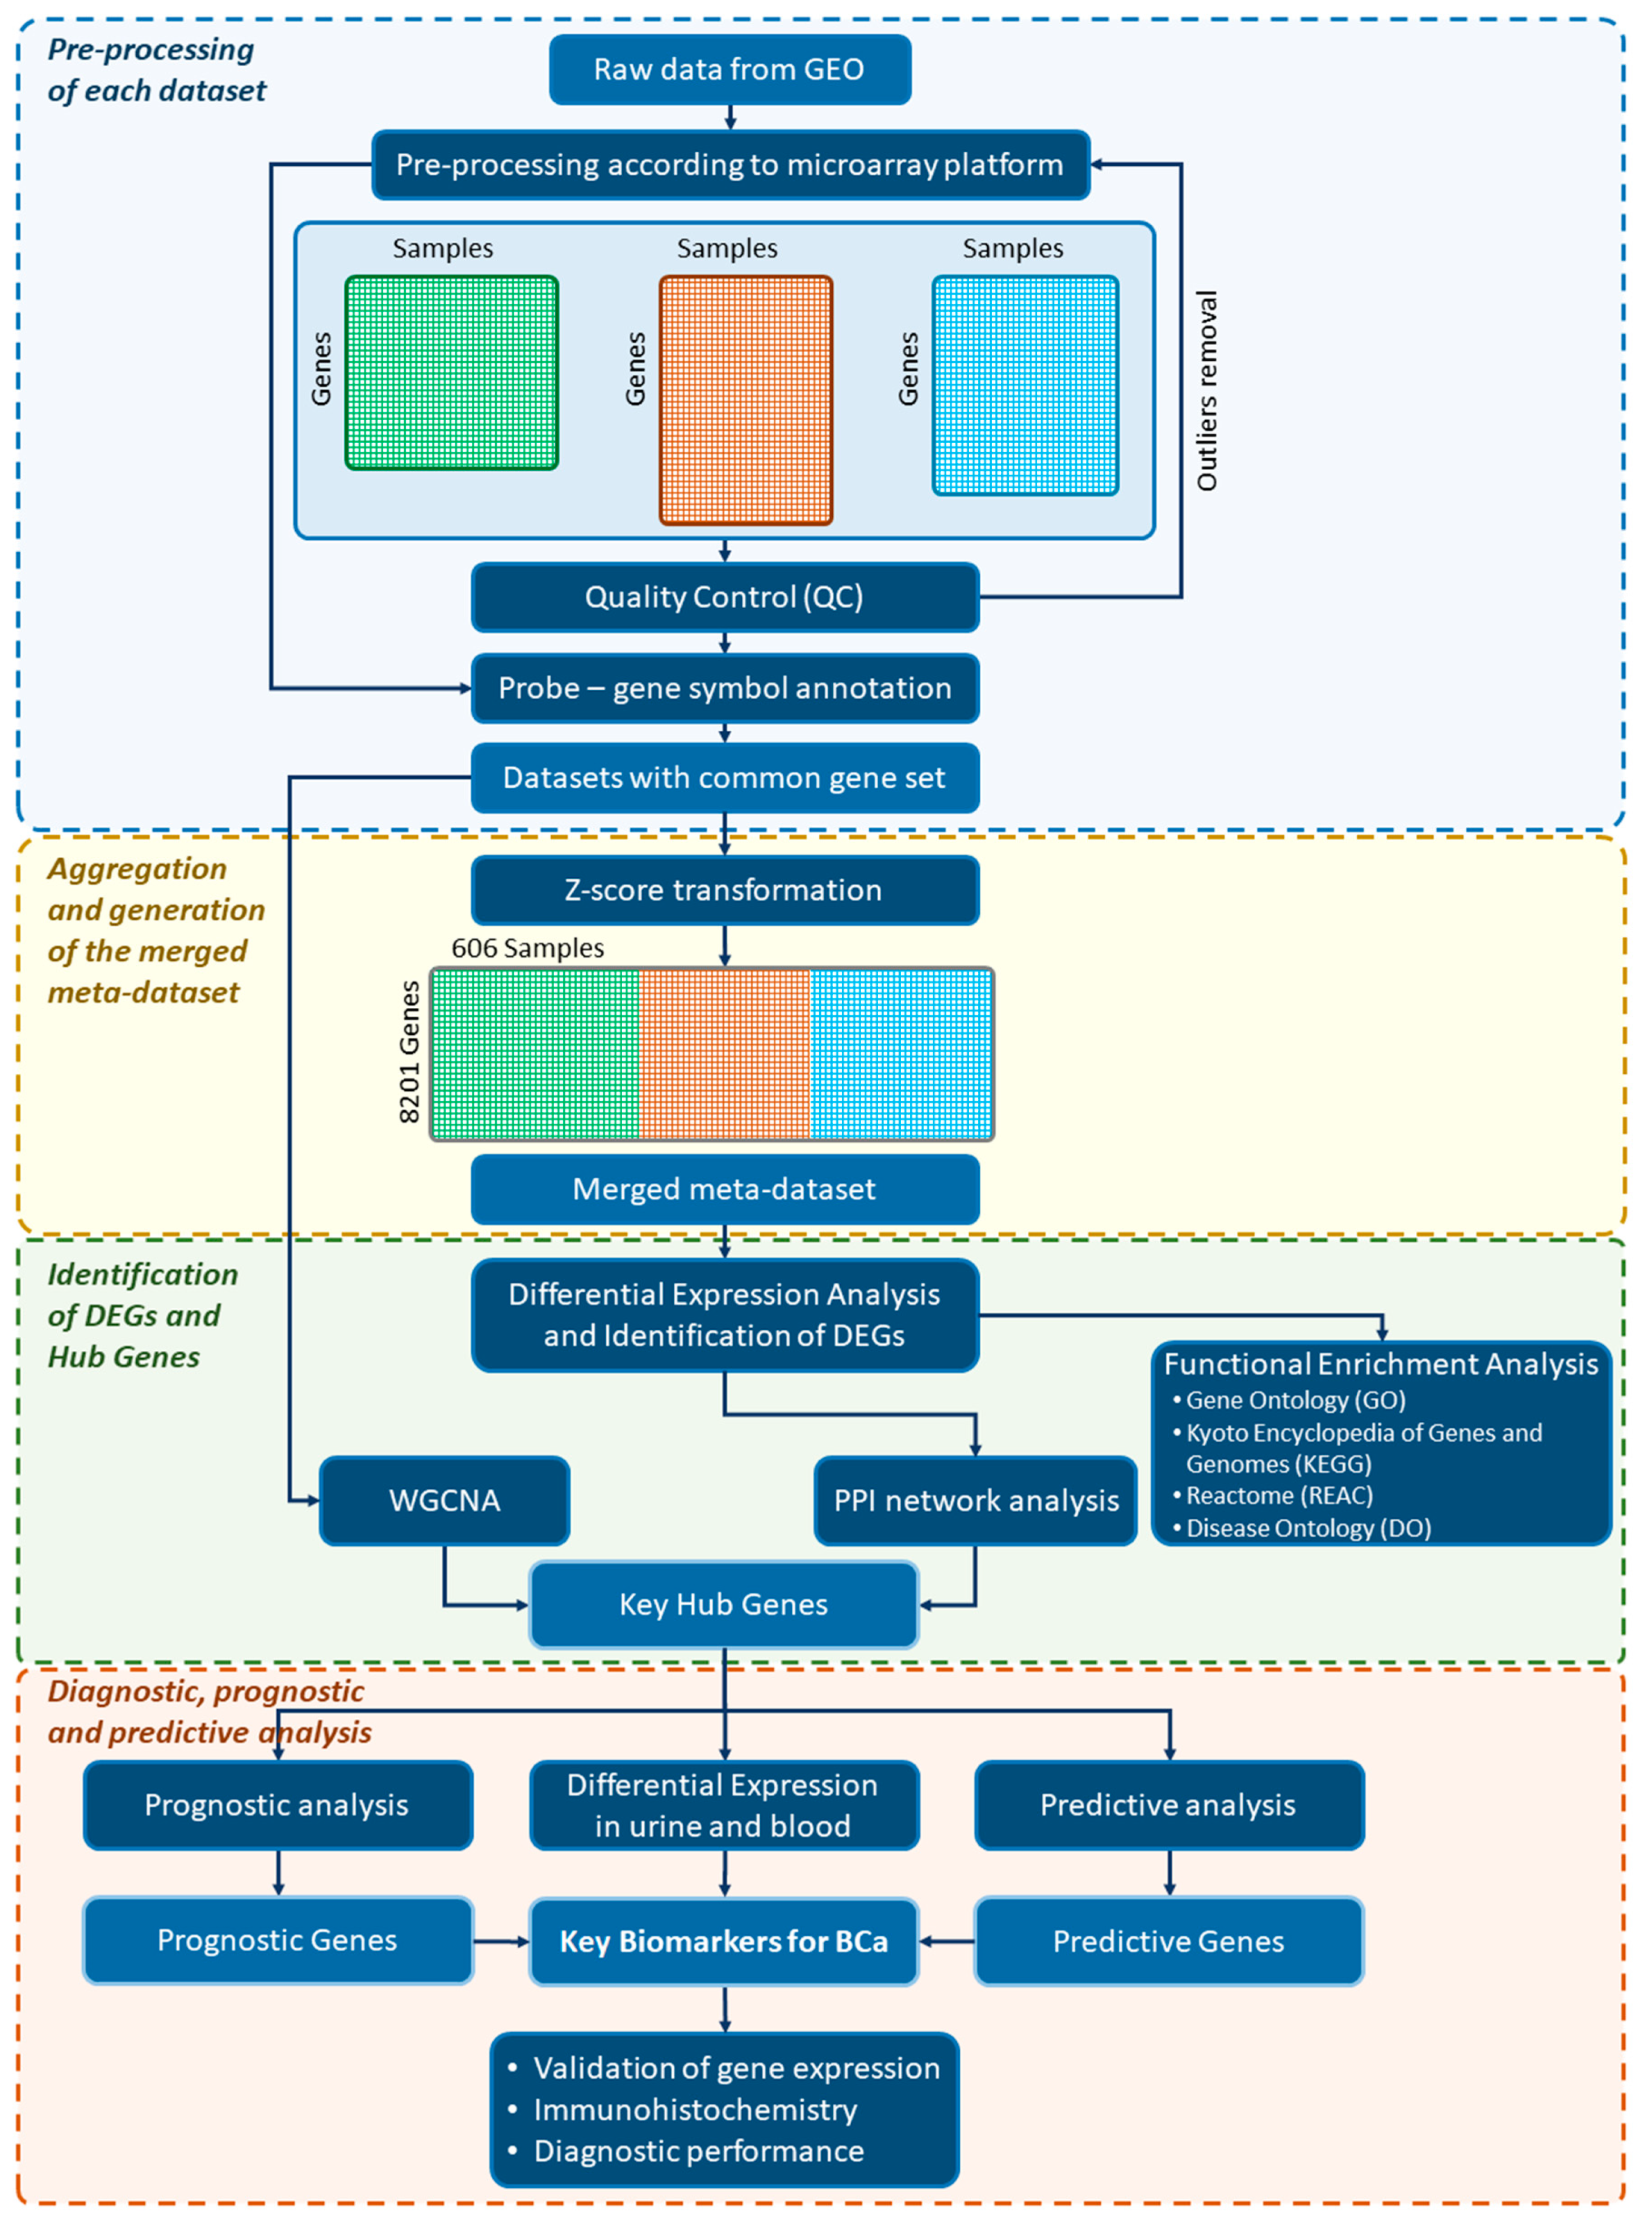
2.1. Overall Study Design and Workflow
2.2. Data Source, Systematic Search, and Selection of Eligible Microarray Datasets
2.3. Platform-Specific Pre-Processing
2.4. Quality Control
2.5. Gene Annotation
2.6. Batch Effects and Cross-Platform Normalization
2.7. Differential Expression Analysis
2.8. DEG Functional Enrichment Analysis
2.9. Protein–Protein Interaction Network Analysis
2.10. Weighted Correlation Network Analysis
2.11. Differential Expression in Urine and Blood Plasma Samples
2.12. Finding Prognostic Genes for BCa
2.13. Finding Predictive Genes for BCa
2.14. Expression Validation of Key Biomarkers and Immunohistochemistry
2.15. Diagnostic Performance Analysis
3. Results
3.1. Systematic Search and Selection of Eligible Microarray Datasets
3.2. Quality Control
3.3. Gene Annotation
3.4. Batch Effects and Cross-Platform Normalization
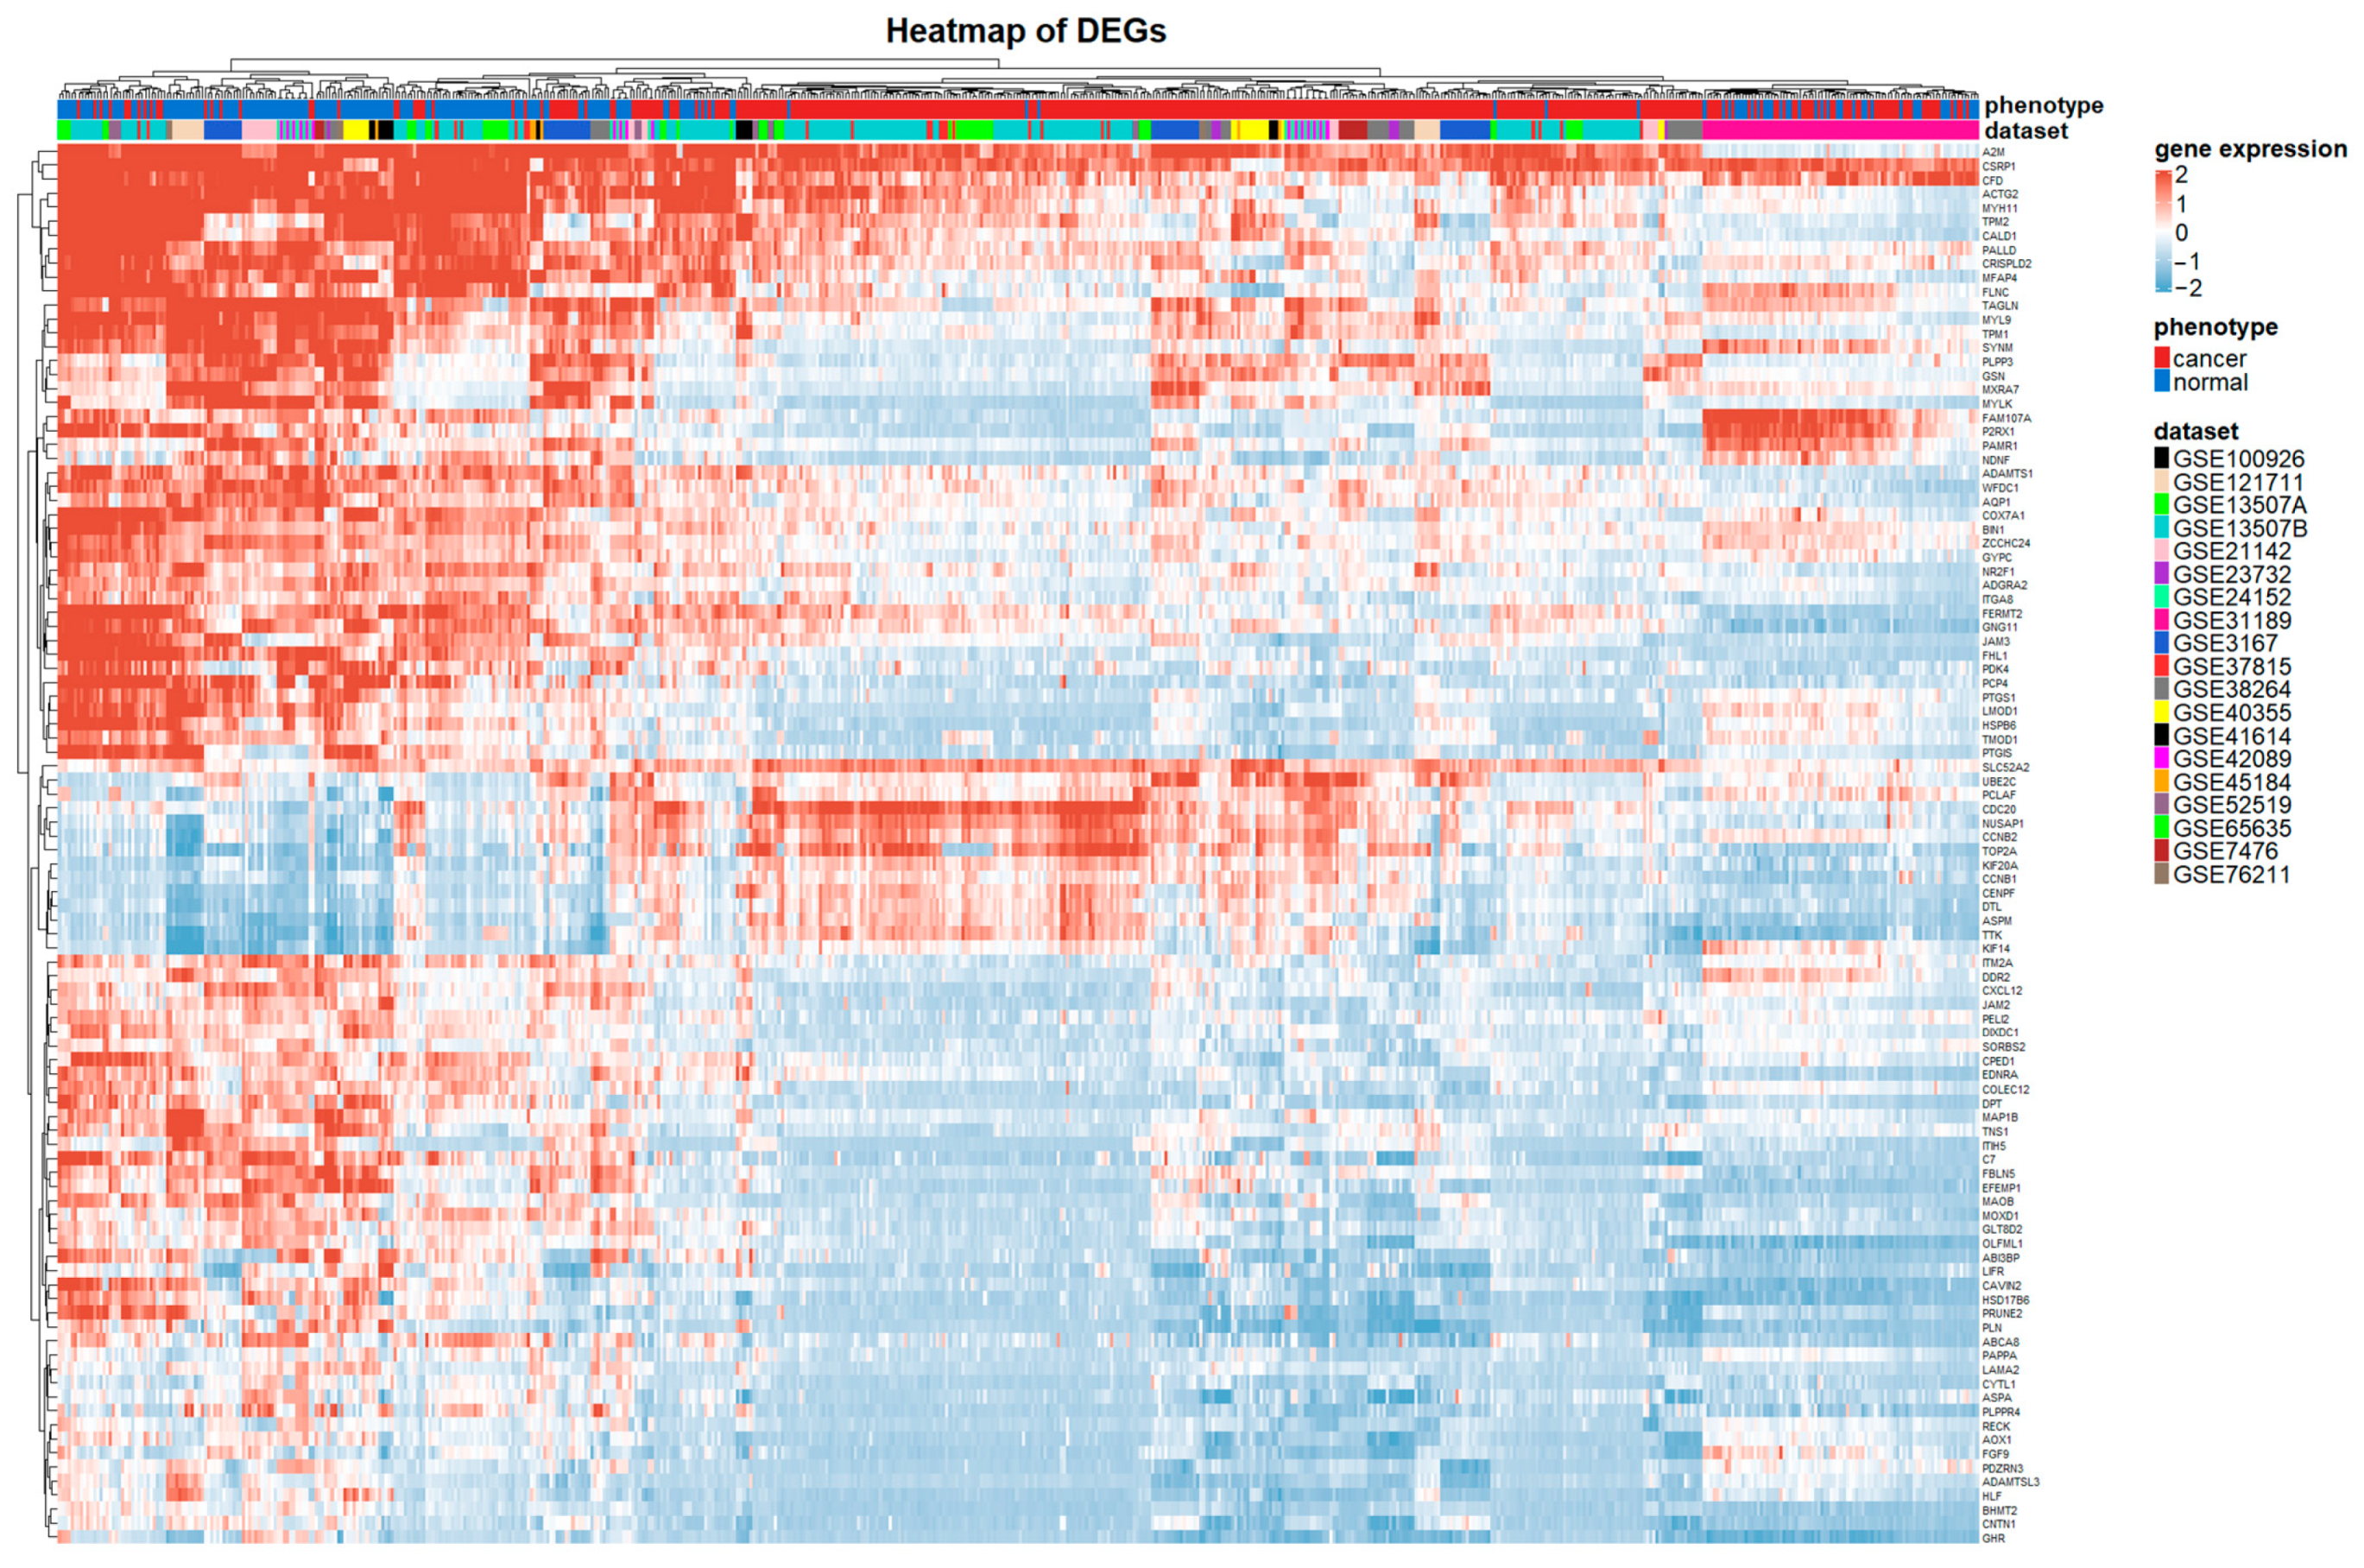
3.5. Differential Expression Analysis
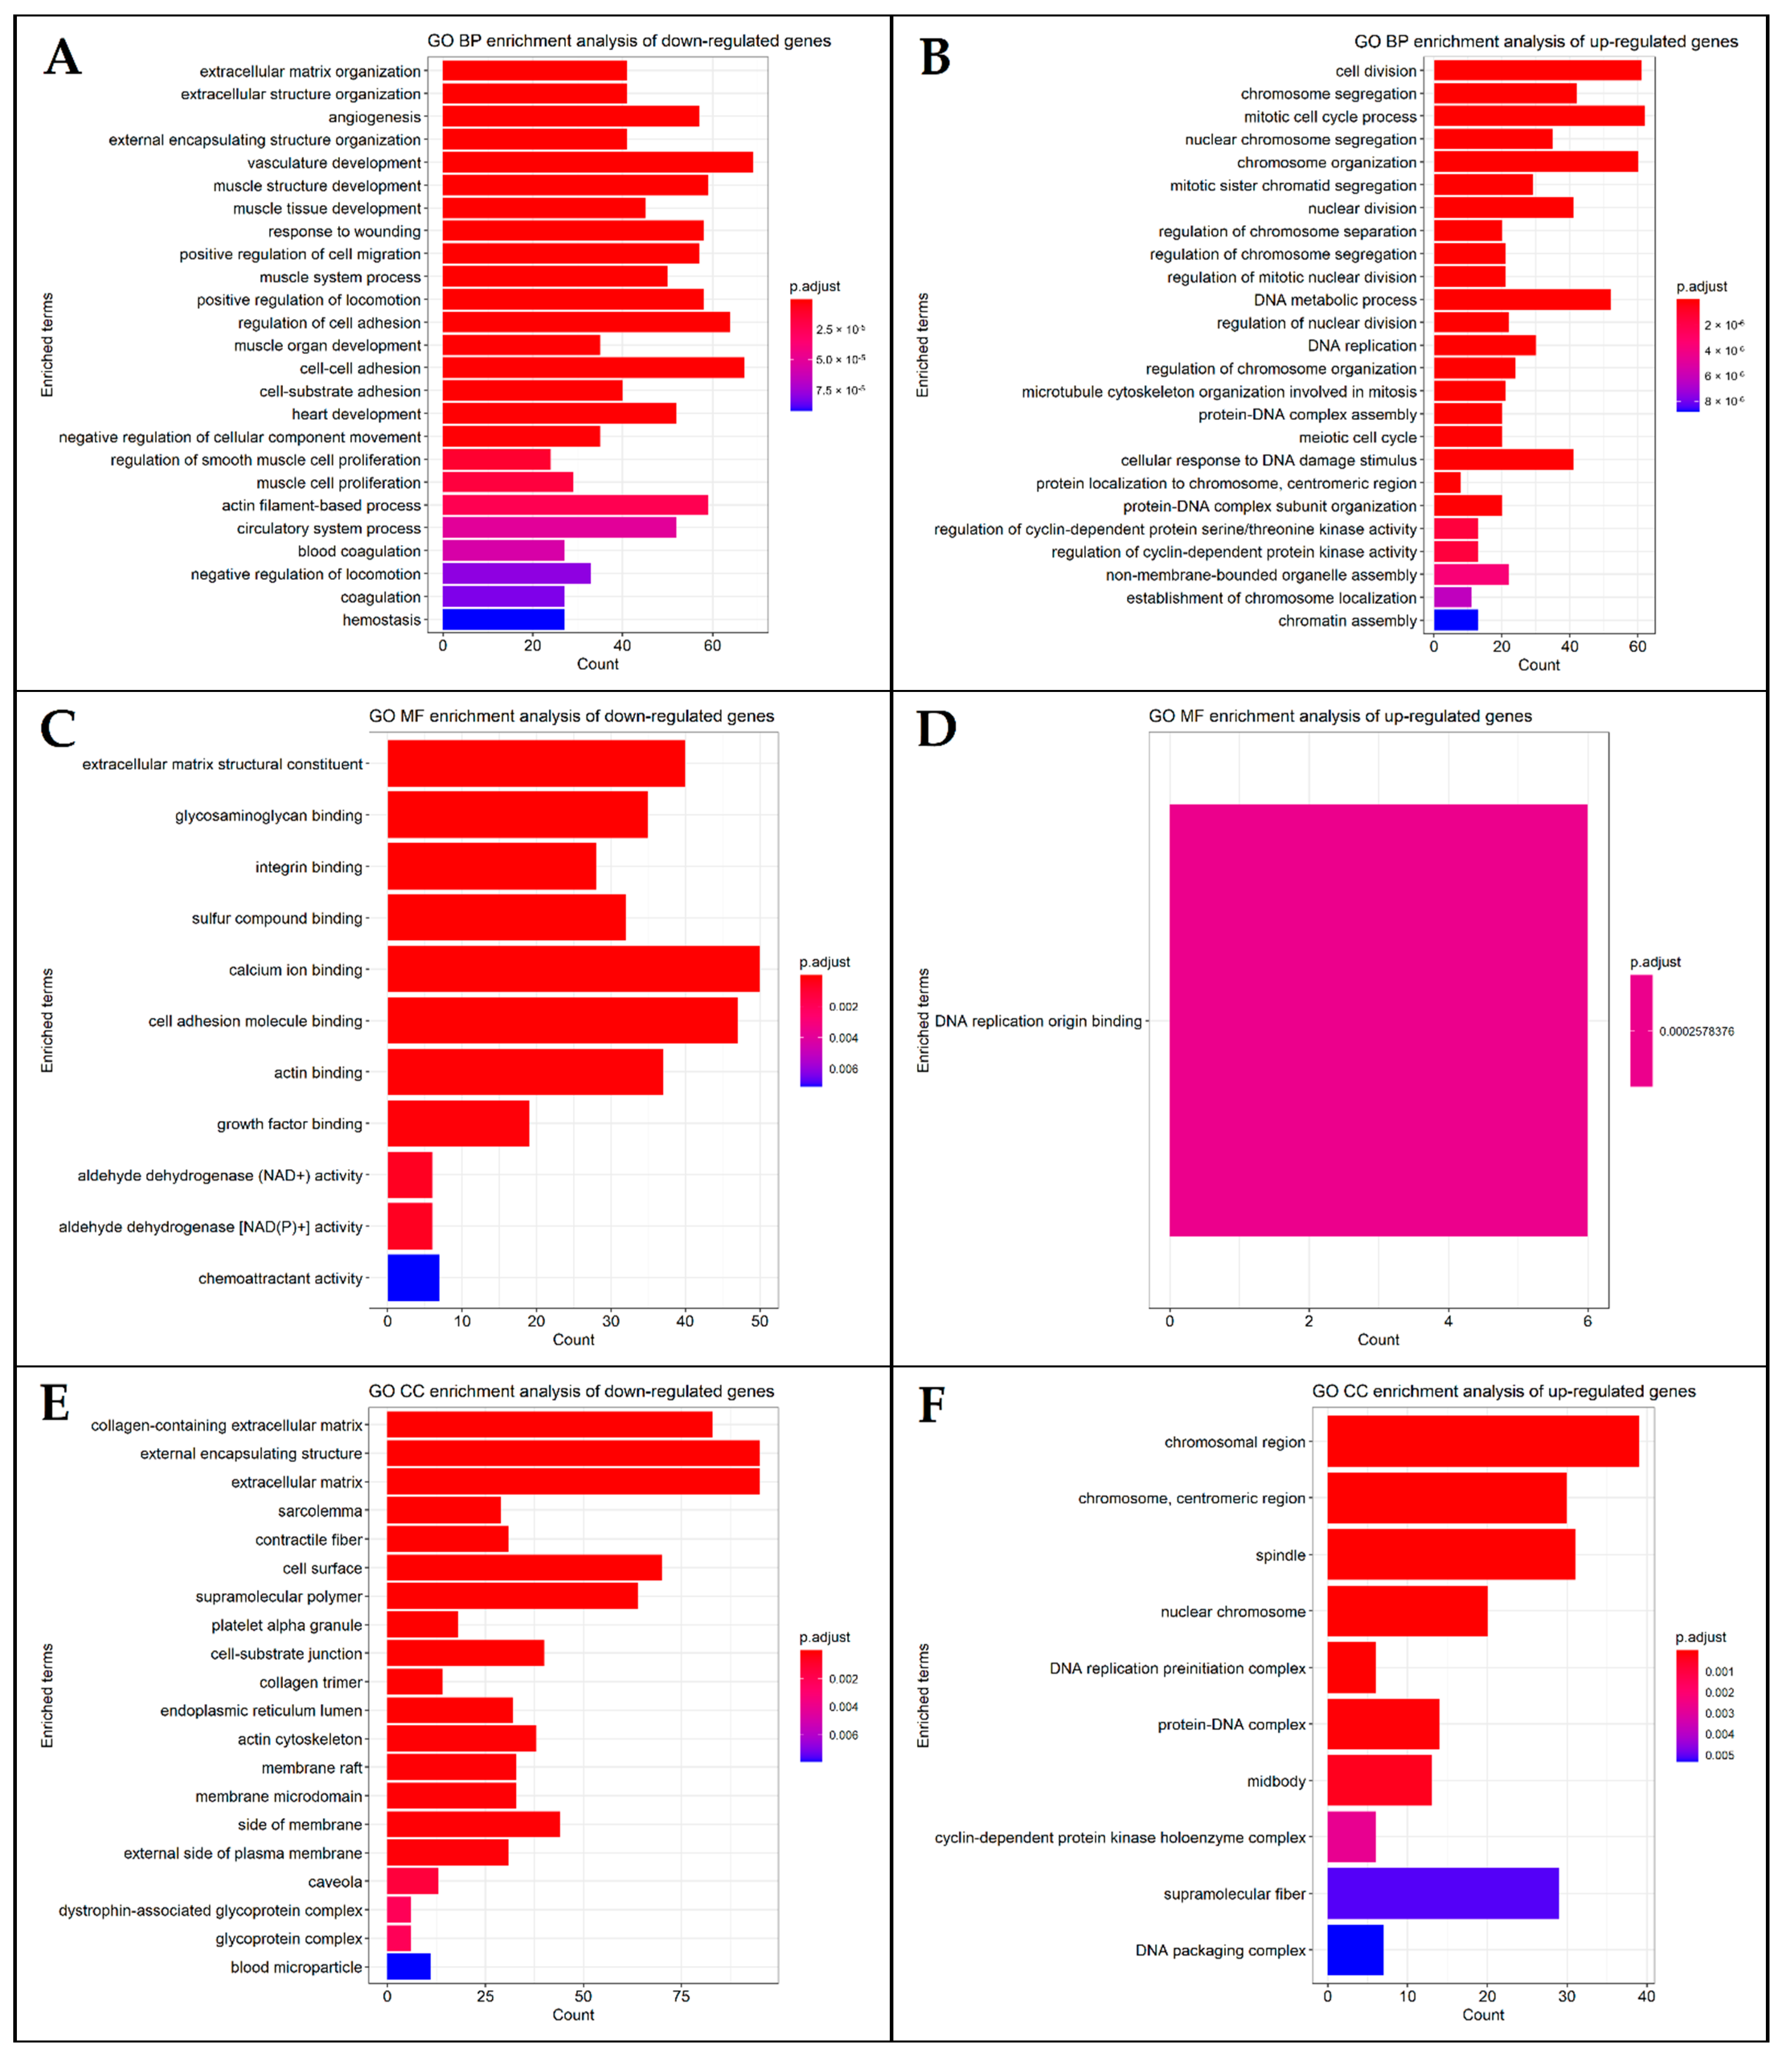
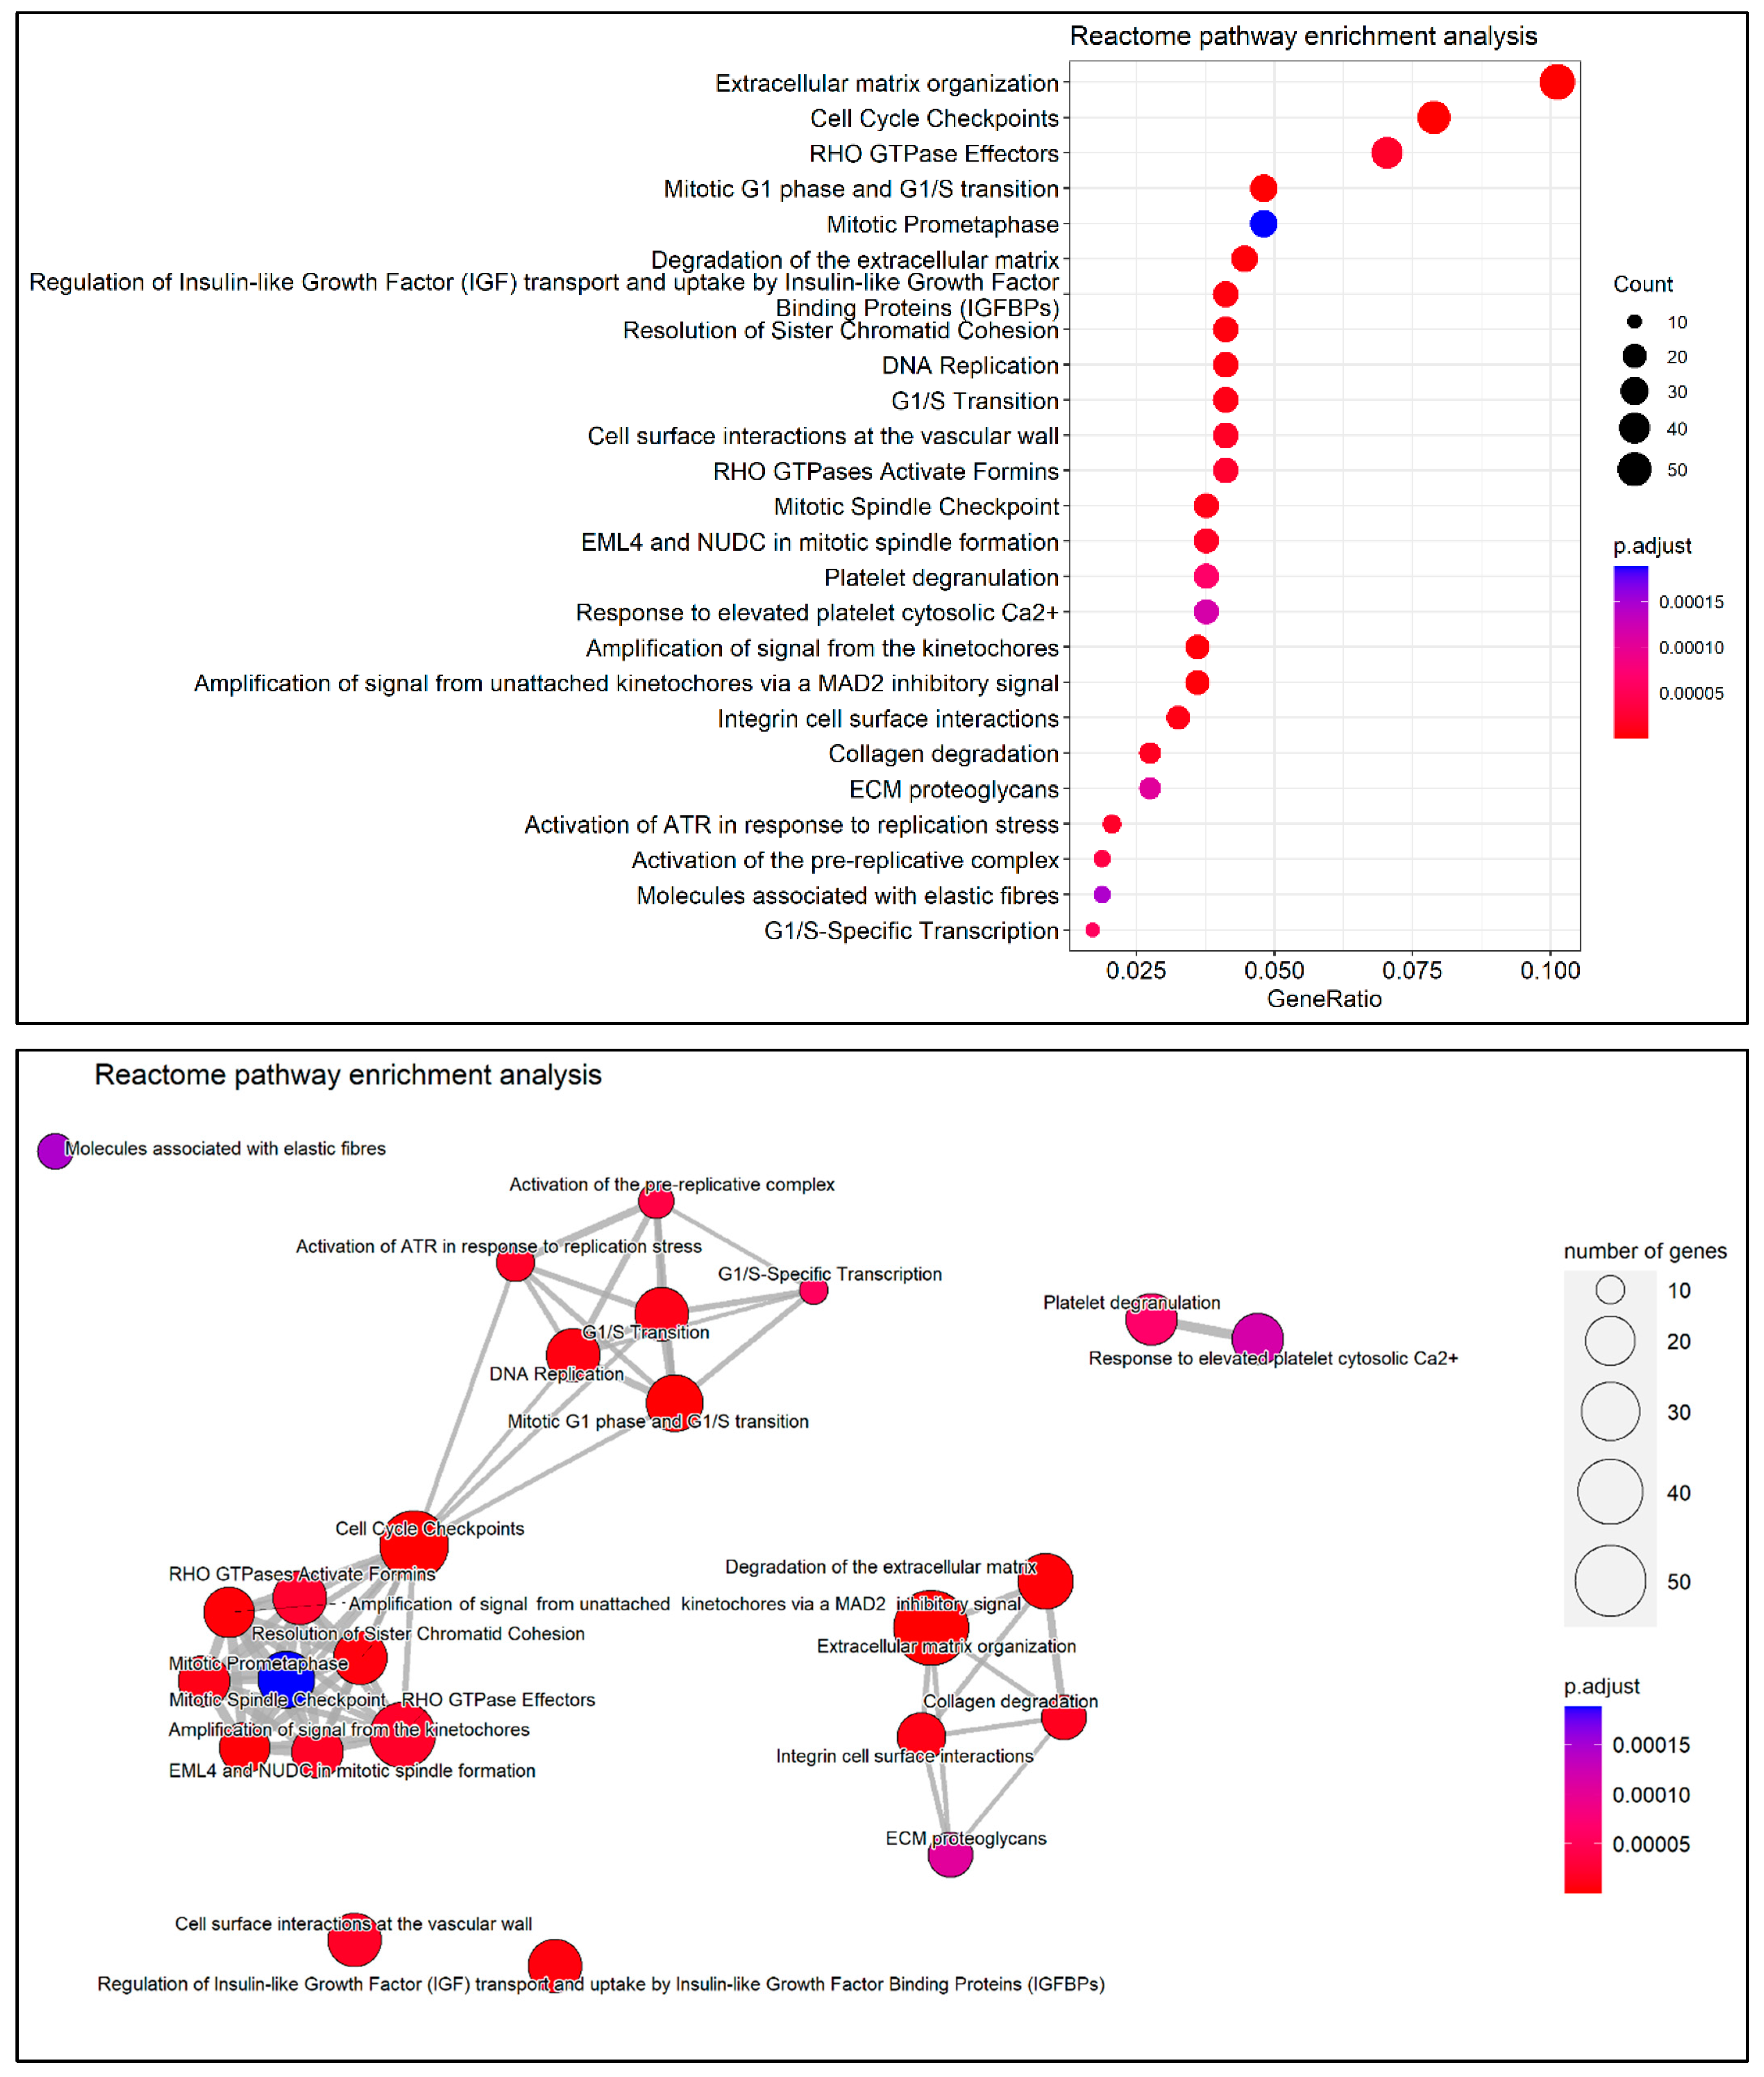
3.6. Functional and Pathway Enrichment Analysis
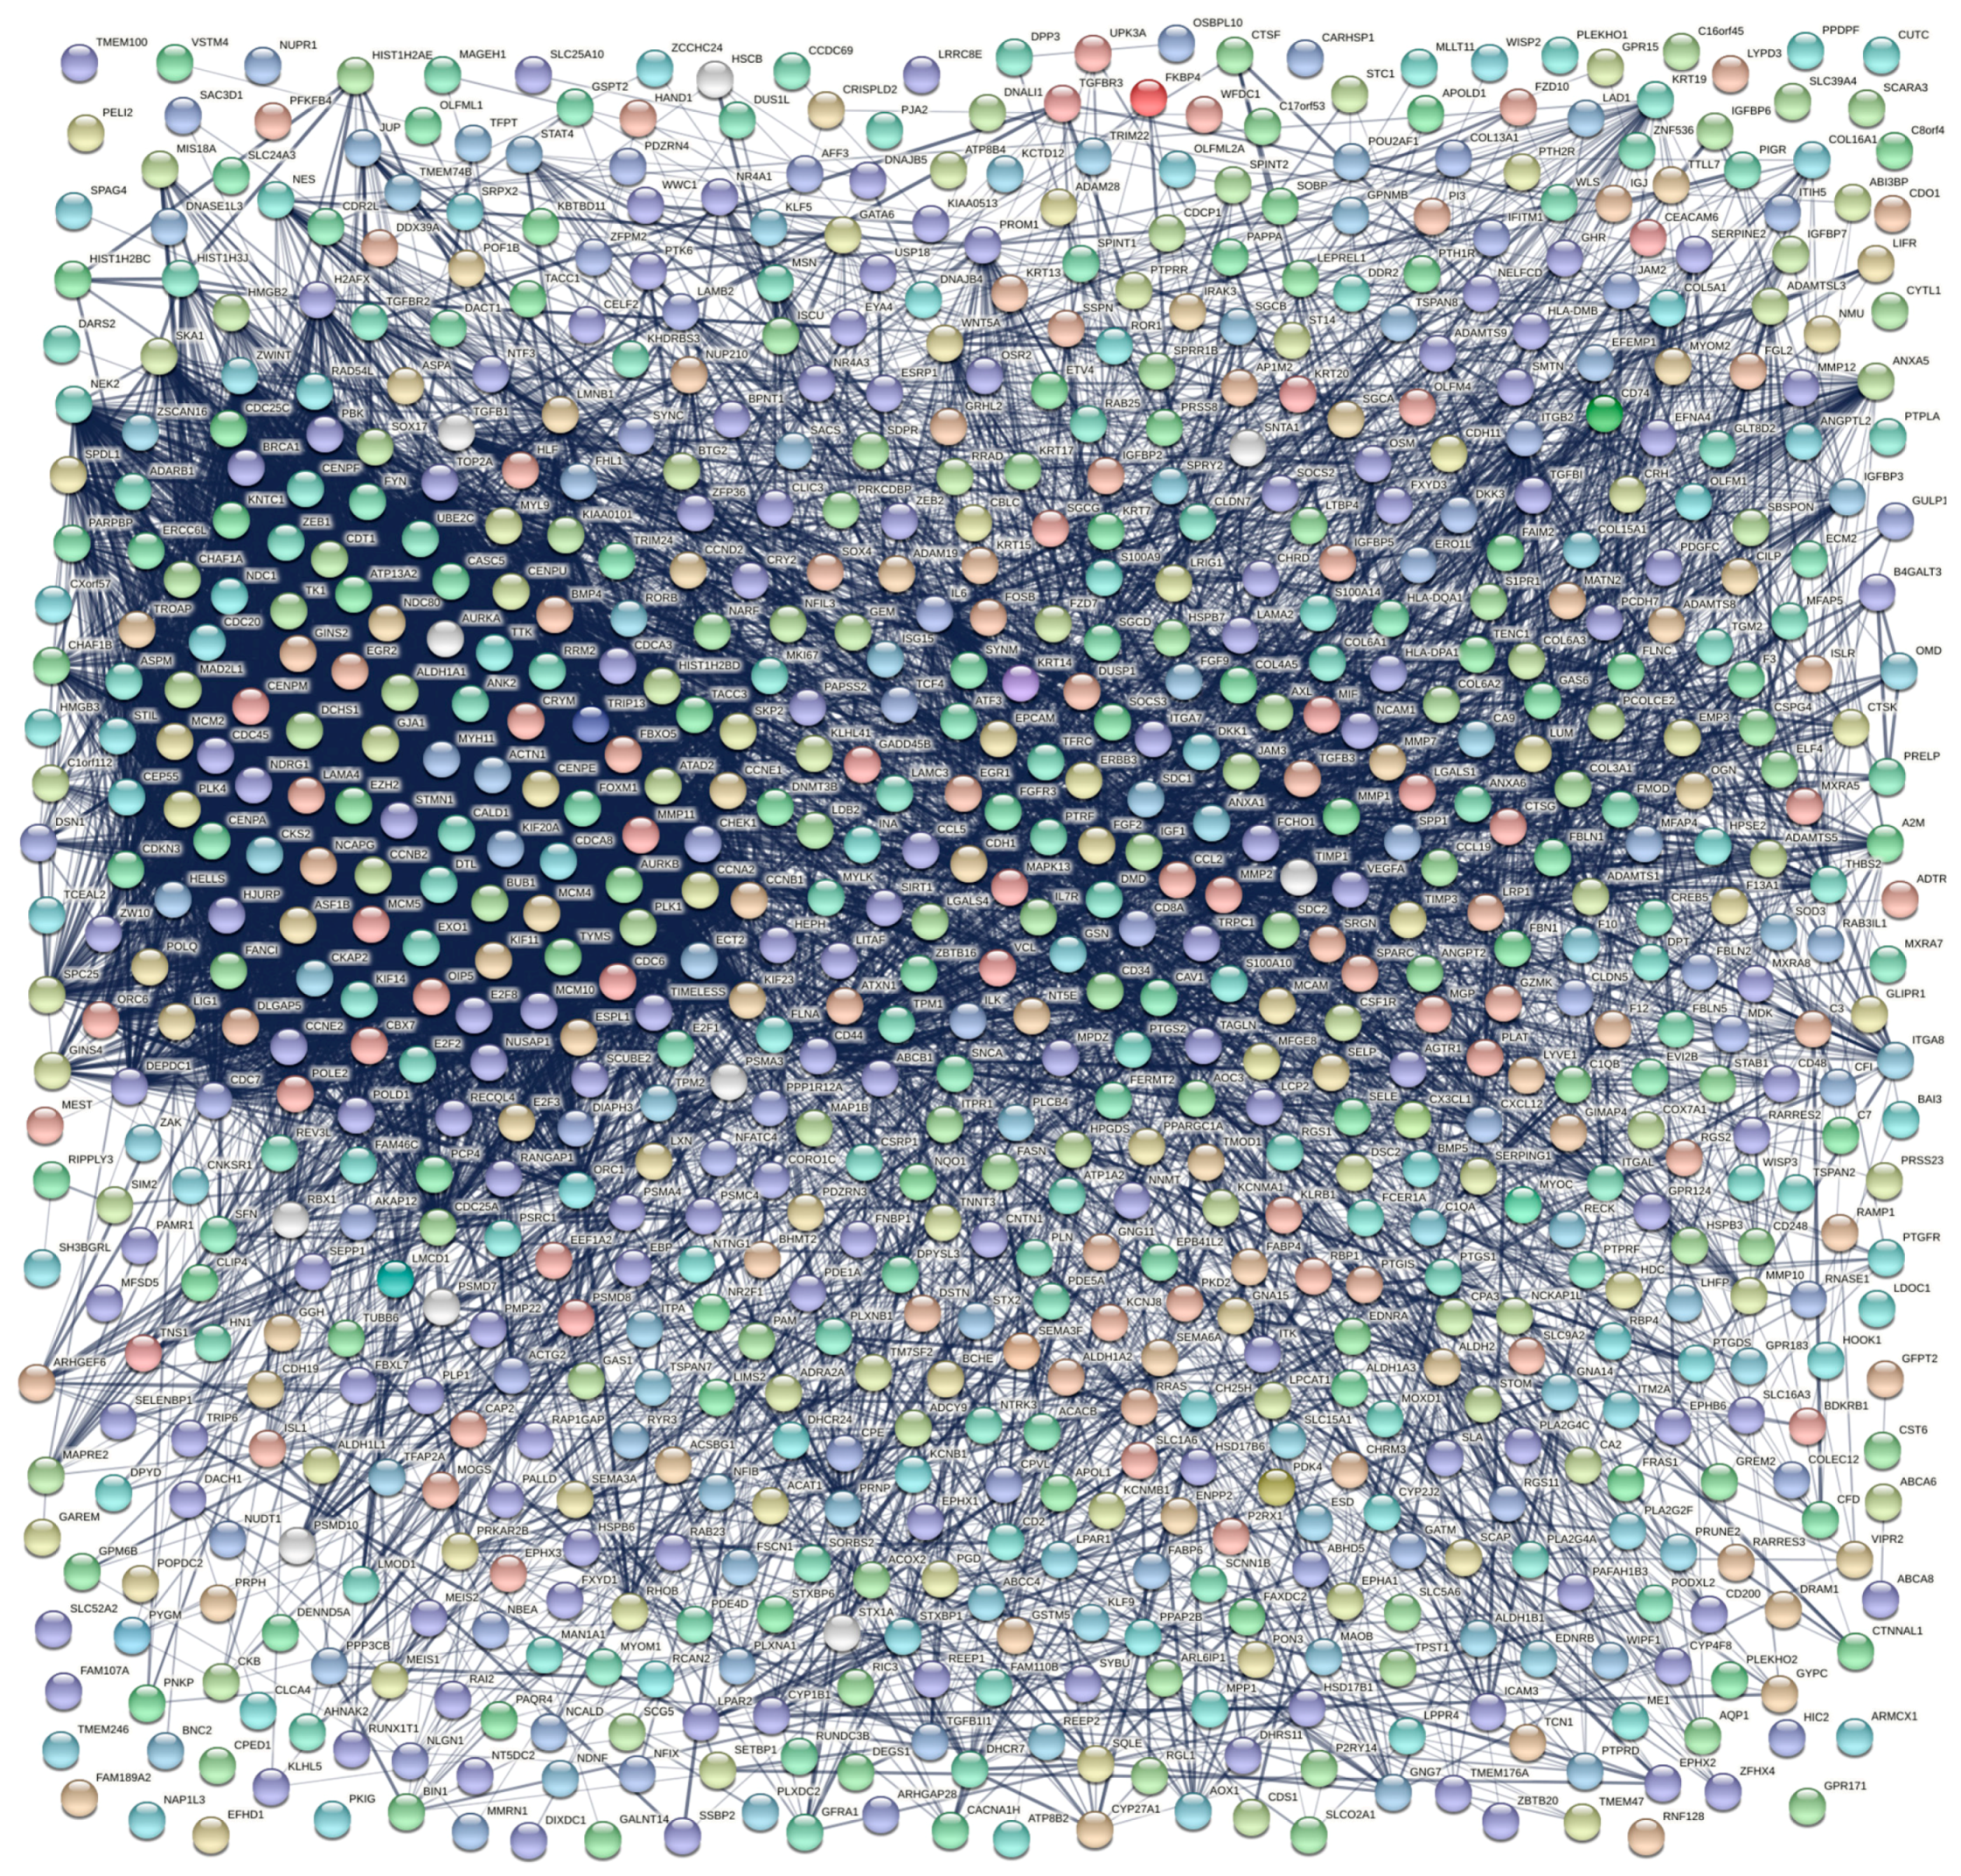
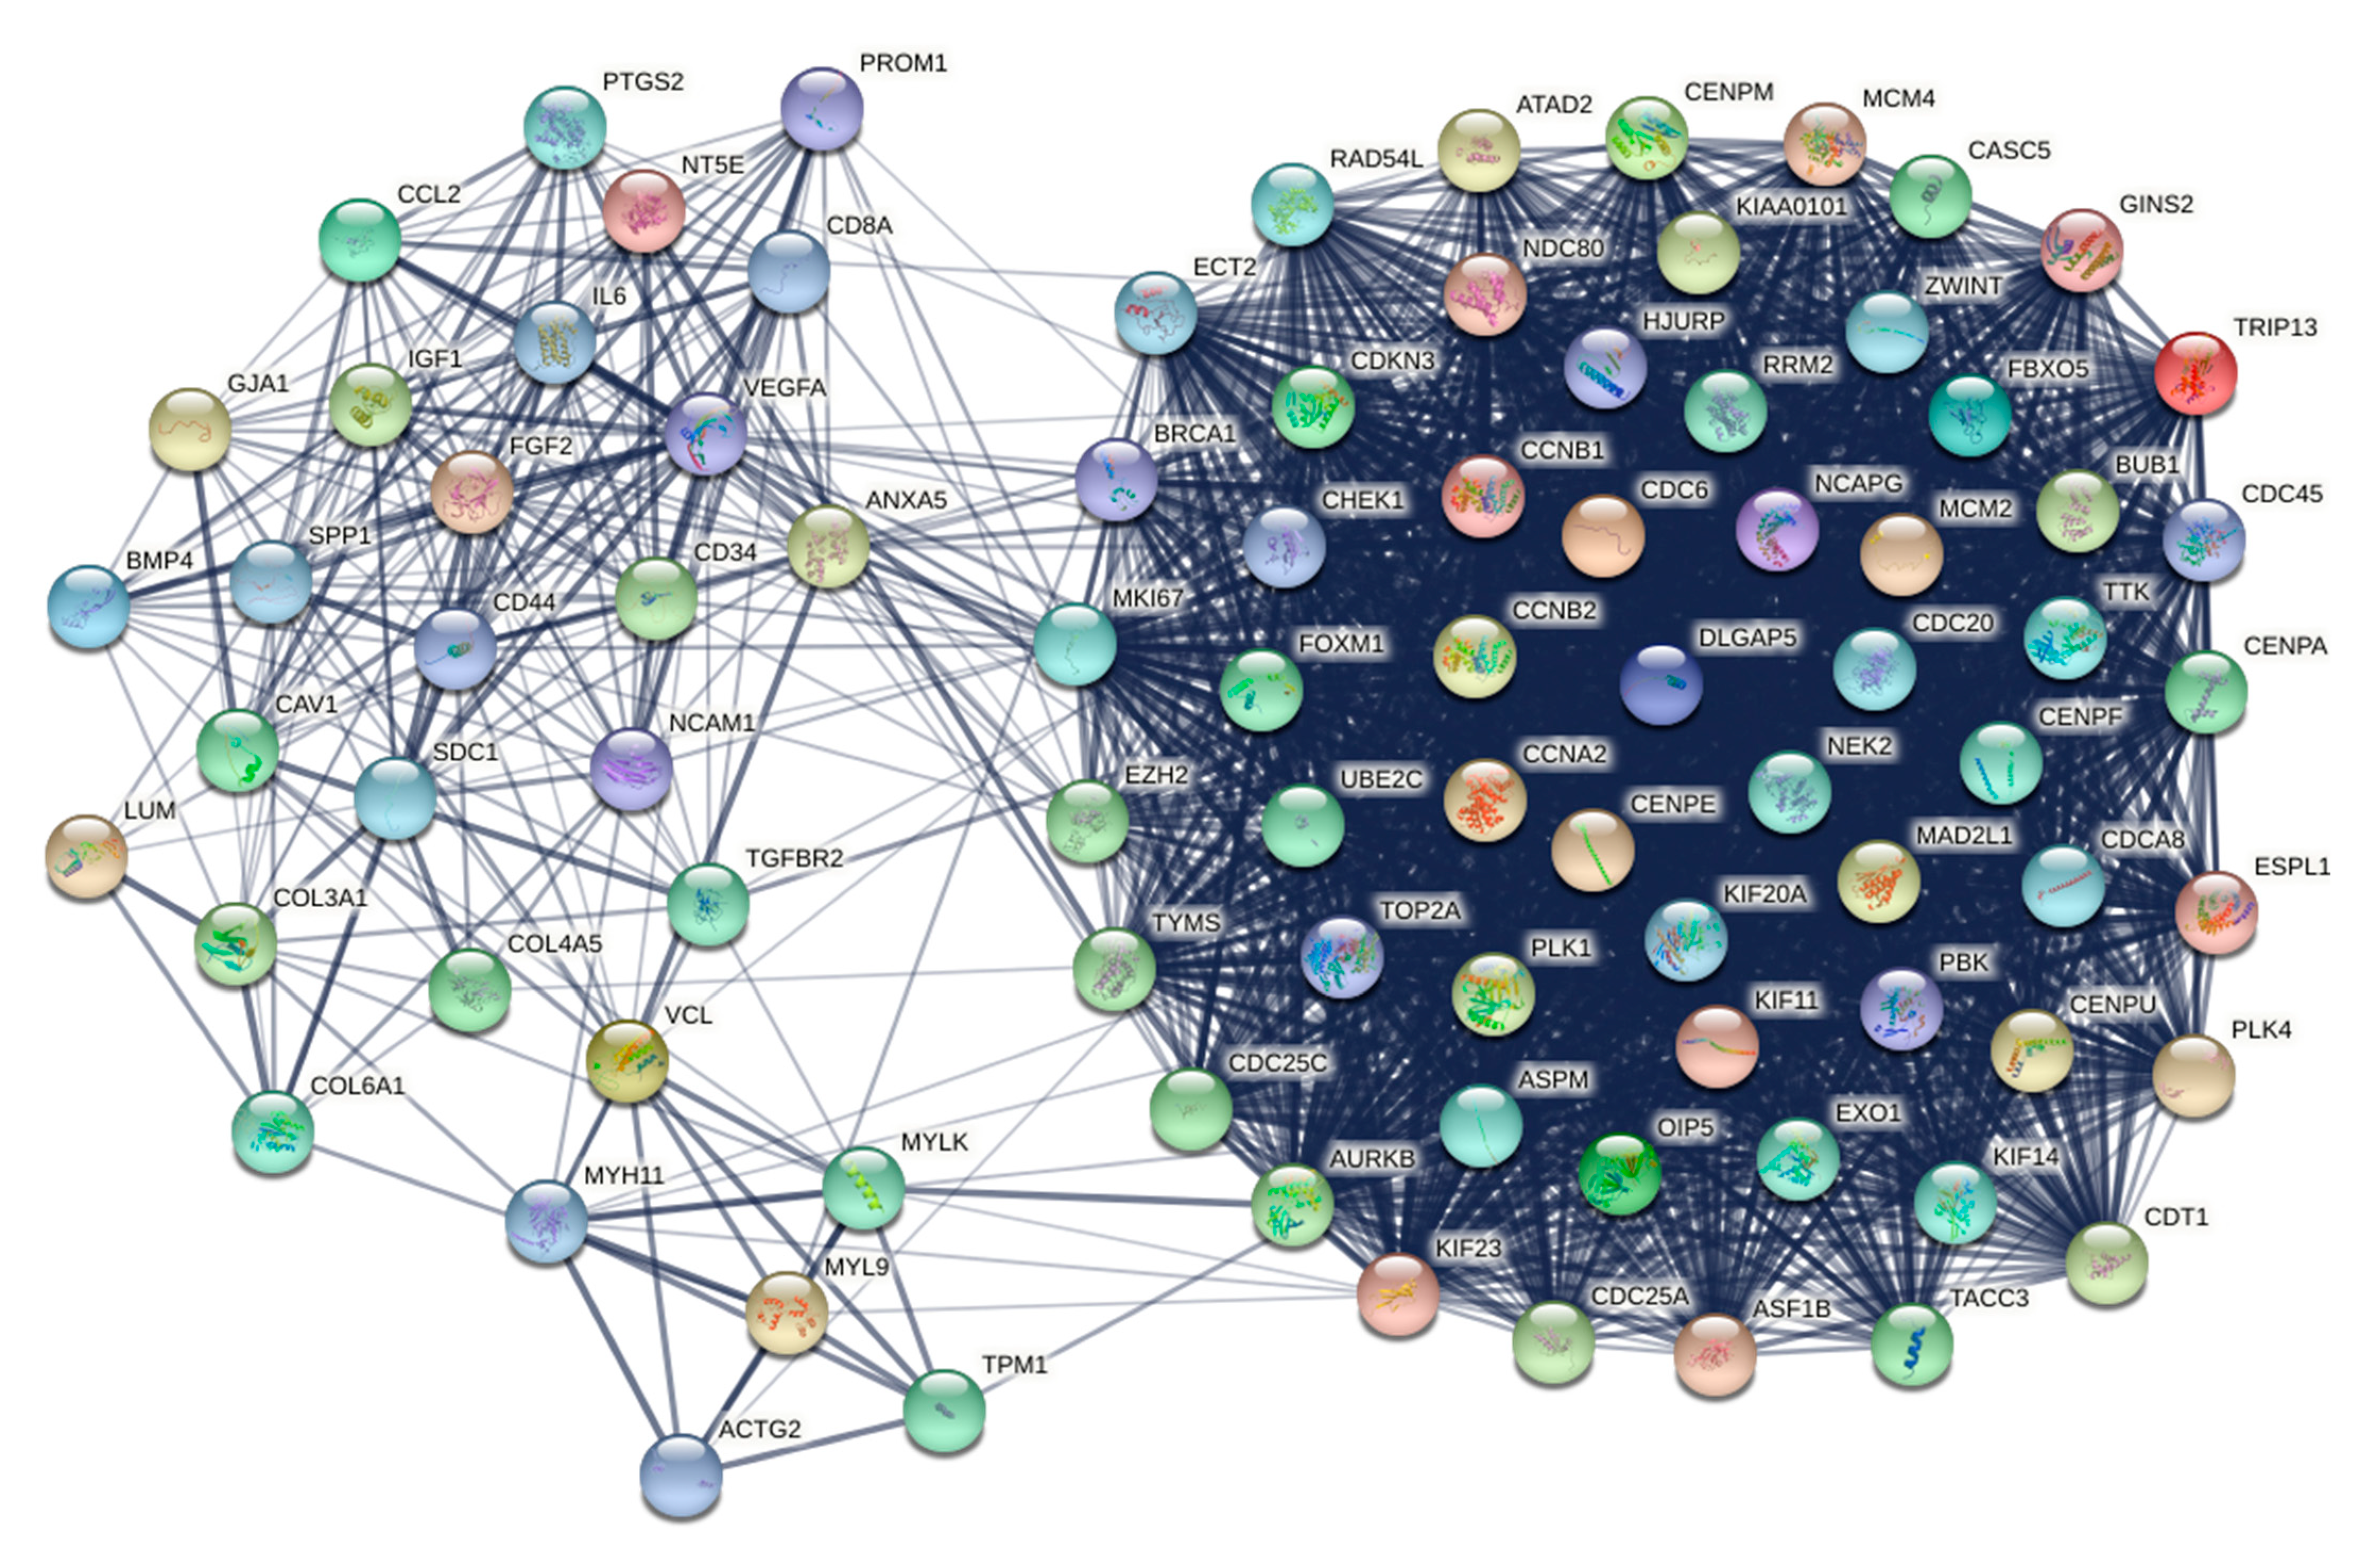
3.7. Protein–Protein Interaction Network Analysis
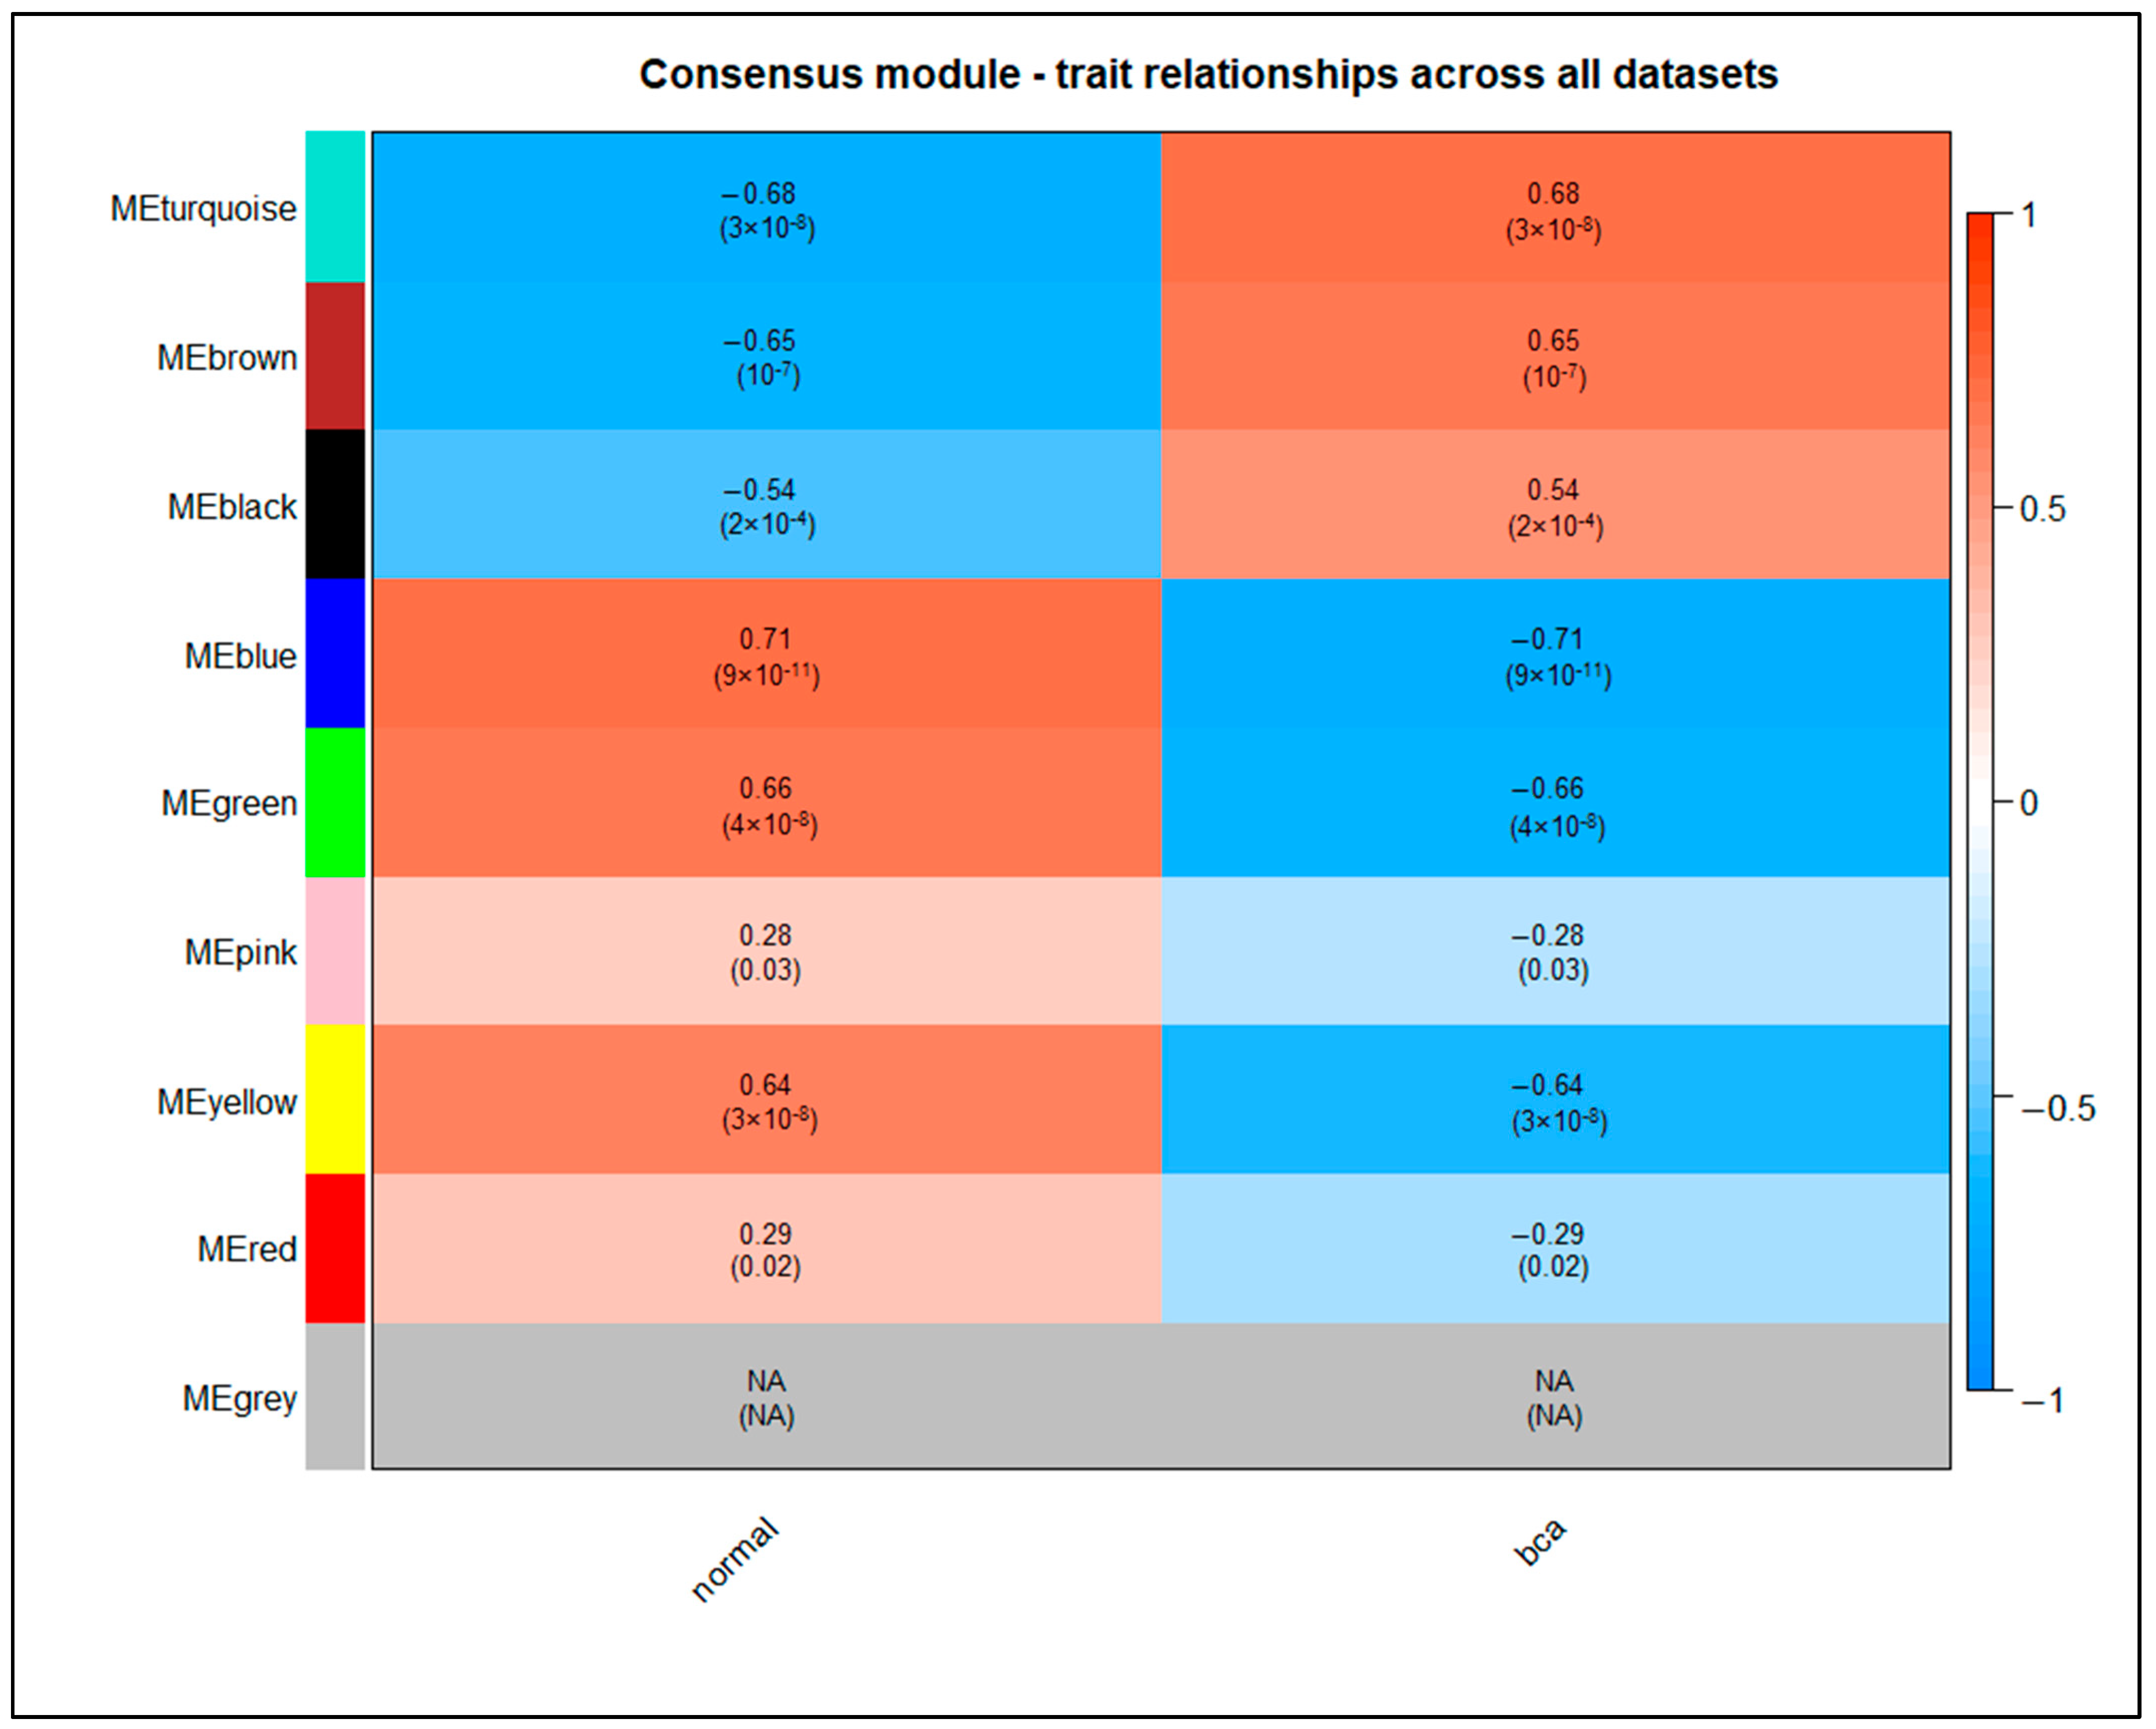
3.8. Weighted Protein–Protein Interaction Network Analysis
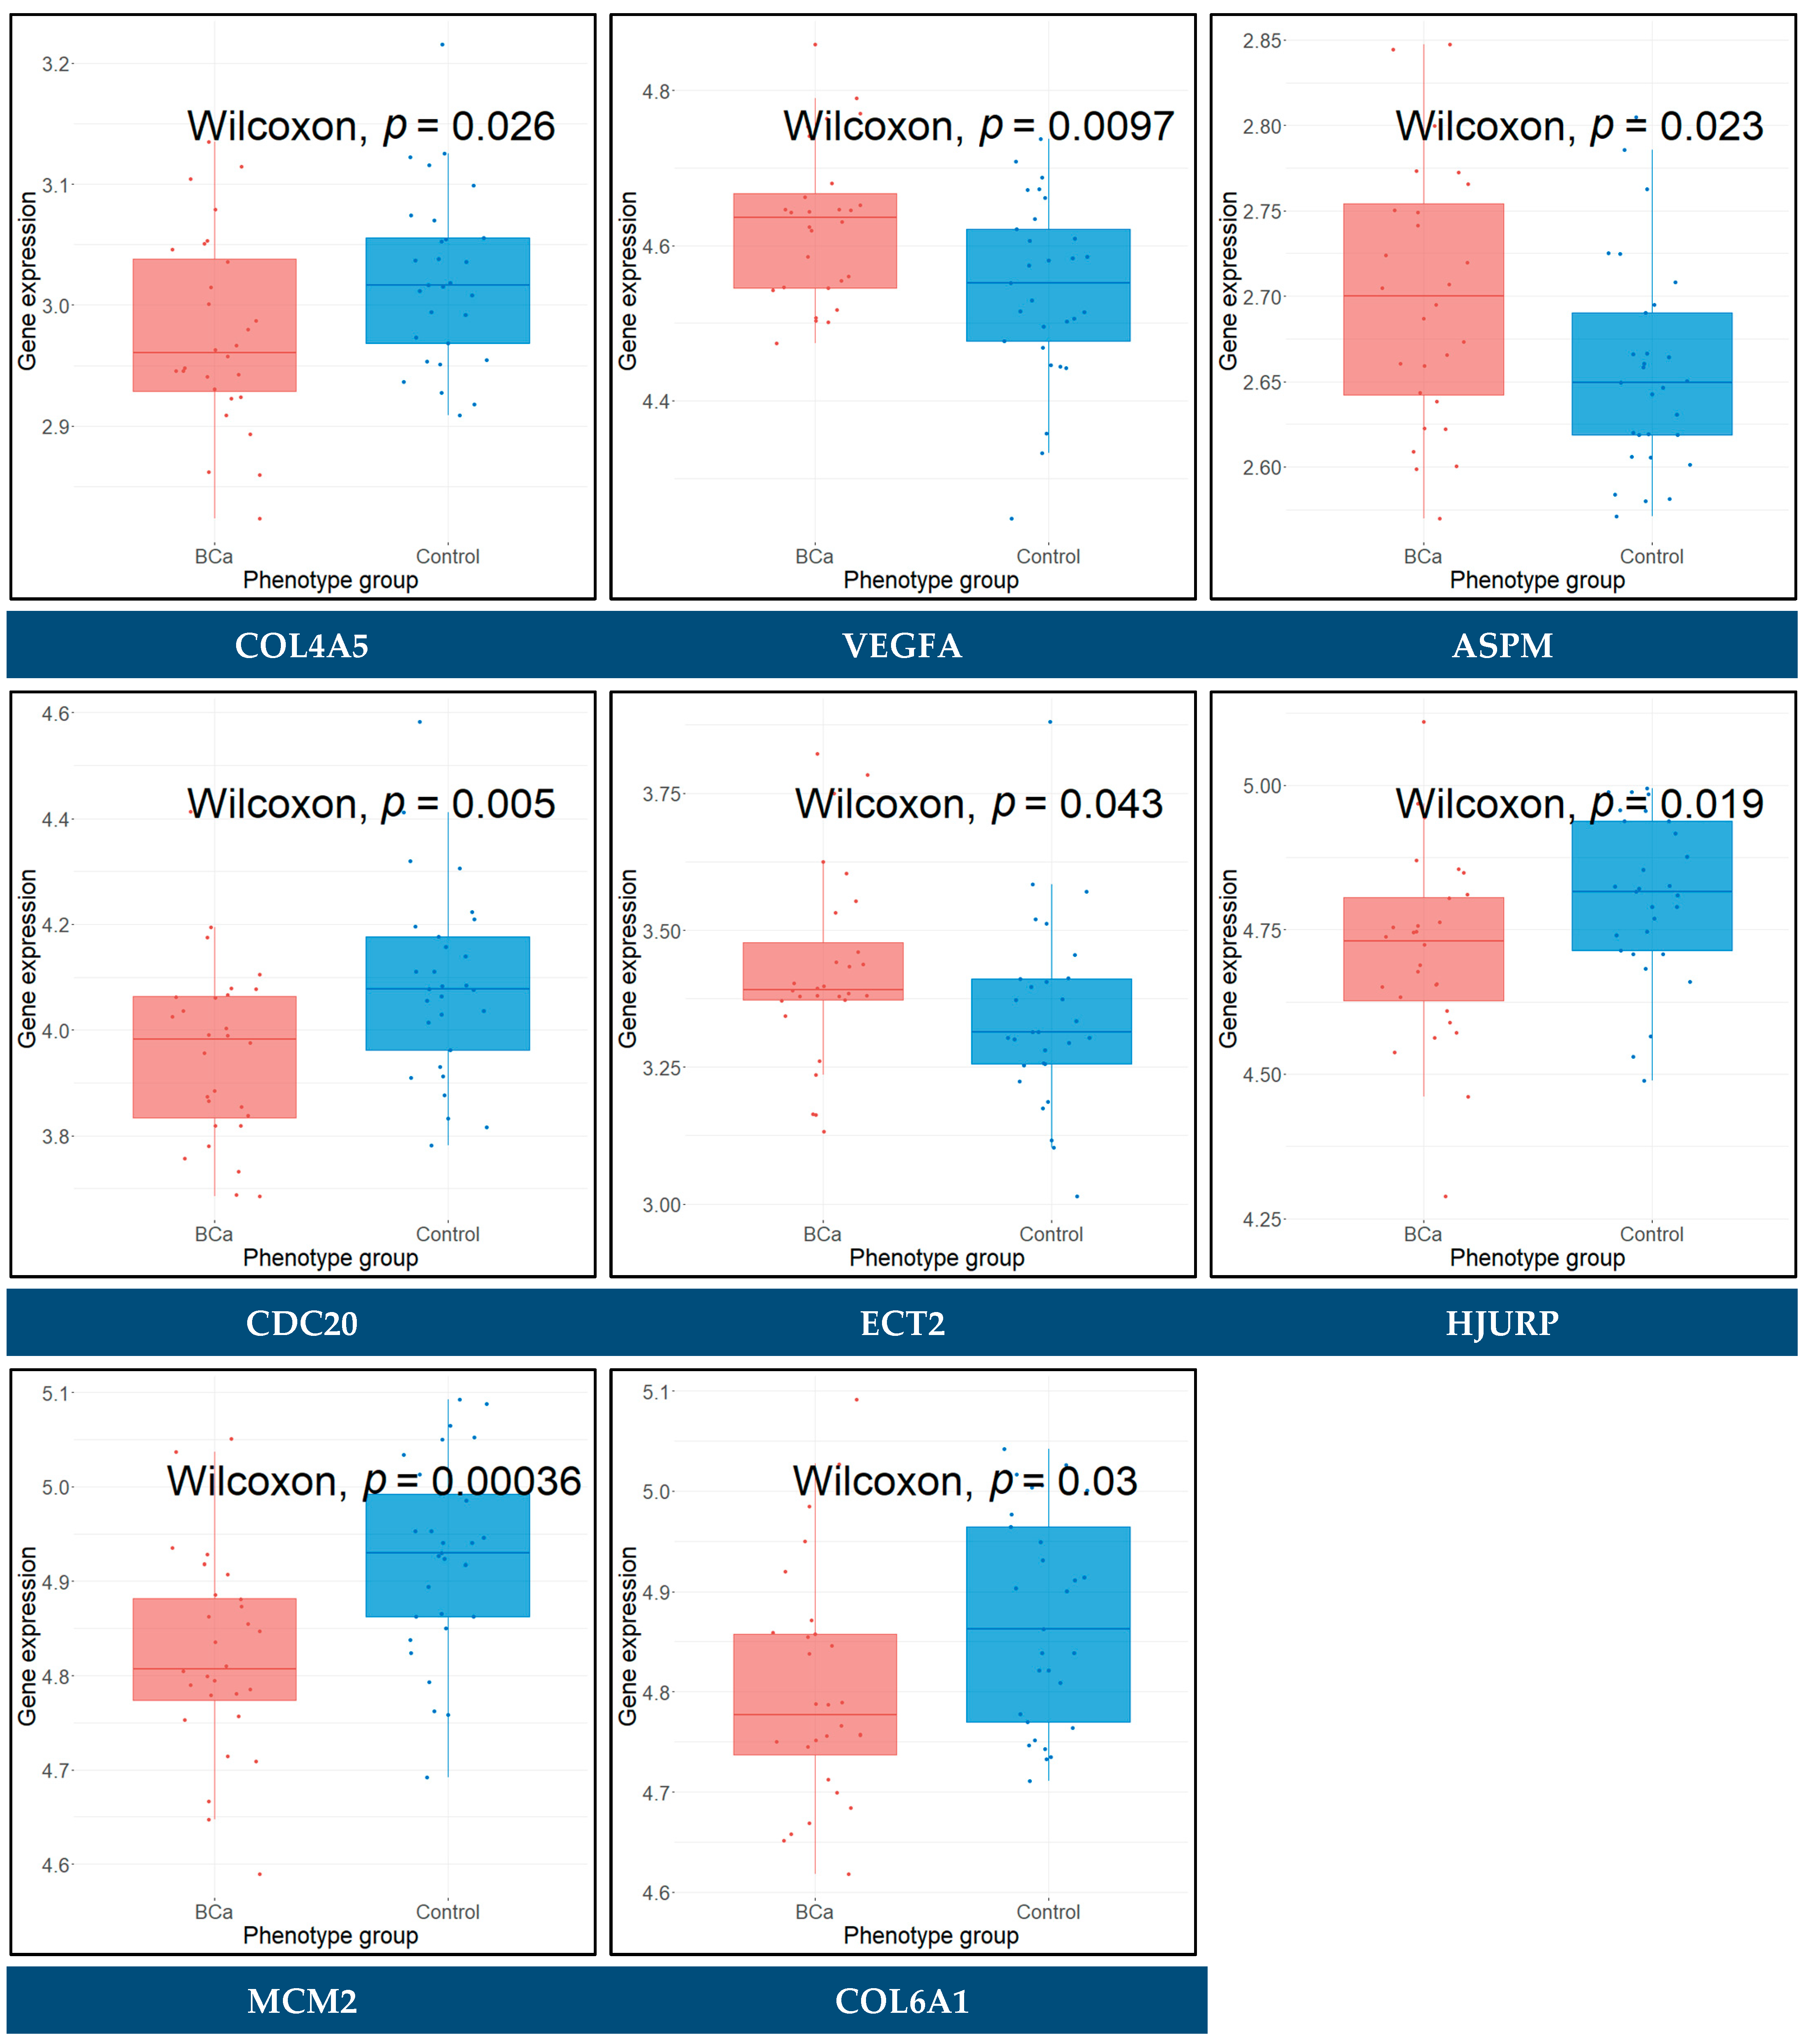
3.9. Differential Expression in Urine and Blood Plasma Samples
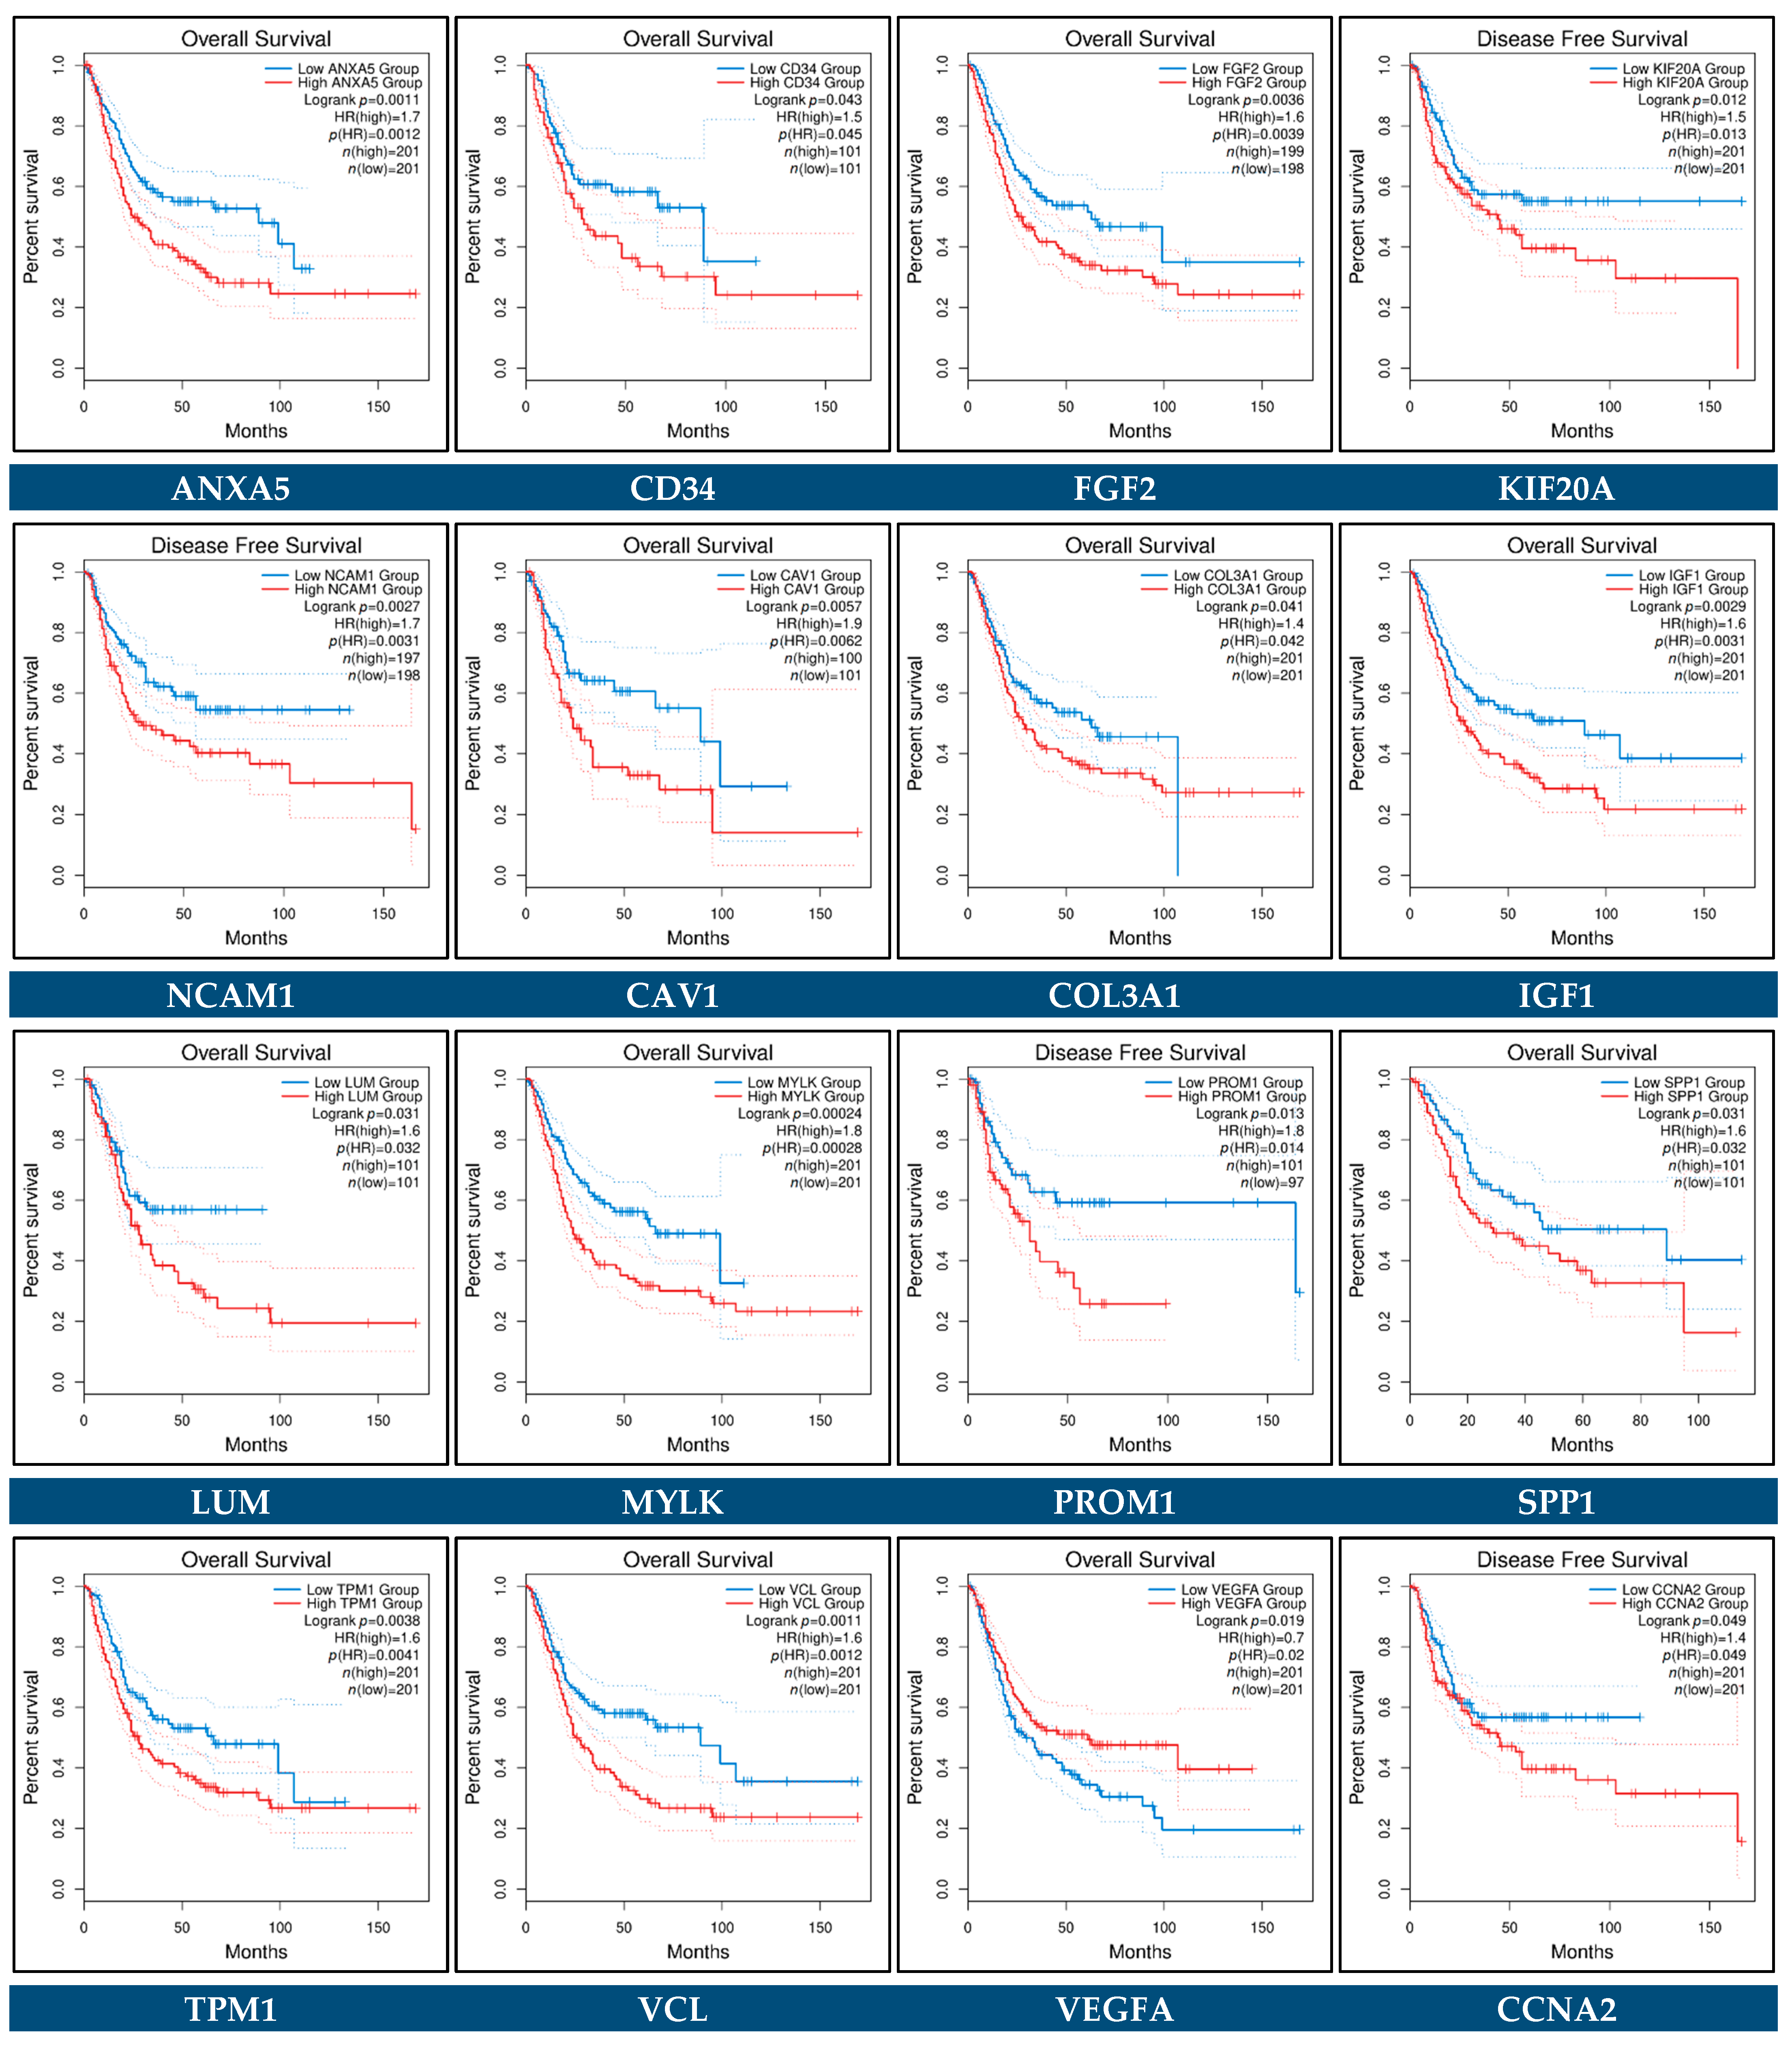
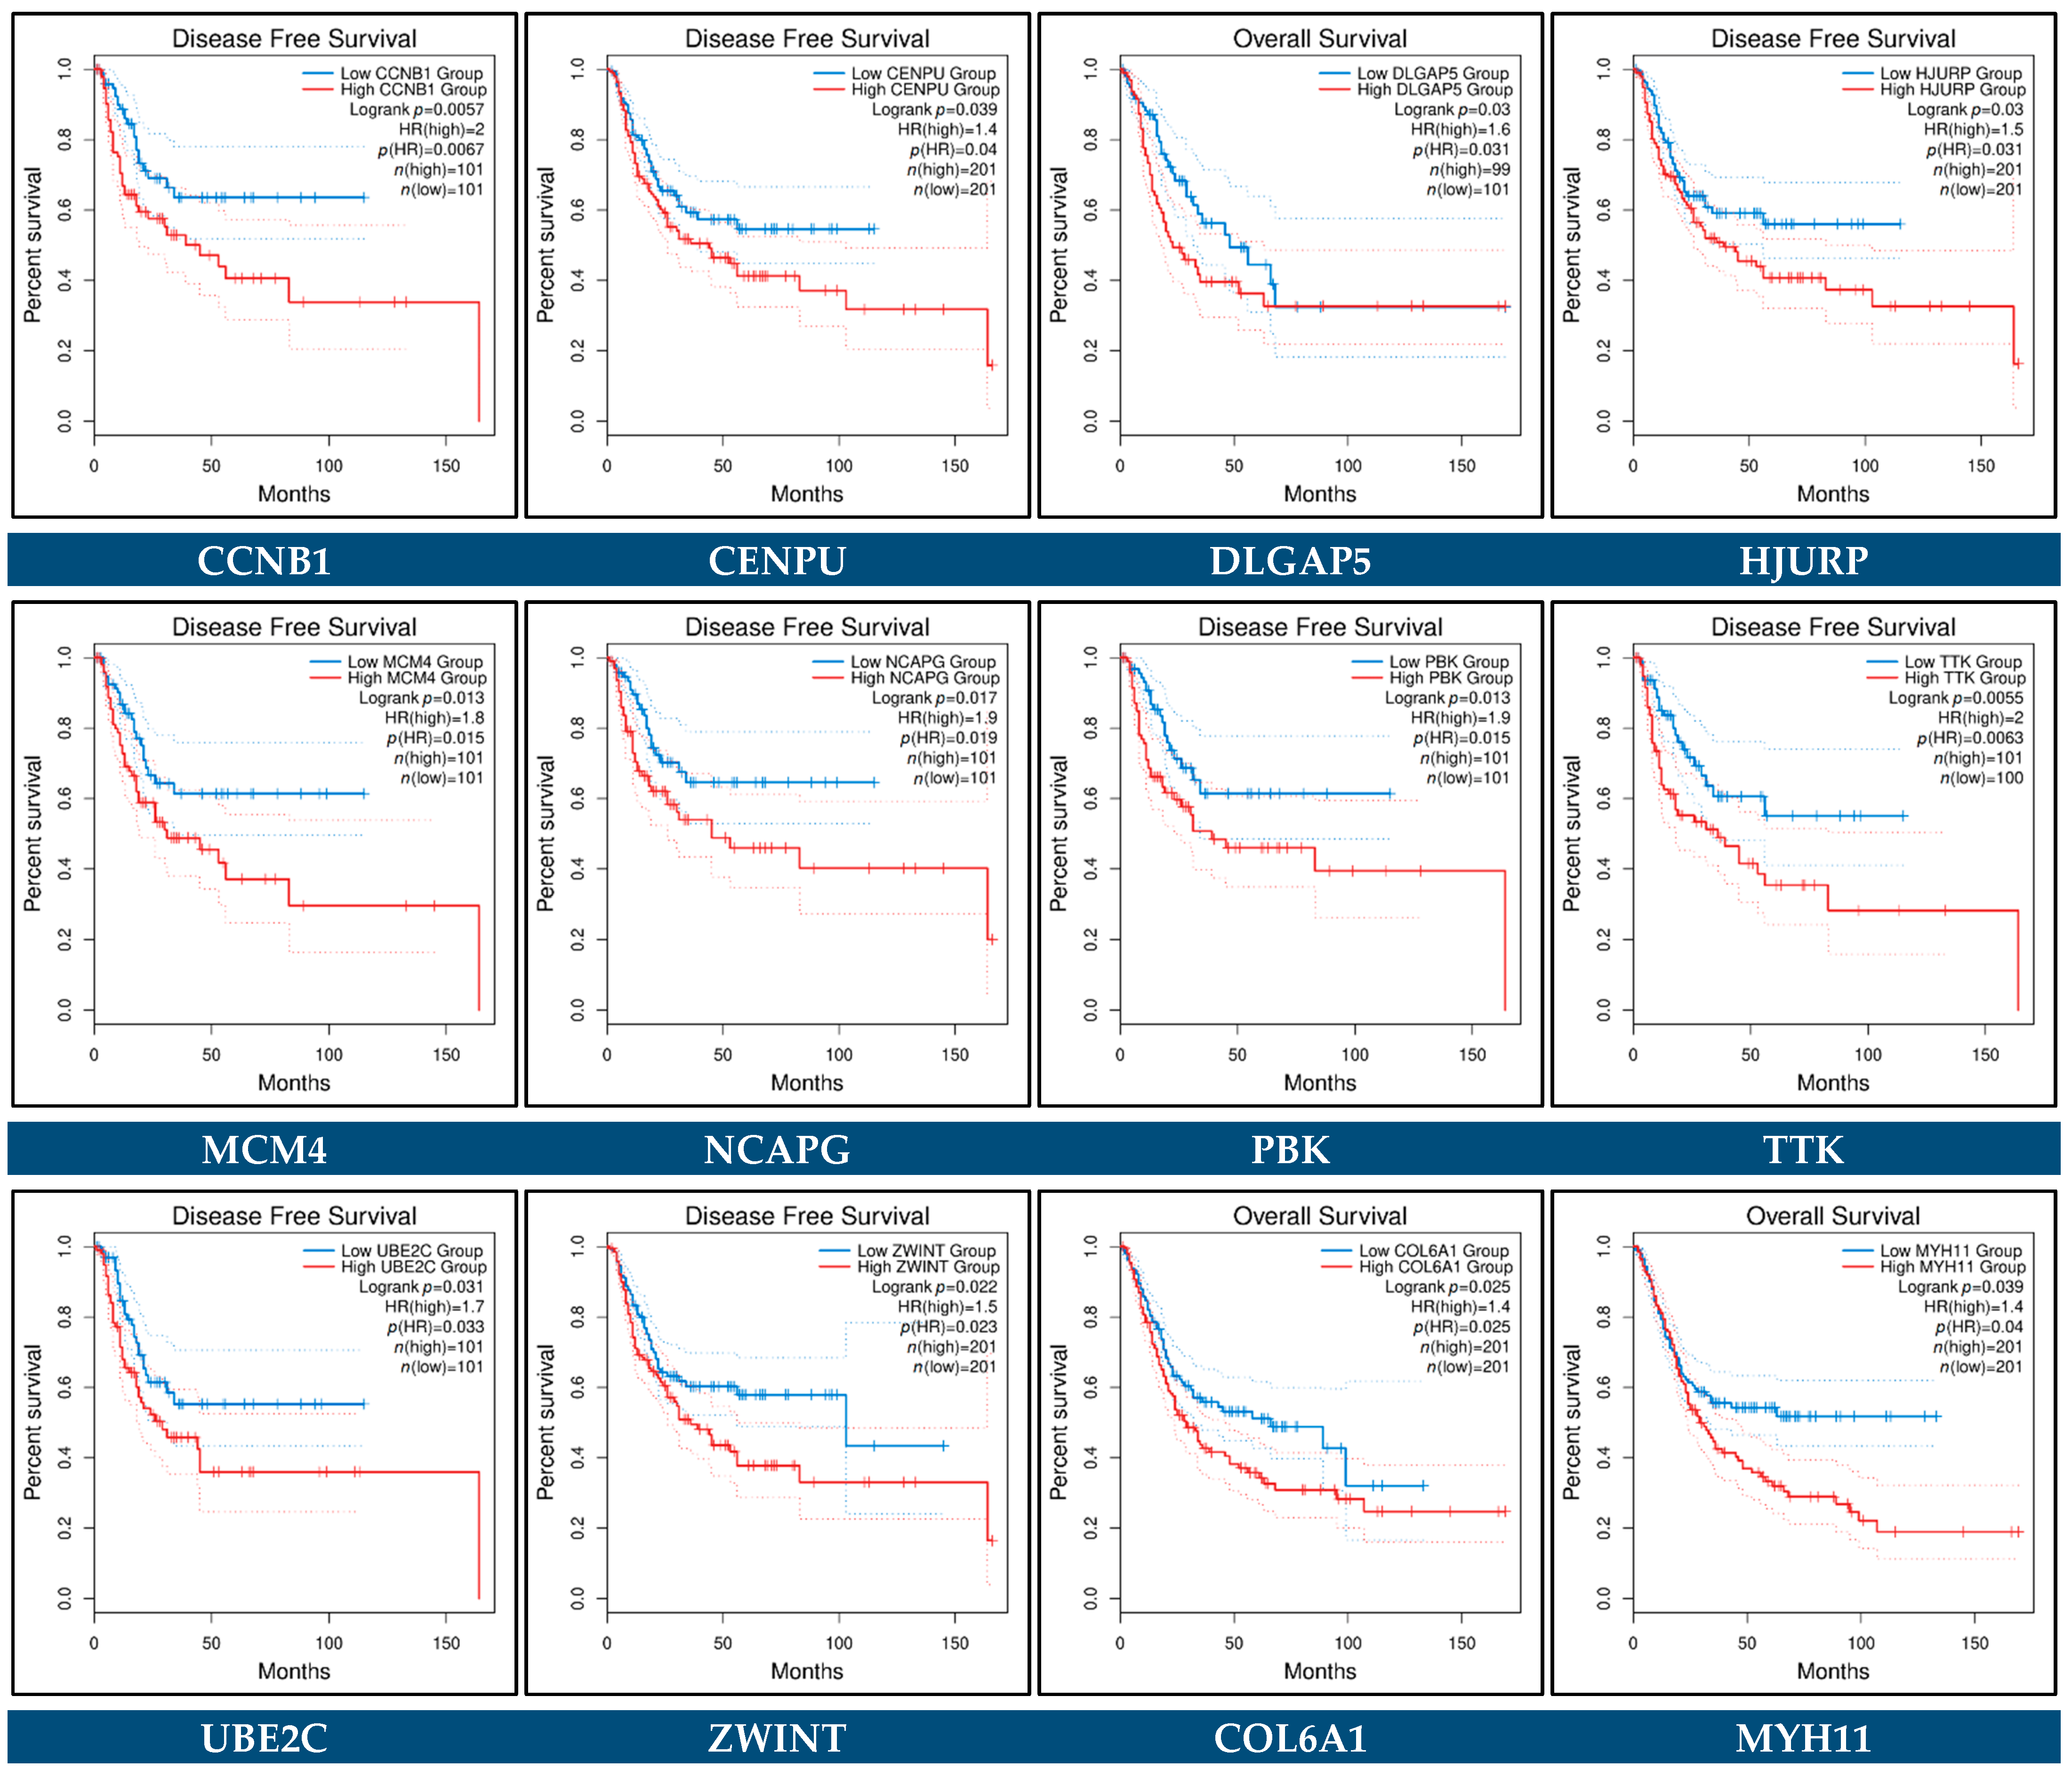
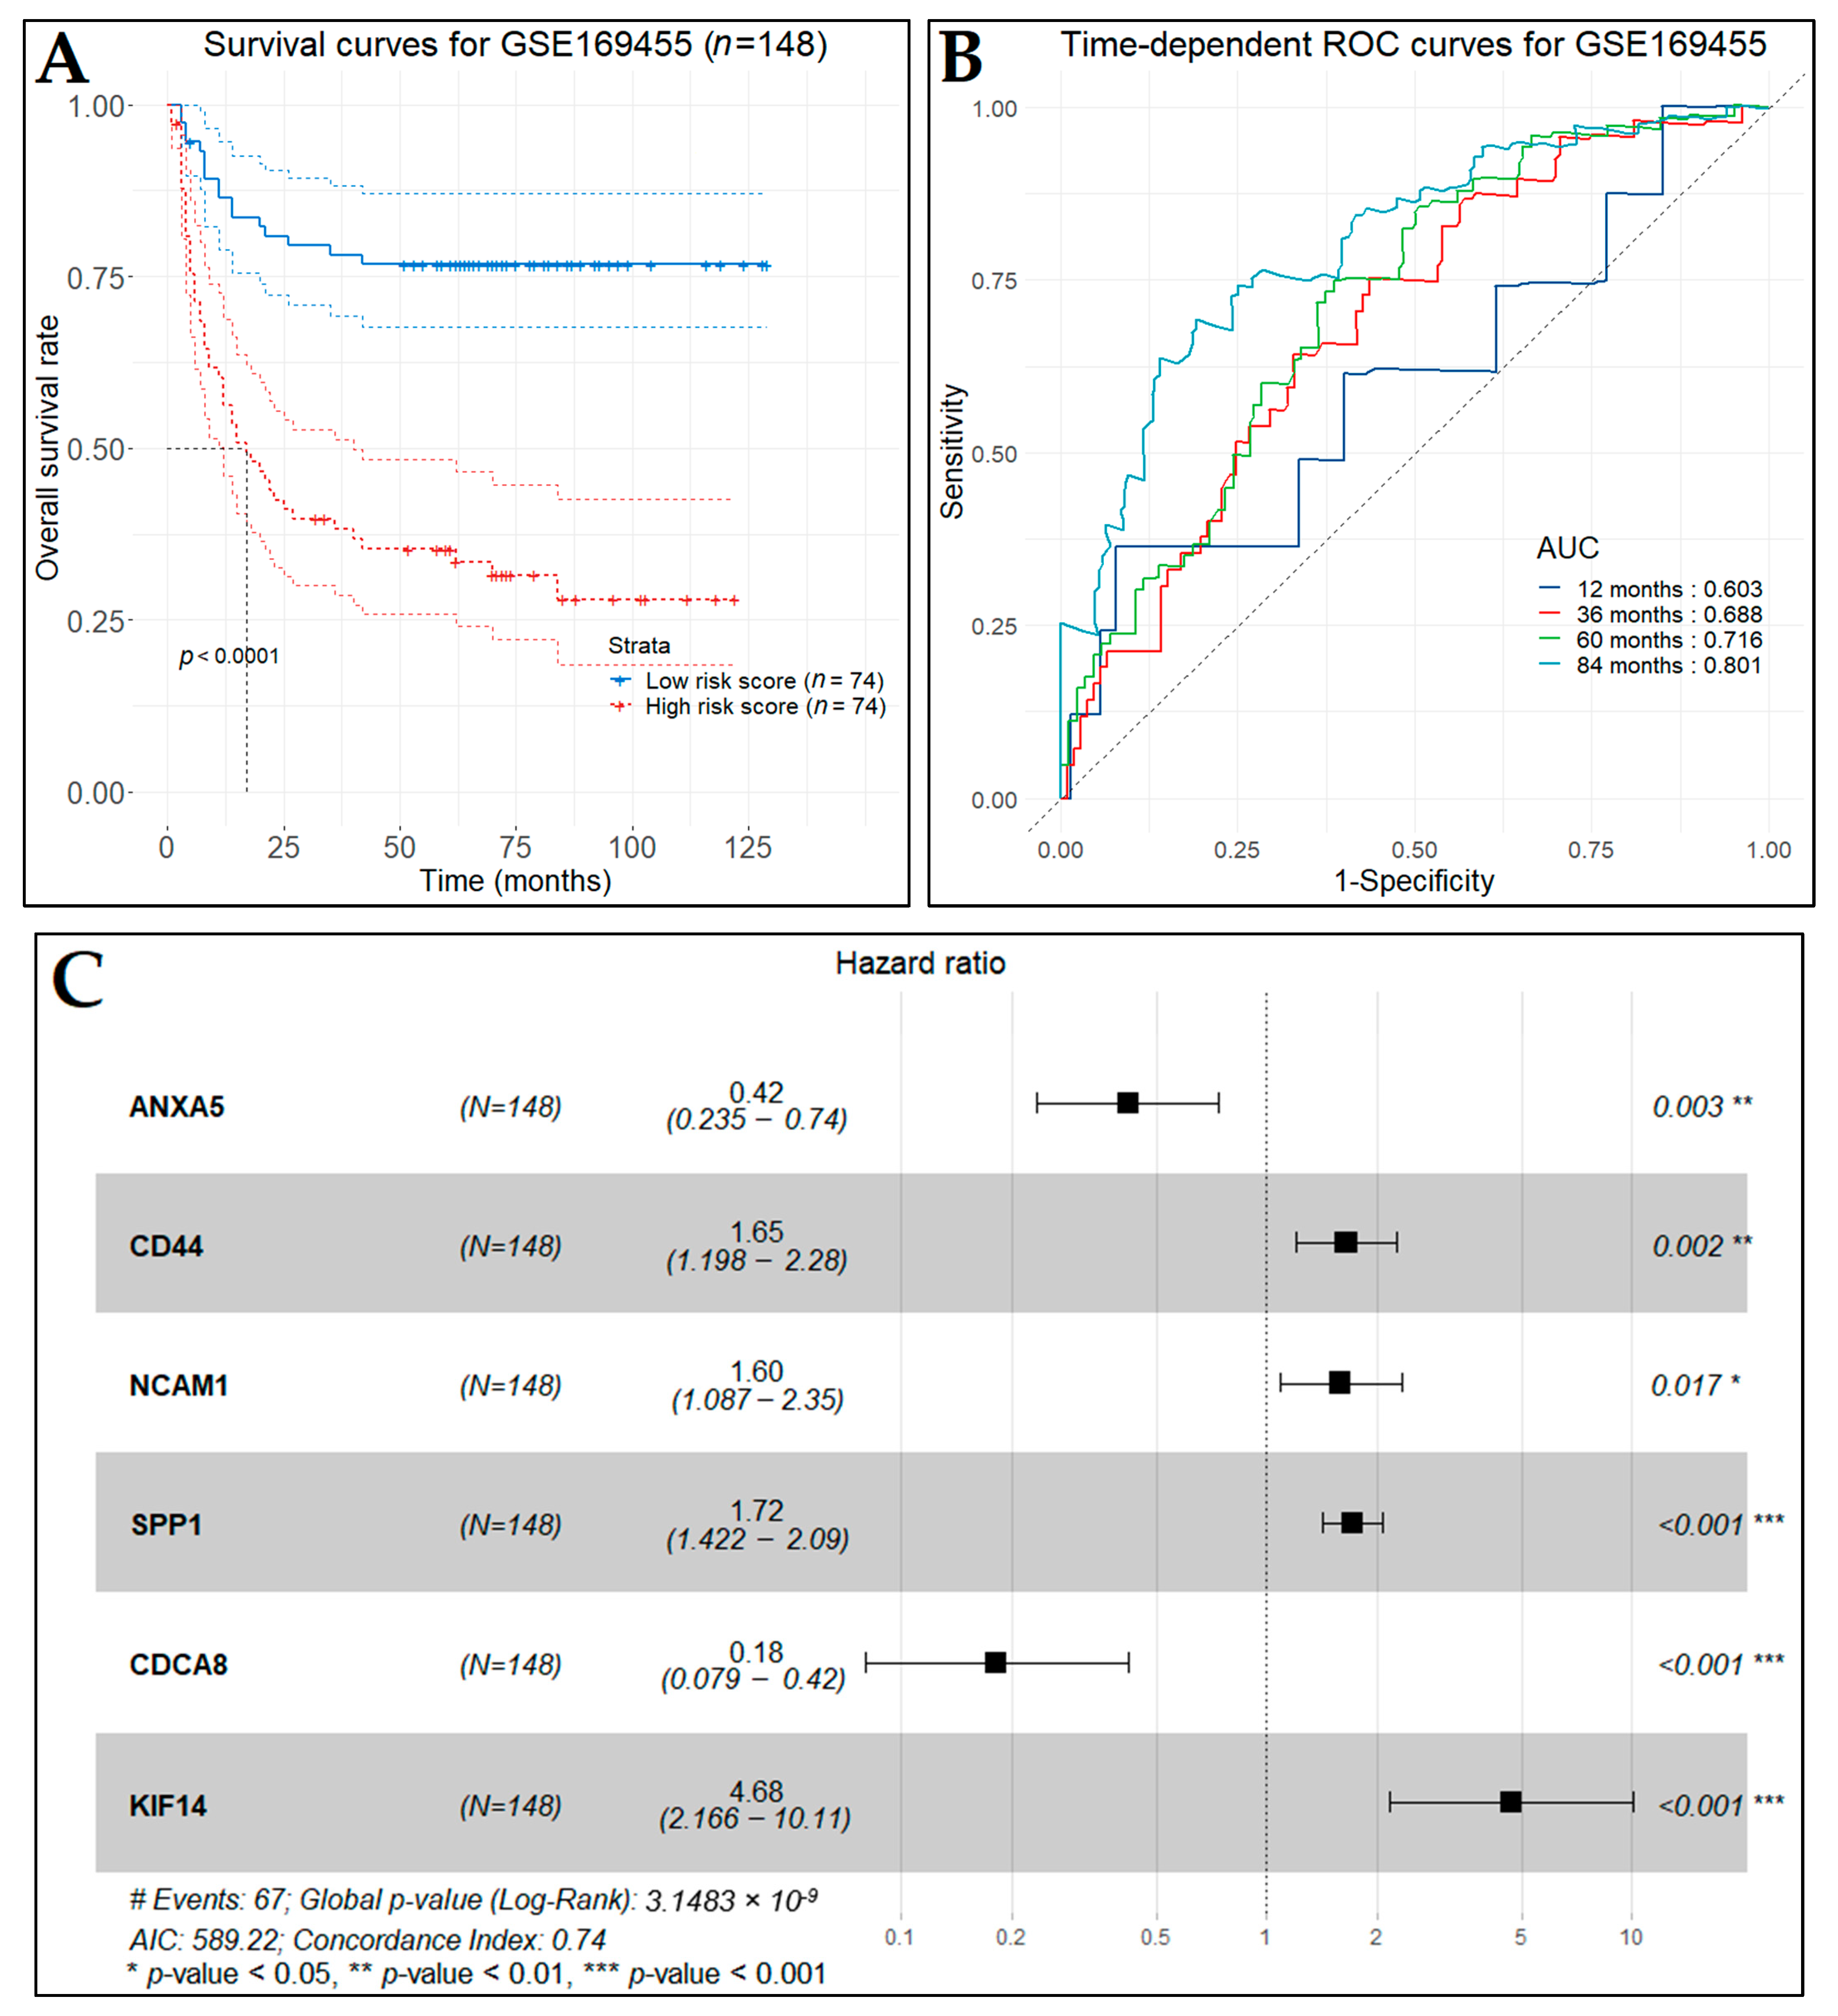
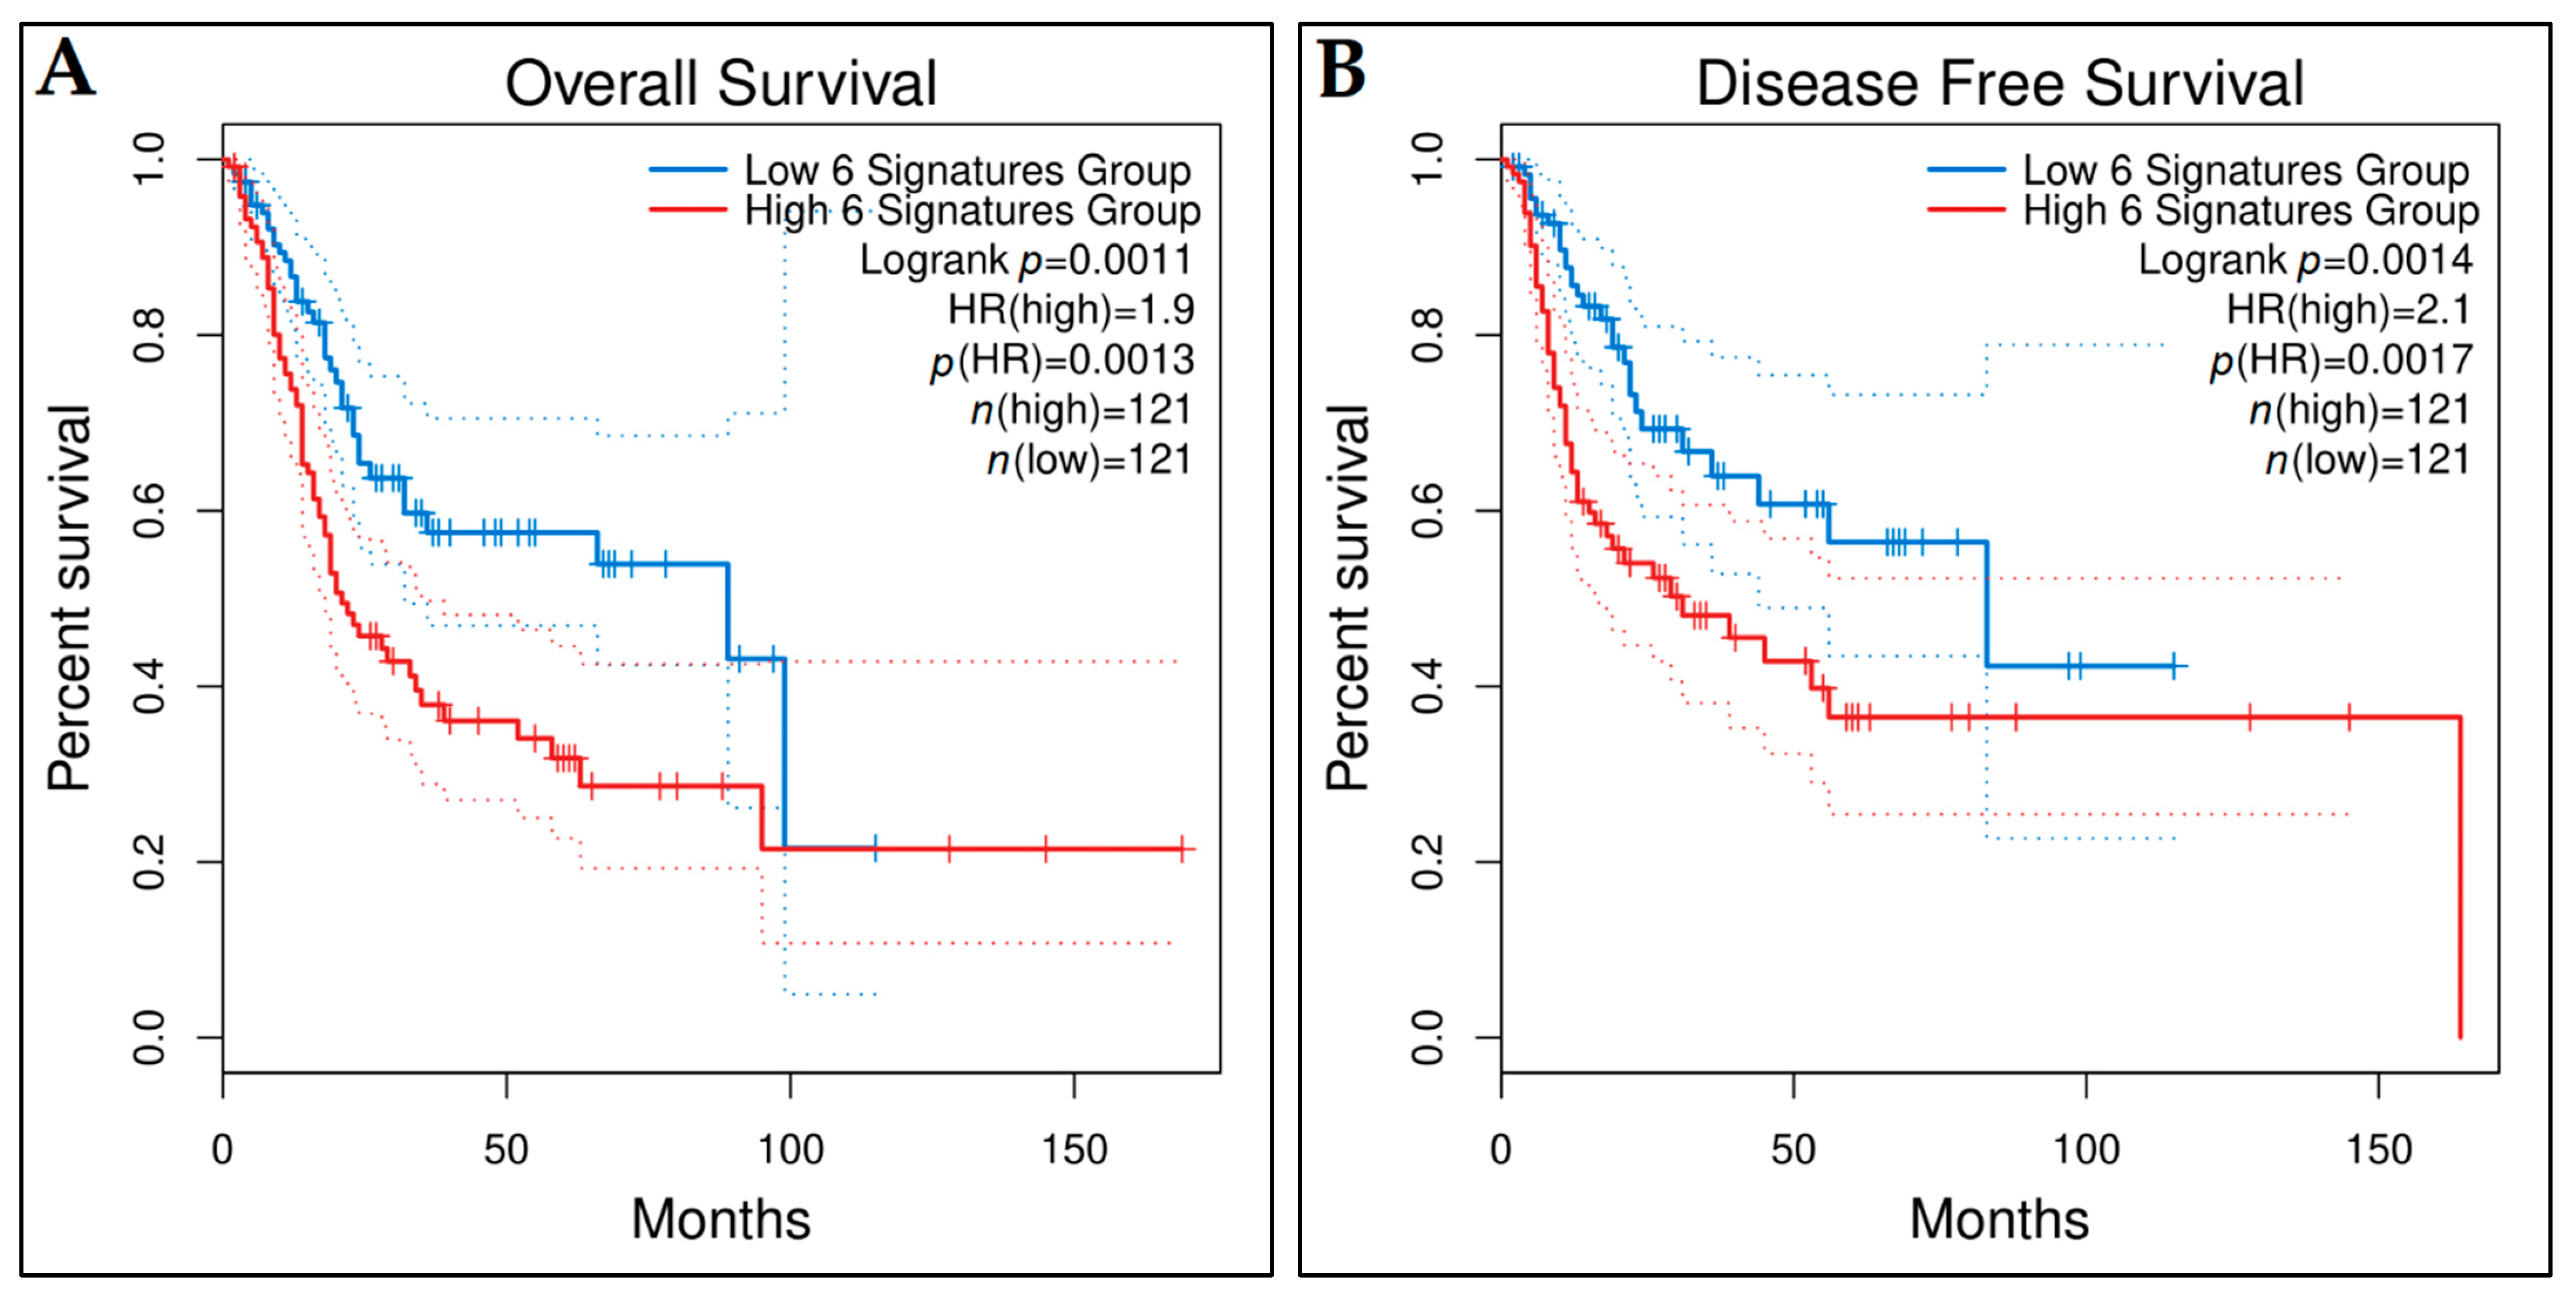
3.10. Prognostic Genes for BCa
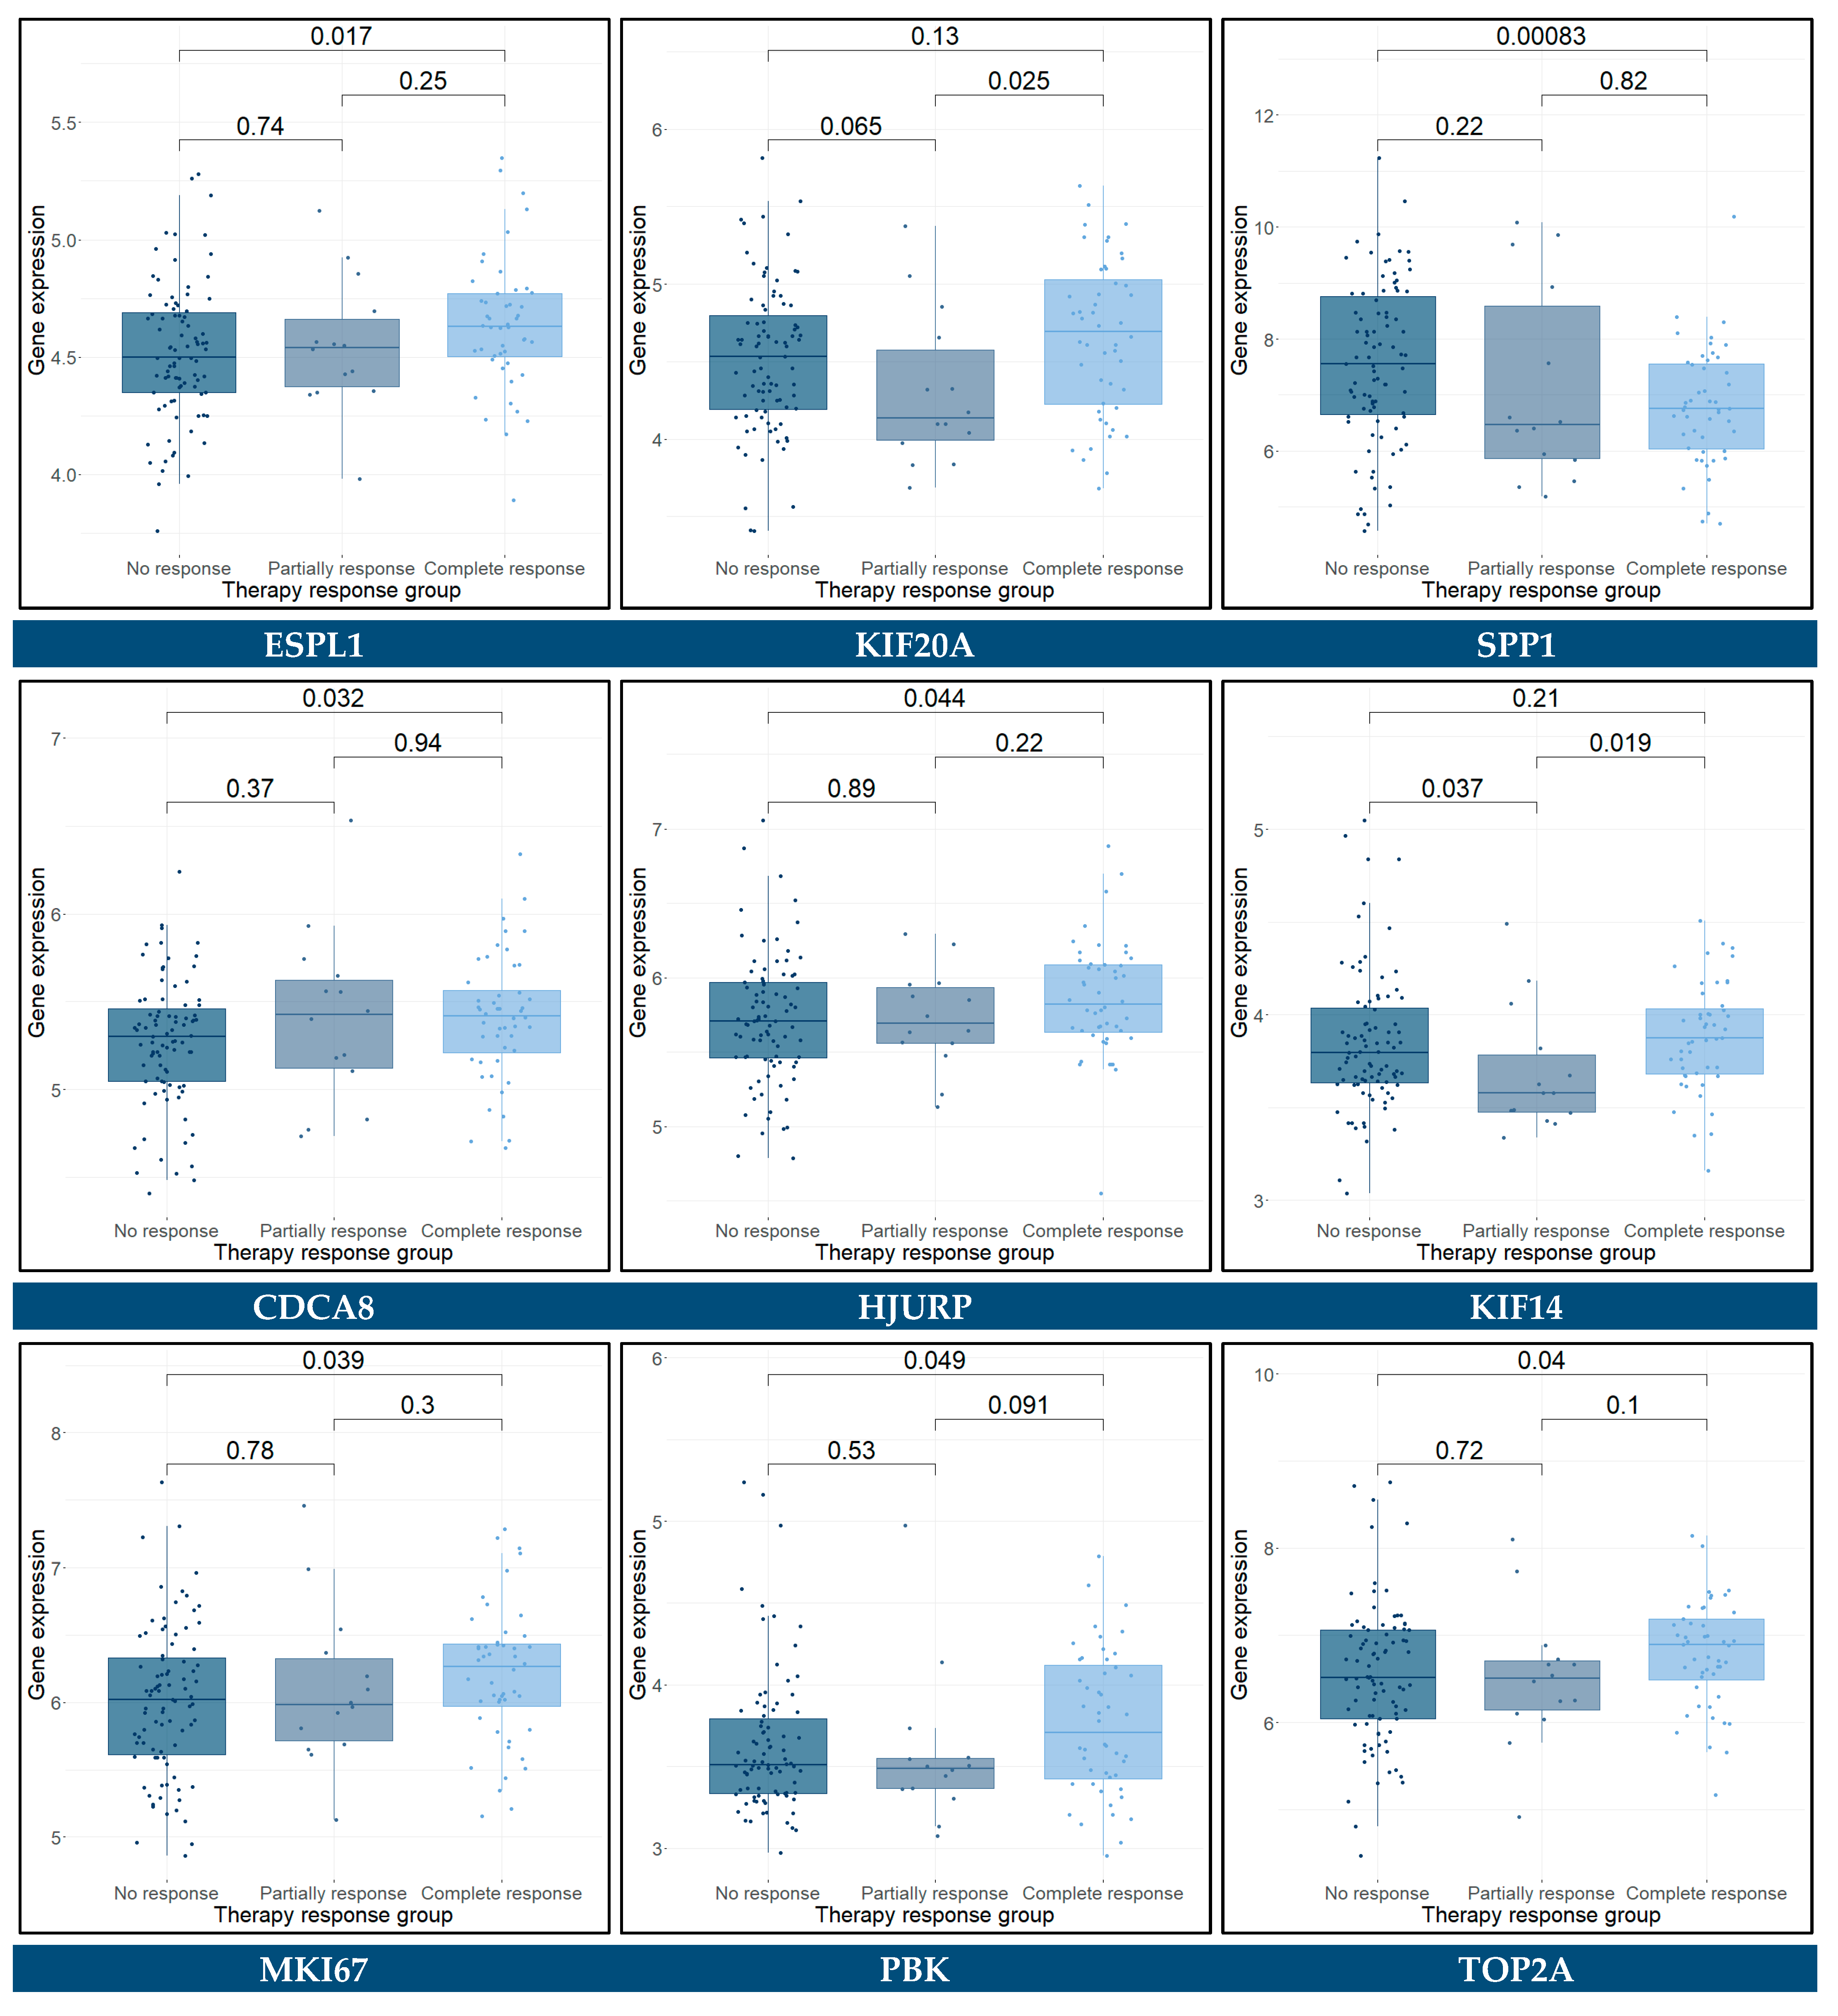
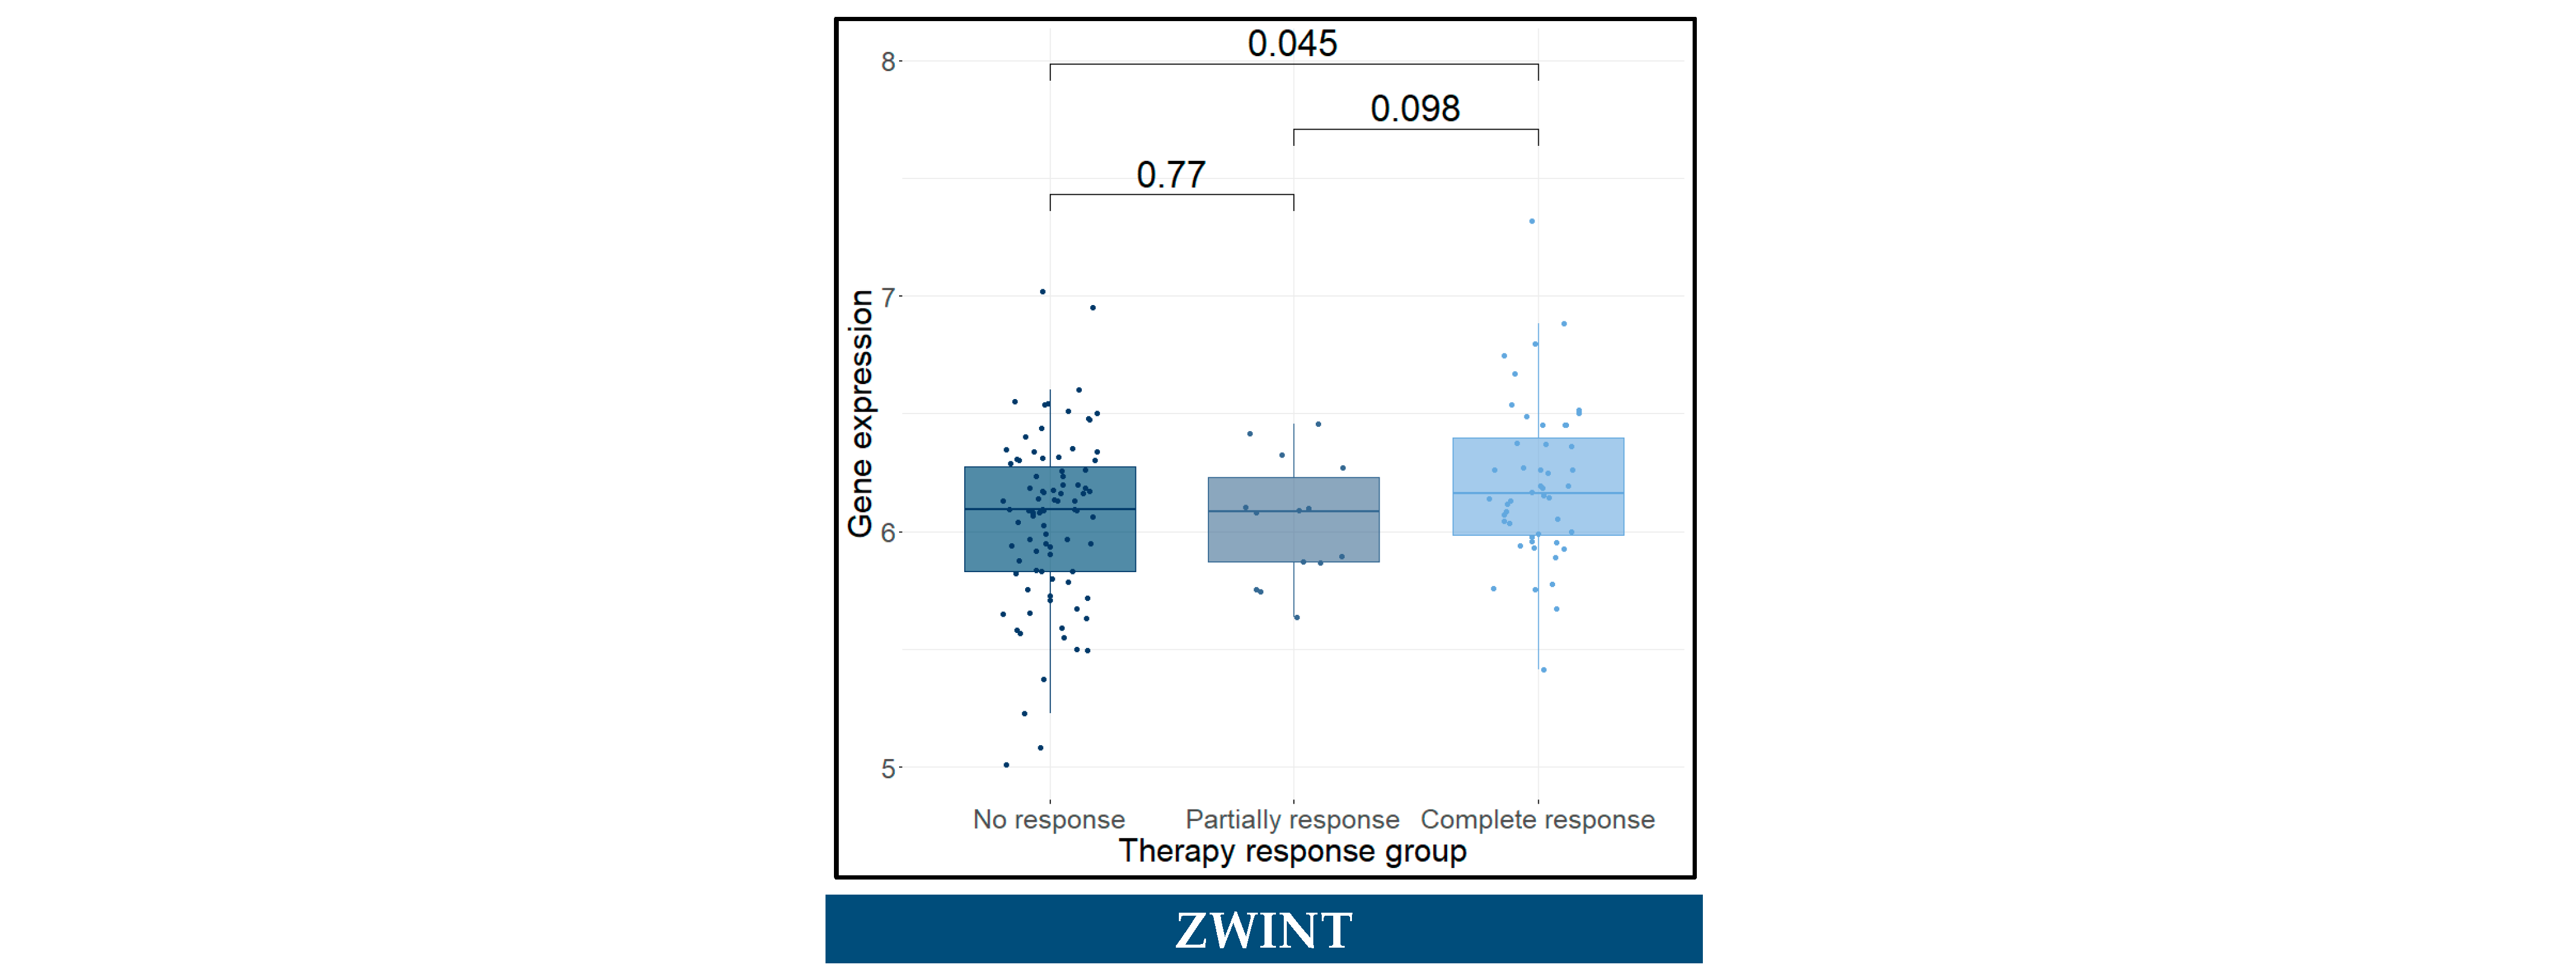
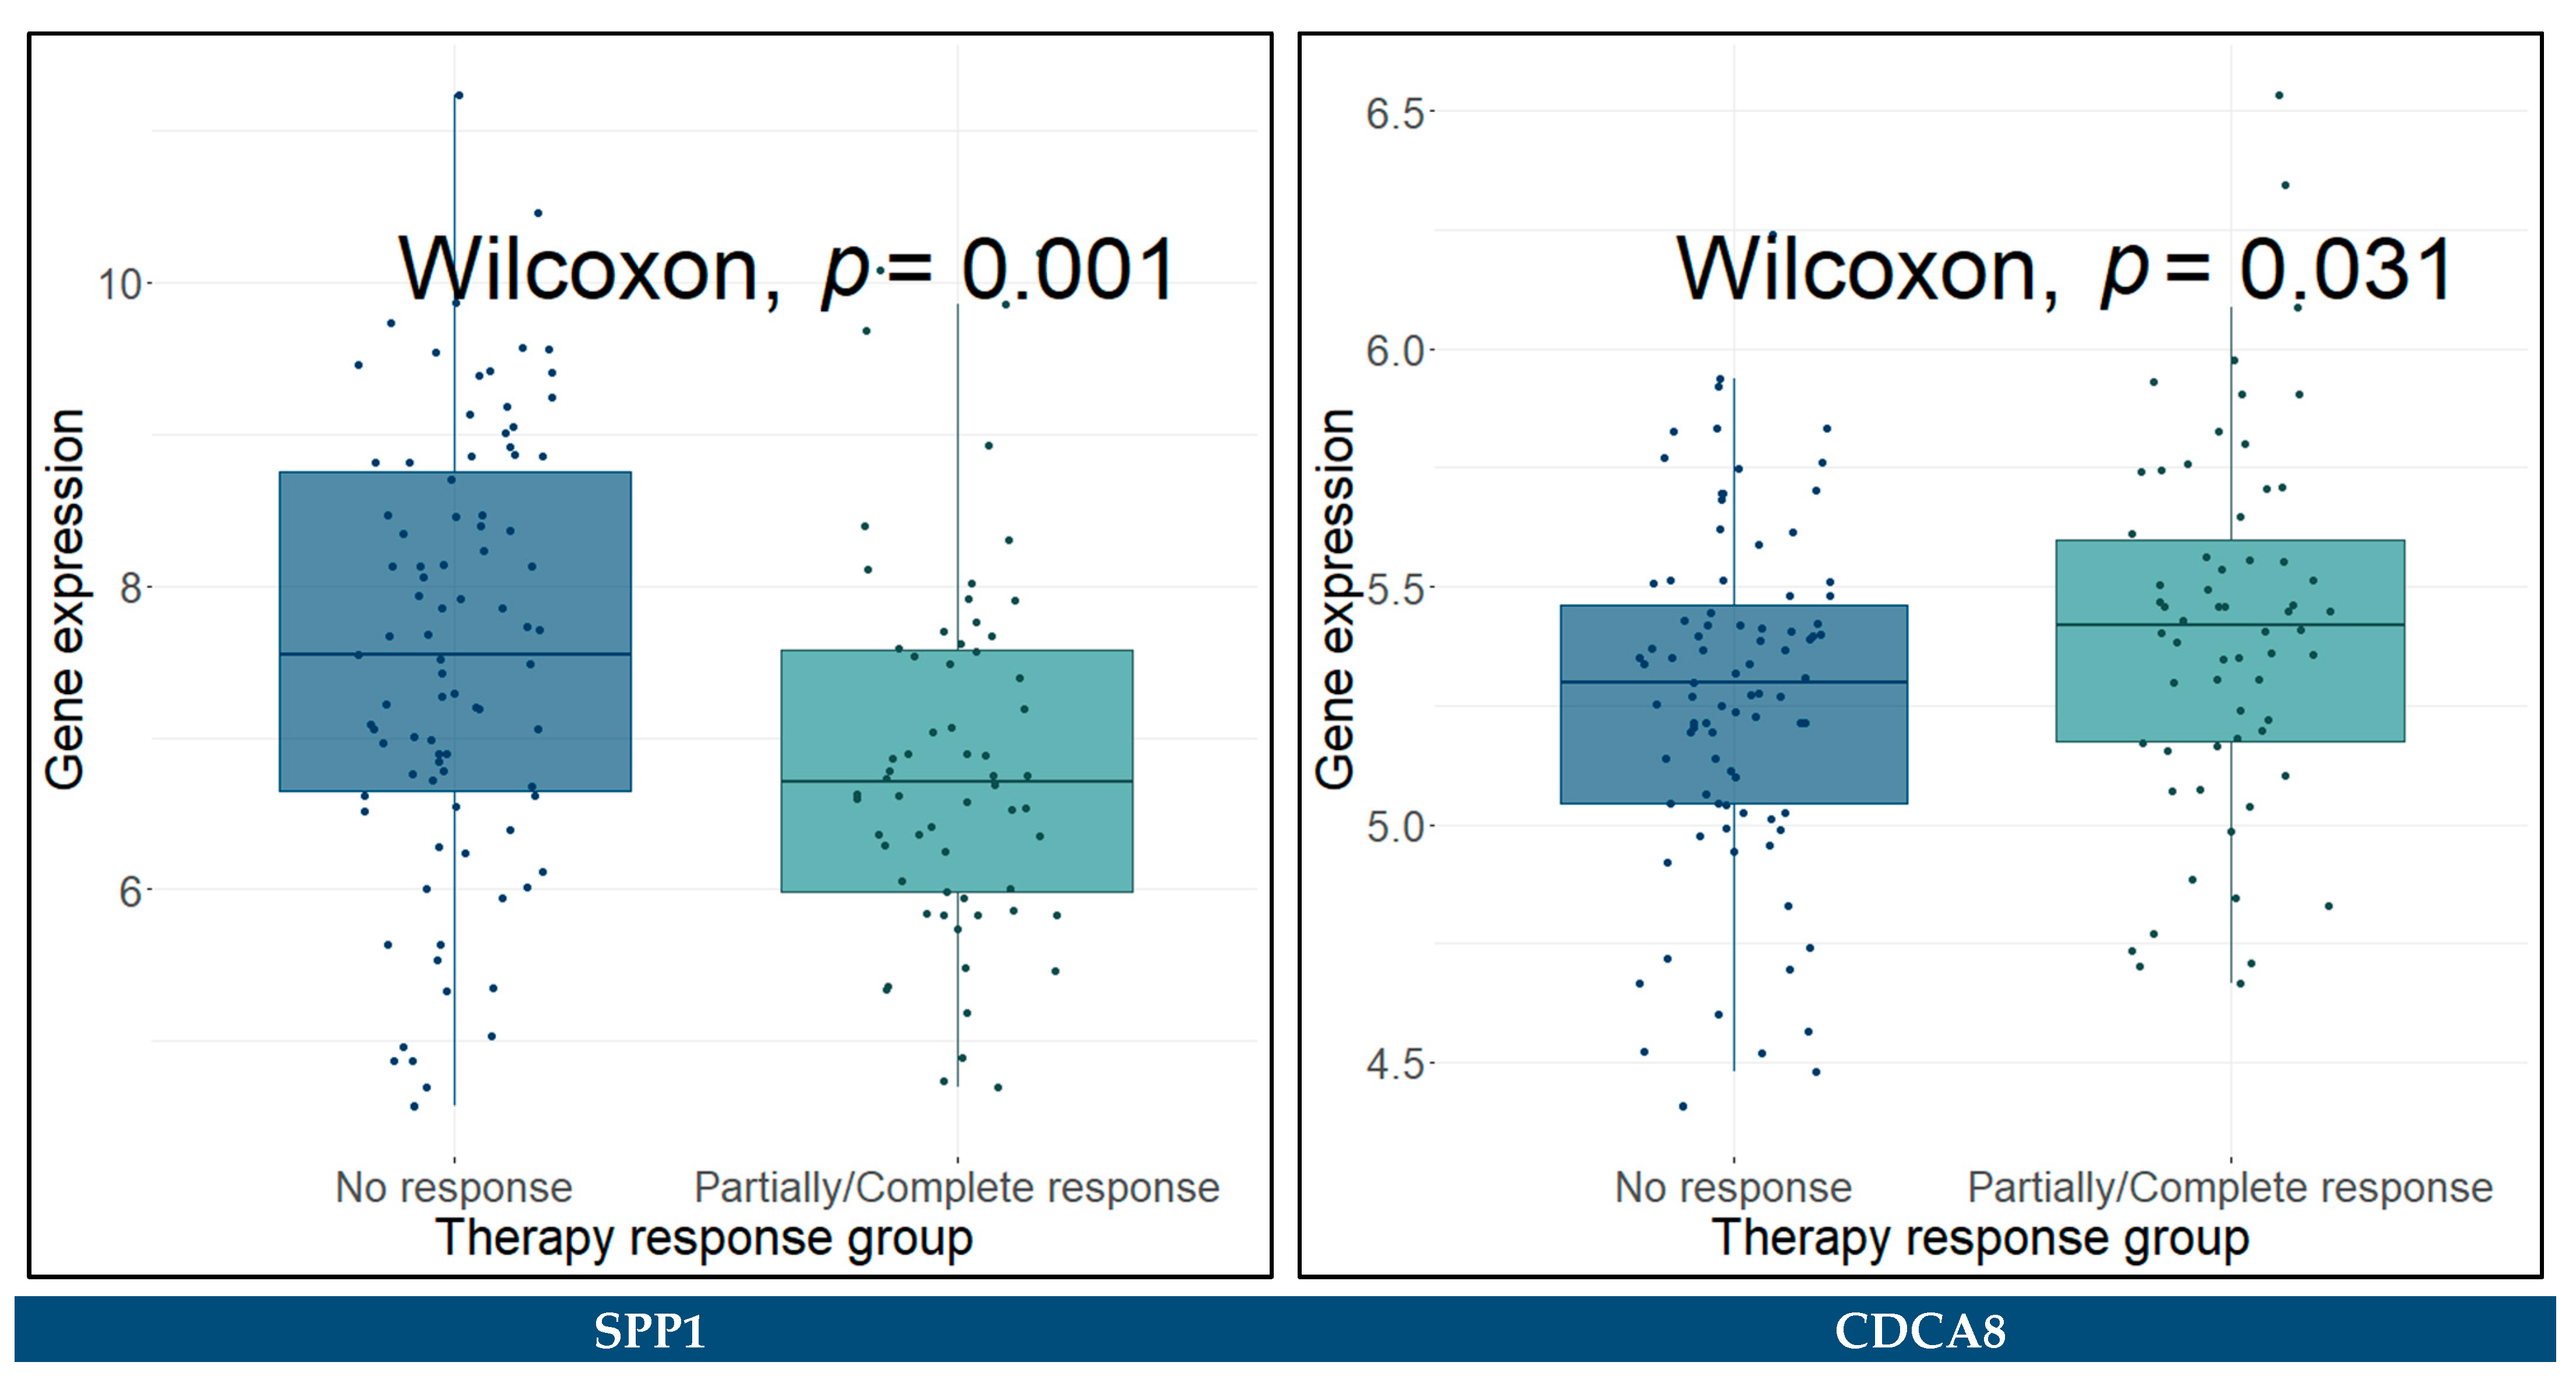
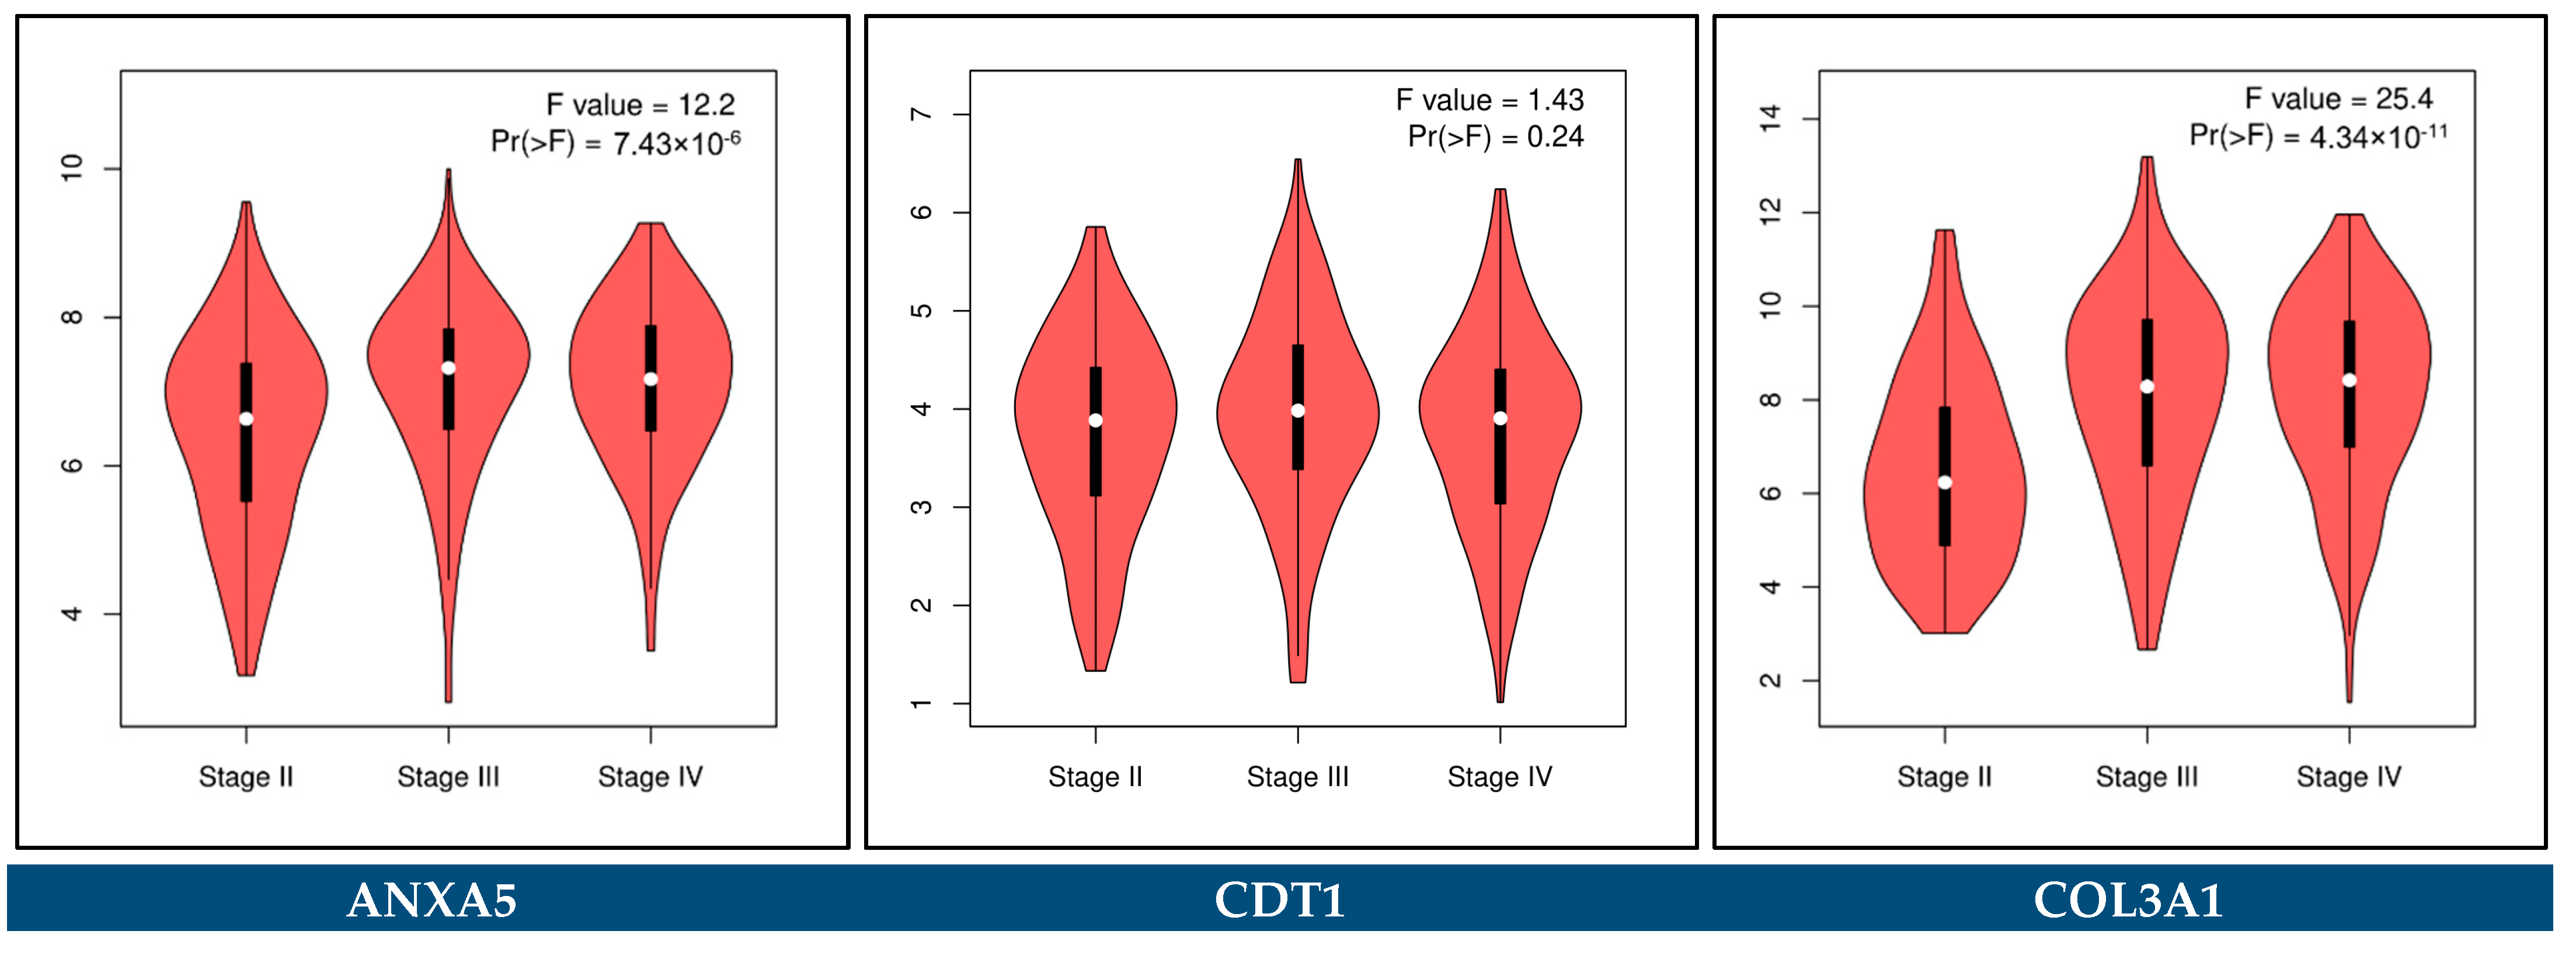
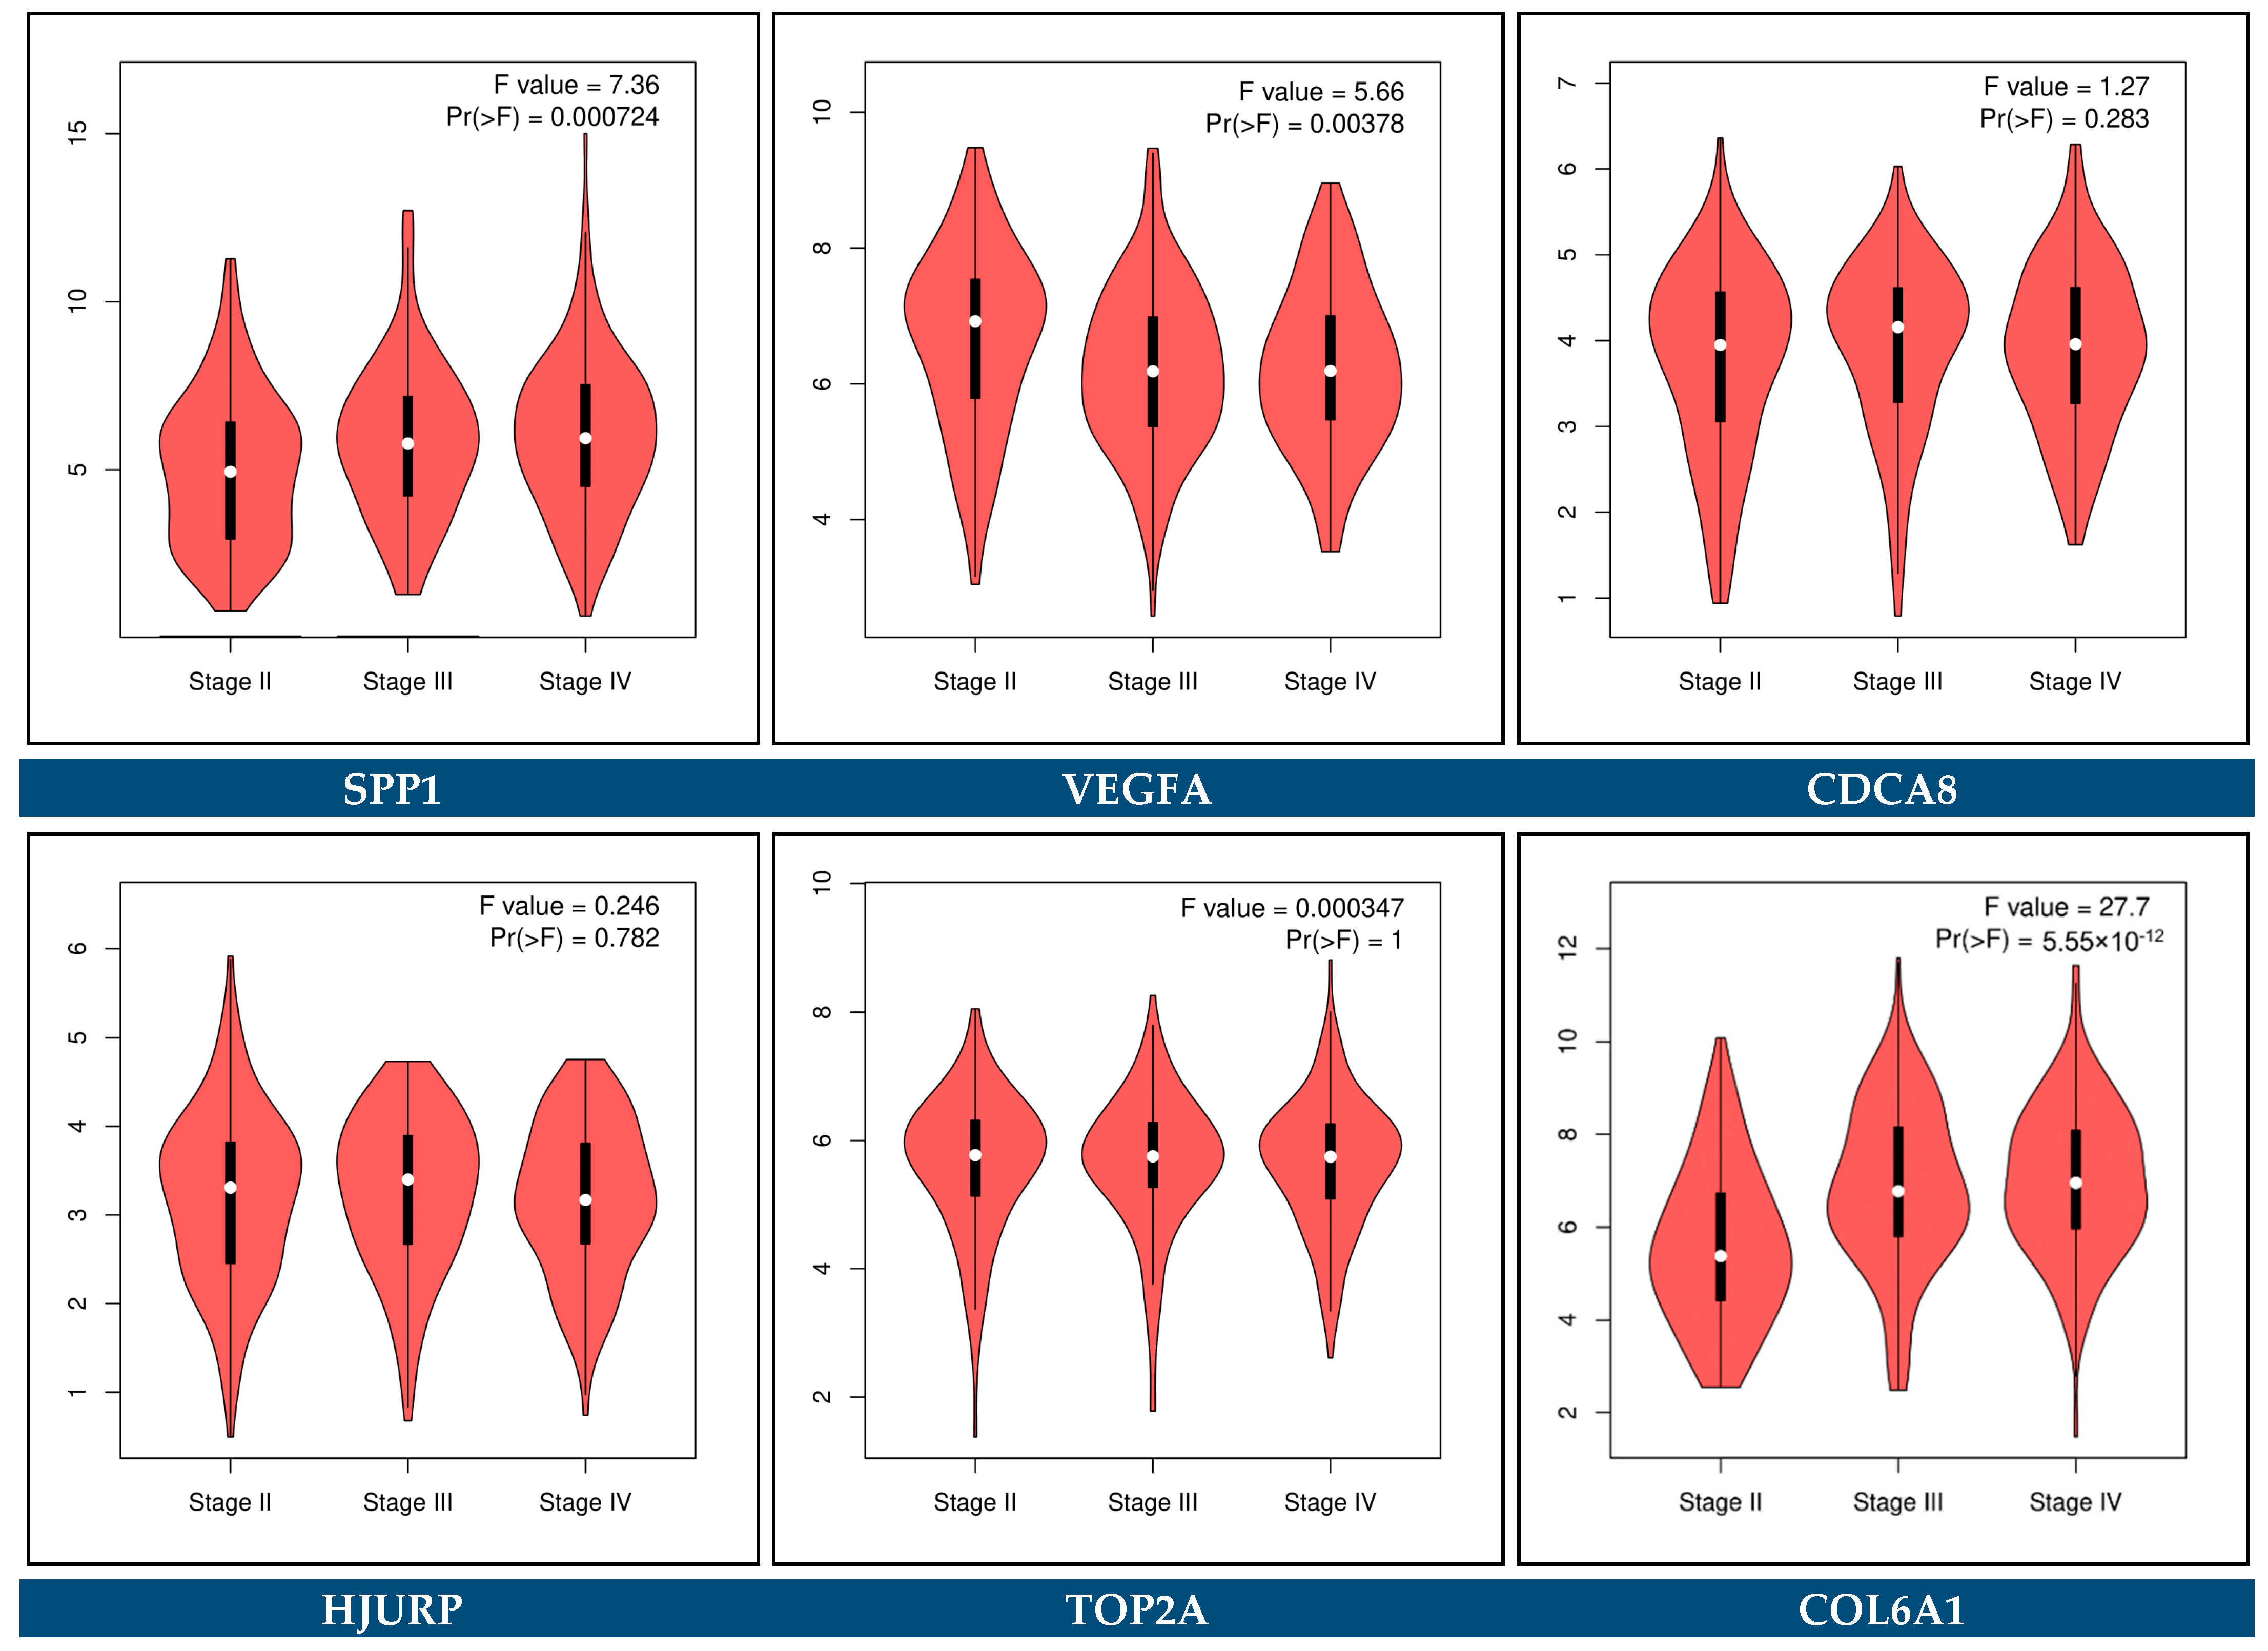
3.11. Predictive Genes for BCa
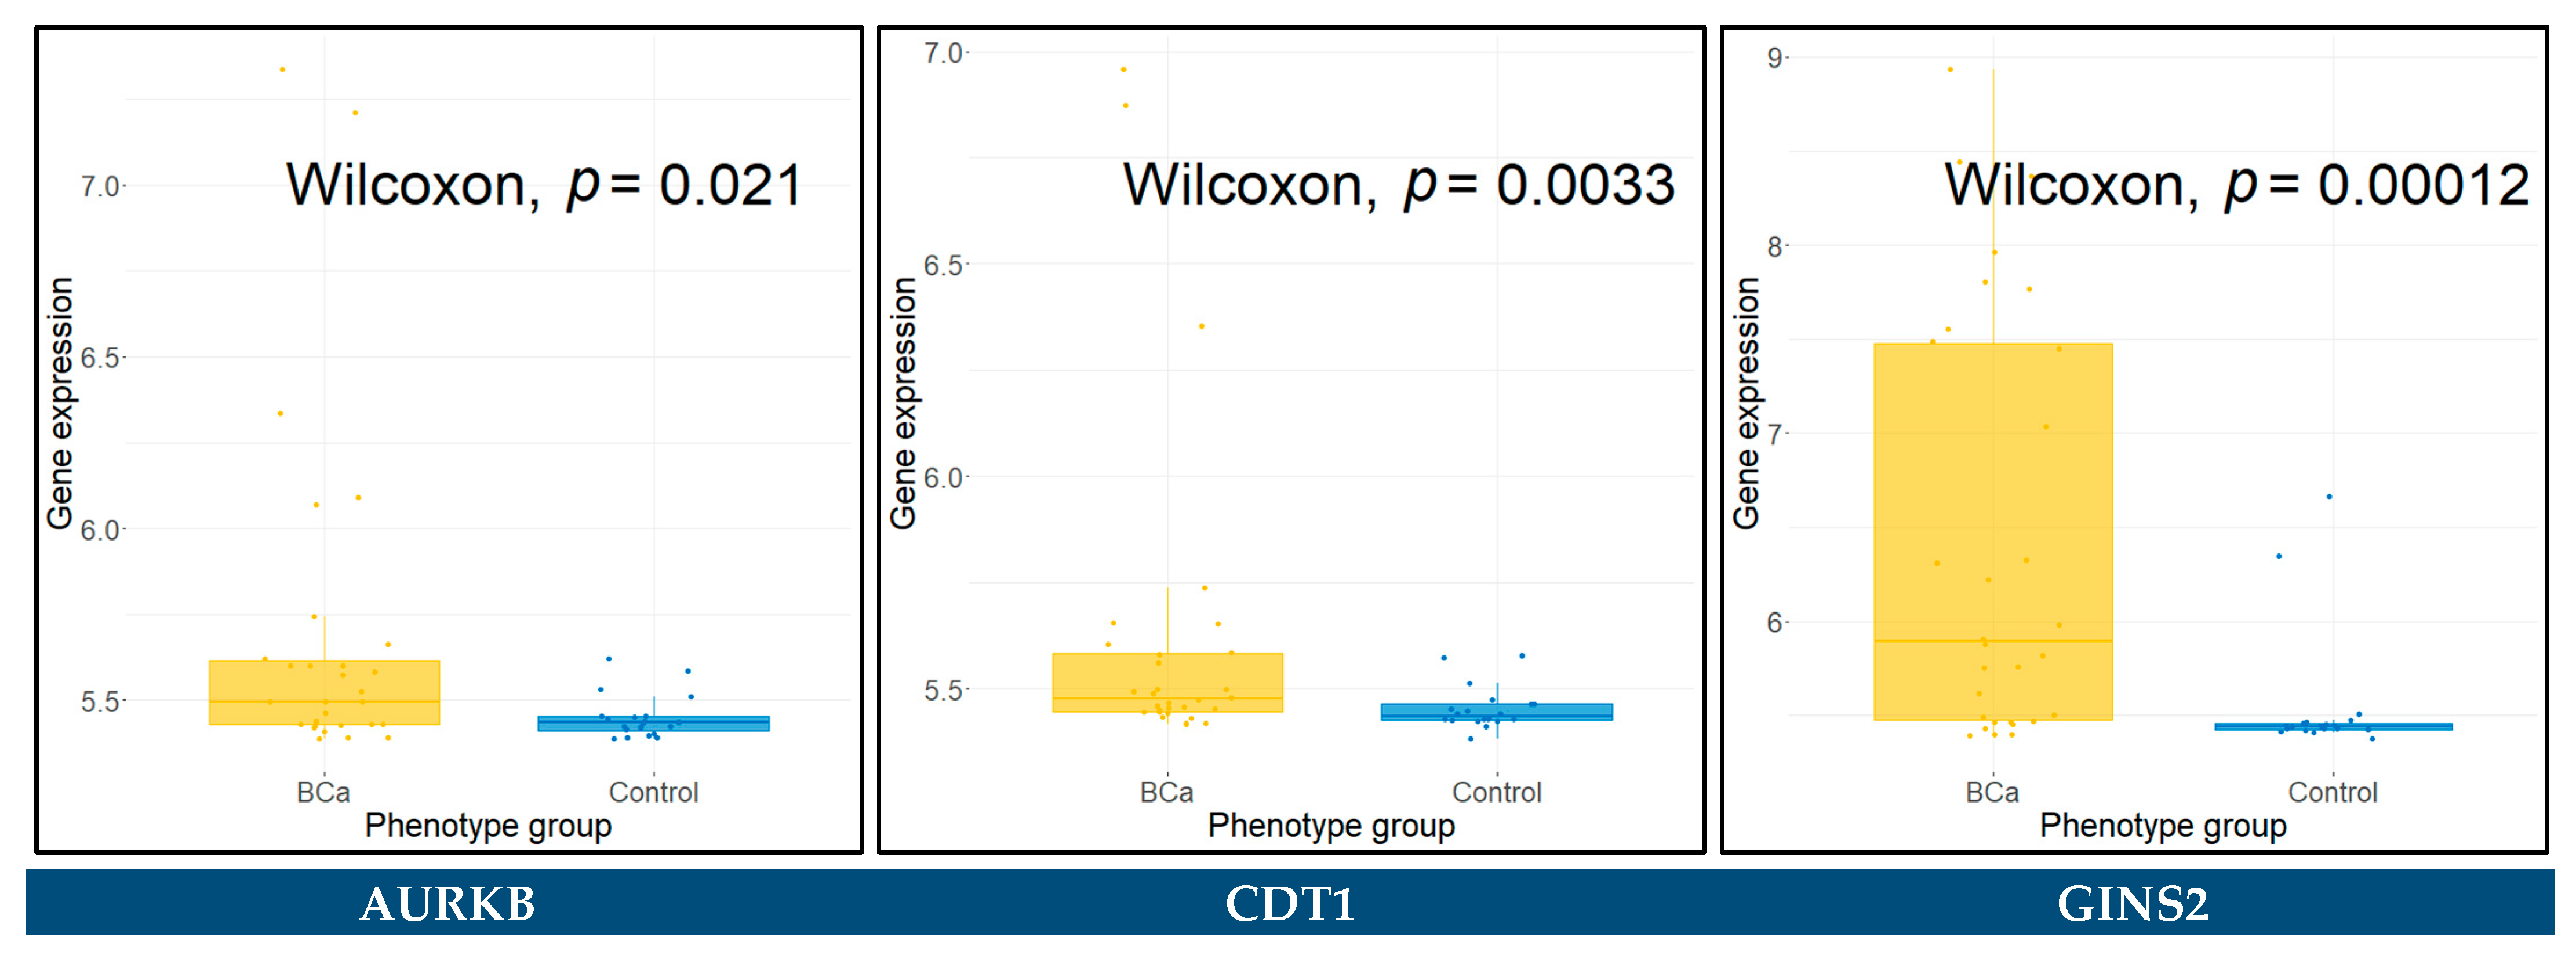
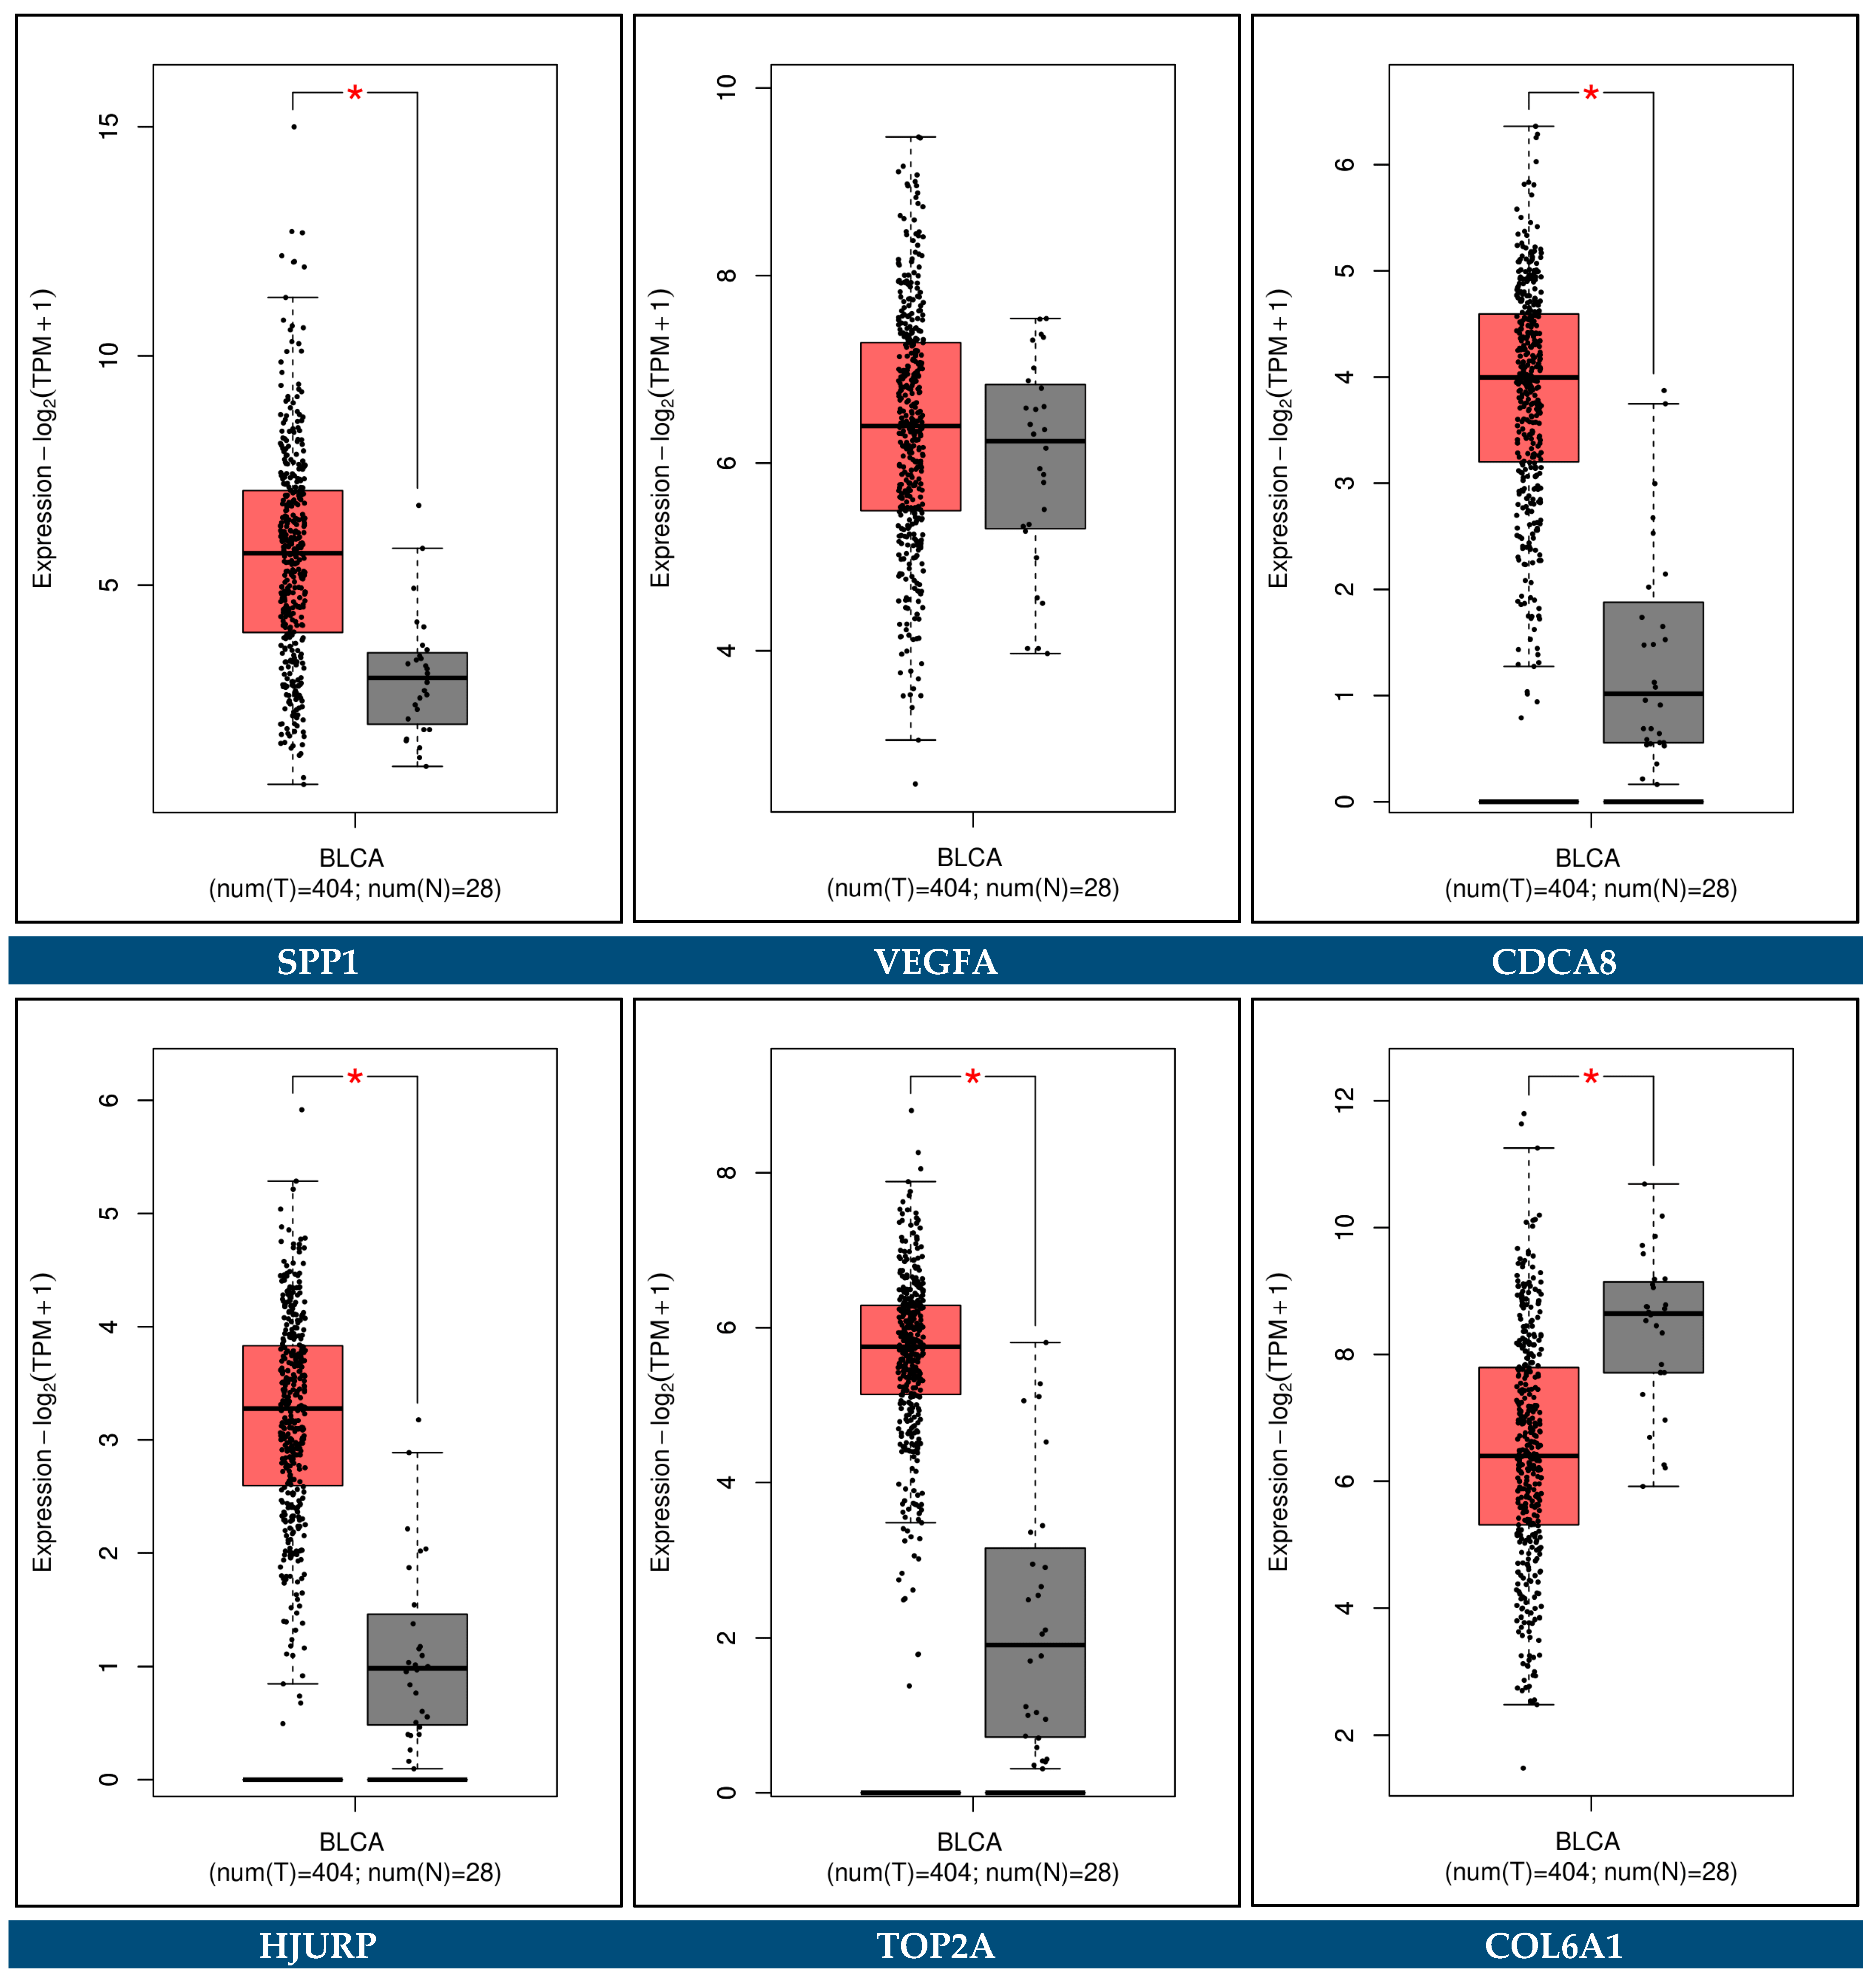
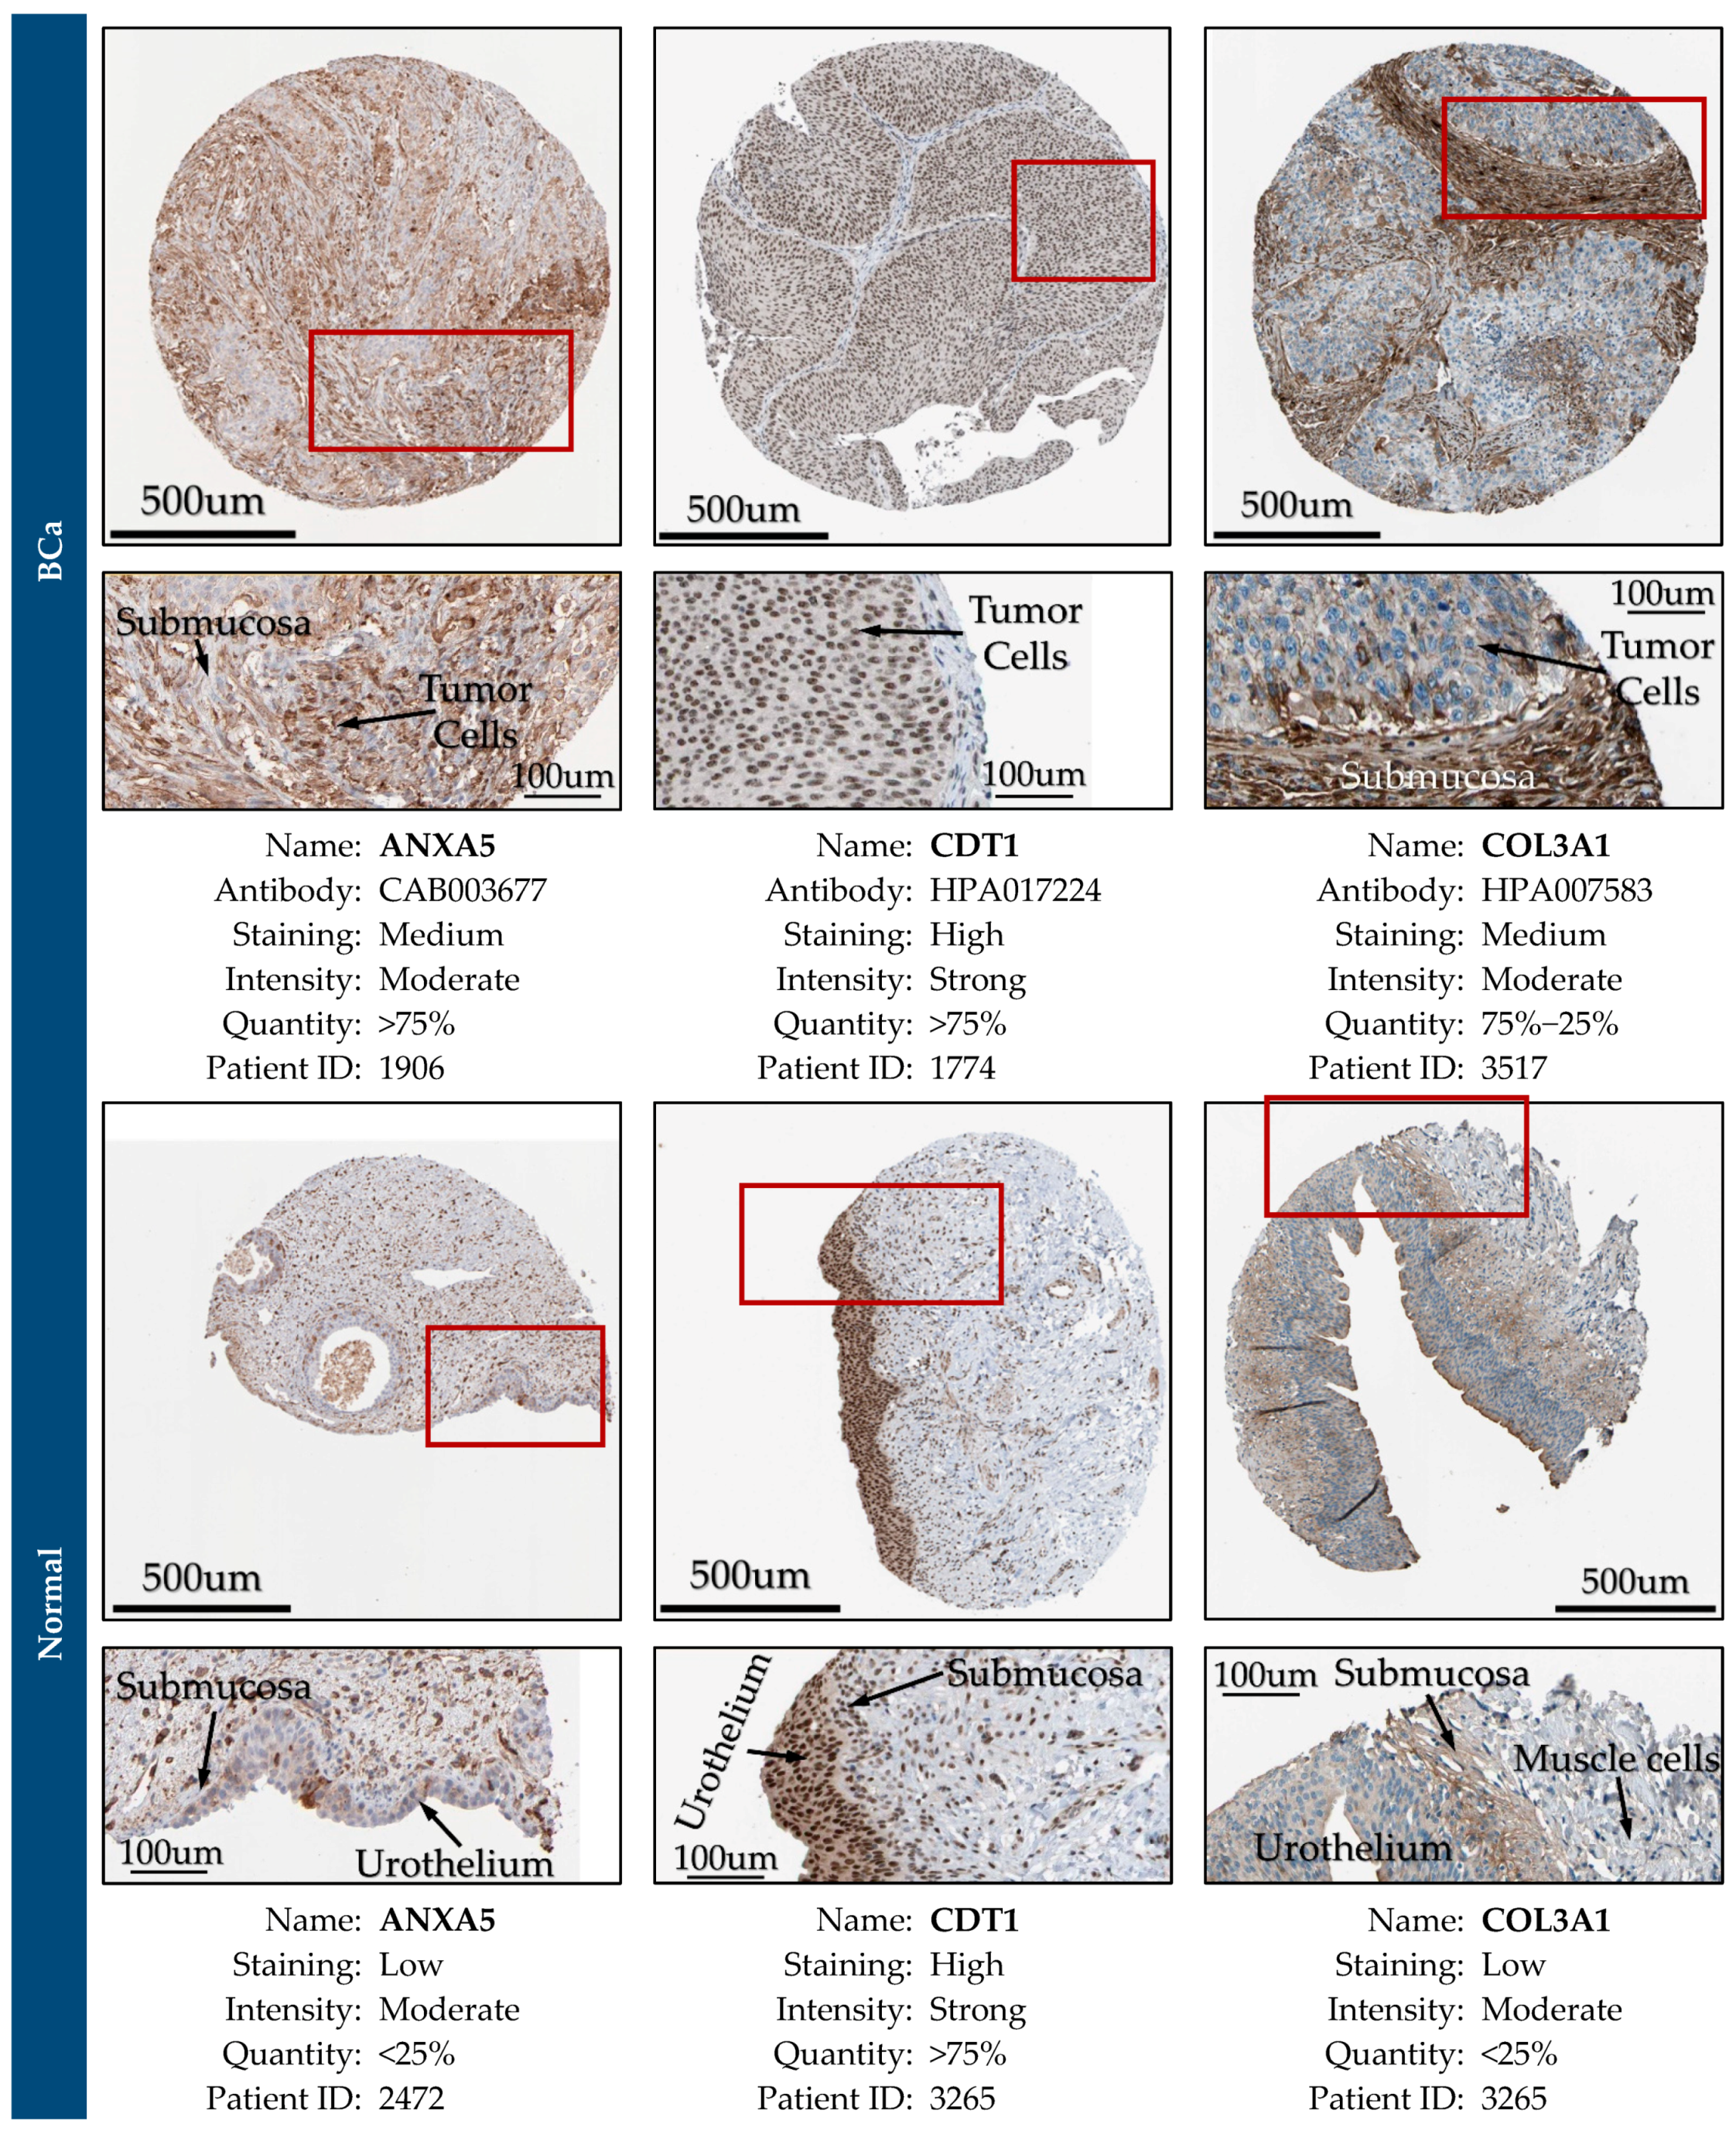
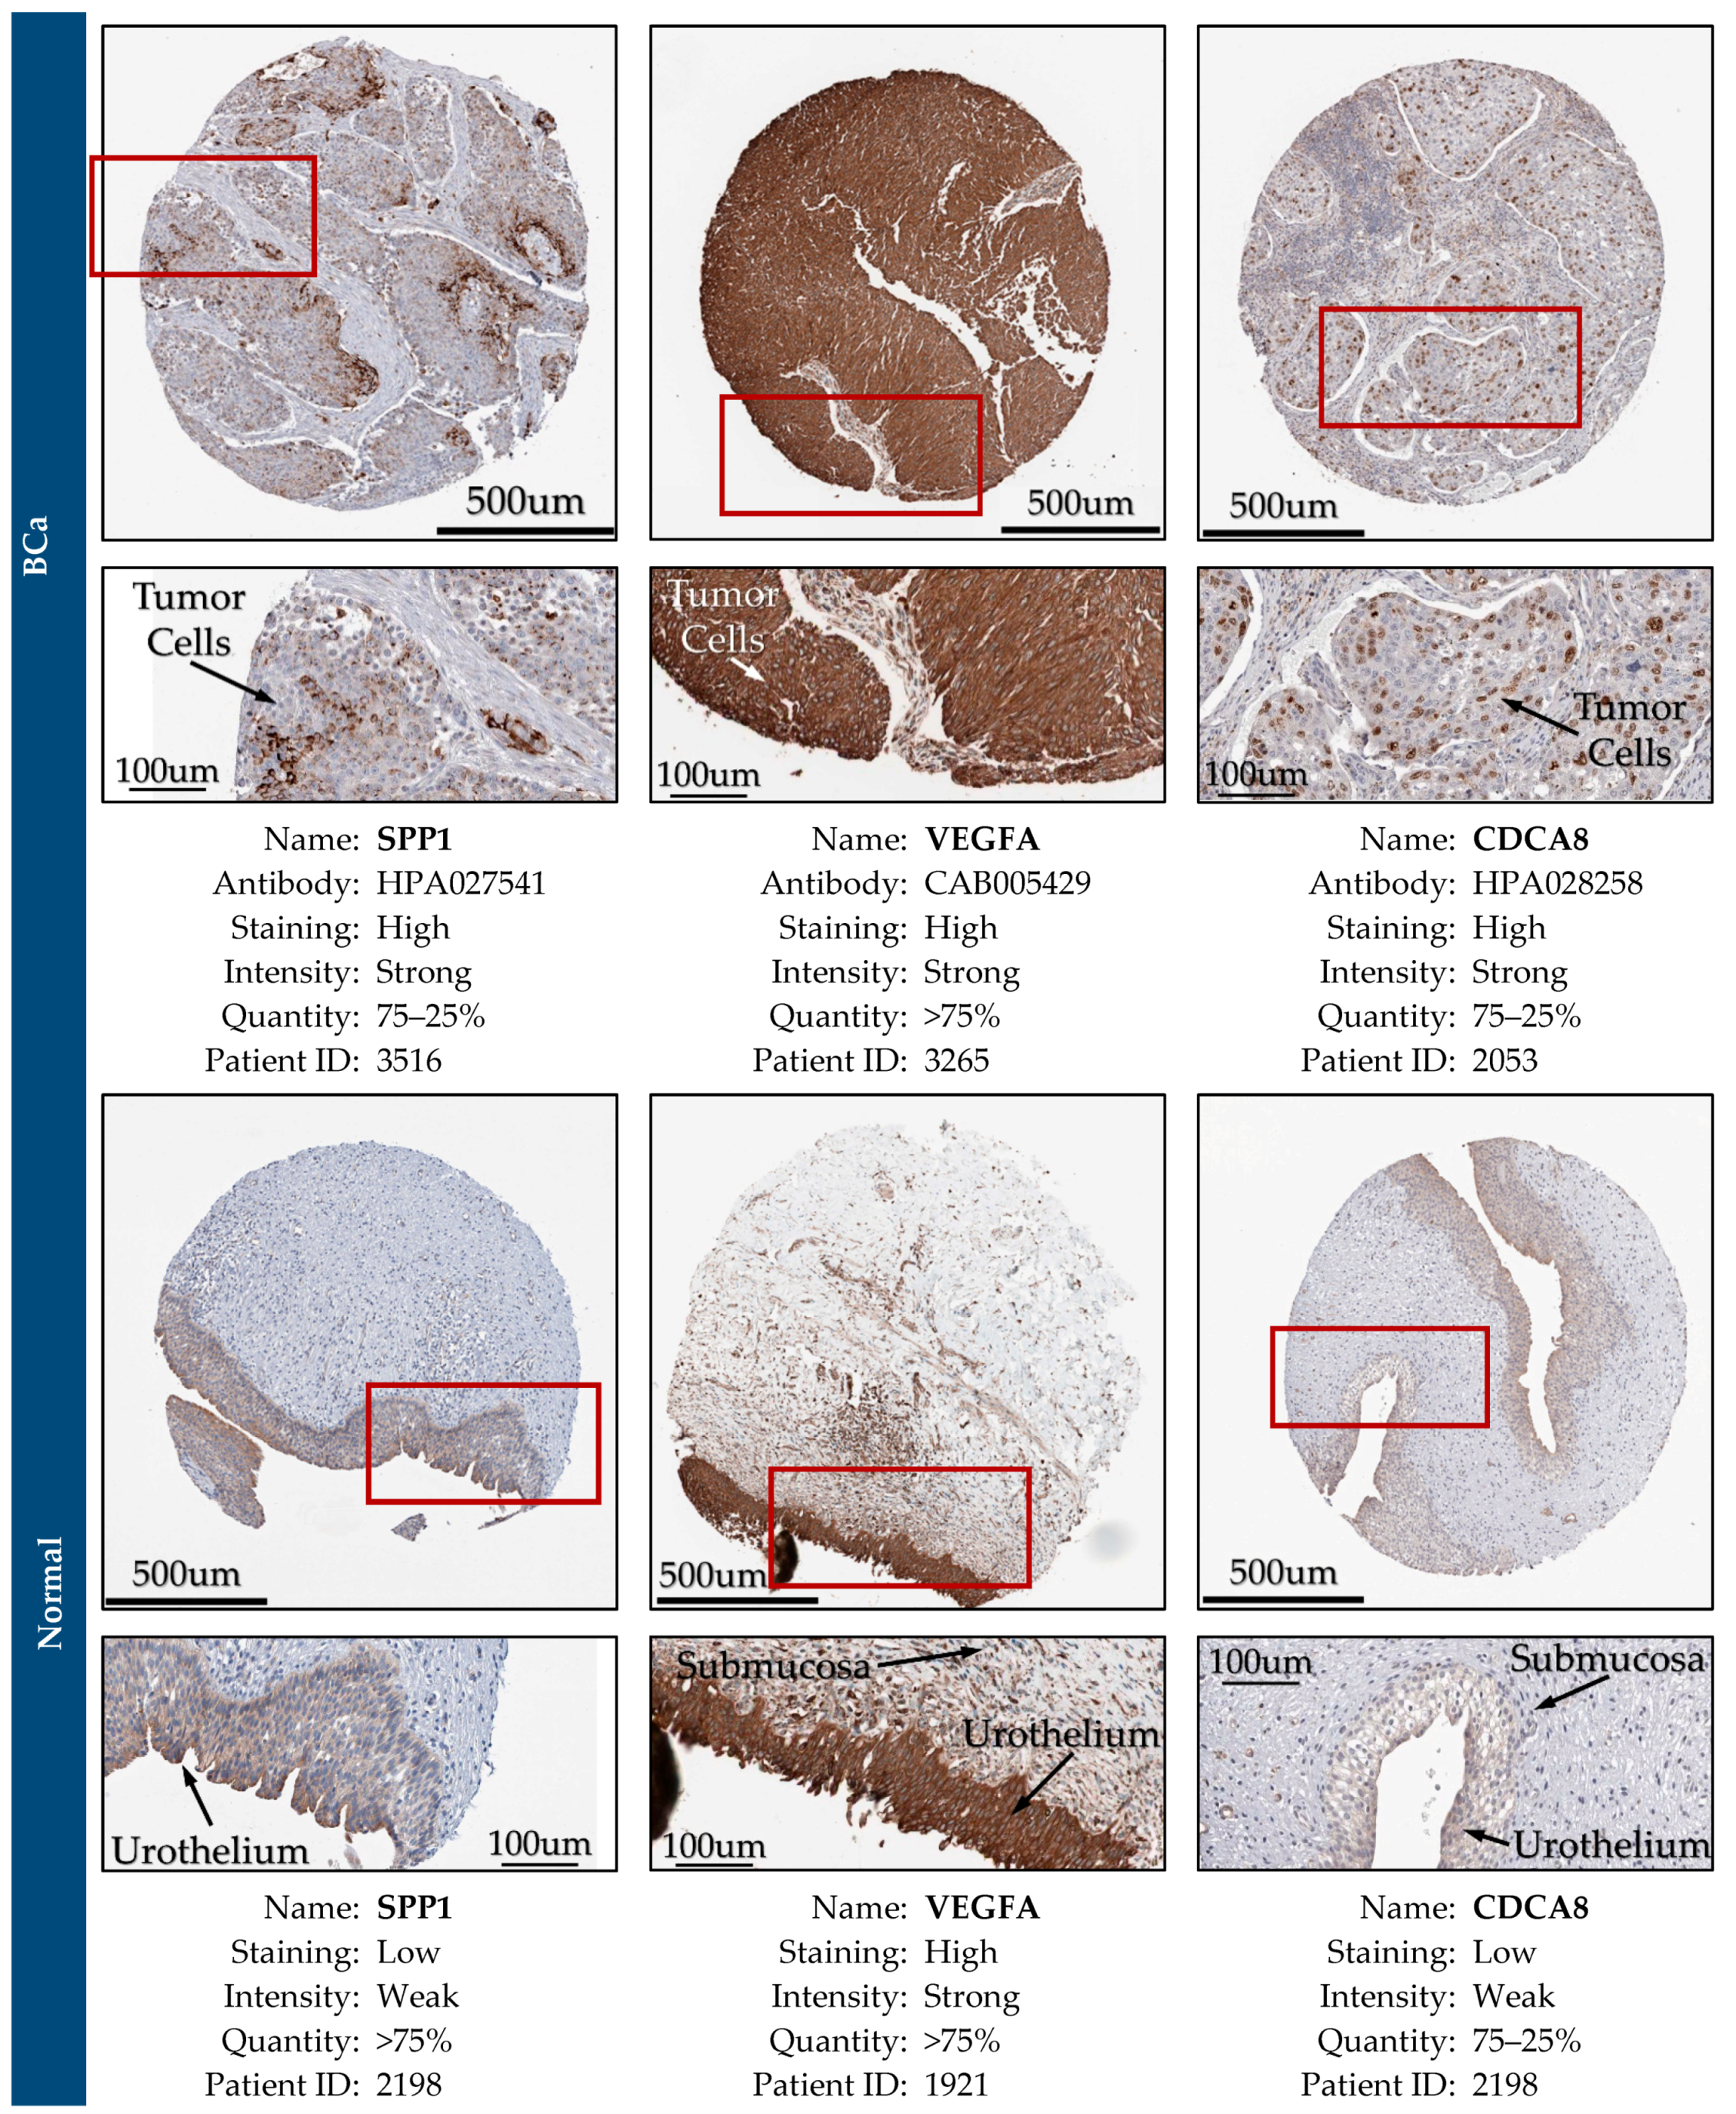
3.12. Expression Validation of Key Biomarkers and Immunohistochemistry
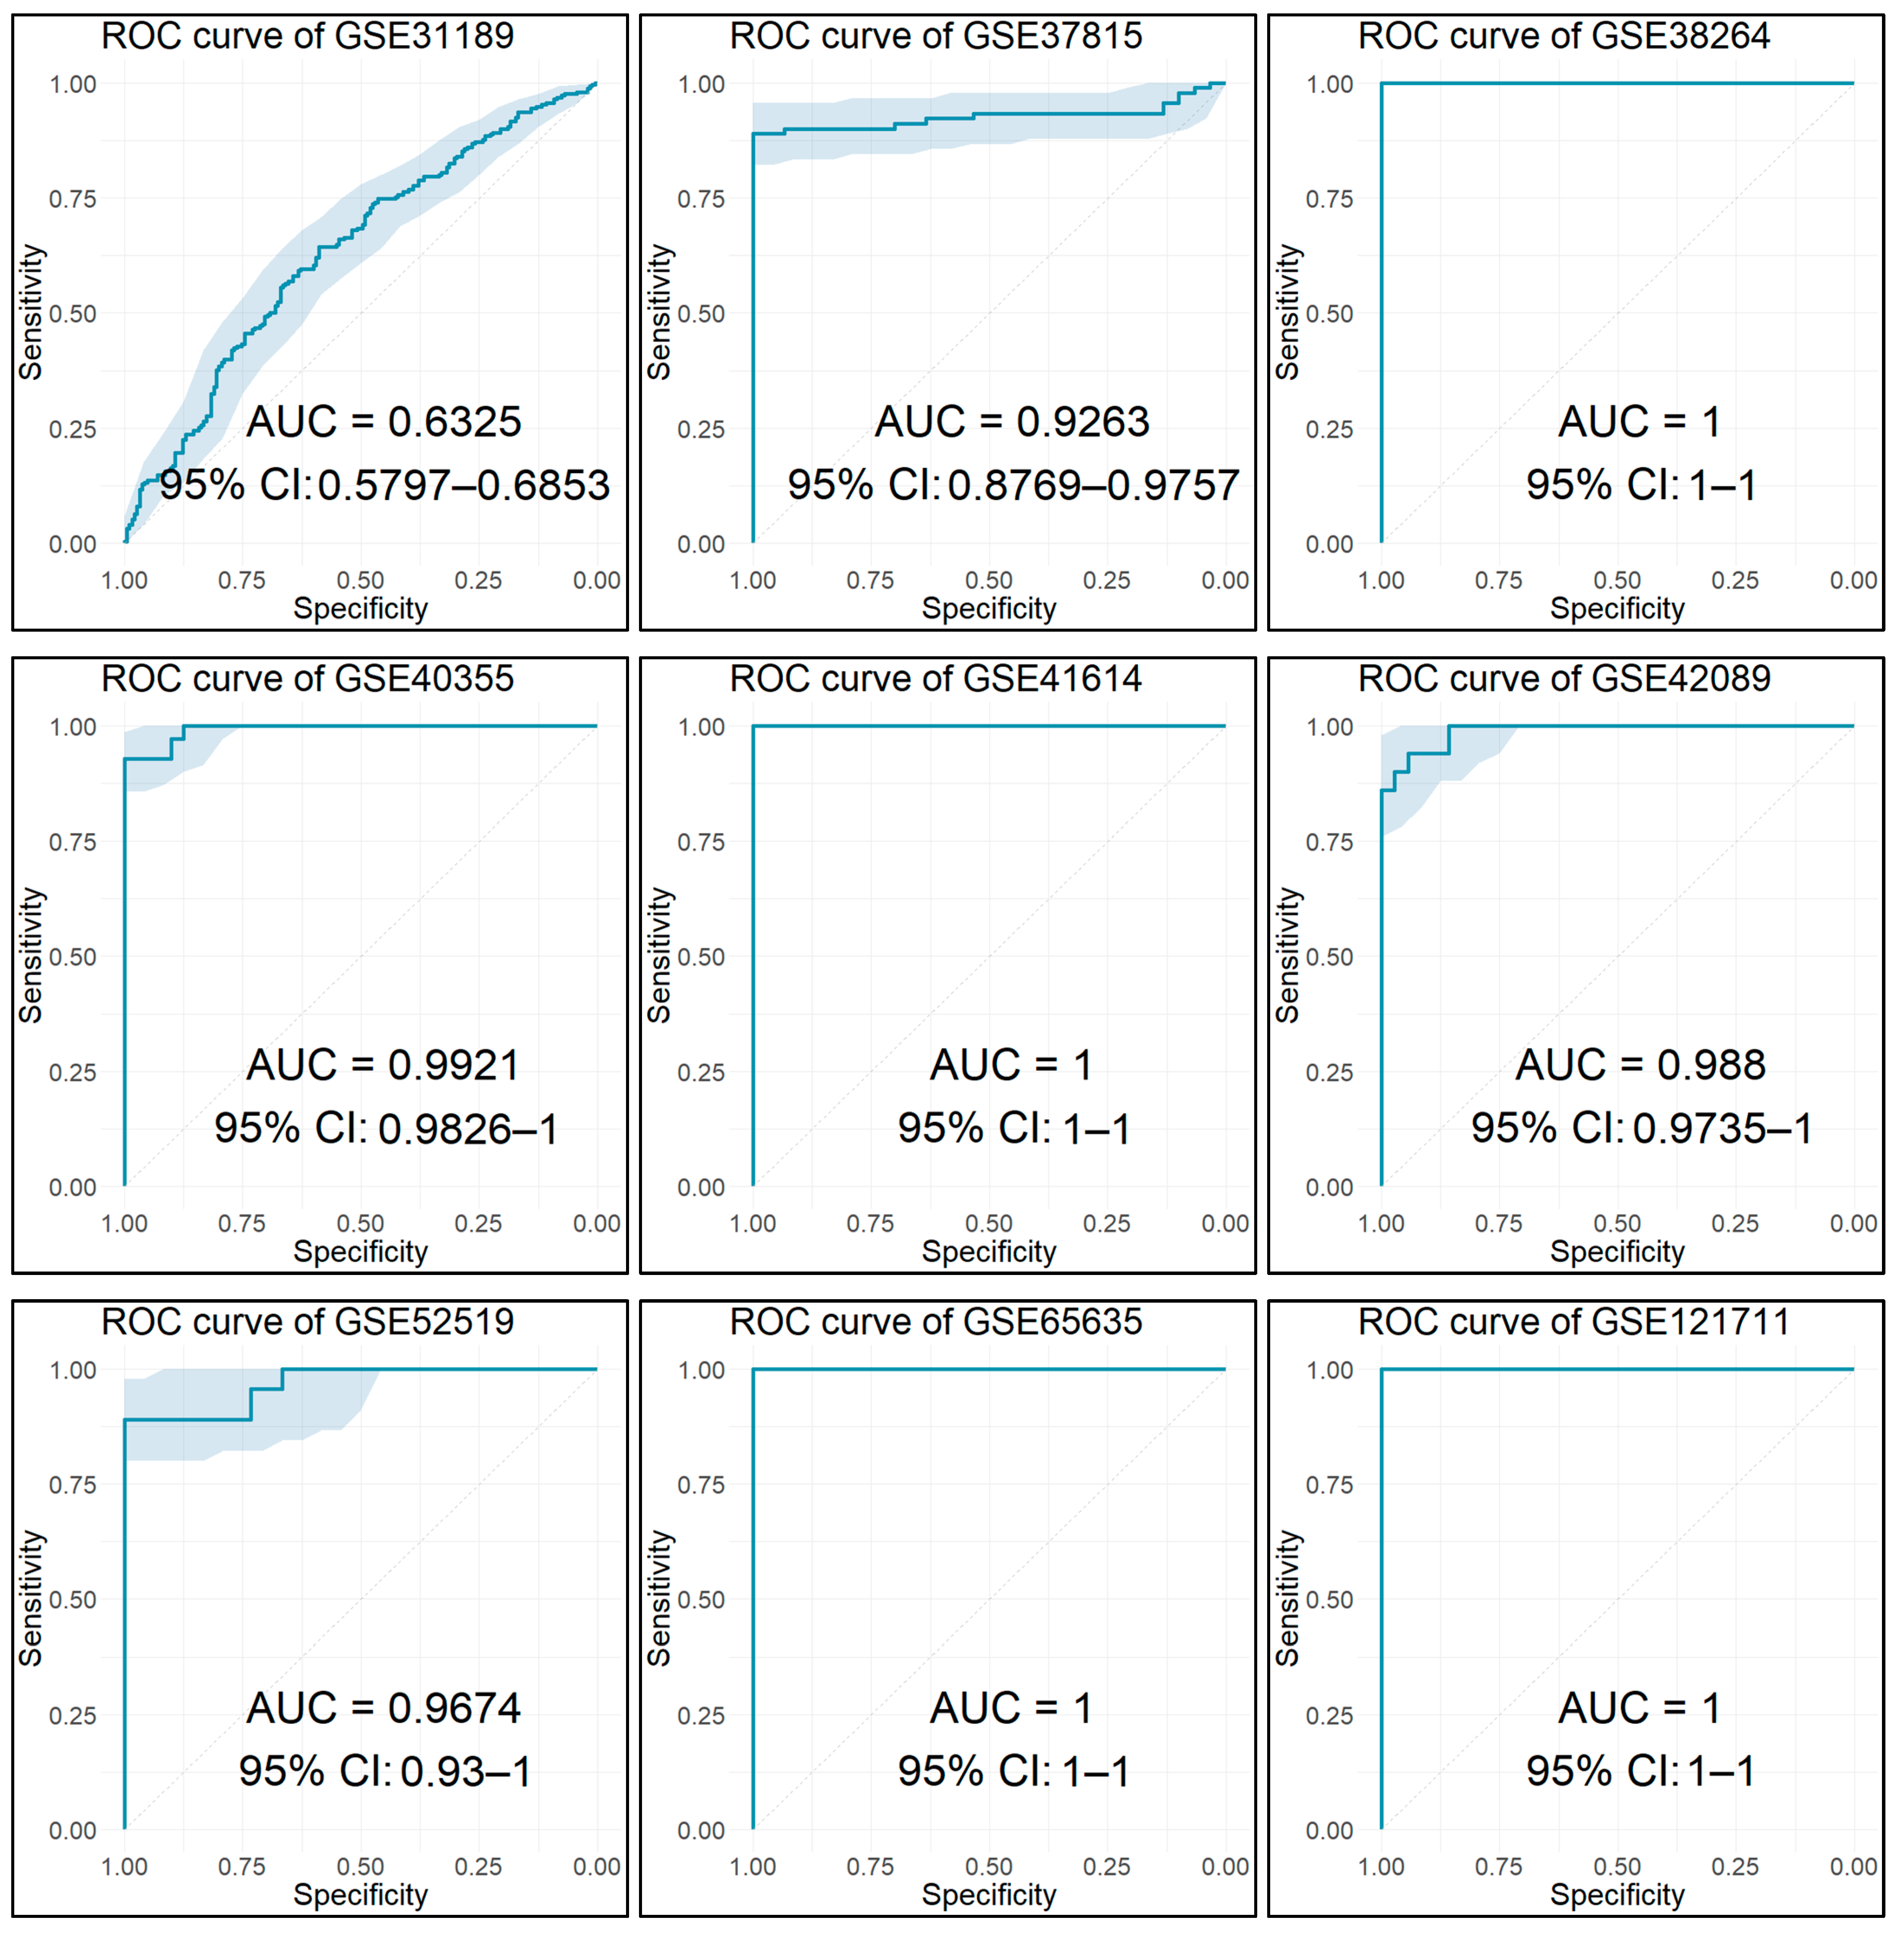
3.13. Diagnostic Performance of Key Biomarkers
4. Discussion
5. Conclusions
Supplementary Materials
Author Contributions
Funding
Institutional Review Board Statement
Informed Consent Statement
Data Availability Statement
Conflicts of Interest
References
- Pardo, J.C.; Ruiz de Porras, V.; Plaja, A.; Carrato, C.; Etxaniz, O.; Buisan, O.; Font, A. Moving towards Personalized Medicine in Muscle-Invasive Bladder Cancer: Where Are We Now and Where Are We Going? Int. J. Mol. Sci. 2020, 21, 6271. [Google Scholar] [CrossRef] [PubMed]
- Dobruch, J.; Oszczudłowski, M. Bladder Cancer: Current Challenges and Future Directions. Medicina 2021, 57, 749. [Google Scholar] [CrossRef] [PubMed]
- Lenis, A.T.; Lec, P.M.; Chamie, K. Bladder Cancer: A Review. JAMA 2020, 324, 1980–1991. [Google Scholar] [CrossRef] [PubMed]
- Lutz, C.T.; Livas, L.; Presnell, S.R.; Sexton, M.; Wang, P. Gender Differences in Urothelial Bladder Cancer: Effects of Natural Killer Lymphocyte Immunity. J. Clin. Med. 2021, 10, 5163. [Google Scholar] [CrossRef]
- American Cancer Society. Cancer Facts & Figures 2022; American Cancer Society: Atlanta, GA, USA, 2022. [Google Scholar]
- Minoli, M.; Kiener, M.; Thalmann, G.N.; Julio, D.M.K.; Seiler, R. Evolution of urothelial bladder cancer in the context of molecular classifications. Int. J. Mol. Sci. 2020, 21, 5670. [Google Scholar] [CrossRef]
- National Cancer Institute at the National Institutes of Health. Bladder and Other Urothelial Cancers Screening (PDQ®): Patient Version. In PDQ Cancer Information Summaries; National Cancer Institute: Bethesda, MD, USA, 2021. [Google Scholar]
- Petrella, G.; Ciufolini, G.; Vago, R.; Cicero, D.O. Urinary Metabolic Markers of Bladder Cancer: A Reflection of the Tumor or the Response of the Body? Metabolites 2021, 11, 756. [Google Scholar] [CrossRef]
- De Oliveira, M.C.; Caires, H.R.; Oliveira, M.J.; Fraga, A.; Vasconcelos, M.H.; Ribeiro, R. Urinary Biomarkers in Bladder Cancer: Where Do We Stand and Potential Role of Extracellular Vesicles. Cancers 2020, 12, 1400. [Google Scholar] [CrossRef]
- Rubio-briones, J.; Algaba, F.; Gallardo, E.; Marcos-rodríguez, J.A.; Climent, M.Á.; Caamaño, A.G.; Vicente, A.M.G.; Maroto, P.; Antolín, A.R.; Sanz, J.; et al. Recent Advances in the Management of Patients with Non-Muscle-Invasive Bladder Cancer Using a Multidisciplinary Approach: Practical Recommendations from the Spanish Oncology Genitourinary (SOGUG) Working Group. Cancers 2021, 13, 4762. [Google Scholar] [CrossRef]
- Oeyen, E.; Hoekx, L.; De Wachter, S.; Baldewijns, M.; Ameye, F.; Mertens, I. Bladder Cancer Diagnosis and Follow-Up: The Current Status and Possible Role of Extracellular Vesicles. Int. J. Mol. Sci. 2019, 20, 821. [Google Scholar] [CrossRef]
- Ng, K.; Stenzl, A.; Sharma, A.; Vasdev, N. Urinary biomarkers in bladder cancer: A review of the current landscape and future directions. Urol. Oncol. Semin. Orig. Investig. 2021, 39, 41–51. [Google Scholar] [CrossRef]
- Tran, L.; Xiao, J.F.; Agarwal, N.; Duex, J.E.; Theodorescu, D. Advances in bladder cancer biology and therapy. Nat. Rev. Cancer 2020, 21, 104–121. [Google Scholar] [CrossRef] [PubMed]
- Inamura, K. Bladder Cancer: New Insights into Its Molecular Pathology. Cancers 2018, 10, 100. [Google Scholar] [CrossRef] [PubMed]
- Lourenço, C.; Constâncio, V.; Henrique, R.; Carvalho, Â.; Jerónimo, C. Urinary Extracellular Vesicles as Potential Biomarkers for Urologic Cancers: An Overview of Current Methods and Advances. Cancers 2021, 13, 1529. [Google Scholar] [CrossRef] [PubMed]
- Toro-Domínguez, D.; Villatoro-García, J.A.; Martorell-Marugán, J.; Román-Montoya, Y.; Alarcón-Riquelme, M.E.; Carmona-Sáez, P. A survey of gene expression meta-analysis: Methods and applications. Brief. Bioinform. 2020, 22, 1694–1705. [Google Scholar] [CrossRef]
- Kontou, P.I.; Pavlopoulou, A.; Bagos, P.G. Methods of Analysis and Meta-Analysis for Identifying Differentially Expressed Genes. In Genetic Epidemiology: Methods and Protocols, Methods in Molecular Biology; Evangelou, E., Ed.; Springer: Berlin/Heidelberg, Germany, 2018; Volume 1793, pp. 183–210. [Google Scholar]
- Sweeney, T.E.; Haynes, W.A.; Vallania, F.; Ioannidis, J.P.; Khatri, P. Methods to increase reproducibility in differential gene expression via meta-analysis. Nucleic Acids Res. 2017, 45, e1. [Google Scholar] [CrossRef]
- Zeeshan Hameed, B.M.; Aiswarya Dhavileswarapu, V.L.S.; Raza, S.Z.; Karimi, H.; Khanuja, H.S.; Shetty, D.K.; Ibrahim, S.; Shah, M.J.; Naik, N.; Paul, R.; et al. Artificial Intelligence and Its Impact on Urological Diseases and Management: A Comprehensive Review of the Literature. J. Clin. Med. 2021, 10, 1864. [Google Scholar] [CrossRef]
- Barrett, T.; Suzek, T.; Troup, D.; Wilhite, S.; Ngau, W.-C.; Ledoux, P.; Rudnev, D.; Lash, A.; Fujibuchi, W.; Edgar, R. NCBI GEO: Mining millions of expression profiles—Database and tools. Nucleic Acids Res. 2005, 33, D562–D566. [Google Scholar] [CrossRef]
- Page, M.J.; McKenzie, J.E.; Bossuyt, P.M.; Boutron, I.; Hoffmann, T.C.; Mulrow, C.D.; Shamseer, L.; Tetzlaff, J.M.; Akl, E.A.; Brennan, S.E.; et al. The PRISMA 2020 statement: An updated guideline for reporting systematic reviews. BMJ 2021, 372, n71. [Google Scholar] [CrossRef]
- Bammler, T.; Beyer, R.P.; Bhattacharya, S.; Boorman, G.A.; Boyles, A.; Bradford, B.U.; Bumgarner, R.E.; Bushel, P.R.; Chaturvedi, K.; Choi, D.; et al. Standardizing global gene expression analysis between laboratories and across platforms. Nat. Methods 2005, 2, 351–356. [Google Scholar] [CrossRef]
- Walsh, C.; Hu, P.; Batt, J.; Santos, C. Microarray Meta-Analysis and Cross-Platform Normalization: Integrative Genomics for Robust Biomarker Discovery. Microarrays 2015, 4, 389–406. [Google Scholar] [CrossRef]
- Gautier, L.; Cope, L.; Bolstad, B.M.; Irizarry, R.A. Affy—Analysis of Affymetrix GeneChip data at the probe level. Bioinformatics 2004, 20, 307–315. [Google Scholar] [CrossRef] [PubMed]
- Carvalho, B.S.; Irizarry, R.A. A framework for oligonucleotide microarray preprocessing. Bioinformatics 2010, 26, 2363–2367. [Google Scholar] [CrossRef] [PubMed]
- Irizarry, R.A.; Bolstad, B.M.; Collin, F.; Cope, L.M.; Hobbs, B.; Speed, T.P. Summaries of Affymetrix GeneChip probe level data. Nucleic Acids Res. 2003, 31, e15. [Google Scholar] [CrossRef] [PubMed]
- Irizarry, R.A.; Warren, D.; Spencer, F.; Kim, I.F.; Biswal, S.; Frank, B.C.; Gabrielson, E.; Garcia, J.G.N.; Geoghegan, J.; Germino, G.; et al. Multiple-laboratory comparison of microarray platforms. Nat. Methods 2005, 2, 345–350. [Google Scholar] [CrossRef] [PubMed]
- Ritchie, M.E.; Phipson, B.; Wu, D.; Hu, Y.; Law, C.W.; Shi, W.; Smyth, G.K. limma powers differential expression analyses for RNA-sequencing and microarray studies. Nucleic Acids Res. 2015, 43, e47. [Google Scholar] [CrossRef]
- Calza, S.; Pawitan, Y. Normalization of Gene-Expression Microarray Data. Methods Mol. Biol. 2010, 673, 37–52. [Google Scholar] [CrossRef]
- Kauffmann, A.; Gentleman, R.; Huber, W. arrayQualityMetrics--a bioconductor package for quality assessment of microarray data. Bioinformatics 2009, 25, 415–416. [Google Scholar] [CrossRef]
- Kauffmann, A.; Huber, W. Microarray data quality control improves the detection of differentially expressed genes. Genomics 2010, 95, 138–142. [Google Scholar] [CrossRef]
- Tweedie, S.; Braschi, B.; Gray, K.; Jones, T.E.M.; Seal, R.L.; Yates, B.; Bruford, E.A. Genenames.org: The HGNC and VGNC resources in 2021. Nucleic Acids Res. 2021, 49, D939–D946. [Google Scholar] [CrossRef]
- Braschi, B.; Seal, R.L.; Tweedie, S.; Jones, T.E.M.; Bruford, E.A. The risks of using unapproved gene symbols. Am. J. Hum. Genet. 2021, 108, 1813–1816. [Google Scholar] [CrossRef]
- Aken, B.L.; Ayling, S.; Barrell, D.; Clarke, L.; Curwen, V.; Fairley, S.; Fernandez Banet, J.; Billis, K.; García Girón, C.; Hourlier, T.; et al. The Ensembl gene annotation system. Database: J. Biol. Databases Curation 2016, 2016, baw093. [Google Scholar] [CrossRef] [PubMed]
- Carlson, M.R.J.; Pagès, H.; Arora, S.; Obenchain, V.; Morgan, M. Genomic Annotation Resources in R/Bioconductor. Methods Mol. Biol. 2016, 1418, 67–90. [Google Scholar] [CrossRef] [PubMed]
- Ballester, B.; Johnson, N.; Proctor, G.; Flicek, P. Consistent annotation of gene expression arrays. BMC Genom. 2010, 11, 1–14. [Google Scholar] [CrossRef] [PubMed]
- Goh, B.W.W.; Wang, W.; Wong, L. Why Batch Effects Matter in Omics Data, and How to Avoid Them. Trends Biotechnol. 2017, 35, 498–507. [Google Scholar] [CrossRef] [PubMed]
- Lazar, C.; Meganck, S.; Taminau, J.; Steenhoff, D.; Coletta, A.; Molter, C.; Weiss-Solís, D.Y.; Duque, R.; Bersini, H.; Nowé, A. Batch effect removal methods for microarray gene expression data integration: A survey. Brief. Bioinform. 2013, 14, 469–490. [Google Scholar] [CrossRef] [PubMed]
- Cheadle, C.; Vawter, M.P.; Freed, W.J.; Becker, K.G. Analysis of microarray data using Z score transformation. J. Mol. Diagn. 2003, 5, 73–81. [Google Scholar] [CrossRef]
- Yasrebi, H. Comparative study of joint analysis of microarray gene expression data in survival prediction and risk assessment of breast cancer patients. Brief. Bioinform. 2016, 17, 771–785. [Google Scholar] [CrossRef]
- Zhou, B.; Guo, R. Integrative Analysis of Genomic and Clinical Data Reveals Intrinsic Characteristics of Bladder Urothelial Carcinoma Progression. Genes 2019, 10, 464. [Google Scholar] [CrossRef]
- Balivada, S.; Ganta, C.K.; Zhang, Y.; Pawar, H.N.; Ortiz, R.J.; Becker, K.G.; Khan, A.M.; Kenney, M.J. Microarray analysis of aging-associated immune system alterations in the rostral ventrolateral medulla of F344 rats. Physiol. Genom. 2017, 49, 400–415. [Google Scholar] [CrossRef]
- Nygaard, V.; Rødland, E.A.; Hovig, E. Methods that remove batch effects while retaining group differences may lead to exaggerated confidence in downstream analyses. Biostatistics 2016, 17, 29–39. [Google Scholar] [CrossRef]
- Dalman, M.R.; Deeter, A.; Nimishakavi, G.; Duan, Z.H. Fold change and p-value cutoffs significantly alter microarray interpretations. BMC Bioinform. 2012, 13 (Suppl. S2), 1–4. [Google Scholar] [CrossRef] [PubMed]
- Statnikov, A.; Wang, L.; Aliferis, C.F. A comprehensive comparison of random forests and support vector machines for microarray-based cancer classification. BMC Bioinform. 2008, 9, 1–10. [Google Scholar] [CrossRef] [PubMed]
- Wu, T.; Hu, E.; Xu, S.; Chen, M.; Guo, P.; Dai, Z.; Feng, T.; Zhou, L.; Tang, W.; Zhan, L.; et al. clusterProfiler 4.0: A universal enrichment tool for interpreting omics data. Innovation 2021, 2, 100141. [Google Scholar] [CrossRef] [PubMed]
- Carbon, S.; Douglass, E.; Dunn, N.; Good, B.; Harris, N.L.; Lewis, S.E.; Mungall, C.J.; Basu, S.; Chisholm, R.L.; Dodson, R.J.; et al. The Gene Ontology Resource: 20 years and still GOing strong. Nucleic Acids Res. 2019, 47, D330–D338. [Google Scholar] [CrossRef]
- Wang, J.Z.; Du, Z.; Payattakool, R.; Yu, P.S.; Chen, C.F. A new method to measure the semantic similarity of GO terms. Bioinformatics 2007, 23, 1274–1281. [Google Scholar] [CrossRef]
- Kanehisa, M.; Furumichi, M.; Tanabe, M.; Sato, Y.; Morishima, K. KEGG: New perspectives on genomes, pathways, diseases and drugs. Nucleic Acids Res. 2017, 45, D353–D361. [Google Scholar] [CrossRef]
- Jassal, B.; Matthews, L.; Viteri, G.; Gong, C.; Lorente, P.; Fabregat, A.; Sidiropoulos, K.; Cook, J.; Gillespie, M.; Haw, R.; et al. The reactome pathway knowledgebase. Nucleic Acids Res. 2020, 48, D498–D503. [Google Scholar] [CrossRef]
- Yu, G.; He, Q.Y. ReactomePA: An R/Bioconductor package for reactome pathway analysis and visualization. Mol. Biosyst. 2016, 12, 477–479. [Google Scholar] [CrossRef]
- Merico, D.; Isserlin, R.; Stueker, O.; Emili, A.; Bader, G.D. Enrichment map: A network-based method for gene-set enrichment visualization and interpretation. PLoS ONE 2010, 5, e13984. [Google Scholar] [CrossRef]
- Schriml, L.M.; Mitraka, E.; Munro, J.; Tauber, B.; Schor, M.; Nickle, L.; Felix, V.; Jeng, L.; Bearer, C.; Lichenstein, R.; et al. Human Disease Ontology 2018 update: Classification, content and workflow expansion. Nucleic Acids Res. 2019, 47, D955–D962. [Google Scholar] [CrossRef]
- Yu, G.; Wang, L.G.; Yan, G.R.; He, Q.Y. DOSE: An R/Bioconductor package for disease ontology semantic and enrichment analysis. Bioinformatics 2015, 31, 608–609. [Google Scholar] [CrossRef] [PubMed]
- Szklarczyk, D.; Gable, A.L.; Lyon, D.; Junge, A.; Wyder, S.; Huerta-Cepas, J.; Simonovic, M.; Doncheva, N.T.; Morris, J.H.; Bork, P.; et al. STRING v11: Protein–protein association networks with increased coverage, supporting functional discovery in genome-wide experimental datasets. Nucleic Acids Res. 2019, 47, D607–D613. [Google Scholar] [CrossRef] [PubMed]
- Shannon, P.; Markiel, A.; Ozier, O.; Baliga, N.S.; Wang, J.T.; Ramage, D.; Amin, N.; Schwikowski, B.; Ideker, T. Cytoscape: A Software Environment for Integrated Models of Biomolecular Interaction Networks. Genome Res. 2003, 13, 2498–2504. [Google Scholar] [CrossRef] [PubMed]
- Chin, C.H.; Chen, S.H.; Wu, H.H.; Ho, C.W.; Ko, M.T.; Lin, C.Y. cytoHubba: Identifying hub objects and sub-networks from complex interactome. BMC Syst. Biol. 2014, 8, S11. [Google Scholar] [CrossRef]
- Bader, G.D.; Hogue, C.W.V. An automated method for finding molecular complexes in large protein interaction networks. BMC Bioinform. 2003, 4, 2. [Google Scholar] [CrossRef] [PubMed]
- Zhang, B.; Horvath, S. A general framework for weighted gene co-expression network analysis. Stat. Appl. Genet. Mol. Biol. 2005, 4, Article17. [Google Scholar] [CrossRef] [PubMed]
- Langfelder, P.; Horvath, S. WGCNA: An R package for weighted correlation network analysis. BMC Bioinform. 2008, 9, 559. [Google Scholar] [CrossRef]
- Leek, J.T.; Johnson, W.E.; Parker, H.S.; Jaffe, A.E.; Storey, J.D. The sva package for removing batch effects and other unwanted variation in high-throughput experiments. Bioinformatics 2012, 28, 882. [Google Scholar] [CrossRef]
- Perez, A.; Loizaga, A.; Arceo, R.; Lacasa, I.; Rabade, A.; Zorroza, K.; Mosen-Ansorena, D.; Gonzalez, E.; Aransay, A.M.; Falcon-Perez, J.M.; et al. A Pilot Study on the Potential of RNA-Associated to Urinary Vesicles as a Suitable Non-Invasive Source for Diagnostic Purposes in Bladder Cancer. Cancers 2014, 6, 179–192. [Google Scholar] [CrossRef]
- Troyanskaya, O.G.; Garber, M.E.; Brown, P.O.; Botstein, D.; Altman, R.B. Nonparametric methods for identifying differentially expressed genes in microarray data. Bioinformatics 2002, 18, 1454–1461. [Google Scholar] [CrossRef]
- Lee, J.-S.; Leem, S.-H.; Lee, S.-Y.; Kim, S.-C.; Park, E.-S.; Kim, S.-B.; Kim, S.-K.; Kim, Y.-J.; Kim, W.-J.; Chu, I.-S. Expression signature of E2F1 and its associated genes predict superficial to invasive progression of bladder tumors. J. Clin. Oncol. Off. J. Am. Soc. Clin. Oncol. 2010, 28, 2660–2667. [Google Scholar] [CrossRef] [PubMed]
- Therneau, T.M.; Grambsch, P.M. Modeling Survival Data: Extending the Cox Model, 1st ed.; Springer: New York, NY, USA, 2000. [Google Scholar]
- Friedman, J.; Hastie, T.; Tibshirani, R. Regularization Paths for Generalized Linear Models via Coordinate Descent. J. Stat. Softw. 2010, 33, 1. [Google Scholar] [CrossRef] [PubMed]
- Heagerty, P.J.; Lumley, T.; Pepe, M.S. Time-dependent ROC curves for censored survival data and a diagnostic marker. Biometrics 2000, 56, 337–344. [Google Scholar] [CrossRef] [PubMed]
- Sachs, M.C. plotROC: A Tool for Plotting ROC Curves. J. Stat. Softw. 2017, 79, 1–19. [Google Scholar] [CrossRef]
- Sjödahl, G.; Lauss, M.; Lövgren, K.; Chebil, G.; Gudjonsson, S.; Veerla, S.; Patschan, O.; Aine, M.; Fernö, M.; Ringnér, M.; et al. A molecular taxonomy for urothelial carcinoma. Clin. Cancer Res. 2012, 18, 3377–3386. [Google Scholar] [CrossRef]
- Lindgren, D.; Sjödahl, G.; Lauss, M.; Staaf, J.; Chebil, G.; Lövgren, K.; Gudjonsson, S.; Liedberg, F.; Patschan, O.; Månsson, W.; et al. Integrated Genomic and Gene Expression Profiling Identifies Two Major Genomic Circuits in Urothelial Carcinoma. PLoS ONE 2012, 7, e38863. [Google Scholar] [CrossRef]
- Tang, Z.; Kang, B.; Li, C.; Chen, T.; Zhang, Z. GEPIA2: An enhanced web server for large-scale expression profiling and interactive analysis. Nucleic Acids Res. 2019, 47, W556–W560. [Google Scholar] [CrossRef]
- Tomczak, K.; Czerwińska, P.; Wiznerowicz, M. The Cancer Genome Atlas (TCGA): An immeasurable source of knowledge. Contemp. Oncol. 2015, 19, A68–A77. [Google Scholar] [CrossRef]
- Lonsdale, J.; Thomas, J.; Salvatore, M.; Phillips, R.; Lo, E.; Shad, S.; Hasz, R.; Walters, G.; Garcia, F.; Young, N.; et al. The Genotype-Tissue Expression (GTEx) project. Nat. Genet. 2013, 45, 580–585. [Google Scholar] [CrossRef]
- Iacovino, M.L.; Miceli, C.C.; De Felice, M.; Barone, B.; Pompella, L.; Chiancone, F.; Di Zazzo, E.; Tirino, G.; Della Corte, C.M.; Imbimbo, C.; et al. Novel Therapeutic Opportunities in Neoadjuvant Setting in Urothelial Cancers: A New Horizon Opened by Molecular Classification and Immune Checkpoint Inhibitors. Int. J. Mol. Sci. 2022, 23, 1133. [Google Scholar] [CrossRef]
- Sjödahl, G.; Abrahamsson, J.; Holmsten, K.; Bernardo, C.; Chebil, G.; Eriksson, P.; Johansson, I.; Kollberg, P.; Lindh, C.; Lövgren, K.; et al. Different Responses to Neoadjuvant Chemotherapy in Urothelial Carcinoma Molecular Subtypes. Eur. Urol. 2021, 81, 523–532. [Google Scholar] [CrossRef] [PubMed]
- Johnson, W.E.; Li, C.; Rabinovic, A. Adjusting batch effects in microarray expression data using empirical Bayes methods. Biostatistics 2007, 8, 118–127. [Google Scholar] [CrossRef] [PubMed]
- Seiler, R.; Ashab, H.A.D.; Erho, N.; van Rhijn, B.W.G.; Winters, B.; Douglas, J.; Van Kessel, K.E.; Fransen van de Putte, E.E.; Sommerlad, M.; Wang, N.Q.; et al. Impact of Molecular Subtypes in Muscle-invasive Bladder Cancer on Predicting Response and Survival after Neoadjuvant Chemotherapy. Eur. Urol. 2017, 72, 544–554. [Google Scholar] [CrossRef] [PubMed]
- McConkey, D.J.; Choi, W.; Shen, Y.; Lee, I.L.; Porten, S.; Matin, S.F.; Kamat, A.M.; Corn, P.; Millikan, R.E.; Dinney, C.; et al. A Prognostic Gene Expression Signature in the Molecular Classification of Chemotherapy-naïve Urothelial Cancer is Predictive of Clinical Outcomes from Neoadjuvant Chemotherapy: A Phase 2 Trial of Dose-dense Methotrexate, Vinblastine, Doxorubicin, and Cisplatin with Bevacizumab in Urothelial Cancer. Eur. Urol. 2016, 69, 855–862. [Google Scholar] [CrossRef] [PubMed]
- Uhlén, M.; Fagerberg, L.; Hallström, B.M.; Lindskog, C.; Oksvold, P.; Mardinoglu, A.; Sivertsson, Å.; Kampf, C.; Sjöstedt, E.; Asplund, A.; et al. Tissue-based map of the human proteome. Science 2015, 347, 6220. [Google Scholar] [CrossRef]
- Brazma, A.; Parkinson, H.; Sarkans, U.; Shojatalab, M.; Vilo, J.; Abeygunawardena, N.; Holloway, E.; Kapushesky, M.; Kemmeren, P.; Lara, G.G.; et al. ArrayExpress—A public repository for microarray gene expression data at the EBI. Nucleic Acids Res. 2003, 31, 68–71. [Google Scholar] [CrossRef]
- Hussain, S.A.; Palmer, D.H.; Syn, W.K.; Sacco, J.J.; Greensmith, R.M.D.; Elmetwali, T.; Aachi, V.; Lloyd, B.H.; Jithesh, V.P.; Arrand, J.; et al. Gene expression profiling in bladder cancer identifies potential therapeutic targets. Int. J. Oncol. 2017, 50, 1147–1159. [Google Scholar] [CrossRef]
- Dyrskjøt, L.; Kruhøffer, M.; Thykjaer, T.; Marcussen, N.; Jensen, J.; Møller, K.; Ørntoft, T. Gene expression in the urinary bladder: A common carcinoma in situ gene expression signature exists disregarding histopathological classification. Cancer Res. 2004, 64, 4040–4048. [Google Scholar] [CrossRef]
- Mengual, L.; Burset, M.; Ars, E.; Lozano, J.J.; Villavicencio, H.; Ribal, M.J.; Alcaraz, A. DNA Microarray Expression Profiling of Bladder Cancer Allows Identification of Noninvasive Diagnostic Markers. J. Urol. 2009, 182, 741–748. [Google Scholar] [CrossRef]
- Gabriel, U.; Li, L.; Bolenz, C.; Steidler, A.; Kränzlin, B.; Saile, M.; Gretz, N.; Trojan, L.; Michel, M.S. New insights into the influence of cigarette smoking on urothelial carcinogenesis: Smoking-induced gene expression in tumor-free urothelium might discriminate muscle-invasive from nonmuscle-invasive urothelial bladder cancer. Mol. Carcinog. 2012, 51, 907–915. [Google Scholar] [CrossRef]
- Zhang, Z.; Furge, K.A.; Yang, X.J.; Teh, B.T.; Hansel, D.E. Comparative gene expression profiling analysis of urothelial carcinoma of the renal pelvis and bladder. BMC Med. Genom. 2010, 3, 58. [Google Scholar] [CrossRef] [PubMed]
- Urquidi, V.; Goodison, S.; Cai, Y.; Sun, Y.; Rosser, C. A candidate molecular biomarker panel for the detection of bladder cancer. Cancer Epidemiol. Biomark. Prev. 2012, 21, 2149–2158. [Google Scholar] [CrossRef]
- Kim, Y.-J.; Yoon, H.-Y.; Kim, J.S.; Kang, H.W.; Min, B.-D.; Kim, S.-K.; Ha, Y.-S.; Kim, I.Y.; Ryu, K.H.; Lee, S.-C.; et al. HOXA9, ISL1 and ALDH1A3 methylation patterns as prognostic markers for nonmuscle invasive bladder cancer: Array-based DNA methylation and expression profiling. Int. J. Cancer 2013, 133, 1135–1142. [Google Scholar] [CrossRef]
- Santos, M.; Martínez-Fernández, M.; Dueñas, M.; García-Escudero, R.; Alfaya, B.; Villacampa, F.; Saiz-Ladera, C.; Costa, C.; Oteo, M.; Duarte, J.; et al. In Vivo Disruption of an Rb–E2F–Ezh2 Signaling Loop Causes Bladder Cancer. Cancer Res. 2014, 74, 6565–6577. [Google Scholar] [CrossRef] [PubMed]
- Hecker, N.; Stephan, C.; Mollenkopf, H.-J.; Jung, K.; Preissner, R.; Meyer, H.-A. A new algorithm for integrated analysis of miRNA-mRNA interactions based on individual classification reveals insights into bladder cancer. PLoS ONE 2013, 8, e64543. [Google Scholar] [CrossRef] [PubMed]
- Roudnicky, F.; Poyet, C.; Wild, P.; Krampitz, S.; Negrini, F.; Huggenberger, R.; Rogler, A.; Stöhr, R.; Hartmann, A.; Provenzano, M.; et al. Endocan is upregulated on tumor vessels in invasive bladder cancer where it mediates VEGF-A-induced angiogenesis. Cancer Res. 2013, 73, 1097–1106. [Google Scholar] [CrossRef]
- Zhou, N.; Singh, K.; Mir, M.; Parker, Y.; Lindner, D.; Dreicer, R.; Ecsedy, J.; Zhang, Z.; Teh, B.; Almasan, A.; et al. The investigational Aurora kinase A inhibitor MLN8237 induces defects in cell viability and cell-cycle progression in malignant bladder cancer cells in vitro and in vivo. Clin. Cancer Res. Off. J. Am. Assoc. Cancer Res. 2013, 19, 1717–1728. [Google Scholar] [CrossRef]
- He, W.; Cai, Q.; Sun, F.; Zhong, G.; Wang, P.; Liu, H.; Luo, J.; Yu, H.; Huang, J.; Lin, T. linc-UBC1 physically associates with polycomb repressive complex 2 (PRC2) and acts as a negative prognostic factor for lymph node metastasis and survival in bladder cancer. Biochim. Et Biophys. Acta 2013, 1832, 1528–1537. [Google Scholar] [CrossRef]
- Borisov, N.; Tkachev, V.; Suntsova, M.; Kovalchuk, O.; Zhavoronkov, A.; Muchnik, I.; Buzdin, A. A method of gene expression data transfer from cell lines to cancer patients for machine-learning prediction of drug efficiency. Cell Cycle 2018, 17, 486–491. [Google Scholar] [CrossRef]
- Chen, L.; Yuan, L.; Wang, G.; Cao, R.; Peng, J.; Shu, B.; Qian, G.; Wang, X.; Xiao, Y. Identification and bioinformatics analysis of miRNAs associated with human muscle invasive bladder cancer. Mol. Med. Rep. 2017, 16, 8709–8720. [Google Scholar] [CrossRef]
- He, W.; Zhong, G.; Jiang, N.; Wang, B.; Fan, X.; Chen, C.; Chen, X.; Huang, J.; Lin, T. Long noncoding RNA BLACAT2 promotes bladder cancer-associated lymphangiogenesis and lymphatic metastasis. J. Clin. Investig. 2018, 128, 861–875. [Google Scholar] [CrossRef] [PubMed]
- Loras, A.; Suárez-Cabrera, C.; Martínez-Bisbal, C.; Quintás, G.; Paramio, J.M.; Martínez-Máñez, R.; Gil, S.; Ruiz-Cerdá, J.L. Integrative Metabolomic and Transcriptomic Analysis for the Study of Bladder Cancer. Cancers 2019, 11, 686. [Google Scholar] [CrossRef] [PubMed]
- Ng, K.; Vinnakota, K.; Sharma, A.; Kelly, J.; Dasgupta, P.; Vasdev, N. Urinary biomarkers to mitigate diagnostic delay in bladder cancer during the COVID-19 era. Nat. Rev. Urol. 2021, 18, 185–187. [Google Scholar] [CrossRef] [PubMed]
- Hanahan, D.; Weinberg, R.A. The Hallmarks of Cancer. Cell 2000, 100, 57–70. [Google Scholar] [CrossRef]
- Hanahan, D. Hallmarks of Cancer: New DimensionsHallmarks of Cancer: New Dimensions. Cancer Discov. 2022, 12, 31–46. [Google Scholar] [CrossRef]
- Charpentier, M.; Gutierrez, C.; Guillaudeux, T.; Verhoest, G.; Pedeux, R. Noninvasive urine-based tests to diagnose or detect recurrence of bladder cancer. Cancers 2021, 13, 1650. [Google Scholar] [CrossRef]
- Icer, M.A.; Gezmen-Karadag, M.; Sozen, S. Can urine osteopontin levels, which may be correlated with nutrition intake and body composition, be used as a new biomarker in the diagnosis of nephrolithiasis? Clin. Biochem. 2018, 60, 38–43. [Google Scholar] [CrossRef]
- Yao, F.; Hong, X.; Li, S.; Zhang, Y.; Zhao, Q.; Du, W.; Wang, Y.; Ni, J. Urine-Based Biomarkers for Alzheimer’s Disease Identified Through Coupling Computational and Experimental Methods. J. Alzheimer’s Dis. 2018, 65, 421–431. [Google Scholar] [CrossRef]
- Jiang, W.; Ma, T.; Zhang, C.; Tang, X.; Xu, Q.; Meng, X.; Ma, T. Identification of urinary candidate biomarkers of cisplatin-induced nephrotoxicity in patients with carcinoma. J. Proteom. 2020, 210, 103533. [Google Scholar] [CrossRef]
- Shimizu, Y.; Furuya, H.; Bryant Greenwood, P.; Chan, O.; Dai, Y.; Thornquist, M.D.; Goodison, S.; Rosser, C.J. A multiplex immunoassay for the non-invasive detection of bladder cancer. J. Transl. Med. 2016, 14, 31. [Google Scholar] [CrossRef]
- Rosser, C.J.; Chang, M.; Dai, Y.; Ross, S.; Mengual, L.; Alcaraz, A.; Goodison, S. Urinary protein biomarker panel for the detection of recurrent bladder cancer. Cancer Epidemiol. Biomark. Prev. 2014, 23, 1340–1345. [Google Scholar] [CrossRef] [PubMed]
- Kim, W.T.; Jeong, P.; Yan, C.; Kim, Y.H.; Lee, I.S.; Kang, H.W.; Kim, Y.J.; Lee, S.C.; Kim, S.J.; Kim, Y.T.; et al. UBE2C cell-free RNA in urine can discriminate between bladder cancer and hematuria. Oncotarget 2016, 7, 58193. [Google Scholar] [CrossRef] [PubMed]
- Kononikhin, A.S.; Zakharova, V.N.; Sergeeva, V.A.; Indeykina, M.I.; Starodubtseva, N.L.; Bugrova, A.E.; Muminova, K.T.; Khodzhaeva, Z.S.; Popov, I.A.; Shao, W.; et al. Differential Diagnosis of Preeclampsia Based on Urine Peptidome Features Revealed by High Resolution Mass Spectrometry. Diagnostics 2020, 10, 1039. [Google Scholar] [CrossRef] [PubMed]
- Stoeber, K.; Swinn, R.; Prevost, A.T.; De Clive-Lowe, P.; Halsall, I.; Dilworth, S.M.; Marr, J.; Turner, W.H.; Bullock, N.; Doble, A.; et al. Diagnosis of Genito-Urinary Tract Cancer by Detection of Minichromosome Maintenance 5 Protein in Urine Sediments. JNCI J. Natl. Cancer Inst. 2002, 94, 1071–1079. [Google Scholar] [CrossRef]
- Lee, S.H.; Lee, P.H.; Kim, B.G.; Hong, J.; Jang, A.S. Annexin A5 Protein as a Potential Biomarker for the Diagnosis of Asthma. Lung 2018, 196, 681–689. [Google Scholar] [CrossRef] [PubMed]
- Ang, K.C.; Kathirgamanathan, S.; Ch’ng, E.S.; Abdullah, W.Z.; Yusoff, N.M.; Jahnke, C.M.; Schmitz, R.; Bogdanova, N.; Wieacker, P.; Tang, T.H.; et al. Elevated annexin A5 plasma levels in term pregnancies of M2/ANXA5 carriers. Thromb. Res. 2017, 156, 87–90. [Google Scholar] [CrossRef]
- Serag, W.M.; Mohammed, B.S.e.; Mohamed, M.M.; Elsayed, B.E. Predicting the risk of portal vein thrombosis in patients with liver cirrhosis and hepatocellular carcinoma. Heliyon 2020, 6, E04677. [Google Scholar] [CrossRef]
- Laprovitera, N.; Salamon, I.; Gelsomino, F.; Porcellini, E.; Riefolo, M.; Garonzi, M.; Tononi, P.; Valente, S.; Sabbioni, S.; Fontana, F.; et al. Genetic Characterization of Cancer of Unknown Primary Using Liquid Biopsy Approaches. Front. Cell Dev. Biol. 2021, 9, 666156. [Google Scholar] [CrossRef]
- Marlicz, W.; Sielatycka, K.; Serwin, K.; Kubis, E.; Tkacz, M.; Guszko, R.; Biaek, A.; Starzyska, T.; Ratajczak, M.Z. Effect of colorectal cancer on the number of normal stem cells circulating in peripheral blood. Oncol. Rep. 2016, 36, 3635–3642. [Google Scholar] [CrossRef]
- Zhou, D.; Tang, W.; Liu, X.; An, H.X.; Zhang, Y. Clinical verification of plasma messenger RNA as novel noninvasive biomarker identified through bioinformatics analysis for lung cancer. Oncotarget 2017, 8, 43978–43989. [Google Scholar] [CrossRef][Green Version]
- Garcia, R.; Bouleti, C.; Sirol, M.; Logeart, D.; Monnot, C.; Ardidie-Robouant, C.; Caligiuri, G.; Mercadier, J.J.; Germain, S. VEGF-A plasma levels are associated with microvascular obstruction in patients with ST-segment elevation myocardial infarction. Int. J. Cardiol. 2019, 291, 19–24. [Google Scholar] [CrossRef]
- Smadja, D.M.; Mentzer, S.J.; Fontenay, M.; Laffan, M.A.; Ackermann, M.; Helms, J.; Jonigk, D.; Chocron, R.; Pier, G.B.; Gendron, N.; et al. COVID-19 is a systemic vascular hemopathy: Insight for mechanistic and clinical aspects. Angiogenesis 2021, 24, 755–788. [Google Scholar] [CrossRef] [PubMed]
- Innocenti, F.; Jiang, C.; Sibley, A.B.; Etheridge, A.S.; Hatch, A.J.; Denning, S.; Niedzwiecki, D.; Shterev, I.D.; Lin, J.; Furukawa, Y.; et al. Genetic variation determines VEGF-A plasma levels in cancer patients. Sci. Rep. 2018, 8, 16332. [Google Scholar] [CrossRef]
- Periyasamy, A.; Gopisetty, G.; Subramanium, M.J.; Velusamy, S.; Rajkumar, T. Identification and validation of differential plasma proteins levels in epithelial ovarian cancer. J. Proteom. 2020, 226, 103893. [Google Scholar] [CrossRef] [PubMed]
- Karsten, M.M.; Beck, M.H.; Rademacher, A.; Knabl, J.; Blohmer, J.U.; Jückstock, J.; Radosa, J.C.; Jank, P.; Rack, B.; Janni, W. VEGF-A165b levels are reduced in breast cancer patients at primary diagnosis but increase after completion of cancer treatment. Sci. Rep. 2020, 10, 3635. [Google Scholar] [CrossRef] [PubMed]
- Ingenwerth, M.; Nyirády, P.; Hadaschik, B.; Szarvas, T.; Reis, H. The prognostic value of cytokeratin and extracellular collagen expression in urinary bladder cancer. Curr. Mol. Med. 2021, 22, 941–949. [Google Scholar] [CrossRef] [PubMed]
- Zhang, H.; Shan, G.; Song, J.; Tian, Y.; An, L.Y.; Ban, Y.; Luo, G.H. Extracellular matrix-related genes play an important role in the progression of NMIBC to MIBC: A bioinformatics analysis study. Biosci. Rep. 2020, 40, BSR20194192. [Google Scholar] [CrossRef]
- Yi, L.; Wang, H.; Li, W.; Ye, K.; Xiong, W.; Yu, H.; Jin, X. The FOXM1/RNF26/p57 axis regulates the cell cycle to promote the aggressiveness of bladder cancer. Cell Death Dis. 2021, 12, 944. [Google Scholar] [CrossRef]
- Rinaldetti, S.; Wirtz, R.; Worst, T.S.; Hartmann, A.; Breyer, J.; Dyrskjot, L.; Erben, P. FOXM1 predicts disease progression in non-muscle invasive bladder cancer. J. Cancer Res. Clin. Oncol. 2018, 144, 1701–1709. [Google Scholar] [CrossRef]
- Verma, S.; Shankar, E.; Lin, S.; Singh, V.; Chan, E.R.; Cao, S.; Fu, P.; Maclennan, G.T.; Ponsky, L.E.; Gupta, S. Identification of key genes associated with progression and prognosis of bladder cancer through integrated bioinformatics analysis. Cancers 2021, 13, 5931. [Google Scholar] [CrossRef]
- Roh, Y.G.; Mun, J.Y.; Kim, S.K.; Park, W.; Jeong, M.S.; Kim, T.N.; Kim, W.T.; Choi, Y.H.; Chu, I.S.; Leem, S.H. Fanconi Anemia Pathway Activation by FOXM1 Is Critical to Bladder Cancer Recurrence and Anticancer Drug Resistance. Cancers 2020, 12, 1417. [Google Scholar] [CrossRef] [PubMed]
- Yang, Z.; Sun, H.; Ma, W.; Wu, K.; Peng, G.; Ou, T.; Wu, S. Down-regulation of Polo-like kinase 4 (PLK4) induces G1 arrest via activation of the p38/p53/p21 signaling pathway in bladder cancer. FEBS Open Bio 2021, 11, 2631–2646. [Google Scholar] [CrossRef] [PubMed]
- Yang, L.; Li, C.; Qin, Y.; Zhang, G.; Zhao, B.; Wang, Z.; Huang, Y.; Yang, Y. A Novel Prognostic Model Based on Ferroptosis-Related Gene Signature for Bladder Cancer. Front. Oncol. 2021, 11, 3070. [Google Scholar] [CrossRef] [PubMed]
- Xie, Z.; Cai, J.; Sun, W.; Hua, S.; Wang, X.; Li, A.; Jiang, J. Development and Validation of Prognostic Model in Transitional Bladder Cancer Based on Inflammatory Response-Associated Genes. Front. Oncol. 2021, 11, 4033. [Google Scholar] [CrossRef] [PubMed]
- Lin, J.; Yang, J.; Xu, X.; Wang, Y.; Yu, M.; Zhu, Y. A robust 11-genes prognostic model can predict overall survival in bladder cancer patients based on five cohorts. Cancer Cell Int. 2020, 20, 1–14. [Google Scholar] [CrossRef]
- Tang, F.; Li, Z.; Lai, Y.; Lu, Z.; Lei, H.; He, C.; He, Z. A 7-gene signature predicts the prognosis of patients with bladder cancer. BMC Urol. 2022, 22, 1–12. [Google Scholar] [CrossRef]
- Zhou, C.; Li, A.H.; Liu, S.; Sun, H. Identification of an 11-Autophagy-Related-Gene Signature as Promising Prognostic Biomarker for Bladder Cancer Patients. Biology 2021, 10, 375. [Google Scholar] [CrossRef]
- Xu, F.; Tang, Q.; Wang, Y.; Wang, G.; Qian, K.; Ju, L.; Xiao, Y. Development and Validation of a Six-Gene Prognostic Signature for Bladder Cancer. Front. Genet. 2021, 12, 2395. [Google Scholar] [CrossRef]
- Chen, F.; Wang, Q.; Zhou, Y. The construction and validation of an RNA binding protein-related prognostic model for bladder cancer. BMC Cancer 2021, 21, 1–13. [Google Scholar] [CrossRef]
- Hu, Y.; Zhang, Y.; Gao, J.; Lian, X.; Wang, Y. The clinicopathological and prognostic value of CD44 expression in bladder cancer: A study based on meta-analysis and TCGA data. Bioengineered 2020, 11, 572–581. [Google Scholar] [CrossRef]
- Wu, T.C.; Lin, W.Y.; Chen, W.C.; Chen, M.F. Predictive Value of CD44 in Muscle-Invasive Bladder Cancer and Its Relationship with IL-6 Signaling. Ann. Surg. Oncol. 2018, 25, 3518–3526. [Google Scholar] [CrossRef] [PubMed]
- Wu, T.C.; Lin, W.Y.; Chang, Y.H.; Chen, W.C.; Chen, M.F. Impact of CD44 expression on radiation response for bladder cancer. J. Cancer 2017, 8, 1137–1144. [Google Scholar] [CrossRef] [PubMed]
- Sottnik, J.L.; Vanderlinden, L.; Joshi, M.; Chauca-Diaz, A.; Owens, C.; Hansel, D.E.; Sempeck, C.; Ghosh, D.; Theodorescu, D. Androgen Receptor Regulates CD44 Expression in Bladder Cancer. Cancer Res. 2021, 81, 2833–2846. [Google Scholar] [CrossRef] [PubMed]
- Sasca, D.; Szybinski, J.; Schüler, A.; Shah, V.; Heidelberger, J.; Haehnel, P.S.; Dolnik, A.; Kriege, O.; Fehr, E.M.; Gebhardt, W.H.; et al. NCAM1 (CD56) promotes leukemogenesis and confers drug resistance in AML. Blood 2019, 133, 2305–2319. [Google Scholar] [CrossRef]
- Shukrun, R.; Golan, H.; Caspi, R.; Pode-Shakked, N.; Pleniceanu, O.; Vax, E.; Bar-Lev, D.D.; Pri-Chen, S.; Jacob-Hirsch, J.; Schiby, G.; et al. NCAM1/FGF module serves as a putative pleuropulmonary blastoma therapeutic target. Oncogenesis 2019, 8, 48. [Google Scholar] [CrossRef] [PubMed]
- Øvestad, I.T.; Engesæter, B.; Halle, M.K.; Akbari, S.; Bicskei, B.; Lapin, M.; Austdal, M.; Janssen, E.A.M.; Krakstad, C.; Lillesand, M.; et al. High-Grade Cervical Intraepithelial Neoplasia (CIN) Associates with Increased Proliferation and Attenuated Immune Signaling. Int. J. Mol. Sci. 2021, 23, 373. [Google Scholar] [CrossRef]
- Cheng, C.; Wu, X.; Shen, Y.; Li, Q. KIF14 and KIF23 Promote Cell Proliferation and Chemoresistance in HCC Cells, and Predict Worse Prognosis of Patients with HCC. Cancer Manag. Res. 2020, 12, 13241–13257. [Google Scholar] [CrossRef]
- Wang, W.; Shi, Y.; Li, J.; Cui, W.; Yang, B. Up-regulation of KIF14 is a predictor of poor survival and a novel prognostic biomarker of chemoresistance to paclitaxel treatment in cervical cancer. Biosci. Rep. 2016, 36, e00315. [Google Scholar] [CrossRef]
- Li, T.F.; Zeng, H.J.; Shan, Z.; Ye, R.Y.; Cheang, T.Y.; Zhang, Y.J.; Lu, S.H.; Zhang, Q.; Shao, N.; Lin, Y. Overexpression of kinesin superfamily members as prognostic biomarkers of breast cancer. Cancer Cell Int. 2020, 20, 123. [Google Scholar] [CrossRef]
- Klimaszewska-Wiśniewska, A.; Neska-Długosz, I.; Buchholz, K.; Durślewicz, J.; Grzanka, D.; Kasperska, A.; Antosik, P.; Zabrzyński, J.; Grzanka, A.; Gagat, M. Prognostic Significance of KIF11 and KIF14 Expression in Pancreatic Adenocarcinoma. Cancers 2021, 13, 3017. [Google Scholar] [CrossRef]
- Jiang, W.; Zhu, D.; Wang, C.; Zhu, Y. An immune relevant signature for predicting prognoses and immunotherapeutic responses in patients with muscle-invasive bladder cancer (MIBC). Cancer Med. 2020, 9, 2774. [Google Scholar] [CrossRef] [PubMed]
- Shen, C.; Xu, T.; Sun, Y.; Wang, L.; Liang, Z.; Niu, H.; Jiao, W.; Wang, Y. Construction of an Immune-Associated Gene-Based Signature in Muscle-Invasive Bladder Cancer. Dis. Markers 2020, 2020, 8866730. [Google Scholar] [CrossRef] [PubMed]
- Choi, S.J.; Park, K.J.; Heo, C.; Park, B.W.; Kim, M.; Kim, J.K. Radiomics-based model for predicting pathological complete response to neoadjuvant chemotherapy in muscle-invasive bladder cancer. Clin. Radiol. 2021, 76, 627.e13–627.e21. [Google Scholar] [CrossRef]
- Parmar, A.; Qazi, A.A.; Stundzia, A.; Sim, H.W.; Lewin, J.; Metser, U.; O’Malley, M.; Hansen, A.R. Development of a radiomic signature for predicting response to neoadjuvant chemotherapy in muscle-invasive bladder cancer. Can. Urol. Assoc. J. 2022, 16, E113. [Google Scholar] [CrossRef] [PubMed]
- Scholtes, M.P.; Alberts, A.R.; Iflé, I.G.; Verhagen, P.C.M.S.; van der Veldt, A.A.M.; Zuiverloon, T.C.M. Biomarker-Oriented Therapy in Bladder and Renal Cancer. Int. J. Mol. Sci. 2021, 22, 2832. [Google Scholar] [CrossRef]
- Valdés, A.; Bitzios, A.; Kassa, E.; Shevchenko, G.; Falk, A.; Malmström, P.U.; Dragomir, A.; Segersten, U.; Lind, S.B. Proteomic comparison between different tissue preservation methods for identification of promising biomarkers of urothelial bladder cancer. Sci. Rep. 2021, 11, 7595. [Google Scholar] [CrossRef]
- Fan, Y.; Jiang, C.; Li, S.; Yao, X.; Qi, X.; Wang, Y.; Zhang, B.; He, T.; Yan, T.; Zhang, L.; et al. Identification and Validation of an Annexin-Related Prognostic Signature and Therapeutic Targets for Bladder Cancer: Integrative Analysis. Biology 2022, 11, 259. [Google Scholar] [CrossRef]
- Wu, W.B.; Jia, G.Z.; Chen, L.; Liu, H.T.; Xia, S.J. Analysis of the Expression and Prognostic Value of Annexin Family Proteins in Bladder Cancer. Front. Genet. 2021, 12, 1501. [Google Scholar] [CrossRef]
- Deng, S.; Wang, J.; Hou, L.; Li, J.; Chen, G.; Jing, B.; Zhang, X.; Yang, Z. Annexin A1, A2, A4 and A5 play important roles in breast cancer, pancreatic cancer and laryngeal carcinoma, alone and/or synergistically. Oncol. Lett. 2012, 5, 107–112. [Google Scholar] [CrossRef]
- Serag, W.M.; Elsayed, B.E. Annexin A5 as a marker for hepatocellular carcinoma in cirrhotic hepatitis C virus patients. Egypt. Liver J. 2021, 11, 32. [Google Scholar] [CrossRef]
- Sun, B.; Bai, Y.; Zhang, L.; Gong, L.; Qi, X.; Li, H.; Wang, F.; Chi, X.; Jiang, Y.; Shao, S. Quantitative Proteomic Profiling the Molecular Signatures of Annexin A5 in Lung Squamous Carcinoma Cells. PLoS ONE 2016, 11, e0163622. [Google Scholar] [CrossRef] [PubMed]
- Peng, B.; Guo, C.; Guan, H.; Liu, S.; Sun, M.Z. Annexin A5 as a potential marker in tumors. Clin. Chim. Acta 2014, 427, 42–48. [Google Scholar] [CrossRef] [PubMed]
- Mo, X.C.; Zhang, Z.T.; Song, M.J.; Zhou, Z.Q.; Zeng, J.X.; Du, Y.F.; Sun, F.Z.; Yang, J.Y.; He, J.Y.; Huang, Y.; et al. Screening and identification of hub genes in bladder cancer by bioinformatics analysis and KIF11 is a potential prognostic biomarker. Oncol. Lett. 2021, 21, 205. [Google Scholar] [CrossRef] [PubMed]
- Pozo, P.N.; Cook, J.G. Regulation and Function of Cdt1; A Key Factor in Cell Proliferation and Genome Stability. Genes 2017, 8, 2. [Google Scholar] [CrossRef] [PubMed]
- Kanellou, A.; Giakoumakis, N.N.; Panagopoulos, A.; Tsaniras, S.C.; Lygerou, Z. The Licensing Factor Cdt1 Links Cell Cycle Progression to the DNA Damage Response. Anticancer Res. 2020, 40, 2449–2456. [Google Scholar] [CrossRef] [PubMed]
- Mahadevappa, R.; Neves, H.; Yuen, S.M.; Bai, Y.; McCrudden, C.M.; Yuen, H.F.; Wen, Q.; Zhang, S.D.; Kwok, H.F. The prognostic significance of Cdc6 and Cdt1 in breast cancer. Sci. Rep. 2017, 7, 985. [Google Scholar] [CrossRef]
- Cai, C.; Zhang, Y.; Hu, X.; Hu, W.; Yang, S.; Qiu, H.; Chu, T. CDT1 Is a Novel Prognostic and Predictive Biomarkers for Hepatocellular Carcinoma. Front. Oncol. 2021, 11, 3803. [Google Scholar] [CrossRef] [PubMed]
- Bravou, V.; Nishitani, H.; Song, S.Y.; Taraviras, S.; Varakis, J. Expression of the licensing factors, Cdt1 and Geminin, in human colon cancer. Int. J. Oncol. 2005, 27, 1511–1518. [Google Scholar] [CrossRef]
- Wang, C.; Che, J.; Jiang, Y.; Chen, P.; Bao, G.; Li, C. CDT1 facilitates metastasis in prostate cancer and correlates with cell cycle regulation. Cancer Biomark. Sect. A Dis. Markers 2022, 34, 459–469. [Google Scholar] [CrossRef]
- Kuivaniemi, H.; Tromp, G. Type III collagen (COL3A1): Gene and protein structure, tissue distribution, and associated diseases. Gene 2019, 707, 151. [Google Scholar] [CrossRef]
- Shi, S.; Tian, B. Identification of biomarkers associated with progression and prognosis in bladder cancer via co-expression analysis. Cancer Biomark. Sect. A Dis. Markers 2019, 24, 183–193. [Google Scholar] [CrossRef] [PubMed]
- Lee, J.Y.; Yun, S.J.; Jeong, P.; Piao, X.M.; Kim, Y.H.; Kim, J.; Subramaniyam, S.; Byun, Y.J.; Kang, H.W.; Seo, S.P.; et al. Identification of differentially expressed miRNAs and miRNA-targeted genes in bladder cancer. Oncotarget 2018, 9, 27656. [Google Scholar] [CrossRef] [PubMed]
- Yuan, L.; Shu, B.; Chen, L.; Qian, K.; Wang, Y.; Qian, G.; Zhu, Y.; Cao, X.; Xie, C.; Xiao, Y.; et al. Overexpression of COL3A1 confers a poor prognosis in human bladder cancer identified by co-expression analysis. Oncotarget 2017, 8, 70508–70520. [Google Scholar] [CrossRef] [PubMed]
- Ewald, J.A.; Downs, T.M.; Cetnar, J.P.; Ricke, W.A. Expression microarray meta-analysis identifies genes associated with Ras/MAPK and related pathways in progression of muscle-invasive bladder transition cell carcinoma. PLoS ONE 2013, 8, e55414. [Google Scholar] [CrossRef] [PubMed]
- Zhu, H.; Chen, H.; Wang, J.; Zhou, L.; Liu, S. Collagen stiffness promoted non-muscle-invasive bladder cancer progression to muscle-invasive bladder cancer. OncoTargets Ther. 2019, 12, 3441–3457. [Google Scholar] [CrossRef] [PubMed]
- Piao, X.M.; Hwang, B.; Jeong, P.; Byun, Y.J.; Kang, H.W.; Seo, S.P.; Kim, W.T.; Lee, J.Y.; Ha, Y.S.; Lee, Y.S.; et al. Collagen type VI-α1 and 2 repress the proliferation, migration and invasion of bladder cancer cells. Int. J. Oncol. 2021, 59, 37. [Google Scholar] [CrossRef]
- Davalieva, K.; Kiprijanovska, S.; Kostovska, I.M.; Stavridis, S.; Stankov, O.; Komina, S.; Petrusevska, G.; Polenakovic, M. Comparative Proteomics Analysis of Urine Reveals Down-Regulation of Acute Phase Response Signaling and LXR/RXR Activation Pathways in Prostate Cancer. Proteomes 2017, 6, 1. [Google Scholar] [CrossRef]
- Xu, S.; Xu, H.; Wang, W.; Li, S.; Li, H.; Li, T.; Zhang, W.; Yu, X.; Liu, L. The role of collagen in cancer: From bench to bedside. J. Transl. Med. 2019, 17, 309. [Google Scholar] [CrossRef]
- Lamort, A.S.; Giopanou, I.; Psallidas, I.; Stathopoulos, G.T. Osteopontin as a Link between Inflammation and Cancer: The Thorax in the Spotlight. Cells 2019, 8, 815. [Google Scholar] [CrossRef]
- Moorman, H.R.; Poschel, D.; Klement, J.D.; Lu, C.; Redd, P.S.; Liu, K. Osteopontin: A Key Regulator of Tumor Progression and Immunomodulation. Cancers 2020, 12, 3379. [Google Scholar] [CrossRef]
- Zaravinos, A.; Lambrou, G.I.; Volanis, D.; Delakas, D.; Spandidos, D.A. Spotlight on Differentially Expressed Genes in Urinary Bladder Cancer. PLoS ONE 2011, 6, e18255. [Google Scholar] [CrossRef] [PubMed]
- Pignot, G.; Vieillefond, A.; Vacher, S.; Zerbib, M.; Debre, B.; Lidereau, R.; Amsellem-Ouazana, D.; Bieche, I. Hedgehog pathway activation in human transitional cell carcinoma of the bladder. Br. J. Cancer 2012, 106, 1177–1186. [Google Scholar] [CrossRef] [PubMed]
- Zaravinos, A.; Volanis, D.; Lambrou, G.I.; Delakas, D.; Spandidos, D.A. Role of the angiogenic components, VEGFA, FGF2, OPN and RHOC, in urothelial cell carcinoma of the urinary bladder. Oncol. Rep. 2012, 28, 1159–1166. [Google Scholar] [CrossRef] [PubMed]
- Ghasemi, H.; Mousavibahar, S.H.; Hashemnia, M.; Karimi, J.; Khodadadi, I.; Tavilani, H. Transitional cell carcinoma matrix stiffness regulates the osteopontin and YAP expression in recurrent patients. Mol. Biol. Rep. 2021, 48, 4253–4262. [Google Scholar] [CrossRef] [PubMed]
- Tu, Y.; Chen, C.; Fan, G. Association between the expression of secreted phosphoprotein—Related genes and prognosis of human cancer. BMC Cancer 2019, 19, 1230. [Google Scholar] [CrossRef]
- Wei, T.; Bi, G.; Bian, Y.; Ruan, S.; Yuan, G.; Xie, H.; Zhao, M.; Shen, R.; Zhu, Y.; Wang, Q.; et al. The Significance of Secreted Phosphoprotein 1 in Multiple Human Cancers. Front. Mol. Biosci. 2020, 7, 251. [Google Scholar] [CrossRef]
- Tang, H.; Chen, J.; Han, X.; Feng, Y.; Wang, F. Upregulation of SPP1 Is a Marker for Poor Lung Cancer Prognosis and Contributes to Cancer Progression and Cisplatin Resistance. Front. Cell Dev. Biol. 2021, 9, 1109. [Google Scholar] [CrossRef]
- Qian, J.; LeSavage, B.L.; Hubka, K.M.; Ma, C.; Natarajan, S.; Eggold, J.T.; Xiao, Y.; Fuh, K.C.; Krishnan, V.; Enejder, A.; et al. Cancer-associated mesothelial cells promote ovarian cancer chemoresistance through paracrine osteopontin signaling. J. Clin. Investig. 2021, 131, e146186. [Google Scholar] [CrossRef]
- Li, Y.; He, S.; He, A.; Guan, B.; Ge, G.; Zhan, Y.; Wu, Y.; Gong, Y.; Peng, D.; Bao, Z.; et al. Identification of plasma secreted phosphoprotein 1 as a novel biomarker for upper tract urothelial carcinomas. Biomed. Pharmacother. 2019, 113, 108744. [Google Scholar] [CrossRef]
- Ferrara, N.; Adamis, A.P. Ten years of anti-vascular endothelial growth factor therapy. Nat. Rev. Drug Discov. 2016, 15, 385–403. [Google Scholar] [CrossRef]
- Huang, Z.; Zhang, M.; Chen, G.; Wang, W.; Zhang, P.; Yue, Y.; Guan, Z.; Wang, X.; Fan, J. Bladder cancer cells interact with vascular endothelial cells triggering EGFR signals to promote tumor progression. Int. J. Oncol. 2019, 54, 1555–1566. [Google Scholar] [CrossRef] [PubMed]
- Cao, W.; Zhao, Y.; Wang, L.; Huang, X. Circ0001429 regulates progression of bladder cancer through binding miR-205-5p and promoting VEGFA expression. Cancer Biomark. Sect. A Dis. Markers 2019, 25, 101–113. [Google Scholar] [CrossRef] [PubMed]
- Gao, X.; Chen, Y.; Chen, M.; Wang, S.; Wen, X.; Zhang, S. Identification of key candidate genes and biological pathways in bladder cancer. PeerJ 2018, 6, e6036. [Google Scholar] [CrossRef] [PubMed]
- Pignot, G.; Bieche, I.; Vacher, S.; Güet, C.; Vieillefond, A.; Debré, B.; Lidereau, R.; Amsellem-Ouazana, D. Large-scale real-time reverse transcription-PCR approach of angiogenic pathways in human transitional cell carcinoma of the bladder: Identification of VEGFA as a major independent prognostic marker. Eur. Urol. 2009, 56, 678–689. [Google Scholar] [CrossRef]
- Huang, Y.J.; Qi, W.X.; He, A.N.; Sun, Y.J.; Shen, Z.; Yao, Y. Prognostic value of tissue vascular endothelial growth factor expression in bladder cancer: A meta-analysis. Asian Pac. J. Cancer Prev. APJCP 2013, 14, 645–649. [Google Scholar] [CrossRef]
- Sankhwar, M.; Sankhwar, S.N.; Abhishek, A.; Rajender, S. Clinical significance of the VEGF level in urinary bladder carcinoma. Cancer Biomark. Sect. A Dis. Markers 2015, 15, 349–355. [Google Scholar] [CrossRef]
- Zhong, Z.; Huang, M.; Lv, M.; He, Y.; Duan, C.; Zhang, L.; Chen, J. Circular RNA MYLK as a competing endogenous RNA promotes bladder cancer progression through modulating VEGFA/VEGFR2 signaling pathway. Cancer Lett. 2017, 403, 305–317. [Google Scholar] [CrossRef]
- De Paoli, M.; Perco, P.; Mühlberger, I.; Lukas, A.; Pandha, H.; Morgan, R.; Feng, G.J.; Marquette, C. Disease map-based biomarker selection and pre-validation for bladder cancer diagnostic. Biomark. Biochem. Indic. Expo. Response Susceptibility Chem. 2015, 20, 328–337. [Google Scholar] [CrossRef]
- Hirasawa, Y.; Pagano, I.; Chen, R.; Sun, Y.; Dai, Y.; Gupta, A.; Tikhonenkov, S.; Goodison, S.; Rosser, C.J.; Furuya, H. Diagnostic performance of Oncuria™, a urinalysis test for bladder cancer. J. Transl. Med. 2021, 19, 1–10. [Google Scholar] [CrossRef]
- Bu, Y.; Shi, L.; Yu, D.; Liang, Z.; Li, W. CDCA8 is a key mediator of estrogen-stimulated cell proliferation in breast cancer cells. Gene 2019, 703, 1–6. [Google Scholar] [CrossRef]
- Shuai, Y.; Fan, E.; Zhong, Q.; Chen, Q.; Feng, G.; Gou, X.; Zhang, G. CDCA8 as an independent predictor for a poor prognosis in liver cancer. Cancer Cell Int. 2021, 21, 159. [Google Scholar] [CrossRef] [PubMed]
- Gu, P.; Yang, D.; Zhu, J.; Zhang, M.; He, X.; Mojumdar, K. Bioinformatics analysis of the clinical relevance of CDCA gene family in prostate cancer. Medicine 2022, 101, E28788. [Google Scholar] [CrossRef] [PubMed]
- Gao, X.; Wen, X.; He, H.; Zheng, L.; Yang, Y.; Yang, J.; Liu, H.; Zhou, X.; Yang, C.; Chen, Y.; et al. Knockdown of CDCA8 inhibits the proliferation and enhances the apoptosis of bladder cancer cells. PeerJ 2020, 8, e9078. [Google Scholar] [CrossRef] [PubMed]
- Bi, Y.; Chen, S.; Jiang, J.; Yao, J.; Wang, G.; Zhou, Q.; Li, S. CDCA8 expression and its clinical relevance in patients with bladder cancer. Medicine 2018, 97, e11899. [Google Scholar] [CrossRef] [PubMed]
- Pan, S.; Zhan, Y.; Chen, X.; Wu, B.; Liu, B. Identification of Biomarkers for Controlling Cancer Stem Cell Characteristics in Bladder Cancer by Network Analysis of Transcriptome Data Stemness Indices. Front. Oncol. 2019, 9, 613. [Google Scholar] [CrossRef]
- Chen, K.; Xing, J.; Yu, W.; Xia, Y.; Zhang, Y.; Cheng, F.; Rao, T. Identification and Validation of Hub Genes Associated with Bladder Cancer by Integrated Bioinformatics and Experimental Assays. Front. Oncol. 2021, 11, 5336. [Google Scholar] [CrossRef]
- Lu, H.C.; Yao, J.Q.; Yang, X.; Han, J.; Wang, J.Z.; Xu, K.; Zhou, R.; Yu, H.; Lv, Q.; Gu, M. Identification of a potentially functional circRNA-miRNA-mRNA regulatory network for investigating pathogenesis and providing possible biomarkers of bladder cancer. Cancer Cell Int. 2020, 20, 31. [Google Scholar] [CrossRef]
- Shen, P.; He, X.; Lan, L.; Hong, Y.; Lin, M. Identification of cell division cycle 20 as a candidate biomarker and potential therapeutic target in bladder cancer using bioinformatics analysis. Biosci. Rep. 2020, 40, BSR20194429. [Google Scholar] [CrossRef]
- Li, S.; Liu, X.; Liu, T.; Meng, X.; Yin, X.; Fang, C.; Huang, D.; Cao, Y.; Weng, H.; Zeng, X.; et al. Identification of Biomarkers Correlated with the TNM Staging and Overall Survival of Patients with Bladder Cancer. Front. Physiol. 2017, 8, 947. [Google Scholar] [CrossRef]
- Shi, J.; Zhang, P.; Liu, L.; Min, X.; Xiao, Y. Weighted gene coexpression network analysis identifies a new biomarker of CENPF for prediction disease prognosis and progression in nonmuscle invasive bladder cancer. Mol. Genet. Genom. Med. 2019, 7, e982. [Google Scholar] [CrossRef]
- Taber, A.; Christensen, E.; Lamy, P.; Nordentoft, I.; Prip, F.; Lindskrog, S.V.; Birkenkamp-Demtröder, K.; Okholm, T.L.H.; Knudsen, M.; Pedersen, J.S.; et al. Molecular correlates of cisplatin-based chemotherapy response in muscle invasive bladder cancer by integrated multi-omics analysis. Nat. Commun. 2020, 11, 4858. [Google Scholar] [CrossRef] [PubMed]
- Liu, Z.; Zhou, Q.; Wang, Z.; Zhang, H.; Zeng, H.; Huang, Q.; Chen, Y.; Jiang, W.; Lin, Z.; Qu, Y.; et al. Intratumoral TIGIT+ CD8+ T-cell infiltration determines poor prognosis and immune evasion in patients with muscle-invasive bladder cancer. J. ImmunoTherapy Cancer 2020, 8, e000978. [Google Scholar] [CrossRef] [PubMed]
- Jiang, D.; Li, Y.; Cao, J.; Sheng, L.; Zhu, X.; Xu, M. Cell Division Cycle-Associated Genes Are Potential Immune Regulators in Nasopharyngeal Carcinoma. Front. Oncol. 2022, 12, 84. [Google Scholar] [CrossRef] [PubMed]
- Dunleavy, E.M.; Roche, D.; Tagami, H.; Lacoste, N.; Ray-Gallet, D.; Nakamura, Y.; Daigo, Y.; Nakatani, Y.; Almouzni-Pettinotti, G. HJURP Is a Cell-Cycle-Dependent Maintenance and Deposition Factor of CENP-A at Centromeres. Cell 2009, 137, 485–497. [Google Scholar] [CrossRef]
- Zhang, C.; Berndt-Paetz, M.; Neuhaus, J. Identification of Key Biomarkers in Bladder Cancer: Evidence from a Bioinformatics Analysis. Diagnostics 2020, 10, 66. [Google Scholar] [CrossRef] [PubMed]
- Cao, R.; Wang, G.; Qian, K.; Chen, L.; Qian, G.; Xie, C.; Dan, H.C.; Jiang, W.; Wu, M.; Wu, C.L.; et al. Silencing of HJURP induces dysregulation of cell cycle and ROS metabolism in bladder cancer cells via PPARγ-SIRT1 feedback loop. J. Cancer 2017, 8, 2282–2295. [Google Scholar] [CrossRef] [PubMed]
- Wang, C.-j.; Li, X.; Shi, P.; Ding, H.y.; Liu, Y.p.; Li, T.; Lin, P.p.; Wang, Y.s.; Zhang, G.q.; Cao, Y. Holliday junction recognition protein promotes pancreatic cancer growth and metastasis via modulation of the MDM2/p53 signaling. Cell Death Dis. 2020, 11, 386. [Google Scholar] [CrossRef] [PubMed]
- Wei, Y.; Ouyang, G.L.; Yao, W.X.; Zhu, Y.J.; Li, X.; Huang, L.X.; Yang, X.W.; Jiang, W.J. Knockdown of HJURP inhibits non-small cell lung cancer cell proliferation, migration, and invasion by repressing Wnt/β-catenin signaling. Eur. Rev. Med. Pharmacol. Sci. 2019, 23, 3847–3856. [Google Scholar] [CrossRef]
- Hu, Z.; Huang, G.; Sadanandam, A.; Gu, S.; Lenburg, M.E.; Pai, M.; Bayani, N.; Blakely, E.A.; Gray, J.W.; Mao, J.H. The expression level of HJURP has an independent prognostic impact and predicts the sensitivity to radiotherapy in breast cancer. Breast Cancer Res. BCR 2010, 12, R18. [Google Scholar] [CrossRef]
- Lai, W.; Zhu, W.; Xiao, C.; Li, X.; Wang, Y.; Han, Y.; Zheng, J.; Li, Y.; Li, M.; Wen, X. HJURP promotes proliferation in prostate cancer cells through increasing CDKN1A degradation via the GSK3β/JNK signaling pathway. Cell Death Dis. 2021, 12, 583. [Google Scholar] [CrossRef]
- Zhang, F.; Yuan, D.B.; Song, J.K.; Chen, W.M.; Wang, W.; Zhu, G.H.; Hu, B.; Chen, X.; Zhu, J. HJURP is a prognostic biomarker for clear cell renal cell carcinoma and is linked to immune infiltration. Int. Immunopharmacol. 2021, 99, 107899. [Google Scholar] [CrossRef] [PubMed]
- Su, R.; Huang, H.; Gao, X.; Zhou, Y.; Yin, S.; Xie, H.; Zhou, L.; Zheng, S. A pan-cancer analysis of the oncogenic role of Holliday junction recognition protein in human tumors. Open Med. 2022, 17, 317–328. [Google Scholar] [CrossRef] [PubMed]
- Zeng, S.; Liu, A.; Dai, L.; Yu, X.; Zhang, Z.; Xiong, Q.; Yang, J.; Liu, F.; Xu, J.; Xue, Y.; et al. Prognostic value of TOP2A in bladder urothelial carcinoma and potential molecular mechanisms. BMC Cancer 2019, 19, 604. [Google Scholar] [CrossRef] [PubMed]
- Zhang, F.; Wu, H. MiR-599 targeting TOP2A inhibits the malignancy of bladder cancer cells. Biochem. Biophys. Res. Commun. 2021, 570, 154–161. [Google Scholar] [CrossRef] [PubMed]
- Kim, W.T.; Kim, Y.H.; Jeong, P.; Seo, S.P.; Kang, H.W.; Kim, Y.J.; Yun, S.J.; Lee, S.C.; Moon, S.K.; Choi, Y.H.; et al. Urinary cell-free nucleic acid IQGAP3: A new non-invasive diagnostic marker for bladder cancer. Oncotarget 2018, 9, 14354–14365. [Google Scholar] [CrossRef] [PubMed]
- Lindén, M.; Segersten, U.; Runeson, M.; Wester, K.; Busch, C.; Pettersson, U.; Lind, S.B.; Malmström, P.U. Tumour expression of bladder cancer-associated urinary proteins. BJU Int. 2013, 112, 407–415. [Google Scholar] [CrossRef]
- Botti, G.; Malzone, M.G.; La Mantia, E.; Montanari, M.; Vanacore, D.; Rossetti, S.; Quagliariello, V.; Cavaliere, C.; Di Franco, R.; Castaldo, L.; et al. ProEx C as Diagnostic Marker for Detection of Urothelial Carcinoma in Urinary Samples: A Review. Int. J. Med. Sci. 2017, 14, 554. [Google Scholar] [CrossRef]
- Del Moral-Hernández, O.; Hernández-Sotelo, D.; Alarcón-Romero, L.d.C.; Mendoza-Catalán, M.A.; Flores-Alfaro, E.; Castro-Coronel, Y.; Ortiz-Ortiz, J.; Leyva-Vázquez, M.A.; Ortuño-Pineda, C.; Castro-Mora, W.; et al. TOP2A/MCM2, p16INK4a, and cyclin E1 expression in liquid-based cytology: A biomarkers panel for progression risk of cervical premalignant lesions. BMC Cancer 2021, 21, 1–13. [Google Scholar] [CrossRef]
- Li, J.; Sun, P.; Huang, T.; He, S.; Li, L.; Xue, G. Individualized chemotherapy guided by the expression of ERCC1, RRM1, TUBB3, TYMS and TOP2A genes versus classic chemotherapy in the treatment of breast cancer: A comparative effectiveness study. Oncol. Lett. 2021, 21, 21. [Google Scholar] [CrossRef]
- Berclaz, L.M.; Altendorf-Hofmann, A.; Dürr, H.R.; Klein, A.; Angele, M.K.; Albertsmeier, M.; Schmidt-Hegemann, N.S.; Di Gioia, D.; Knösel, T.; Lindner, L.H. Expression Patterns of TOP2A and SIRT1 Are Predictive of Survival in Patients with High-Risk Soft Tissue Sarcomas Treated with a Neoadjuvant Anthracycline-Based Chemotherapy. Cancers 2021, 13, 4877. [Google Scholar] [CrossRef]
- Yin, X.; Wang, Z.; Wang, J.; Xu, Y.; Kong, W.; Zhang, J. Development of a novel gene signature to predict prognosis and response to PD-1 blockade in clear cell renal cell carcinoma. Oncoimmunology 2021, 10, 1933332. [Google Scholar] [CrossRef] [PubMed]


|
GEO Accession | Samples (n) | Year | Platform | Sample Characteristics | Reference | ||
|---|---|---|---|---|---|---|---|
| Total | BCa | Controls | |||||
| GSE3167 | 60 | 46 | 14 | 2005 | GPL96 (HG-U133A) Affymetrix Human Genome U133A Array |
| [82] |
| GSE7476 | 12 | 9 | 3 | 2007 | GPL570 (HG-U133_Plus_2) Affymetrix Human Genome U133 Plus 2.0 Array |
| [83] |
| GSE13507 | 232 | 170 | 62 | 2010 | GPL6102 Illumina human-6 v2.0 expression beadchip |
| [64] |
| GSE21142 | 24 | 12 | 12 | 2013 | GPL10274 Affymetrix GeneChip Human Genome U133 Plus 2.0 Array (Brainarray CustomCDF, GU133Plus2_Hs_UG_Version 12.cdf) |
| [84] |
| GSE23732 | 8 | 7 | 1 | 2012 | GPL6244 (HuGene-1_0-st) Affymetrix Human Gene 1.0 ST Array (transcript (gene) version) |
| - |
| GSE24152 | 17 | 10 | 7 | 2010 | GPL6791 Affymetrix GeneChip Human Genome U133 Plus 2.0 Array (CDF: Hs_ENTREZG_10) |
| [85] |
| GSE31189 | 92 | 52 | 40 | 2013 | GPL570 (HG-U133_Plus_2) Affymetrix Human Genome U133 Plus 2.0 Array |
| [86] |
| GSE37815 | 24 | 18 | 6 | 2013 | GPL6102 Illumina human-6 v2.0 expression beadchip |
| [87] |
| GSE38264 | 38 | 28 | 10 | 2014 | GPL6244 (HuGene-1_0-st) Affymetrix Human Gene 1.0 ST Array (transcript (gene) version) |
| [88] |
| GSE40355 | 24 | 16 | 8 | 2013 | GPL13497 Agilent-026652 Whole Human Genome Microarray 4x44K v2 (Probe Name version) |
| [89] |
| GSE41614 | 10 | 5 | 5 | 2013 | GPL5175 (HuEx-1_0-st) Affymetrix Human Exon 1.0 ST Array (transcript (gene) version) |
| [90] |
| GSE42089 | 18 | 10 | 8 | 2013 | GPL9828 (HG-U133_Plus_2) Affymetrix Human Genome U133 Plus 2.0 Array (CDF: Brainarray Hs133P_Hs_ENTREZG version 10) |
| [91] |
| GSE45184 | 6 | 3 | 3 | 2013 | GPL14550 Agilent-028004 SurePrint G3 Human GE 8x60K Microarray (Probe Name Version) |
| [92] |
| GSE52519 | 12 | 9 | 3 | 2013 | GPL6884 Illumina HumanWG-6 v3.0 expression beadchip |
| [93] |
| GSE65635 | 12 | 8 | 4 | 2015 | GPL14951 Illumina HumanHT-12 WG-DASL V4.0 R2 expression beadchip |
| [93] |
| GSE76211 | 6 | 3 | 3 | 2017 | GPL17586 (HTA-2_0) Affymetrix Human Transcriptome Array 2.0 (transcript (gene) version) |
| [94] |
| GSE100926 | 6 | 3 | 3 | 2017 | GPL14550 Agilent-028004 SurePrint G3 Human GE 8x60K Microarray (Probe Name Version) |
| [95] |
| GSE121711 | 18 | 8 | 10 | 2019 | GPL17586 (HTA-2_0) Affymetrix Human Transcriptome Array 2.0 (transcript (gene) version) |
| [96] |
| Total | 619 | 417 | 202 | -- | -- | -- | -- |
| |log2FC| | No of Features (DEGs) | AUC | Sensitivity | Specificity |
| 1 | 1295 | 0.9525 | 0.7964 | 0.9366 |
| 1.1 | 1099 | 0.9517 | 0.7934 | 0.9327 |
| 1.2 | 929 | 0.9527 | 0.7842 | 0.9346 |
| 1.3 | 815 | 0.9531 | 0.7985 | 0.9334 |
| 1.4 | 725 | 0.9510 | 0.7996 | 0.9322 |
| 1.5 | 625 | 0.9516 | 0.8022 | 0.9342 |
| 1.6 | 549 | 0.9487 | 0.7929 | 0.9278 |
| 1.7 | 495 | 0.9482 | 0.7844 | 0.9312 |
| 1.8 | 442 | 0.9510 | 0.7966 | 0.9298 |
| 1.9 | 407 | 0.9519 | 0.8001 | 0.9288 |
| 2.0 | 364 | 0.9507 | 0.7903 | 0.9356 |
| A. Genes Included in the Final Ranked List Aggregated from the 10 Topological cytoHubba Methods | |||
|---|---|---|---|
| IL6, VEGFA, CCNB1, BRCA1, CCNA2, CD44, TYMS, CDH1, LMNB1, AURKB, EZH2, MKI67, KIF23, ECT2, MCM4, CDC6, PLK1, CDC25C, CDKN3, CENPA, MMP2, TOP2A, CENPE, PBK, NDC80, FOXM1, SPP1, IGF1, UBE2C, RRM2, KIF11, CHEK1, CD8A, CCNB2, ASPM, NCAM1, FLNA, LGALS4, ITPR1, DLGAP5, CDCA8, COL5A1, TIMELESS, CDC20, DMD, PPARGC1A, WNT5A, BUB1, KIF20A, EXO1, CDC25A, VCL, LUM, CCND2, CD34, MCM2, MAD2L1, HPGDS, ISL1, ESRP1, SKP2, NCAPG, CENPU, HJURP, CCL2, TPM1, CDH11, PLK4, FABP4, H2AFX, GJA1, DHCR7, PTGS2, MSN, ANXA5, COL6A1, TRIP13, OIP5, MYH11, KRT20, TTK, MYL9, CAV1, FBXO5, PROM1, BMP4, CDT1, KIAA0101, CCNE1, ANXA1, FGFR3, SNCA, ATAD2, ESPL1, FASN, NT5E, ZWINT, SDC1, FGF2, NEK2, ACTG2, KIF14, COL3A1, EPCAM, ASF1B, IGFBP5, RAD54L, CYP1B1, STMN1, COL4A5, ATF3, CASC5, CENPM, ERBB3, DNMT3B, ITGB2, ISG15, ANK2, CDC45, PLAT, TACC3, EGR1, MYLK, CTSG, GINS2, ITGA8, CENPF, TGFBR2, OGN | |||
| B. Genes included in the first three clusters of MCODE | |||
| Cluster | Score | Nodes | Gene clusters |
| 1 | 74.268 | 83 | PLK4, TRIP13, CDC45, PBK, RRM2, ERCC6L, CHAF1A, DEPDC1, DLGAP5, ASPM, E2F8, MAD2L1, CDCA8, CCNB1, BRCA1, FANCI, FBXO5, CENPA, KIAA0101, TK1, TACC3, DTL, CDCA3, HJURP, CENPE, ZWINT, ESPL1, POLQ, OIP5, CDC25C, ASF1B, CDKN3, POLE2, CCNB2, CHAF1B, EZH2, UBE2C, RAD54L, CDT1, MCM5, CDC20, TROAP, CKS2, NEK2, SPC25, MKI67, CHEK1, TTK, CDC6, GINS2, BUB1, CENPU, CCNE2, STIL, KIF14, TYMS, CDC7, MCM2, KIF23, KNTC1, SKA1, CASC5, CENPF, HELLS, NUSAP1, ATAD2, CEP55, NCAPG, MCM4, NDC80, ECT2, TOP2A, CENPM, CDC25A, MCM10, ORC1, KIF20A, AURKB, CCNA2, PLK1, EXO1, FOXM1, KIF11 |
| 2 | 18 | 23 | CXCL12, PTGS2, BMP4, IL6, GJA1, CD34, FGF2, NES, PROM1, CD8A, VEGFA, CD44, SDC1, SPP1, ANXA5, NCAM1, SELP, CCL2, CCL5, IGF1, CSF1R, NT5E, SELE |
| 3 | 7.923 | 27 | TGFBI, COL6A2, THBS2, TPM1, MYH11, ACTG2, COL6A1, COL13A1, COL3A1, TGFBR2, VCL, FBLN2, COL4A5, CTSK, LYVE1, CLDN5, ANGPT2, LUM, MYL9, LEPREL1, TPM2, SPARC, MYLK, CAV1, ADAMTS5, TAGLN, FMOD |
| C. Common genes between cytoHubba and MCODE | |||
| IL6, VEGFA, CCNB1, BRCA1, CCNA2, CD44, TYMS, AURKB, EZH2, MKI67, KIF23, ECT2, MCM4, CDC6, PLK1, CDC25C, CDKN3, CENPA, TOP2A, CENPE, PBK, NDC80, FOXM1, SPP1, IGF1, UBE2C, RRM2, KIF11, CHEK1, CD8A, CCNB2, ASPM, NCAM1, DLGAP5, CDCA8, CDC20, BUB1, KIF20A, EXO1, CDC25A, VCL, LUM, CD34, MCM2, MAD2L1, NCAPG, CENPU, HJURP, CCL2, TPM1, PLK4, GJA1, PTGS2, ANXA5, COL6A1, TRIP13, OIP5, MYH11, TTK, MYL9, CAV1, FBXO5, PROM1, BMP4, CDT1, KIAA0101, ATAD2, ESPL1, NT5E, ZWINT, SDC1, FGF2, NEK2, ACTG2, KIF14, COL3A1, ASF1B, RAD54L, COL4A5, CASC5, CENPM, CDC45, TACC3, MYLK, GINS2, CENPF, TGFBR2 | |||
| Module | Common Hub Genes |
|---|---|
| turquoise | ACTG2, ANXA5, AURKB, BUB1, CD34, CD44, CDC25A, CDT1, CENPM, ESPL1, EXO1, FGF2, GINS2, KIF20A, NCAM1 |
| brown | CAV1, COL3A1, COL4A5, IGF1, LUM, MYLK, PROM1, SDC1, SPP1, TPM1, VCL, VEGFA |
| black | ASPM, CCNA2, CCNB1, CCNB2, CDC20, CDC45, CDCA8, CDKN3, CENPA, CENPF, CENPU, DLGAP5, ECT2, EZH2, FOXM1, HJURP, KIF11, KIF14, KIF23, MCM2, MCM4, MKI67, NCAPG, NDC80, NEK2, PBK, PLK4, RAD54L, TOP2A, TTK, UBE2C, ZWINT |
| blue | -- |
| green | COL6A1, MYH11 |
| yellow | -- |
| Univariate Analysis | Multivariate Analysis | |||
|---|---|---|---|---|
| RFS Related Gene | HR (95% CI) | p-Value | HR (95% CI) | p-Value |
| ACTG2 | 1.2 (1–1.4) | 1.40 × 10⁻² * | -- | -- |
| AURKB | 2.1 (1.5–3) | 3.30 × 10⁻⁵ **** | -- | -- |
| BUB1 | 1.8 (1.2–2.6) | 1.90 × 10⁻³ ** | -- | -- |
| CDC25A | 3.1 (1.6–5.9) | 9.80 × 10⁻⁴ *** | -- | -- |
| CDT1 | 1.9 (1.4–2.6) | 1.00 × 10⁻⁴ *** | -- | -- |
| CENPM | 2.1 (1.4–3.1) | 1.90 × 10⁻⁴ *** | -- | -- |
| ESPL1 | 2.8 (1.7–4.6) | 5.30 × 10⁻⁵ **** | -- | -- |
| EXO1 | 3.8 (1.9–7.7) | 2.50 × 10⁻⁴ *** | -- | -- |
| GINS2 | 1.8 (1.2–2.5) | 1.40 × 10⁻³ ** | -- | -- |
| KIF20A | 1.8 (1.3–2.5) | 6.00 × 10⁻⁴ *** | -- | -- |
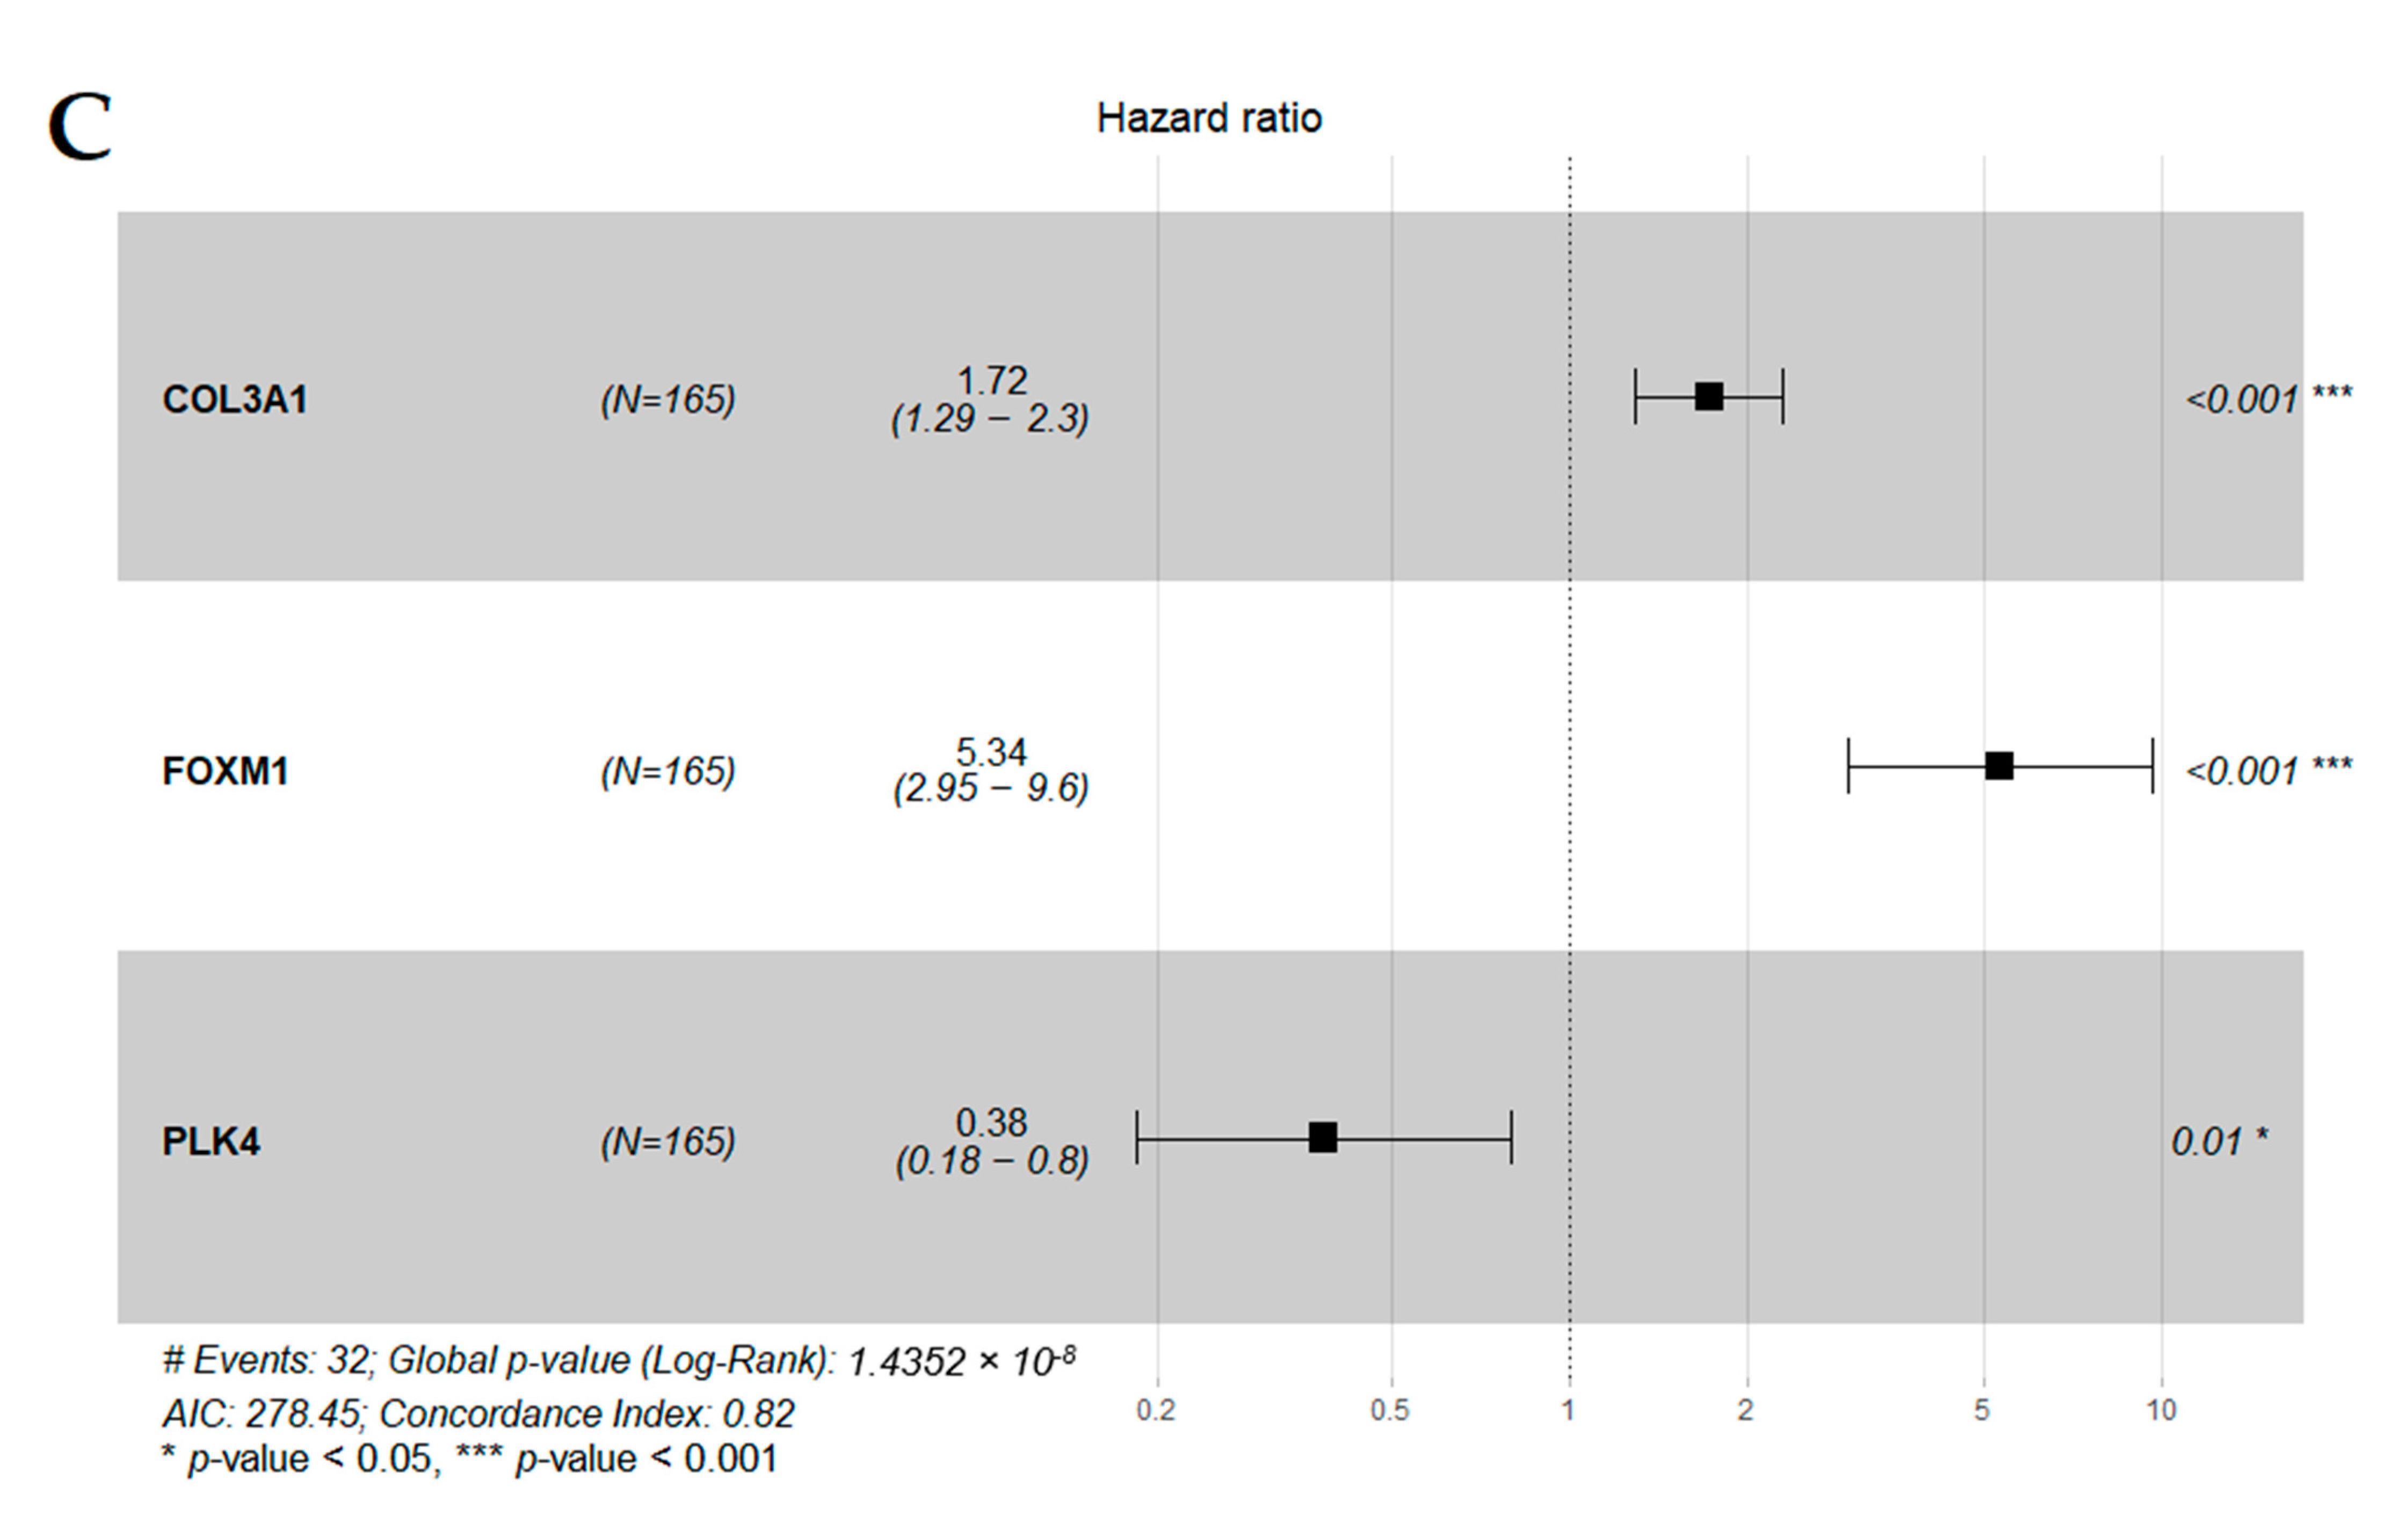
| COL3A1 | 1.5 (1.1–1.9) | 3.50 × 10⁻³ ** | 1.72 (1.29–2.29) | 0.000223 *** |
| COL4A5 | 0.66 (0.51–0.85) | 1.70 × 10⁻³ ** | -- | -- |
| LUM | 1.3 (1–1.6) | 1.80 × 10⁻² * | -- | -- |
| SPP1 | 1.4 (1.1–1.7) | 4.80 × 10⁻³ ** | -- | -- |
| ASPM | 1.9 (1.4–2.6) | 5.40 × 10⁻⁵ **** | -- | -- |
| CCNA2 | 1.6 (1.2–2.3) | 2.50 × 10⁻³ ** | -- | -- |
| CCNB1 | 1.7 (1.1–2.6) | 1.00 × 10⁻² * | -- | -- |
| CCNB2 | 1.8 (1.3–2.4) | 9.90 × 10⁻⁵ **** | -- | -- |
| CDC20 | 1.7 (1.3–2.3) | 1.90 × 10⁻⁴ *** | -- | -- |
| CDC45 | 2.7 (1.7–4.2) | 1.30 × 10⁻⁵ **** | -- | -- |
| CDCA8 | 2.2 (1.5–3.2) | 2.40 × 10⁻⁵ **** | -- | -- |
| CDKN3 | 2.1 (1.5–3) | 3.40 × 10⁻⁵ **** | -- | -- |
| CENPA | 1.8 (1.3–2.5) | 2.70 × 10⁻⁴ *** | -- | -- |
| CENPF | 2 (1.5–2.7) | 7.50 × 10⁻⁶ **** | -- | -- |
| CENPU | 1.7 (1.1–2.6) | 2.20 × 10⁻² * | -- | -- |
| DLGAP5 | 1.7 (1.2–2.3) | 1.20 × 10⁻³ ** | -- | -- |
| ECT2 | 3 (1.5–6.2) | 3.00 × 10⁻³ ** | -- | -- |
| EZH2 | 2.2 (1.4–3.4) | 5.30 × 10⁻⁴ *** | -- | -- |
| FOXM1 | 2.7 (1.8–4) | 3.20 × 10⁻⁶ **** | 5.34 (2.95–9.64) | 2.87 × 10⁻⁸ **** |
| HJURP | 2.1 (1.5–2.9) | 4.30 × 10⁻⁵ **** | -- | -- |
| KIF11 | 1.9 (1.3–2.8) | 6.00 × 10⁻⁴ *** | -- | -- |
| KIF14 | 2.4 (1.5–3.7) | 1.40 × 10⁻⁴ *** | -- | -- |
| KIF23 | 3 (1.5–5.7) | 1.20 × 10⁻³ ** | -- | -- |
| MCM2 | 1.7 (1.2–2.3) | 1.70 × 10⁻³ ** | -- | -- |
| MCM4 | 1.4 (1–1.9) | 3.80 × 10⁻² * | -- | -- |
| MKI67 | 9.8 (4–24) | 8.60 × 10⁻⁷ **** | -- | -- |
| NCAPG | 2.1 (1.5–3) | 6.40 × 10⁻⁵ **** | -- | -- |
| NDC80 | 1.5 (1.1–2.1) | 1.30 × 10⁻² * | -- | -- |
| NEK2 | 2.5 (1.4–4.5) | 2.40 × 10⁻³ ** | -- | -- |
| PBK | 1.7 (1.2–2.4) | 2.50 × 10⁻³ ** | -- | -- |
| PLK4 | 1.6 (1–2.5) | 3.90 × 10⁻² * | 0.38 (0.19–0.80) | 0.010188 * |
| RAD54L | 2.3 (1.5–3.4) | 4.40 × 10⁻⁵ **** | -- | -- |
| TOP2A | 1.5 (1.2–1.9) | 1.50 × 10⁻³ ** | -- | -- |
| TTK | 1.8 (1.3–2.4) | 5.50 × 10⁻⁴ *** | -- | -- |
| UBE2C | 2.3 (1.5–3.6) | 2.50 × 10⁻⁴ *** | -- | -- |
| ZWINT | 3 (1.4–6) | 3.00 × 10⁻³ ** | -- | -- |
| Univariate Analysis | Multivariate Analysis | |||
|---|---|---|---|---|
| RFS-Related Gene | HR (95% CI) | p-Value | HR (95% CI) | p-Value |
| ANXA5 | 1.1 (0.70–1.70) | 0.7 | 0.42 (0.24–0.74) | 0.00268 ** |
| CD44 | 1.3 (0.99–1.70) | 0.055 | 1.65 (1.20–2.28) | 0.00220 ** |
| NCAM1 | 1.1 (0.81–1.60) | 0.48 | 1.60 (1.09–2.35) | 0.01718 * |
| IGF1 | 0.48 (0.24–0.98) | 0.043 * | -- | -- |
| SPP1 | 1.5 (1.30–1.80) | 3.3 × 10⁻⁶ **** | 1.72 (1.42–2.09) | 2.93 × 10⁻⁸ **** |
| CDCA8 | 0.5 (0.26–0.96) | 0.037 * | 0.18 (0.08–0.42) | 5.72 × 10⁻⁵ **** |
| KIF14 | 1.8 (0.87–3.70) | 0.11 | 4.68 (2.17–10.11) | 8.59 × 10⁻⁵ **** |
| CSS-Related Gene | HR (95% CI) | p-Value | ||
| ANXA5 | 1.1 (0.68–1.70) | 0.74 | 0.44 (0.24–0.82) | 0.009708 ** |
| CD44 | 1.3 (0.95–1.60) | 0.11 | 1.60 (1.12–2.29) | 0.009785 ** |
| NCAM1 | 1.1 (0.82–1.60) | 0.47 | 1.43 (0.99–2.05) | 0.049989 * |
| SPP1 | 1.4 (1.20–1.70) | 5.8 × 10⁻⁵ **** | 1.64 (1.35–2.01) | 1.15 × 10⁻⁶ **** |
| CDCA8 | 0.48 (0.24–0.94) | 0.034 * | 0.17 (0.07–0.41) | 6.49 × 10⁻⁵ **** |
| KIF14 | 1.7 (0.84–3.60) | 0.14 | 4.82 (2.12–10.96) | 0.000171 *** |
| OS-Related Gene | HR (95% CI) | p-Value | ||
| ACTG2 | 1.3 (1.00–1.60) | 0.038 * | -- | -- |
| ANXA5 | 0.97 (0.63–1.50) | 0.9 | 0.41 (0.23–0.72) | 0.002139 ** |
| CD44 | 1.2 (0.96–1.60) | 0.095 | 1.63 (1.17–2.28) | 0.003812 ** |
| NCAM1 | 1.1 (0.82–1.50) | 0.48 | 1.42 (1.00–2.01) | 0.047272 * |
| SPP1 | 1.4 (1.20–1.60) | 0.00012 *** | 1.60 (1.32–1.92) | 1.1 × 10⁻⁶ **** |
| CDCA8 | 0.48 (0.25–0.91) | 0.024 * | 0.19 (0.09–0.42) | 5.0 × 10⁻⁵ **** |
| KIF14 | 1.6 (0.78–3.20) | 0.21 | 4.45 (2.01–9.85) | 0.000225 *** |
| Highlights of This Study |
|
Publisher’s Note: MDPI stays neutral with regard to jurisdictional claims in published maps and institutional affiliations. |
© 2022 by the authors. Licensee MDPI, Basel, Switzerland. This article is an open access article distributed under the terms and conditions of the Creative Commons Attribution (CC BY) license (https://creativecommons.org/licenses/by/4.0/).
Share and Cite
Sarafidis, M.; Lambrou, G.I.; Zoumpourlis, V.; Koutsouris, D. An Integrated Bioinformatics Analysis towards the Identification of Diagnostic, Prognostic, and Predictive Key Biomarkers for Urinary Bladder Cancer. Cancers 2022, 14, 3358. https://doi.org/10.3390/cancers14143358
Sarafidis M, Lambrou GI, Zoumpourlis V, Koutsouris D. An Integrated Bioinformatics Analysis towards the Identification of Diagnostic, Prognostic, and Predictive Key Biomarkers for Urinary Bladder Cancer. Cancers. 2022; 14(14):3358. https://doi.org/10.3390/cancers14143358
Chicago/Turabian StyleSarafidis, Michail, George I. Lambrou, Vassilis Zoumpourlis, and Dimitrios Koutsouris. 2022. "An Integrated Bioinformatics Analysis towards the Identification of Diagnostic, Prognostic, and Predictive Key Biomarkers for Urinary Bladder Cancer" Cancers 14, no. 14: 3358. https://doi.org/10.3390/cancers14143358
APA StyleSarafidis, M., Lambrou, G. I., Zoumpourlis, V., & Koutsouris, D. (2022). An Integrated Bioinformatics Analysis towards the Identification of Diagnostic, Prognostic, and Predictive Key Biomarkers for Urinary Bladder Cancer. Cancers, 14(14), 3358. https://doi.org/10.3390/cancers14143358