Simple Summary
In general, brachytherapy (BT) improves biochemical control in intermediate-to high-risk prostate cancer. We previously reported that importance of very high-risk factors (VHR: T3b–4 or Gleason score 9–10) and patients with double VHR (VHR-2) showed the worst prognosis among high-risk groups. We explored the role of BT-boost in patients with VHR and compared it to intermediate- and other high-risk groups. We confirmed that BT-boost improved prostate-specific antigen (PSA) control but resulted in equivalent overall survival rates for the intermediate- and high-risk groups, except for the patients with VHR. In the VHR-1 group (single VHR), BT-boost showed superior PSA control to conventional-dose RT (EQD2 ≤ 72 Gy) but not to the dose-escalated radiotherapy group (EQD2 ≥ 74 Gy). In the VHR-2 group, BT-boost did not improve the biochemical control rate of either Conv RT or DeRT. BT-boost showed no benefit over modern DeRT in the patients with VHR.
Abstract
This study examined the role of brachytherapy boost (BT-boost) and external beam radiotherapy (EBRT) in intermediate- to high-risk prostate cancer, especially in patients with very high-risk factors (VHR: T3b–4 or Gleason score 9–10) as patients with double very high-risk factors (VHR-2: T3b–4 and Gleason score 9–10) previously showed worst prognosis in localized prostate cancer. We retrospectively reviewed multi-institutional data of 1961 patients that were administered radiotherapy (1091 BT-boost and 872 EBRT: 593 conventional-dose RT (Conv RT: equivalent to doses of 2 Gy per fraction = EQD2 ≤ 72 Gy) and 216 dose-escalating RT (DeRT = EQD2 ≥ 74 Gy). We found that BT-boost improved PSA control and provided an equivalent overall survival rate in the intermediate- and high-risk groups, except for patients within the VHR factor group. In the VHR-1 group (single VHR), BT-boost showed a superior biochemical control rate to the Conv RT group but not to the DeRT group. In the VHR-2 group, BT-boost did not improve outcomes of either Conv RT or DeRT groups. In conclusion, BT-boost showed no benefit to modern DeRT in the patients with VHR; therefore, they are not good candidates for BT-boost to improve outcome and may be amenable to clinical trials using multimodal intensified systemic treatments.
1. Introduction
Dose escalation in radiotherapy is an established strategy to improve the biochemical control rate in clinically localized through intermediate- and high-risk localized prostate cancer [1,2,3,4]. Brachytherapy boost (BT-boost) combined with external beam radiotherapy (EBRT) is a good option to elevate the prescribed dose of radiotherapy without increasing the toxicity due to the superior character of the BT; the rapid falloff of the dose gradient enables us to treat tumors at high doses while maintaining low doses to the surrounding organs at risk. Retrospective [4,5,6,7,8] and prospective analyses, including three randomized controlled trials [9,10,11,12], as well as meta-analysis, confirmed the benefit of biochemical control for BT-boost [13].
Recent exploration of risk stratification has introduced a new concept of very high-risk factors (VHR). The most widely used risk classification system in clinics is the National Comprehensive Cancer Network (NCCN) [14], in which the VHR includes a >4 biopsy cores with a Gleason score of 8–10, clinical stage T3b–T4 or primary Gleason score of 5, [14]. For risk stratification including VHR, summation of the number of VHRs (T3b–4 and Gleason score 9–10) was a useful system to identify the worst oncological population [15]. As data were scarce regarding the merits of dose escalation in patients with VHR, the present study examined the role of dose escalation with BT-boost in patients with intermediate- to high-risk cancer as well as VHR. In addition, the NCCN Clinical Practice Guidelines in Oncology stated that doses of ≤70 Gy in conventional fractions are not sufficient for the treatment of intermediate- or high-risk prostate cancer [14,15]. Therefore, we divided the control group into conventional dose (Conv RT, doses ≤ 72 Gy) and dose-escalated radiotherapy (DeRT, prescribed dose of ≥74 Gy, equivalent to doses of 2 Gy per fraction [EQD2]) groups.
Therefore, this study examined the role of BT-boost in patients with VHR for the prognostication of clinically localized high-risk prostate cancer.
2. Materials and Methods
2.1. Patients
We used freely available public data to analyze a large cohort of 1961 patients; among these, 1145 BT-boost (1091 patients administered high-dose BT (HDR-BT) boost from open data for public use [16] and 63 patients treated with low-dose BT (LDR-BT) boost at the Kyoto Prefectural Medical School) [17]. This study included a total of 809 patients administered EBRT (388 administered Conv RT as identified from open data) and 421 patients [16] administered DeRT using intensity-modulated radiotherapy [IMRT] from open data [16] at Uji Takeda Hospital [18] (Table 1). Patients eligible for this study were treated with EBRT with BT-boost or EBRT alone; had histology-proven adenocarcinoma with clinical TNM stage T1–T4N0M0 disease; and had accessible and available data on T classification, Gleason score sum, and initial PSA [iPSA] level. The patients categorized as intermediate or high risks were eligible according to the NCCN risk classification [14]. A simple VHR index was calculated and applied by summing the number of VHR factors in the high-risk group: VHR-0, no VHR; VHR-1, Gleason score 9–10 or T3b–T4; VHR-2, Gleason score = 9–10 and T3b–T4 [19].

Table 1.
Patients’ characteristics.
We defined PSA failure according to the Phoenix definitions (nadir, +2 ng/mL).
Prostate cancer-specific mortality (PCSM) was defined when prostate cancer was the primary cause of death. Biochemical disease-free survival (bDFS), PCSM, overall survival (OS), and metastasis-free survival (MFS) rates were defined as the intervals from the start of RT to bDFS, distant metastasis, PCSM, and death, respectively.
Patients included in the public data provided informed consent during the process of building the database and all patients from Uji Takeda Hospital and Kyoto Prefectural Medical School provided written informed consent [19]. This study was approved by the Institutional Review Board of the Kyoto Prefectural University of Medicine (ERB-C-1403) and conducted by the principles of the Declaration of Helsinki.
2.2. Treatment Planning
2.2.1. BT-Boost
The BT-boost groups included HDR-BT and LDR-BT. A multi-institution data of HDR-BT was provided from an open data source [16], and details of treatment have been described elsewhere [20,21]. In brief, the median dose of HDR-BT was 31.5 Gy (range, 10.5–31.5 Gy) in median fraction size 6.3 Gy (range, 5–11 Gy) combined with EBRT in various dose and fractions (median 3 Gy; range, 1.9–3.1 Gy) (Supplemental Table S1). The detailed treatment schedule for LDR-BT (Iodine-125 implantation) was described previously [17]. We included patients with T3a disease or Gleason score sum ≤ 8 or a summed Gleason score of 7 (4 + 3), but not for those with a summed Gleason score of 7 (3 + 4) [17] using prescription dose 110 Gy (LDR-BT) with EBRT by three-dimensional conformal radiotherapy (3D-CRT) 40 Gy/20 fractions (Supplemental Table S1). Whole pelvic RT were used in several institutions as a part of EBRT (Supplemental Table S1).
2.2.2. External Beam Radiotherapy (EBRT)
The EBRT group consisted of conventional two-dimensional treatment, 3D-CRT, and IMRT. Supplemental Table S1 depicted the details of patient backgrounds. A freely accessible dataset (n = 417) was used to draw some of EBRT data [16]; 141 image-guided IMRTs using helical TomoTherapy were performed at the Department of Radiology, Uji Takeda Hospital, and detailed technique has been described elsewhere [18]. In brief, the prescribed dose was 74 Gy/37 fractions (2 Gy/fraction, n = 79) or 74.8 Gy/34 fractions (2.2 Gy/fraction, n = 62) for the intermediate-risk and high-risk and groups [18]. We divided a control group into conventional dose group (Conv RT) using does up to 72 Gy and dose-escalated radiotherapy (DeRT) using dose 74 Gy or more in equivalent to doses of 2 Gy per fraction (EQD2). Detail of treatment schedules was depicted in Supplemental Table S1.
2.3. Statistical Analysis
EZR stat package [22] and StatView 5.0 (SAS Institute, Inc., Cary, NC, USA) were used to perform the statistical analyses. Percentages were analyzed using Fisher’s exact tests for two groups and chi-square tests for three or more groups. To compare means or medians, Student t-tests were used for normally distributed data, and Mann–Whitney U- and Kruskal–Wallis tests for skewed data (i.e., PSA values) [22]. To analyze the biochemical disease-free survival rate (bDFS), distant metastasis-free survival (DMSF), overall survival (OS), and prostate cancer-specific survival rate (PCS), the Kaplan–Meier method was used. Log-rank tests and Bonferroni correction comparisons were performed in analysis of statistically significance. Cox’s proportional hazard model for bDFS was used for univariate and multivariate analyses. Statistical significance was set at p < 0.05. The propensity score was the probability of being assigned to each group and was calculated using a logistic regression model constructed with the baseline covariates shown in Table 2 (age, T classification, GS, pretreatment PSA, and hormonal therapy history). We used propensity score matching to reduce the selection bias for BT-boost or EBBT (a 1:1 matched cohort was made for comparison of BT-boost and EBRT in the total population and BT-boost versus DeRT).

Table 2.
Detailed patient characteristics among subgroups.
3. Results
3.1. Patient and Disease Characteristics
All 1961 patients with intermediate-to-high-risk prostate cancer were treated with either BT-boost (n = 1152) or EBRT (n = 809). The median patient age was 71 years (range, 49–89 years). The median initial PSA value was 14.0 ng/mL (range, 2.682–1454 ng/mL). The clinical characteristics of the patients are summarized in Table 1. The median follow-up duration was 69.0 (range: 2–177) months.
3.2. Biochemical Control Rates (Biochemical Disease-Free Survival Rate; bDFS)
The actuarial 5-year bDFS rates were 89.9% (95% confidence interval [CI]: 88.3–91.2%) at 5 years and 78.2% (95% CI: 74.9–81.2%) at 10 years. The bDFS differed significantly among the four risk groups (p < 0.0001; Figure 1a).
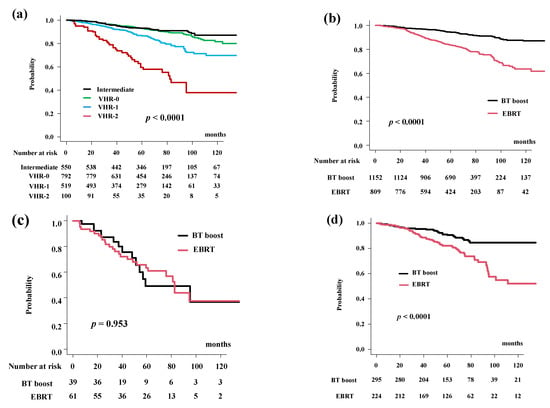
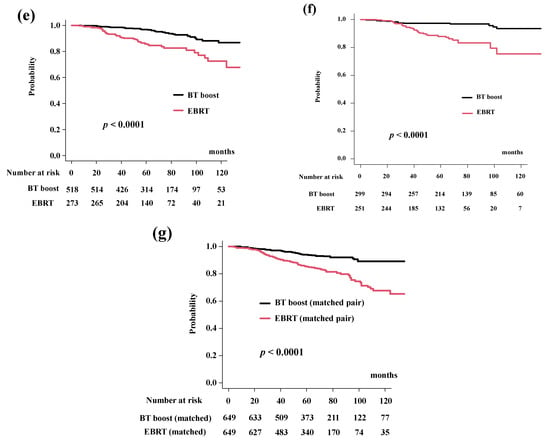
Figure 1.
Biochemical control rates (biochemical disease-free survival rate; bDFS). (a) bDFS according to risk stratification. bDFS rates were 59.6% (95% CI: 47.5–69.7%), 86.8% (95% CI: 83.1–89.7%), 93.0% (95% CI: 90.8%–94.8%), 93.3% (95% CI: 90.7%–95.2%) at 5 years in the VHR-2, VHR-1, VHR-0, and intermediate groups, respectively (p < 0.0001). (b) Comparison of bDFS between EBRT and BT-boost. (c) Comparison of bDFS between EBRT and BT-boost in VHR-2 group. (d) Comparison of bDFS between EBRT and BT-boost in VHR-1 group. (e) Comparison of bDFS between EBRT and BT-boost in VHR-0 group, (f) Comparison of bDFS between EBRT and BT-boost in intermediate-risk group. (g) Comparison of bDFS between EBRT and BT-boost using matched pair analysis.
BT-boost improved the bDFS to 94.2% (95% CI: 92.5–95.5%) at 5 years and 86.9% (95% CI: 83.4–89.8%) at 10 years compared to those in the EBRT group (83.7%, 95% CI: 80.7–86.3% at 5 years and 63.7%, 95% CI: 56.8–69.7% at 10 years) (Figure 1b, p < 0.0001).
The BT-boost group showed superior bDFS compared to that for EBRT in all groups, except for the VHR-2. The BT-boost group had bDFS rates of 49.1% (95% CI: 27.0–67.9%), 90.5% (95% CI: 85.8–93.8%), 96.9% (95% CI: 94.7–98.1%), 97.3% (95% CI: 94.6–98.6%) at 5 years in the VHR-2, VHR-1, VHR-0, and intermediate groups, respectively. The EBRT group had bDFS rates of 63.4% (95% CI: 48.8–74.8%, p = 0.953, Figure 1c), 82.2% (95% CI: 76.1–86.9%, p < 0.0001, Figure 1d), 85.8% (95% CI: 80.5–89.7%, p < 0.0001, Figure 1e), 87.9% (95% CI: 82.5–91.7%, p < 0.0001, Figure 1f) at 5-years in the VHR-2, VHR-1, VHR-0, and intermediate groups, respectively.
We applied propensity score matching to generate well-matched pairs (649 and 649 patients; background comparisons are shown in Supplemental Table S1b). The actuarial 5-year biochemical control rates were 93.9% (95% CI: 91.5–95.7%) and 85.3% (95% CI: 82.0–88.0%, p < 0.0001, Figure 1g) in the BT-boost and EBRT groups, respectively.
3.3. Subgroup Analysis (DeRT, Conv RT vs. BT-Boost)
After dividing EBRT into the Conv RT and DeRT groups (Table 2), the bDFS for each group were 94.2% (95% CI: 92.5%–95.5%), 89.1% (95% CI: 85.2–92.0%), and 79.0% (95% CI: 74.3–82.9%) at 5 years and 86.9% (95% CI: 83.4–89.8%), not available (86.4% at 74 months; 95% CI: 81.5–90.0%), 58.0% (95% CI: 50.9–64.5) at 10 years in the BT-boost group, DeRT and Conv RT group (Figure 2a). BT-boost showed the best outcome among the three groups, with a statistically significant difference not only between the Conv and BT-boost groups but also between the DeRT and BT-boost groups (Figure 2a).
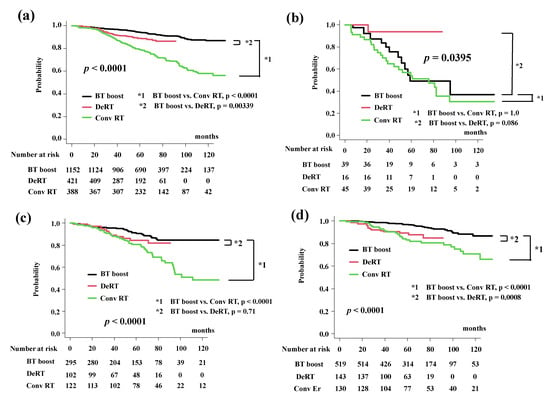
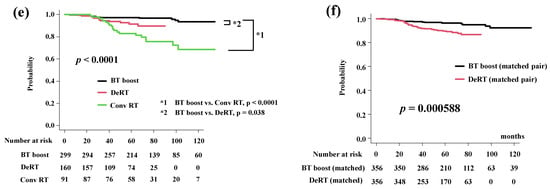
Figure 2.
Biochemical control rates among three groups (BT-boost vs. Conv RT vs. DeRT). (a) Comparison of bDFS among three groups. (b) Comparison of bDFS among three groups in VHR-2 group. (c) Comparison of bDFS among three groups in VHR-1 group. (d) Comparison of bDFS among three groups in VHR-0 group. (e) Comparison of bDFS among three groups in intermediate-risk group. (f) Comparison of bDFS between dose escalated radiotherapy (DeRT) and BT-boost using matched pair analysis. bDFS = biochemical disease-free survival rate.
In detailed analysis, BT-boost showed the better outcome not only than Conv RT but also DeRT, except in patients with VHR. The BT-boost group had bDFS rates of 49.1% (95% CI: 27.0–67.9%), 90.5% (95% CI: 85.8–93.8%,), 96.9% (95% CI: 94.7–98.1%), and 97.3% (95% CI: 94.6–98.6%) at 5 years for the VHR-2, VHR-1, VHR-0 and intermediate groups, respectively, while the Conv RT and DeRT group had rates of 54.2% (95% CI: 37.7–68.0%, p = 1.0 in comparison to BT-boost, Figure 2b), 80.8% (95% CI: 72.2–86.9%, p < 0.0001, Figure 2c), 83.2% (95% CI: 74.8–89.0%, p < 0.0001, Figure 2d), 82.9% (95% CI: 72.9–89.5%, p < 0.0001, Figure 2e) and 93.7% (95% CI: 63.2–99.1%, p = 0.086, Figure 2b), 84.5% (95% CI: 74.6–90.8%, p = 0.71, Figure 2c), 89.2% (95% CI: 82.3–93.5%, p = 0.0008, Figure 2d), 91.4% (95% CI: 84.8–95.3%, p = 0.038, Figure 2e), at 5 years. We generated well-matched pairs for the comparison between BT-boost and DeRT (356 patients each; the background comparisons are shown in Supplemental Table S2) using propensity score matching. The actuarial 5-year biochemical control rates in the BT-boost and DeRT groups were 96.3% (95% CI: 93.5–97.9%) and 89.6% (95% CI: 85.5–92.6%, p = 0.000588, Figure 2f), respectively.
As shown in Table 3, the predictors of biochemical control on multivariate analysis included age, treatment modality (BT-boost vs. EBRT or DeRT or Conv RT), iPSA, T classification, and Gleason score sum.

Table 3.
Multivariate analysis for PSA control.
3.4. Distant Metastasis-Free Survival (DMFS) Rates
The DMFS rates were 97.2% (95% CI: 96.3–97.9%) at 5 years and 93.3% (95% CI: 90.9–95.0%) at 10 years. The BT-boost group had DMSF rates of 96.9% (95% CI: 95.5–97.8%) at 5 years and 93.1% (95% CI: 90.1–95.2%) at 10 years. The DMFS rates differed significantly among the four risk groups (p < 0.0001; Figure 3a). The EBRT group had PCSM rates of 97.7% (95% CI: 96.2–98.6%) at 5 years and 93.4% (95% CI: 88.9%–96.1%) at 10 years (p = 0.647, Figure 3b).
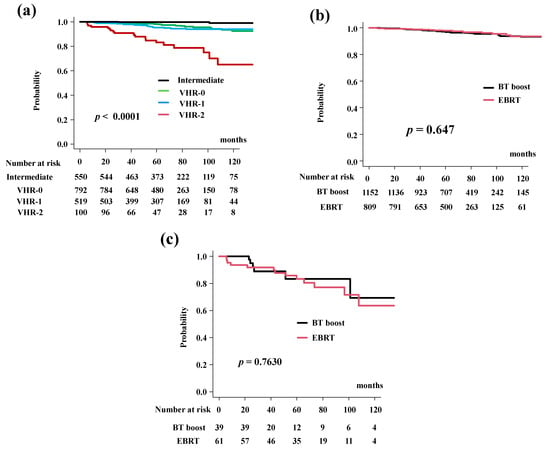
Figure 3.
Distant metastasis-free survival rate (DMFS). (a) DMFS according to risk stratification. DMSF were 83.2% (95% CI: 72.9–89.8%), 95.4% (95% CI: 92.9–97.1%), 98.2% (95% CI: 96.8%–99.0%), 99.8% (95% CI: 94.8%–100%) at 5 years in the VHR-2, VHR-1, VHR-0, and intermediate groups, respectively (p < 0.0001). (b) Comparison of DMFS between EBRT and BT-boost. (c) Comparison of DMFS between EBRT and BT-boost in VHR-2 group.
The BT-boost group showed DMSF equivalent to EBRT in all groups. The BT-boost group had DMSF rates of 96.9% (95% CI: 62.7–93.2%), 93.7% (95% CI: 89.5–96.3%), 97.7% (95% CI: 95.6–99.7%), 99.7% (95% CI: 97.6–100%) at 5 years in the VHR-2, VHR-1, VHR-0 and intermediate groups, respectively, while the rates in the EBRT were 83.3% (95% CI: 70.1%–91.0%, p = 0.7630, Figure 3c), 97.4% (95% CI: 93.8–98.9%, p = 0.0696, Supplemental Figure S1a), 99.6% (95% CI: 97.4–99.9%, p = 0.3840, Supplemental Figure S1b), and 100% (p = 0.304, Supplemental Figure S1c) at 5 years.
3.5. Prostate Cancer-Specific Mortality (PCS)
The cumulative incidence for PCS was 99.2% (95% CI: 98.6–99.5%) at 5 years and 97.5% (95% CI: 95.9–98.5%) at 10 years in the total population. The BT-boost group in the present study had PCS rates of 99.2% (95% CI: 98.4–99.6%) at 5 years and 97.6% (95% CI: 95.4–98.8%) at 10 years. The PCS rates in the EBRT group were 99.1% (95% CI: 98.0–99.6%) at 5 years and 97.4% (95% CI: 94.9–98.6%) at 10 years (Figure 4a, p = 0.334). The PCS rates differed significantly among the four risk groups (p < 0.0001; Figure 4b).
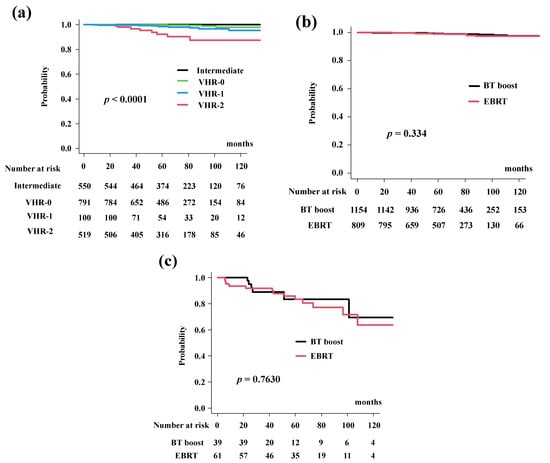
Figure 4.
Prostate cancer specific survival rate (PCS). (a) PCS according to risk stratification. PCS were 93.8% (95% CI: 85.6–97.4), 98.5% (95% CI: 96.6–99.3%), 99.9% (95% CI: 98.5%–99.9%), and 100% at 5 years in the VHR-2, VHR-1, VHR-0, and intermediate groups, respectively (p < 0.0001). (b) Comparison of PCS between EBRT and BT-boost. (c) Comparison of PCS between EBRT and BT-boost in VHR-2 group. The BT-boost group showed equivalent PCS to EBRT in all groups.
In detail, the BT-boost group had PCS rates of 92.3% (95% CI: 70.6–98.2%), 97.6% (95% CI: 64.2–99.0%), 100%, and 100% at 5 years for VHR-2, VHR-1, VHR-0 and intermediate groups, while the EBRT group had a PCS of 92.2% (95% CI: 80.4–97.0%, Figure 4c), 99.5% (95% CI: 96.3–99.9%, p = 0.499, Supplemental Figure S2a), 99.6% (95% CI: 97.4–99.9%, p = 0.877, Supplemental Figure S2b), and 100% at 5-years (Supplemental Figure S2c).
3.6. Overall Survival (OS)
The BT-boost group showed equivalent OS rates of 96.3% (CI: 94.9–97.3%) at 5 years and 91.0% (95% CI: 87.8–93.4%) at 10 years. In the EBRT group, the OS was 98.0% (95% CI: 96.6%–98.9%) at 5 years and 92.8% (95% CI: 89.2–95.2%) at 10 years (Figure 5a, p = 0.35). The OS differed significantly among the four risk groups (p < 0.0001; Figure 5b).
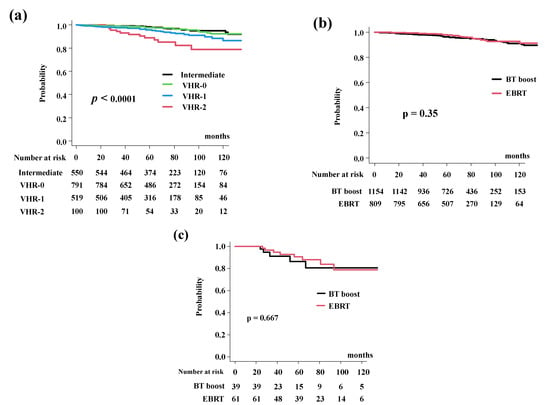
Figure 5.
Overall survival rate (OS). (a) OS according to risk stratification. OS were 89.0% (95% CI: 79.7–94.2%), 95.9% (95% CI: 93.6–97.4%), 97.6% (95% CI: 96.1%–98.6%), 98.5% (95% CI: 96.9%–99.3%) at 5 years in the VHR-2, VHR-1, VHR-0, and intermediate groups, respectively (p < 0.0001). (b) Comparison of bDFS between EBRT and BT-boost. (c) Comparison of bDFS between EBRT and BT-boost in VHR-2 group. The BT-boost group showed an equivalent OS to those for EBRT in all groups.
In detail, the BT-boost group had an OS of 86.3% (95% CI: 66.4–94.8%), 93.6% (95% CI: 89.6–96.1%), 97.6% (95% CI: 95.6–98.7%). and 97.7% (95% CI: 95.0–99.0%), at 5 years for the VHR-2, VHR-1, VHR-0, and intermediate groups. The EBRT group had OS rates of 90.5% (95% CI: 78.5–95.9%, p = 0.667, Figure 5c), 98.9% (95% CI: 95.5–99.7%, p = 0.177, Supplemental Figure S3a), 97.7% (95% CI: 994.6–99.1%, p = 0.322, Supplemental Figure S3b), and 99.6% (95% CI: 97.2–99.9%. p = 0.587, Supplemental Figure S3c), at 5-years.
4. Discussion
The present study explored the role of BT-boost in intermediate- to high-risk prostate cancer. The results demonstrated that BT-boost showed superior bDFS compared to that in the EBRT group except for the VHR-2 group. To our knowledge, this is the first report to show the merits and limitations of BT-boost in patients with intermediate-to high-risk prostate cancer, with a focus on the VHR-2 group. In their meta-analysis of three randomized control trials (RCTs), Kee et al. reported a significant benefit in 5-year bDFS in favor of BT-boost versus EBRT but not in OS and grade ≥ 3 late toxicities [12]. However, two of the RCTs [9,10,11] had a major bias in their methodologies, as the EBRT arm was not the standard care of treatment (too few doses were delivered in the EBRT arm) and their findings could not be translated into modern clinical situations. However, the recent Androgen Suppression Combined with Elective Nodal and Dose Escalated Radiation Therapy (ASCENDE-RT) trial showed that even with escalated EBRT, BT-boost provided better benefits in terms of biochemical control [9]. Our data were also consistent with their data demonstrating superior bDFS for BT-boost compared to both Conv RT and DeRT in patients without VHR. The use of androgen deprivation therapy (ADT) and its optimal duration was another confounding factor for bDFS analysis. The bDFS was significantly better regardless of the BT technique used (low or high dose rates) in these three RCTs, independent of the ADT duration. Higher BED delivered by BT (12–38%) with the better dose distribution due to the steep dose gradient, which delivered a non-homogeneous dose escalation [12,13], was an important factor to improve the outcomes. Furthermore, several studies have reported the superior efficacy of BT-boost not only in terms of bDFS but also in PCS and OS [7,8]. Therefore, BT-boost for intermediate- and high-risk prostate cancer was an attractive technique in numerous retrospective and prospective studies.
The concept of VHR was recently introduced. High-risk prostate cancer has been subdivided according to VHR in several ways. The NCCN used clinical stage T3b–T4 lesions, primary Gleason score = 5, or > 4 biopsy cores with Gleason scores of 8–10 [14]. After the initial estimation [23], a confirmation study was conducted, despite different definitions of VHR [14,24,25]. We also confirmed the importance of VHR factors, in which VHR-2 showed a higher hazard risk for DMSF, PCS, and OS than VHR-0 (hazard ratio = 8.81, 11.99, and 4.644, respectively) and VHR-1 (hazard ratio = 5.268, 2.359, and 2.896, respectively), and was a potentially better stratification system than the previous ones [15]. Our results add additional evidence of VHR-2 in a population at very high risk for recurrence outside the prostate (i.e., distant metastasis), even with the highest intensification of local radiotherapy with BT-boost. Our data could provoke a controversy regarding the indication for BT-boost in the patients with VHR, who may not be good candidates for BT-boost. These VHR criteria may be beneficial for better treatment choice for individual patients according to prognosis of the high-risk disease predisposing a risk of aggressive oncological outcomes, which may require intensive follow-up for metastasis using modern technologies; prostate-specific membrane antigen positron emission tomography scan [26] and earlier and/or adjuvant systemic therapy; or longer periods of ADT use in addition to abiraterone, docetaxel, and enzalutamide [27,28,29,30], which could be in a multimodal treatment clinical trial setting.
The present study has several limitations. First, the role of the biopsy core in the VHR system could not be analyzed because the public database did not contain these data. In addition, recent image-guided biopsy techniques made it impossible to assess older data as it was not compatible with recent systems. Second, the retrospective nature, limited follow-up time, and small sample size (especially in the VHR-2 group) in this study may limit the application of its findings. Thus, studies with longer follow-up and larger samples are needed to obtain concrete conclusions; although it could be difficult to perform, an RCT is anticipated.
5. Conclusions
BT-boost improved bDFS in intermediate- and higher risk groups, except for the patients with very high-risk factors (VHR-2: T3b-4 and Gleason 9–10). In the VHR-1 group (single VHR), BT-boost showed a superior biochemical control rate to the Conv RT group but not the DeRT group. In the VHR-2 group (double VHR), BT-boost did not improve outcomes of either the Conv RT or DeRT group. BT-boost showed no benefit to modern DeRT in the patients with VHR; therefore, they are not good candidates for BT-boost to improve outcome and may be amenable to clinical trials using multimodal intensified systemic treatments.
Supplementary Materials
The following are available online at https://www.mdpi.com/article/10.3390/cancers14122976/s1, Figure S1: Distant metastasis-free survival rate (DMFS), (a) Comparison of DMFS between EBRT and BT-boost in VHR-1 group. (b) Comparison of DMFS between EBRT and BT-boost in VHR-0 group. (c) Comparison of DMFS between EBRT and BT-boost in intermediate-risk group. Figure S2: Prostate cancer specific survival rate (PCS), (a) Comparison of PCS between EBRT and BT-boost in VHR-1 group. (b) Comparison of PCS between EBRT and BT-boost in VHR-0 group. (c) Comparison of PCS between EBRT and BT-boost in intermediate-risk group. Figure S3. Overall survival rate (OS), (a) Comparison of bDFS between EBRT and BT-boost in VHR-1 group. (b) Comparison of bDFS between EBRT and BT-boost in VHR-0 group. (c) Comparison of bDFS between EBRT and BT-boost in intermediate-risk group. Table S1: Detailed treatment schedule, Table S2: Comparison of background of Patient characteristics after propensity score matching, Table S3: Background Comparison between BT-boost and DeRT after propensity score matching.
Author Contributions
Data curation, H.Y., K.M., T.N. and T.S.; Formal analysis, G.S.; Investigation, D.S., T.K. (Takuya Kimoto), K.O. and A.F.; Methodology, K.M.; Project administration, H.Y.; Resources, T.U.; Software, N.A. and Y.H.; Supervision, H.O.; Validation, S.N. and T.K. (Takashi Kato); Visualization, K.Y. (Ken Yoshida); Writing—original draft, H.Y.; Writing—review & editing, K.Y. (Kei Yamada). All authors have read and agreed to the published version of the manuscript.
Funding
This work was supported by JSPS KAKENHI Grant Number JP21K07600.
Institutional Review Board Statement
The study was conducted according to the guidelines of the Declaration of Helsinki and approved by the Institutional Review Board of Kyoto Prefectural University of Medicine: ERB-C-1403.
Informed Consent Statement
Informed consent was obtained from all subjects involved in the study.
Data Availability Statement
The data of HDR-BT and part of EBRT for this manuscript can be obtained from the public database [19] and another part of EBRT and LDR-BT can be obtained from the author upon reasonable request.
Acknowledgments
We appreciate the participants and physicians for building big, free data of treatment outcomes [19].
Conflicts of Interest
The authors declare no conflict of interest.
References
- Dearnaley, D.P.; Sydes, M.R.; Graham, J.D.; Aird, E.G.; Bottomley, D.; Cowan, R.A.; Huddart, R.A.; Jose, C.C.; Matthews, J.H.; Millar, J.; et al. Escalated-dose versus standard-dose conformal radiotherapy in prostate cancer: First results from the MRC RT01 randomized controlled trial. Lancet Oncol. 2007, 8, 475–487. [Google Scholar] [CrossRef]
- Peeters, S.T.H.; Heemsbergen, W.D.; Koper, P.C.M.; van Putten, W.L.J.; Slot, A.; Dielwart, M.F.H.; Bonfrer, J.M.; Incrocci, L.; Lebesque, J.V. Dose-response in radiotherapy for localized prostate cancer: Results of the Dutch multicenter randomized phase III trial comparing 68 Gy of radiotherapy with 78 Gy. J. Clin. Oncol. 2006, 24, 1990–1996. [Google Scholar] [CrossRef] [PubMed]
- Zietman, A.L.; DeSilvio, M.L.; Slater, J.D.; Rossi, C.J.; Miller, D.W.; Adams, J.A.; Shipley, W.U. Comparison of conventional-dose vs high-dose conformal radiation therapy in clinically localized adenocarcinoma of the prostate: A randomized controlled trial. JAMA 2005, 294, 1233–1239. [Google Scholar] [CrossRef] [PubMed]
- Spratt, D.E.; Zumsteg, Z.S.; Ghadjar, P.; Kollmeier, M.A.; Pei, X.; Cohen, G.; Polkinghorn, W.; Yamada, Y.; Zelefsky, M.J. Comparison of high-dose (86.4 Gy) IMRT vs combined brachytherapy plus IMRT for intermediate-risk prostate cancer. BJU Int. 2014, 114, 360–367. [Google Scholar] [CrossRef]
- Viani, G.A.; Stefano, E.J.; Afonso, S.L. Higher-than-conventional radiation doses in localized prostate cancer treatment: A metaanalysis of randomized, controlled trials. Int. J. Radiat. Oncol. Biol. Phys. 2009, 74, 1405–1418. [Google Scholar] [CrossRef] [PubMed]
- Villalba, S.R.; Denia, P.M.; Pérez-Calatayud, M.J.; Sancho, J.R.; Pérez-Calatayud, J.; Escrivá, A.F.; Tendero, P.T.; Ortega, M.S. Low-/high-dose-rate brachytherapy boost in patients with intermediate-risk prostate cancer treated with radiotherapy: Long-term results from a single institution team experience. J. Contemp. Brachyther. 2021, 13, 135–144. [Google Scholar] [CrossRef] [PubMed]
- Kent, A.R.; Matheson, B.; Millar, J.L. Improved survival for patients with prostate cancer receiving a high-dose-rate brachytherapy boost to EBRT compared with EBRT alone. Brachytherapy 2019, 18, 313–321. [Google Scholar] [CrossRef]
- Wedde, T.B.; Smastuen, M.C.; Brabrand, S.; Fossa, S.D.; Kaasa, S.; Tafjord, G.; Russnes, K.M.; Hellebust, T.P.; Lilleby, W. Ten-year survival after high-dose-rate brachytherapy combined with external beam radiation therapy in high-risk prostate cancer: A comparison with the Norwegian SPCG-7 cohort. Radiother. Oncol. 2019, 132, 211–217. [Google Scholar] [CrossRef]
- Morris, W.J.; Tyldesley, S.; Rodda, S.; Halperin, R.; Pai, H.; McKenzie, M.; Duncan, G.; Morton, G.; Hamm, J.; Murray, N. Androgen Suppression Combined with Elective Nodal and Dose Escalated Radiation Therapy (the ASCENDE-RT Trial): An Analysis of Survival Endpoints for a Randomized Trial Comparing a Low-Dose-Rate Brachytherapy Boost to a Dose-Escalated External Beam Boost for High- and Intermediate-risk Prostate Cancer. Int. J. Radiat. Oncol. Biol. Phys. 2017, 98, 275–285. [Google Scholar]
- Hoskin, P.J.; Rojas, A.M.; Ostler, P.J.; Bryant, L.; Lowe, G.J. Randomised trial of external-beam radiotherapy alone or with high-dose-rate brachytherapy for prostate cancer: Mature 12-year results. Radiother. Oncol. 2021, 154, 214–219. [Google Scholar] [CrossRef]
- Sathya, J.R.; Davis, I.R.; Julian, J.A.; Guo, Q.; Daya, D.; Dayes, I.S.; Lukka, H.R.; Levine, M. Randomized trial comparing iridium implant plus external-beam radiation therapy with external beam radiation therapy alone in node-negative locally advanced cancer of the prostate. J. Clin. Oncol. 2005, 23, 1192–1199. [Google Scholar] [CrossRef] [PubMed]
- Chin, J.; Rumble, R.B.; Kollmeier, M.; Heath, E.; Efstathiou, J.; Dorff, T.; Berman, B.; Feifer, A.; Jacques, A.; Loblaw, D.A. Brachytherapy for Patients With Prostate Cancer: American Society of Clinical Oncology/Cancer Care Ontario Joint Guideline Update. J. Clin. Oncol. 2017, 35, 1737–1743. [Google Scholar] [CrossRef] [PubMed] [Green Version]
- Kee, D.L.C.; Gal, J.; Falk, A.T.; Schiappa, R.; Chand, M.-E.; Gautier, M.; Doyen, J.; Hannoun-Levi, J.-M. Brachytherapy versus external beam radiotherapy boost for prostate cancer: Systematic review with meta-analysis of randomized trials. Cancer Treat. Rev. 2018, 70, 265–271. [Google Scholar] [CrossRef] [PubMed]
- The National Comprehensive Cancer Network Clinical Practice Guidelines in Oncology. Prostate Cancer-Version 4. 2019. Available online: http://www.nccn.org/professionals/physician_gls/pdf/prostate.pdf (accessed on 2 February 2020).
- Kuban, D.A.; Levy, L.B.; Cheung, M.R.; Lee, A.K.; Choi, S.; Frank, S.; Pollack, A. Long-term failure patterns and survival in a randomized dose-escalation trial for prostate cancer. Who dies of disease? Int. J. Radiat. Oncol. Biol. Phys. 2011, 79, 1310–1317. [Google Scholar] [CrossRef] [PubMed]
- An Open Data of Multicenter Data Collection: Outcome of Radiation Therapy for Prostate Cancer to Establish a Prognostic Prediction System by Machine Learning (B17–278). Available online: https://www.khp.kitasato-u.ac.jp/ska/radiotherapy/arcivements/#results (accessed on 2 February 2020).
- Okihara, K.; Kobayashi, K.; Iwata, T.; Naitoh, Y.; Kamoi, K.; Kawauchi, A.; Yamada, K.; Miki, T. Assessment of permanent brachytherapy combined with androgen deprivation therapy in an intermediate-risk prostate cancer group without a Gleason score of 4 + 3: A single Japanese institutional experience. Int. J. Urol. 2014, 21, 271–276. [Google Scholar] [CrossRef]
- Sasaki, N.; Yamazaki, H.; Shimizu, D.; Suzuki, G.; Masui, K.; Nakamura, S.; Okabe, H.; Nishikawa, T.; Yoshida, K. Long-term Outcomes of a Dose–reduction Trial to Decrease Late Gastrointestinal Toxicity in Patients with Prostate Cancer Receiving Soft Tissue-matched Image-guided Intensity-modulated Radiotherapy. Anticancer Res. 2018, 38, 385–391. [Google Scholar]
- Yamazaki, H.; Suzuki, G.; Masui, K.; Aibe, N.; Shimizu, D.; Kimoto, T.; Yamada, K.; Shiraishi, T.; Fujihara, A.; Okihara, K.; et al. Novel Prognostic Index of High-Risk Prostate Cancer Using Simple Summation of Very High-Risk Factors. Cancers 2021, 13, 3486. [Google Scholar] [CrossRef]
- Ishiyama, H.; Satoh, T.; Kitano, M.; Tabata, K.-I.; Komori, S.; Ikeda, M.; Soda, I.; Kurosaka, S.; Sekiguchi, A.; Kimura, M.; et al. High-dose-rate brachytherapy and hypofractionated external beam radiotherapy combined with long-term hormonal therapy for high-risk and very high-risk prostate cancer: Outcomes after 5-year follow-up. J. Radiat. Res. 2014, 55, 509–517. [Google Scholar] [CrossRef]
- Kasahara, T.; Ishizaki, F.; Kazama, A.; Yuki, E.; Yamana, K.; Maruyama, R.; Oshikane, T.; Kaidu, M.; Aoyama, H.; Bilim, V.; et al. High-dose-rate brachytherapy and hypofractionated external beam radiotherapy combined with long-term androgen deprivation therapy for very high-risk prostate cancer. Int. J. Urol. 2020, 27, 800–806. [Google Scholar] [CrossRef]
- Kanda, Y. Investigation of the freely available easy-to-use software ‘EZR’ for medical statistics. Bone Marrow Transplant. 2013, 48, 452–458. [Google Scholar] [CrossRef] [Green Version]
- Sundi, D.; Tosoian, J.J.; Nyame, Y.A.; Alam, R.; Achim, M.; Reichard, C.A.; Li, J.; Wilkins, L.; Schwen, Z.; Han, M.; et al. Outcomes of very high-risk prostate cancer after radical prostatectomy: Validation study from 3 centers. Cancer 2019, 125, 391–397. [Google Scholar] [CrossRef] [PubMed] [Green Version]
- Sundi, D.; Wang, V.M.; Pierorazio, P.M.; Han, M.; Bivalacqua, T.J.; Ball, M.W.; Antonarakis, E.S.; Partin, A.W.; Schaeffer, E.M.; Ross, A.E. Very-high-risk localized prostate cancer: Definition and outcomes. Prostate Cancer Prostatic Dis. 2014, 17, 57–63. [Google Scholar] [CrossRef] [PubMed] [Green Version]
- Narang, A.K.; Gergis, C.; Robertson, S.P.; He, P.; Ram, A.N.; McNutt, T.R.; Griffith, E.; Deweese, T.A.; Honig, S.; Singh, H.; et al. Very High-Risk Localized Prostate Cancer: Outcomes Following Definitive Radiation. Int. J. Radiat. Oncol. 2016, 94, 254–262. [Google Scholar] [CrossRef] [PubMed] [Green Version]
- Perera, M.; Papa, N.; Roberts, M.; Williams, M.; Udovicich, C.; Vela, I.; Christidis, D.; Bolton, D.; Hofman, M.S.; Lawrentschuk, N.; et al. Gallium-68 Prostate-specific Membrane Antigen Positron Emission Tomography in Advanced Prostate Can-cer-Updated Diagnostic Utility, Sensitivity, Specificity, and Distribution of Prostate-specific Membrane Antigen-avid Lesions: A Systematic Review and Meta-analysis. Eur. Urol. 2020, 77, 403–417. [Google Scholar]
- Komura, K.; Sweeney, C.J.; Inamoto, T.; Ibuki, N.; Azuma, H.; Kantoff, P.W. Current treatment strategies for advanced prostate cancer. Int. J. Urol. 2018, 25, 220–231. [Google Scholar] [CrossRef] [Green Version]
- Burgess, L.; Roy, S.; Morgan, S.; Malone, S. A Review on the Current Treatment Paradigm in High-Risk Prostate Cancer. Cancers 2021, 13, 4257. [Google Scholar] [CrossRef]
- Stattin, P.; Sandin, F.; Thomsen, F.B.; Garmo, H.; Robinson, D.; Lissbrant, I.F.; Jonsson, H.; Bratt, O. Association of Radical Local Treatment with Mortality in Men with Very High-risk Prostate Cancer: A Semiecologic, Nationwide, Population-based Study. Eur. Urol. 2017, 72, 125–134. [Google Scholar] [CrossRef] [Green Version]
- Fukagai, T.; Namiki, T.S.; Carlile, R.G.; Yoshida, H.; Namiki, M. Comparison of the clinical outcome after hormonal therapy for prostate cancer between Japanese and Caucasian men. BJU Int. 2006, 97, 1190–1193. [Google Scholar] [CrossRef]
Publisher’s Note: MDPI stays neutral with regard to jurisdictional claims in published maps and institutional affiliations. |
© 2022 by the authors. Licensee MDPI, Basel, Switzerland. This article is an open access article distributed under the terms and conditions of the Creative Commons Attribution (CC BY) license (https://creativecommons.org/licenses/by/4.0/).