
MCC Gene Silencing Is a CpG Island Methylator Phenotype-Associated Factor That Predisposes Colon Cancer Cells to Irinotecan and Olaparib

 , , , and
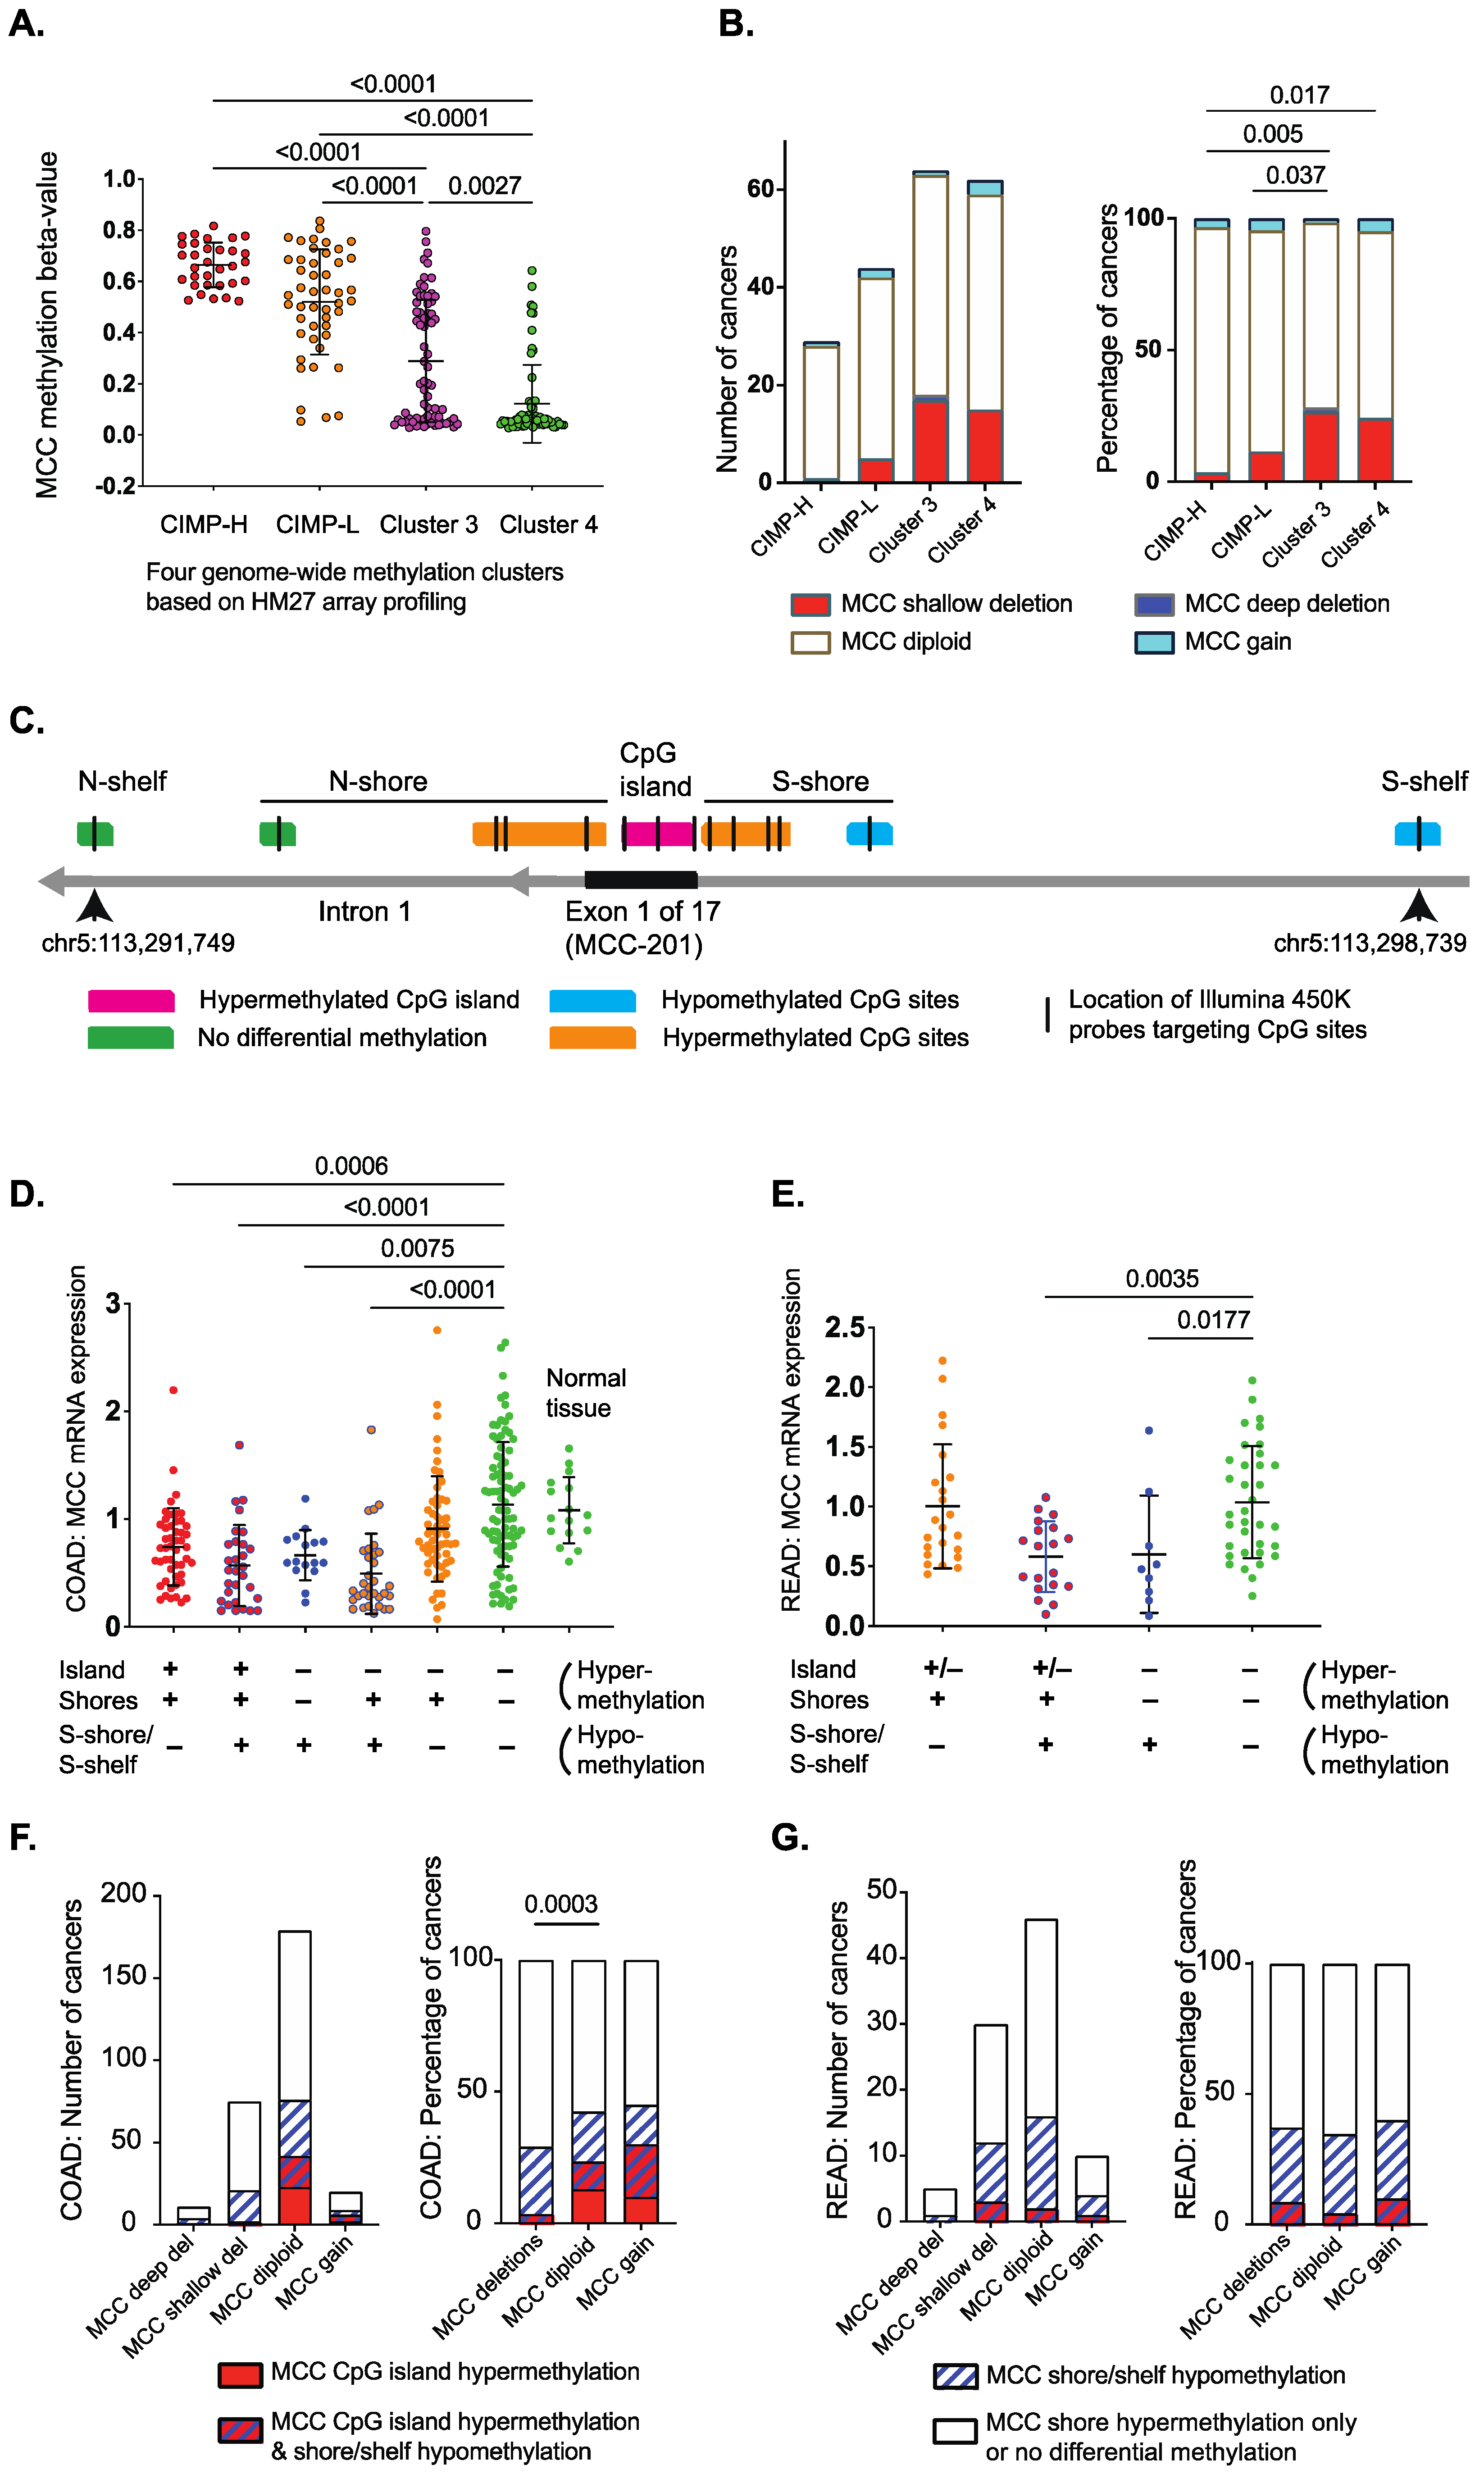
Abstract
:Simple Summary
Abstract
1. Introduction
2. Materials and Methods
2.1. Analysis of The Cancer Genome Atlas (TCGA) Datasets
2.2. Cell Lines
2.3. Cell Proliferation
2.4. Cell Viability Assay
2.5. Drug Synergy Experimental Design
2.6. Western Blot Analysis
2.7. PARP Immunofluorescence
2.8. qPCR Analysis
2.9. Animal Experiments
2.10. Statistical Analysis
3. Results
3.1. Differentially Methylated Genomic Regions Can Identify MCC-Deficient Tumors
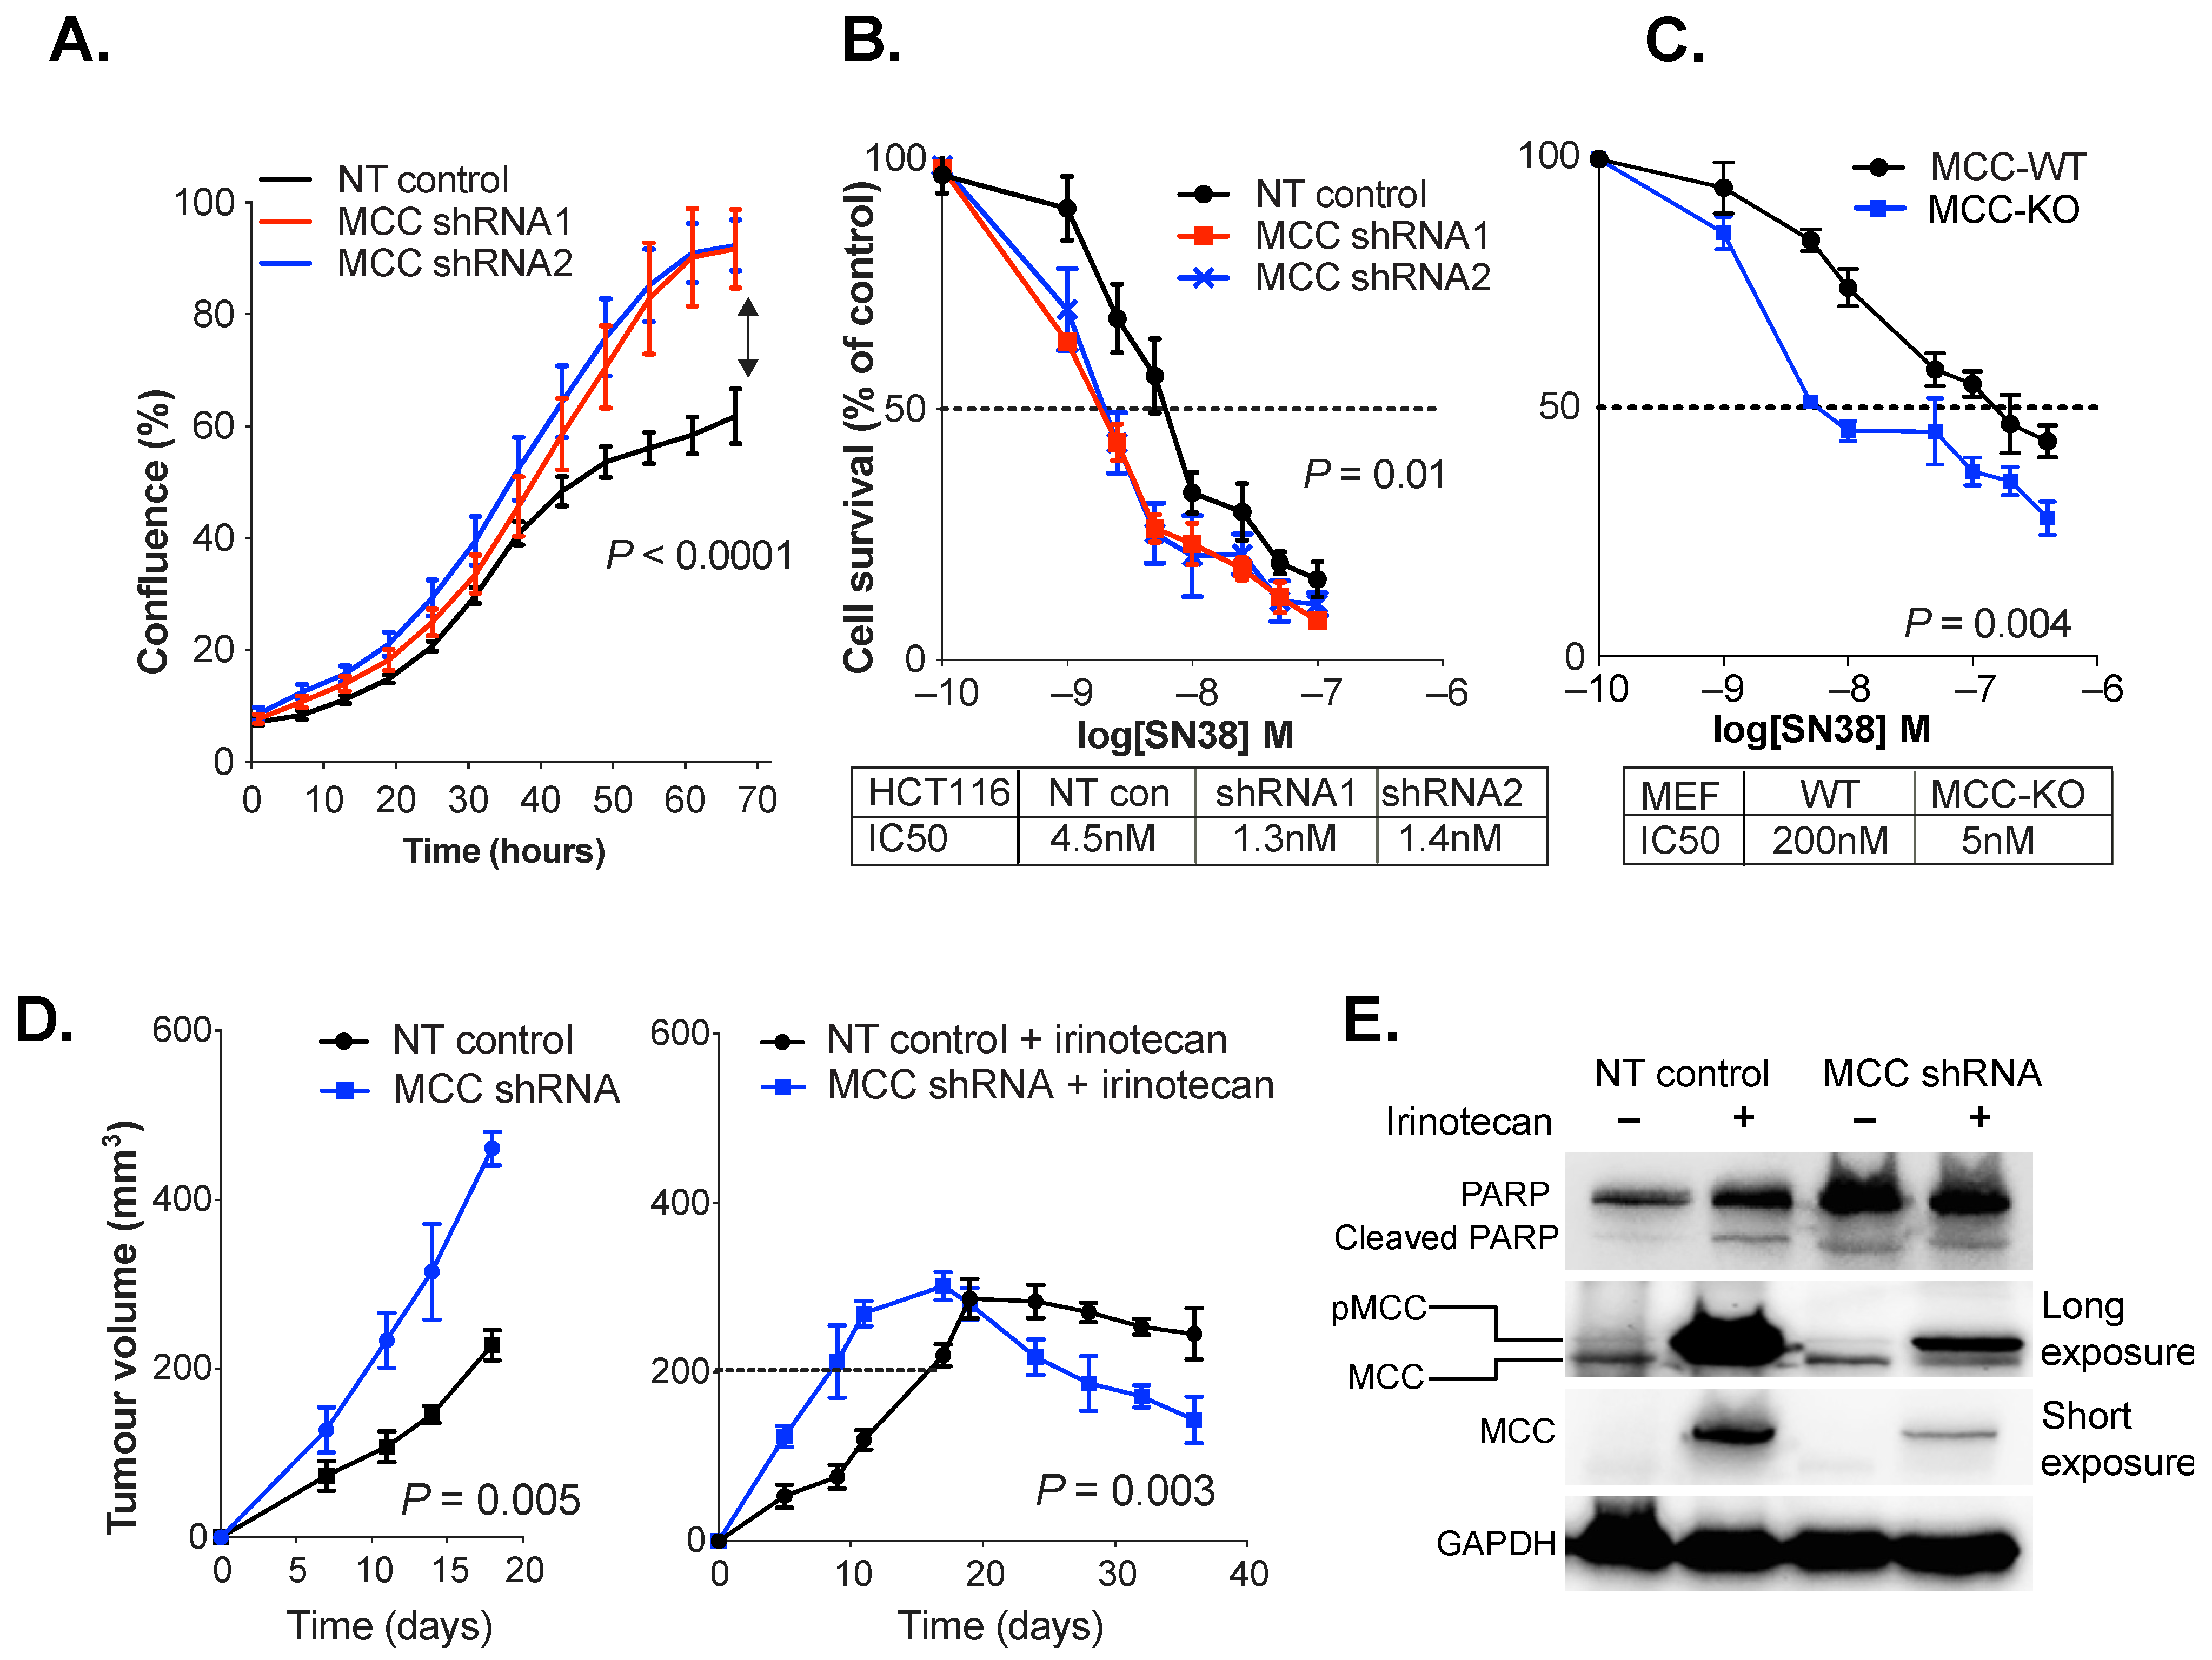
3.2. MCC Knockdown Sensitises Colon Cancer Cells to SN38/Irinotecan-Induced Cell Death
3.3. MCC Knockdown Induces PARP Expression in Colon Cancer Cells In Vivo
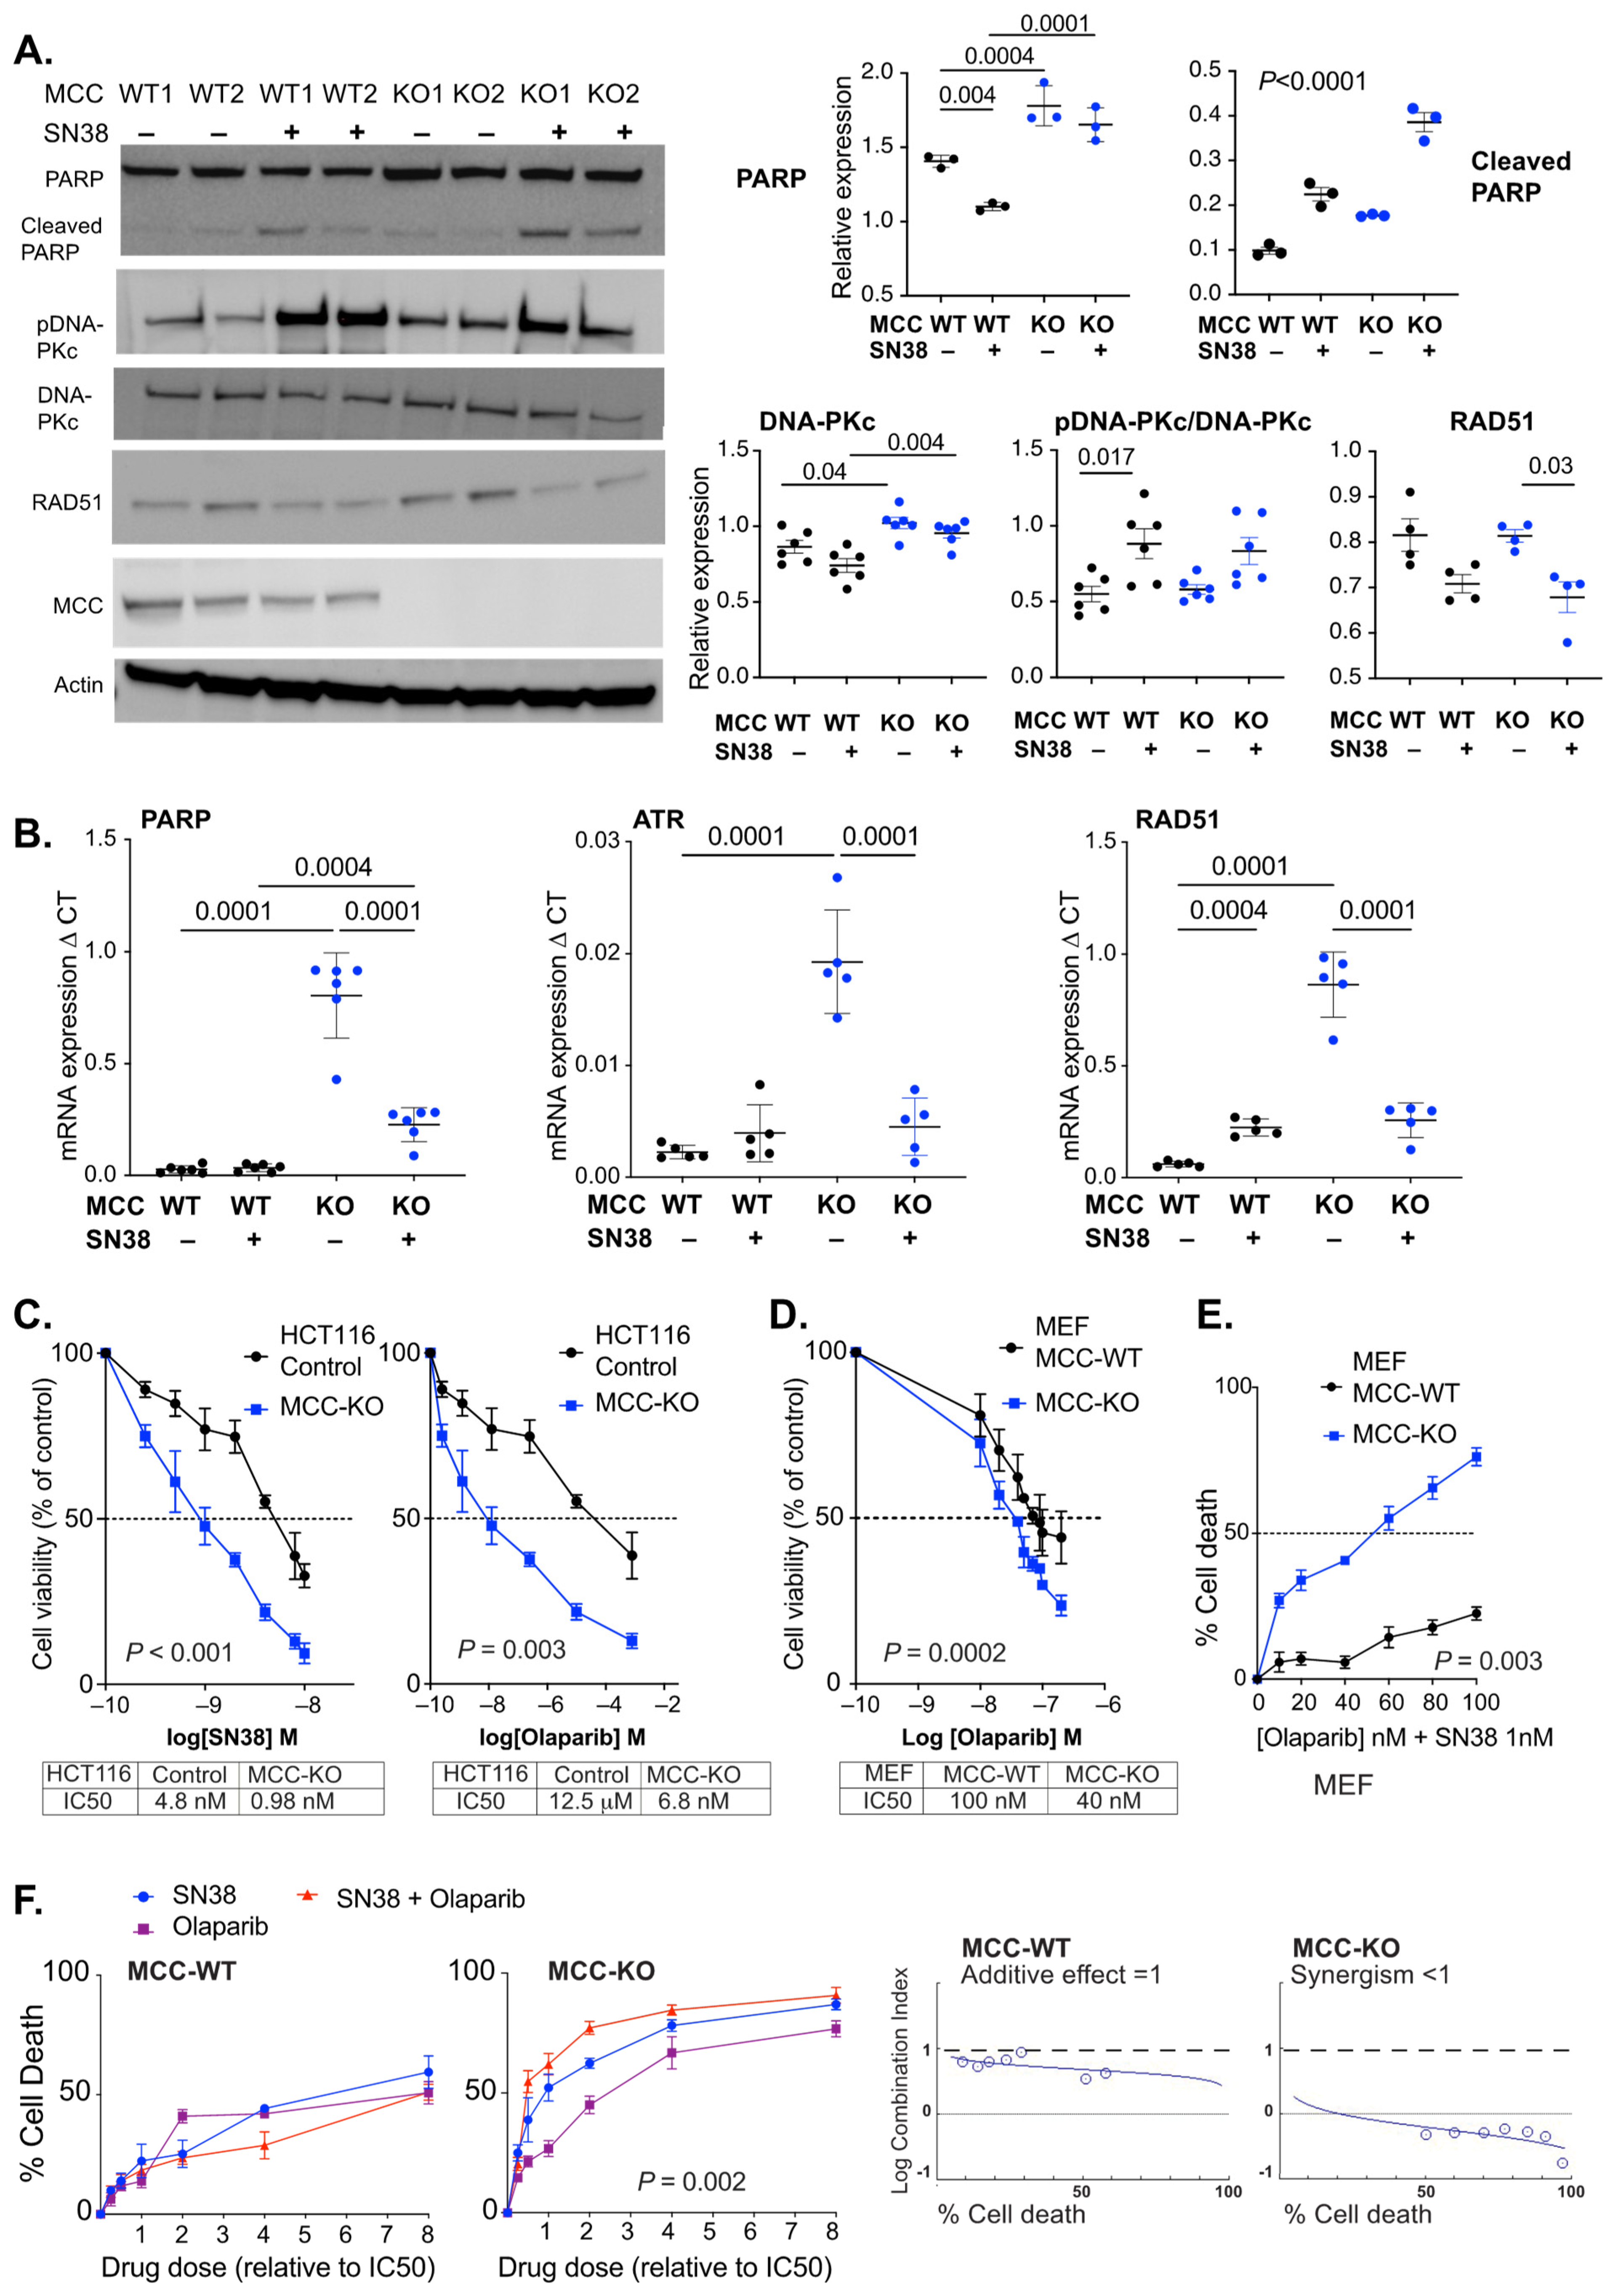
3.4. MCC Deletion Alters the Transcriptional Response to SN38-Induced DNA Damage
3.5. PARP Inhibitors Synergise with SN38 in MCC-Deleted Cells
4. Discussion
5. Conclusions
Supplementary Materials
Author Contributions
Funding
Institutional Review Board Statement
Informed Consent Statement
Data Availability Statement
Acknowledgments
Conflicts of Interest
Abbreviations
References
- Kinzler, K.W.; Nilbert, M.C.; Vogelstein, B.; Bryan, T.M.; Levy, D.B.; Smith, K.J.; Preisinger, A.C.; Hamilton, S.R.; Hedge, P.; Markham, A.; et al. Identification of a gene located at chromosome 5q21 that is mutated in colorectal cancers. Science 1991, 251, 1366–1370. [Google Scholar] [CrossRef] [PubMed] [Green Version]
- Benthani, F.A.; Herrmann, D.; Tran, P.N.; Pangon, L.; Lucas, M.C.; Allam, A.H.; Currey, N.; Al-Sohaily, S.; Giry-Laterriere, M.; Warusavitarne, J.; et al. ‘MCC’ protein interacts with E-cadherin and beta-catenin strengthening cell-cell adhesion of HCT116 colon cancer cells. Oncogene 2018, 37, 663–672. [Google Scholar] [CrossRef] [PubMed]
- Currey, N.; Jahan, Z.; Caldon, C.E.; Tran, P.N.; Benthani, F.; De Lacavalerie, P.; Roden, D.L.; Gloss, B.S.; Campos, C.; Bean, E.G.; et al. Mouse model of mutated in colorectal cancer gene deletion reveals novel pathways in inflammation and cancer. Cell Mol. Gastroenterol. Hepatol. 2019, 7, 819–839. [Google Scholar] [CrossRef] [PubMed] [Green Version]
- Fukuyama, R.; Niculaita, R.; Ng, K.P.; Obusez, E.; Sanchez, J.; Kalady, M.; Aung, P.P.; Casey, G.; Sizemore, N. Mutated in colorectal cancer, a putative tumor suppressor for serrated colorectal cancer, selectively represses beta-catenin-dependent transcription. Oncogene 2008, 27, 6044–6055. [Google Scholar] [CrossRef] [Green Version]
- Kohonen-Corish, M.R.; Sigglekow, N.D.; Susanto, J.; Chapuis, P.H.; Bokey, E.L.; Dent, O.F.; Chan, C.; Lin, B.P.; Seng, T.J.; Laird, P.W.; et al. Promoter methylation of the mutated in colorectal cancer gene is a frequent early event in colorectal cancer. Oncogene 2007, 26, 4435–4441. [Google Scholar] [CrossRef] [Green Version]
- Li, L.; Fu, X.; Zhang, W.; Xiao, L.; Qiu, Y.; Peng, Y.; Shi, L.; Chen, X.; Zhou, X.; Deng, M. Wnt signaling pathway is activated in right colon serrated polyps correlating to specific molecular form of beta-catenin. Hum. Pathol. 2013, 44, 1079–1088. [Google Scholar] [CrossRef]
- Murakami, T.; Mitomi, H.; Saito, T.; Takahashi, M.; Sakamoto, N.; Fukui, N.; Yao, T.; Watanabe, S. Distinct WNT/beta-catenin signaling activation in the serrated neoplasia pathway and the adenoma-carcinoma sequence of the colorectum. Mod. Pathol. Off. J. U. S. Can. Acad. Pathol. Inc 2015, 28, 146–158. [Google Scholar] [CrossRef] [Green Version]
- Pangon, L.; Sigglekow, N.D.; Larance, M.; Al-Sohaily, S.; Mladenova, D.N.; Selinger, C.I.; Musgrove, E.A.; Kohonen-Corish, M.R. The “mutated in colorectal cancer” protein is a novel target of the UV-induced DNA damage checkpoint. Genes Cancer 2010, 1, 917–926. [Google Scholar] [CrossRef] [Green Version]
- Pangon, L.; Van Kralingen, C.; Abas, M.; Daly, R.J.; Musgrove, E.A.; Kohonen-Corish, M.R. The PDZ-binding motif of MCC is phosphorylated at position -1 and controls lamellipodia formation in colon epithelial cells. Biochim. Biophys. Acta 2012, 1823, 1058–1067. [Google Scholar] [CrossRef] [Green Version]
- Sigglekow, N.D.; Pangon, L.; Brummer, T.; Molloy, M.; Hawkins, N.J.; Ward, R.L.; Musgrove, E.A.; Kohonen-Corish, M.R. Mutated in colorectal cancer protein modulates the NFkappab pathway. Anticancer Res. 2012, 32, 73–79. [Google Scholar]
- Meessen, S.; Currey, N.; Jahan, Z.; Parker, H.W.; Jenkins, M.A.; Buchanan, D.D.; Hopper, J.L.; Segelov, E.; Dahlstrom, J.E.; Kohonen-Corish, M.R.J. Tetranucleotide and low microsatellite instability are inversely associated with the CpG island methylator phenotype in colorectal cancer. Cancers 2021, 13, 3529. [Google Scholar] [CrossRef] [PubMed]
- Shiovitz, S.; Bertagnolli, M.M.; Renfro, L.A.; Nam, E.; Foster, N.R.; Dzieciatkowski, S.; Luo, Y.; Lao, V.V.; Monnat, R.J., Jr.; Emond, M.J.; et al. CpG island methylator phenotype is associated with response to adjuvant irinotecan-based therapy for stage III colon cancer. Gastroenterology 2014, 147, 637–645. [Google Scholar] [CrossRef] [PubMed] [Green Version]
- Van Cutsem, E.; Labianca, R.; Bodoky, G.; Barone, C.; Aranda, E.; Nordlinger, B.; Topham, C.; Tabernero, J.; Andre, T.; Sobrero, A.F.; et al. Randomized phase III trial comparing biweekly infusional fluorouracil/leucovorin alone or with irinotecan in the adjuvant treatment of stage III colon cancer: Petacc-3. J. Clin. Oncol. Off. J. Am. Soc. Clin. Oncol. 2009, 27, 3117–3125. [Google Scholar] [CrossRef] [PubMed]
- Weisenberger, D.J.; Siegmund, K.D.; Campan, M.; Young, J.; Long, T.I.; Faasse, M.A.; Kang, G.H.; Widschwendter, M.; Weener, D.; Buchanan, D.; et al. CpG island methylator phenotype underlies sporadic microsatellite instability and is tightly associated with BRAF mutation in colorectal cancer. Nat. Genet. 2006, 38, 787–793. [Google Scholar] [CrossRef] [PubMed]
- Jover, R.; Nguyen, T.P.; Perez-Carbonell, L.; Zapater, P.; Paya, A.; Alenda, C.; Rojas, E.; Cubiella, J.; Balaguer, F.; Morillas, J.D.; et al. 5-fluorouracil adjuvant chemotherapy does not increase survival in patients with CpG island methylator phenotype colorectal cancer. Gastroenterology 2011, 140, 1174–1181. [Google Scholar] [CrossRef] [Green Version]
- Cerami, E.; Gao, J.; Dogrusoz, U.; Gross, B.E.; Sumer, S.O.; Aksoy, B.A.; Jacobsen, A.; Byrne, C.J.; Heuer, M.L.; Larsson, E.; et al. The cbio cancer genomics portal: An open platform for exploring multidimensional cancer genomics data. Cancer Discov. 2012, 2, 401–404. [Google Scholar] [CrossRef] [Green Version]
- Gao, J.; Aksoy, B.A.; Dogrusoz, U.; Dresdner, G.; Gross, B.; Sumer, S.O.; Sun, Y.; Jacobsen, A.; Sinha, R.; Larsson, E.; et al. Integrative analysis of complex cancer genomics and clinical profiles using the cbioportal. Sci. Signal. 2013, 6, pl1. [Google Scholar] [CrossRef] [Green Version]
- Cancer Genome Atlas Network. Comprehensive molecular characterization of human colon and rectal cancer. Nature 2012, 487, 330–337. [Google Scholar] [CrossRef] [Green Version]
- Hoadley, K.A.; Yau, C.; Hinoue, T.; Wolf, D.M.; Lazar, A.J.; Drill, E.; Shen, R.; Taylor, A.M.; Cherniack, A.D.; Thorsson, V.; et al. Cell-of-origin patterns dominate the molecular classification of 10,000 tumors from 33 types of cancer. Cell 2018, 173, 291–304.e296. [Google Scholar] [CrossRef] [Green Version]
- Li, Y.; Ge, D.; Lu, C. The SMART app: An interactive web application for comprehensive DNA methylation analysis and visualization. Epigenetics Chromatin 2019, 12, 71. [Google Scholar] [CrossRef] [Green Version]
- Pangon, L.; Ng, I.; Giry-Laterriere, M.; Currey, N.; Morgan, A.; Benthani, F.; Tran, P.N.; Al-Sohaily, S.; Segelov, E.; Parker, B.L.; et al. JRK is a positive regulator of beta-catenin transcriptional activity commonly overexpressed in colon, breast and ovarian cancer. Oncogene 2016, 35, 2834–2841. [Google Scholar] [CrossRef] [PubMed]
- Chou, T.C. Drug combination studies and their synergy quantification using the Chou-Talalay method. Cancer Res. 2010, 70, 440–446. [Google Scholar] [CrossRef] [PubMed] [Green Version]
- Zhang, N.; Fu, J.N.; Chou, T.C. Synergistic combination of microtubule targeting anticancer fludelone with cytoprotective panaxytriol derived from panax ginseng against mx-1 cells in vitro: Experimental design and data analysis using the combination index method. Am. J. Cancer Res. 2016, 6, 97–104. [Google Scholar] [PubMed]
- Berman, B.P.; Weisenberger, D.J.; Aman, J.F.; Hinoue, T.; Ramjan, Z.; Liu, Y.; Noushmehr, H.; Lange, C.P.; van Dijk, C.M.; Tollenaar, R.A.; et al. Regions of focal DNA hypermethylation and long-range hypomethylation in colorectal cancer coincide with nuclear lamina-associated domains. Nat. Genet. 2011, 44, 40–46. [Google Scholar] [CrossRef] [PubMed] [Green Version]
- Irizarry, R.A.; Ladd-Acosta, C.; Wen, B.; Wu, Z.; Montano, C.; Onyango, P.; Cui, H.; Gabo, K.; Rongione, M.; Webster, M.; et al. The human colon cancer methylome shows similar hypo- and hypermethylation at conserved tissue-specific CpG island shores. Nat. Genet. 2009, 41, 178–186. [Google Scholar] [CrossRef] [Green Version]
- Goel, A.; Nagasaka, T.; Arnold, C.N.; Inoue, T.; Hamilton, C.; Niedzwiecki, D.; Compton, C.; Mayer, R.J.; Goldberg, R.; Bertagnolli, M.M.; et al. The CpG island methylator phenotype and chromosomal instability are inversely correlated in sporadic colorectal cancer. Gastroenterology 2007, 132, 127–138. [Google Scholar] [CrossRef]
- Dietlein, F.; Thelen, L.; Reinhardt, H.C. Cancer-specific defects in DNA repair pathways as targets for personalized therapeutic approaches. Trends Genet. 2014, 30, 326–339. [Google Scholar] [CrossRef]
- Jiao, G.; Huang, Q.; Hu, M.; Liang, X.; Li, F.; Lan, C.; Fu, W.; An, Y.; Xu, B.; Zhou, J.; et al. Therapeutic suppression of mir-4261 attenuates colorectal cancer by targeting MCC. Mol. Nucleic Acids 2017, 8, 36–45. [Google Scholar] [CrossRef] [Green Version]
- Lim, L.; Balakrishnan, A.; Huskey, N.; Jones, K.D.; Jodari, M.; Ng, R.; Song, G.; Riordan, J.; Anderton, B.; Cheung, S.T.; et al. Microrna-494 within an oncogenic microrna megacluster regulates G1/S transition in liver tumorigenesis through suppression of mutated in colorectal cancer. Hepatology 2014, 59, 202–215. [Google Scholar] [CrossRef] [Green Version]
- Xiao, J.; Lv, D.; Zhou, J.; Bei, Y.; Chen, T.; Hu, M.; Zhou, Q.; Fu, S.; Huang, Q. Therapeutic inhibition of mir-4260 suppresses colorectal cancer via targeting MCC and SMAD4. Theranostics 2017, 7, 1901–1913. [Google Scholar] [CrossRef]
- Shukla, R.; Upton, K.R.; Munoz-Lopez, M.; Gerhardt, D.J.; Fisher, M.E.; Nguyen, T.; Brennan, P.M.; Baillie, J.K.; Collino, A.; Ghisletti, S.; et al. Endogenous retrotransposition activates oncogenic pathways in hepatocellular carcinoma. Cell 2013, 153, 101–111. [Google Scholar] [CrossRef] [PubMed] [Green Version]
- Arena, S.; Corti, G.; Durinikova, E.; Montone, M.; Reilly, N.M.; Russo, M.; Lorenzato, A.; Arcella, P.; Lazzari, L.; Rospo, G.; et al. A subset of colorectal cancers with cross-sensitivity to olaparib and oxaliplatin. Clin. Cancer Res. 2020, 26, 1372–1384. [Google Scholar] [CrossRef] [PubMed]
- Augustine, T.; Maitra, R.; Zhang, J.; Nayak, J.; Goel, S. Sensitization of colorectal cancer to irinotecan therapy by PARP inhibitor rucaparib. Investig. New Drugs 2019, 37, 948–960. [Google Scholar] [CrossRef] [PubMed]
- Davidson, D.; Wang, Y.; Aloyz, R.; Panasci, L. The PARP inhibitor abt-888 synergizes irinotecan treatment of colon cancer cell lines. Investig. New Drugs 2013, 31, 461–468. [Google Scholar] [CrossRef] [PubMed]
- Tahara, M.; Inoue, T.; Sato, F.; Miyakura, Y.; Horie, H.; Yasuda, Y.; Fujii, H.; Kotake, K.; Sugano, K. The use of olaparib (azd2281) potentiates SN-38 cytotoxicity in colon cancer cells by indirect inhibition of RAD51-mediated repair of DNA double-strand breaks. Mol. Cancer Ther. 2014, 13, 1170–1180. [Google Scholar] [CrossRef] [PubMed] [Green Version]
- Gorbunova, V.; Beck, J.T.; Hofheinz, R.D.; Garcia-Alfonso, P.; Nechaeva, M.; Cubillo Gracian, A.; Mangel, L.; Elez Fernandez, E.; Deming, D.A.; Ramanathan, R.K.; et al. A phase 2 randomised study of veliparib plus FOLFIRI+/-bevacizumab versus placebo plus FOLFIRI+/-bevacizumab in metastatic colorectal cancer. Br. J. Cancer 2019, 120, 183–189. [Google Scholar] [CrossRef] [Green Version]
- Gamazon, E.R.; Lamba, J.K.; Pounds, S.; Stark, A.L.; Wheeler, H.E.; Cao, X.; Im, H.K.; Mitra, A.K.; Rubnitz, J.E.; Ribeiro, R.C.; et al. Comprehensive genetic analysis of cytarabine sensitivity in a cell-based model identifies polymorphisms associated with outcome in AML patients. Blood 2013, 121, 4366–4376. [Google Scholar] [CrossRef] [Green Version]


Publisher’s Note: MDPI stays neutral with regard to jurisdictional claims in published maps and institutional affiliations. |
© 2022 by the authors. Licensee MDPI, Basel, Switzerland. This article is an open access article distributed under the terms and conditions of the Creative Commons Attribution (CC BY) license (https://creativecommons.org/licenses/by/4.0/).
Share and Cite
Jahan, Z.; Benthani, F.A.; Currey, N.; Parker, H.W.; Dahlstrom, J.E.; Caldon, C.E.; Kohonen-Corish, M.R.J. MCC Gene Silencing Is a CpG Island Methylator Phenotype-Associated Factor That Predisposes Colon Cancer Cells to Irinotecan and Olaparib. Cancers 2022, 14, 2859. https://doi.org/10.3390/cancers14122859
Jahan Z, Benthani FA, Currey N, Parker HW, Dahlstrom JE, Caldon CE, Kohonen-Corish MRJ. MCC Gene Silencing Is a CpG Island Methylator Phenotype-Associated Factor That Predisposes Colon Cancer Cells to Irinotecan and Olaparib. Cancers. 2022; 14(12):2859. https://doi.org/10.3390/cancers14122859
Chicago/Turabian StyleJahan, Zeenat, Fahad A. Benthani, Nicola Currey, Hannah W. Parker, Jane E. Dahlstrom, C. Elizabeth Caldon, and Maija R. J. Kohonen-Corish. 2022. "MCC Gene Silencing Is a CpG Island Methylator Phenotype-Associated Factor That Predisposes Colon Cancer Cells to Irinotecan and Olaparib" Cancers 14, no. 12: 2859. https://doi.org/10.3390/cancers14122859
APA StyleJahan, Z., Benthani, F. A., Currey, N., Parker, H. W., Dahlstrom, J. E., Caldon, C. E., & Kohonen-Corish, M. R. J. (2022). MCC Gene Silencing Is a CpG Island Methylator Phenotype-Associated Factor That Predisposes Colon Cancer Cells to Irinotecan and Olaparib. Cancers, 14(12), 2859. https://doi.org/10.3390/cancers14122859