Article

Genome-Wide Meta-Analysis Identifies Variants in DSCAM and PDLIM3 That Correlate with Efficacy Outcomes in Metastatic Renal Cell Carcinoma Patients Treated with Sunitinib

by
Meta H. M. Diekstra
1,2,*,
Jesse J. Swen
2,
Loes F. M. van der Zanden
3,
Sita H. Vermeulen
3,
Epie Boven
4,
Ron H. J. Mathijssen
5,
Koya Fukunaga
6,
Taisei Mushiroda
6,
Fumiya Hongo
7,
Egbert Oosterwijk
8,
Anne Cambon-Thomsen
9,
Daniel Castellano
10,
Achim Fritsch
11,
Jesus Garcia Donas
12,
Cristina Rodriguez-Antona
13,
Rob Ruijtenbeek
14,
Marius T. Radu
15,
Tim Eisen
16,
Kerstin Junker
17,
Max Roessler
18,
Ulrich Jaehde
11,
Tsuneharu Miki
7,
Stefan Böhringer
2,19,
Michiaki Kubo
6,
Lambertus A. L. M. Kiemeney
3,† and
Henk-Jan Guchelaar
2,†
add Show full author list remove Hide full author list
1
Department of Pharmacology, Princess Maxima Center for Pediatric Oncology, 3584 CS Utrecht, The Netherlands
2
Department of Clinical Pharmacy and Toxicology, Leiden University Medical Center, 2333 ZA Leiden, The Netherlands
3
Radboud University Medical Center, 6525 GA Nijmegen, The Netherlands
4
Department of Medical Oncology, Amsterdam UMC, Vrije Universiteit Amsterdam/Cancer Center Amsterdam, 1081 HV Amsterdam, The Netherlands
5
Department of Medical Oncology, Erasmus MC Cancer Institute, 3015 GD Rotterdam, The Netherlands
6
Core for Genomic Medicine, RIKEN Center for Integrative Medical Sciences, Yokohama 230-0045, Japan
7
Department of Urology, Kyoto Prefectural University of Medicine, Kyoto 602-8566, Japan
8
Radboud Institute for Molecular Life Sciences, Radboud University Medical Center, 6525 GA Nijmegen, The Netherlands
9
CERPOP, Center of Epidemiology and Research in Population Health, Joint Unit 1295, Institut National de la Santé et de la Recherche Médicale (Inserm), Faculty of Medicine, Université de Toulouse, Université Toulouse III-Paul Sabatier, CEDEX, 31062 Toulouse, France
10
Medical Oncology Department, I+12 Research Institute, (CiberOnc), Hospital Universitario 12 de Octubre, 28041 Madrid, Spain
11
Institute of Pharmacy, Clinical Pharmacy, University of Bonn, 53117 Bonn, Germany
12
Medical Oncology, HM Hospitales—Centro Integral Oncológico HM Clara Campal, 28050 Madrid, Spain
13
Hereditary Endorine Cancer Group, Spanish National Cancer Research Center (CNIO) and Biomedical Network on Rare Diseases (CIBERER), 28029 Madrid, Spain
14
PamGene International B.V., 5211 HH ‘s-Hertogenbosch, The Netherlands
15
University of Medicine and Pharmacy Carol Davila, 050474 Bucharest, Romania
16
Department of Oncology, Cambridge University Hospitals NHS Foundation Trust, Cambridge Biomedical Campus, Cambridge CB2 0SL, UK
17
Clinic of Urology and Paediatric Urology, Saarland University, 66424 Homburg, Germany
18
CESAR Central Office, CESAR Central European Society for Anticancer Drug Research-EWIV, 1010 Vienna, Austria
19
Department of Biomedical Data Sciences, Leiden University Medical Center, 2333 ZA Leiden, The Netherlands
*
Author to whom correspondence should be addressed.
These authors contributed equally to this work.
Cancers 2022, 14(12), 2838; https://doi.org/10.3390/cancers14122838
Submission received: 11 April 2022 / Revised: 24 May 2022 / Accepted: 2 June 2022 / Published: 8 June 2022
(This article belongs to the Special Issue Clear Cell Renal Cell Carcinoma: From Biology to Treatment)

Abstract

:

Simple Summary

The drug sunitinib is used in metastatic renal cell carcinoma, but patients respond very differently to this drug. To better tailor sunitinib treatment to the individual patient, clinically useful markers are needed. We explored the DNA of patients with metastatic renal cell cancer to detect variations that determine how a patient would respond to sunitinib treatment. We investigated >8 million genetic variants in large patient cohorts from Europe (n = 550) and Japan (n = 204) and found novel genetic variants in PDLIM3 and DSCAM that are related to survival in sunitinib-treated patients. The mechanistic role of these variants in the action of sunitinib needs to be further explored to define its clinical potential. Our findings are a major step towards achieving personalized treatment for patients with metastatic renal cell carcinoma.

Abstract

Individual response to sunitinib in metastatic renal cell carcinoma (mRCC) patients is highly variable. Earlier, sunitinib outcome was related to single nucleotide polymorphisms (SNPs) in CYP3A5 and ABCB1. Our aim is to provide novel insights into biological mechanisms underlying sunitinib action. We included mRCC patients from the European EuroTARGET consortium (n = 550) and the RIKEN cohort in Japan (n = 204) which were analysed separately and in a meta-analysis of genome-wide association studies (GWAS). SNPs were tested for association with progression-free survival (PFS) and overall survival (OS) using Cox regression. Summary statistics were combined using a fixed effect meta-analysis. SNP rs28520013 in PDLIM3 and the correlated SNPs rs2205096 and rs111356738 both in DSCAM, showed genome-wide significance (p < 5 × 10⁻⁸) with PFS and OS in the meta-analysis. The variant T-allele of rs28520013 associated with an inferior PFS of 5.1 months compared to 12.5 months in non-carriers (p = 4.02 × 10⁻¹⁰, HR = 7.26). T-allele carriers of rs28520013 showed an inferior OS of 6.9 months versus 30.2 months in non-carriers (p = 1.62 × 10⁻⁸, HR = 5.96). In this GWAS we identified novel genetic variants in PDLIM3 and DSCAM that impact PFS and OS in mRCC patients receiving sunitinib. The underlying link between the identified genes and the molecular mechanisms of sunitinib action needs to be elucidated.

1. Introduction

Sunitinib is a multi-targeted tyrosine kinase inhibitor (TKI) and is, next to immunotherapy, an important component in the treatment of patients with metastatic renal cell carcinoma (mRCC) [1,2,3]. Treatment in mRCC patients is started based on the risk group which is determined by clinical and pathological characteristics, but does not yet provide an adequate prediction of treatment outcome. The most common histological subtype is clear cell renal cell carcinoma and occurs in about 75% of cases [4]. And although sunitinib is effective in clear cell mRCC, there is large inter-individual variability in the response to sunitinib regarding both side-effects and efficacy. One-third of patients require a dose reduction and up to 20% show no clinical response to sunitinib [1,2]. Biomarkers that enable prediction of individual response to sunitinib are imperative [5]. In previous studies, the candidate gene approach was used to test single nucleotide polymorphisms (SNPs) in genes related to the pharmacokinetics (PK) and pharmacodynamics of sunitinib. SNPs in CYP1A1, CYP3A5, CYP3A4, NR1I2, NR1I3, ABCB1, ABCG2, VEGF-A, VEGF-R1, VEGFR2, VEGF-R3, FGF-R2, FLT3, eNOS, UGT1A1 and IL8 were significantly associated with one or more of the following endpoints: toxicity, dose reduction, clearance, drug exposure, best objective response, progression-free survival (PFS) or overall survival (OS) [1,2,5,6,7,8,9,10,11,12,13,14,15,16]. Only genetic polymorphisms in CYP3A5 (rs776746) and ABCB1 (rs1128503, rs2032582, rs1045642) were replicated for association with a twofold increase in the need for dose reductions and with PFS, respectively [17]. Germline genetic variants are, therefore, considered to be major contributors to differences in response to sunitinib. However, sample sizes in most candidate gene studies were limited (up to 350 subjects), replication is often lacking, and inconsistent endpoint definitions were used making it difficult to draw firm conclusions [1,2,5,6,7,8,9,10,11,12,13,14,15,16].
In earlier genome-wide association studies (GWASs) in other diseases, genetic variants were associated with drug response or adverse events of commonly used drugs such as simvastatin, warfarin, and flucloxacillin, and this affected clinical practice. However, few GWAS data are available for response to anticancer agents [18]. The hypothesis-free approach of a GWAS can provide novel insights into biological mechanisms underlying sunitinib action. Yet, any GWAS in cancer remains challenging because of the need of large sample sizes, and ideally a validation in an independent cohort [18].
GWAS data on response and toxicity in mRCC patients treated with pazopanib (n = 744) or sunitinib (n = 355) have been presented in 2014 [19,20]. SNPs in IL2RA and LRRC2 were associated with efficacy endpoints at a threshold of p ≤ 5 × 10⁻⁷, just falling short of genome-wide significance (i.e., p ≤ 5.0 × 10⁻⁸) [15,19]. Intronic variants in LOXL2 and ENTPD4 were associated with PFS, OS and best response as a combined efficacy endpoint (p = 1.7 × 10⁻⁸). However, for individual efficacy endpoints no genetic variants were shown to be associated at GWAS significance level [19,20].
We established the “TArgeted therapy in Renal cell cancer: GEnetic and Tumour related biomarkers for response and toxicity” (EuroTARGET) consortium to search for sunitinib biomarkers [21]. Here, we report the results of the largest meta-GWAS for sunitinib with the aim to identify germline genetic variants that associate with sunitinib efficacy in a cohort of mRCC patients as recruited by the EuroTARGET consortium, and a cohort available from the RIKEN Centre in Japan.

2. Materials and Methods

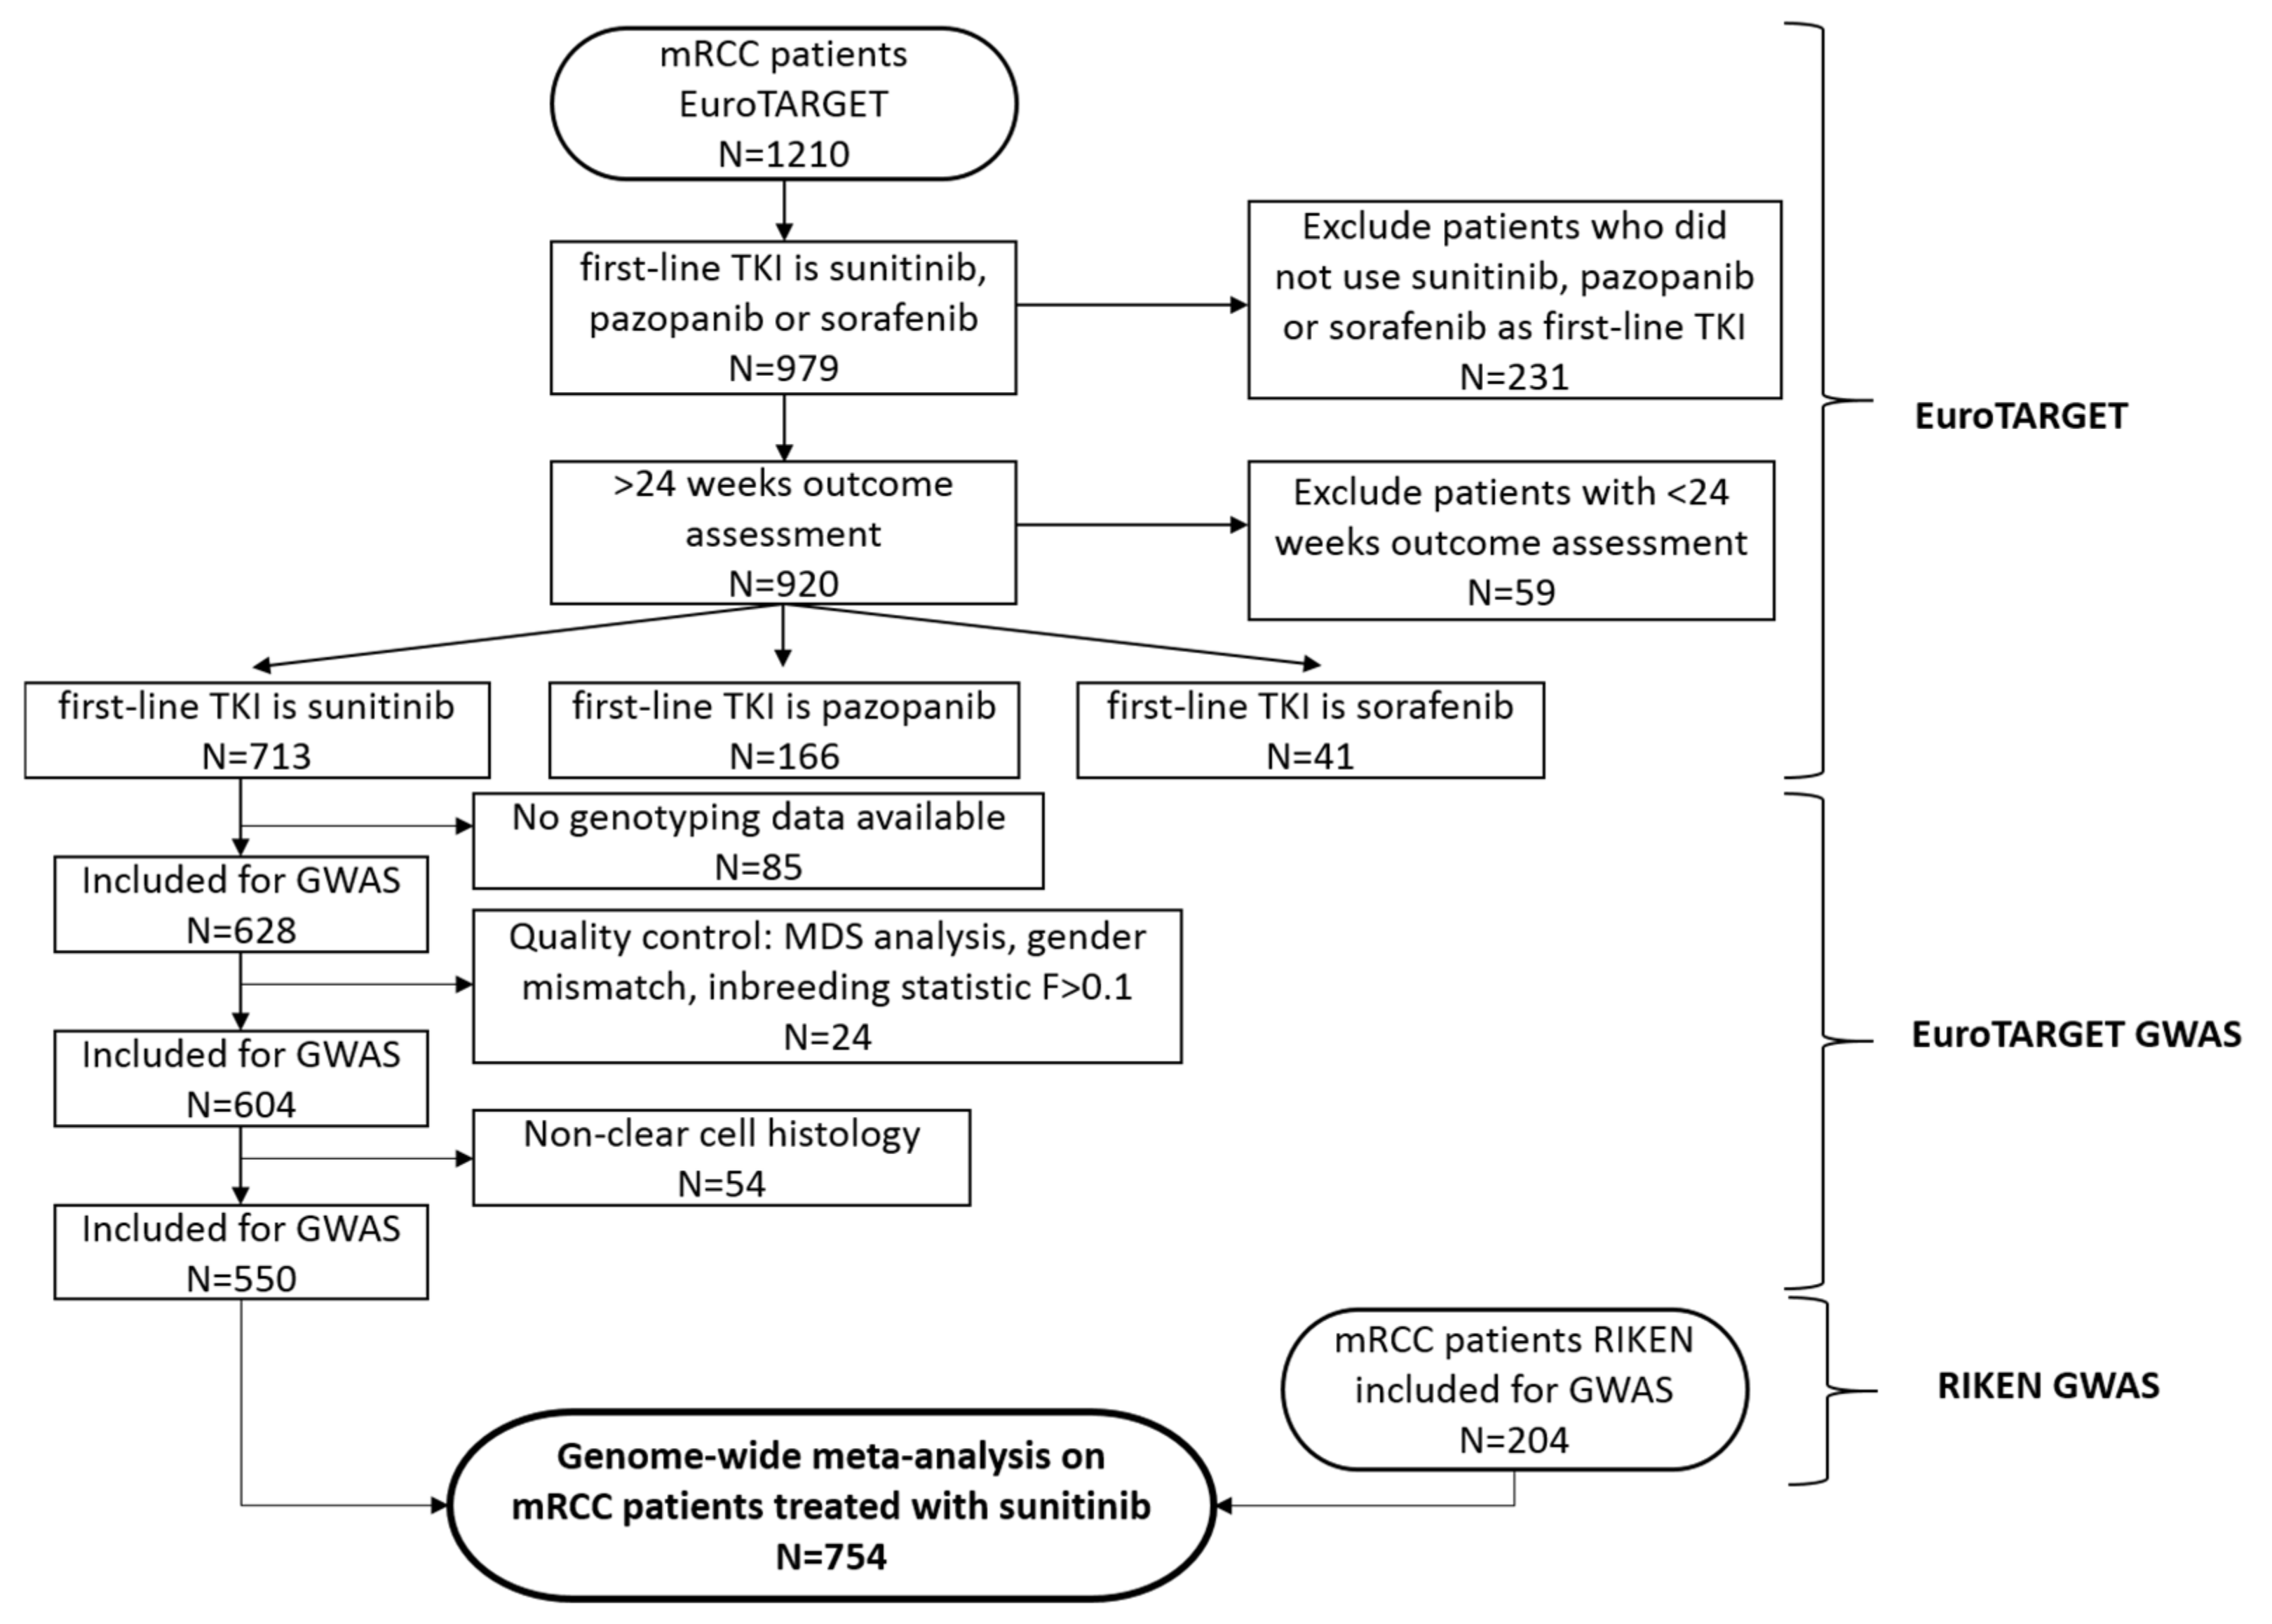
2.1. Patient Cohorts

Within the EuroTARGET project, a collection of blood samples and tissue material of prospectively included patients is available as well as a collection of stored samples of ‘historical patients’ enrolled in earlier studies [21]. Patients were recruited at participating centres in the Netherlands, the United Kingdom, Iceland, Germany, Romania and Spain. The enrolment of patients in this study occurred from 2005 until 2015 [21,22]. Inclusion criteria for the EuroTARGET GWAS were a histologically confirmed diagnosis of mRCC, the use of sunitinib as a first TKI, the availability of germline DNA, and recorded clinical data on PFS and OS.
For the RIKEN cohort, a total of 219 mRCC patients treated with sunitinib were recruited from 15 Japanese medical institutes. PFS and OS data were available for 204 individuals. All patient data were collected at the Centre for Integrative Medical Sciences at the laboratory for pharmacogenomics of the research institution RIKEN, in Tokyo [23]. For this cohort, GWAS summary statistics (effect sizes, standard errors) were used in the current analyses.

2.2. Patient Selection

Patients from the EuroTARGET cohort were considered eligible for our genetic association analysis if genotyping data could be obtained, if the start date of sunitinib and a follow-up date after the start date were available, and if the follow-up after start of sunitinib until study end was more than 24 weeks. To enable informative future analyses, we only focus on the subset of patients for whom outcome could be assessed for at least 6 months (24 weeks). Patients were only included if no TKI or TKI-like anti-tumour treatment was given prior to sunitinib (Table S1). Patients with a clear cell histological subtype as well as those with unknown histology were included, while other histological subtypes were excluded [21]. For the ‘historical patients’ whole blood, serum or plasma material had been obtained. For each of the prospective patients, two 10 mL blood samples were collected. One of the two samples was stored in a central biobank in the Netherlands, and the other was used for genotyping. Genotyping of retrospective and prospective samples was performed at deCODE Genetics in Reykjavik, Iceland.
The EuroTARGET study has been approved by the local research ethics committees of all participating centres and all patients gave their written informed consent. For subjects of the Dutch SUTOX consortium (the ‘historical patients’ in the EuroTARGET cohort), DNA samples were anonymized by a third party according to the instructions stated in the Codes for Proper Use and Proper Conduct in the Self-Regulatory Codes of Conduct (www.federa.org (accessed on 24 March 2020)) [8,21].

2.3. Clinical Data Collection

For the analyses, we used the clinical EuroTARGET database version from October 2017. Clinical data from all patients of the EuroTARGET cohort were collected by medical file review and entered in web-based electronic case record forms (eCRFs) (Supplementary File S1a,b). Data included demographic information, baseline clinical characteristics, treatment lines, drug toxicities (Common Terminology Criteria for Adverse Events [CTCAE version 4.0]), tumour response (i.e., complete remission, partial remission, stable disease, or progressive disease), and death. Tumour response was defined according to RECIST version 1.1 and based on patient evaluation by local caregivers as given in the radiology report or medical record (no review of imaging) [21].

2.4. Genotyping and Quality Control (QC)

EuroTARGET: Genotyping of the EuroTARGET samples was conducted at deCODE genetics (Reykjavik, Iceland). Germline DNA isolated from whole blood with the Chemagic Blood kit (PerkinElmer, Waltham, Massachusetts, United States) was used for SNP genotyping on the Illumina Human OmniExpress BeadChips 12v1-1, 24v1-0, and 24v1-1 (Illumina, San Diego, CA, USA) [24]. Quality control (QC) checks for Eurotarget were performed using software R version 3.2.3 [25] and PLINK software, version 1.07 [26]. Individuals were excluded from analyses based on an individual genotype call rate <97%, gender mismatch between reported and estimated sex based on genotypes of the X-chromosome, or excess of heterozygous genotypes (i.e., inbreeding statistic of F > 0.1). Genetic markers were excluded based on a SNP call rate <97%, minor allele frequency (MAF) <1%, and a p-value ≤ 10−7 for the Hardy-Weinberg equilibrium (HWE) goodness-of-fit test. After exclusion of individuals and markers in these marginal QCs, the remaining set was used for integrative QC assessment. To evaluate the possibility of population stratification or outliers, multidimensional scaling (MDS) analysis was performed and pairwise identity by state (IBS) statistics was calculated to assess duplicates. Both MDS and IBS were computed using PLINK [26]. Individuals that were identified as outliers were excluded. SNP imputation was performed using shapeit and impute2 with default parameters and the reference panel 1000 genomes build version 3 with total ‘cosmopolitan’ set of individuals [27,28,29].
RIKEN: QC procedures for RIKEN were performed prior to association analyses and similar to those performed for the EuroTARGET cohort. Individuals were excluded based on an individual genotype call rate ≤98%. However, no exclusion was carried out based on excess of heterozygous genotypes. For population stratification, a principal components analysis (PCA) was executed in which all the 204 subjects were reported to be Japanese. Genetic markers were excluded based on a SNP call rate <97%, a MAF <1%, and a p-value ≤ 10−7 for HWE.

2.5. Genetic Association Analysis

Cox-regression analyses were performed for PFS and OS correcting for covariates. For the meta-analysis, data of the EuroTARGET cohort were combined with data from the RIKEN cohort [23]. GWAS summary statistics of both cohorts were combined using a fixed effect meta-analysis (R-package metafor). When summary statistics of only one study were available, this result was used in the combined analysis.
Eurotarget cohort: For each SNP, genotypes were tested for association with efficacy outcomes using Cox proportional hazard regression analysis. The primary efficacy endpoint was PFS and the secondary outcome was OS. PFS was defined as the time in months between the first day of sunitinib treatment and the date of progressive disease (PD) according to RECIST version 1.0 and 1.1. If no PD was observed, PFS was censored at the time of the last follow-up or death. OS was defined as the time in months between the first day of sunitinib treatment and the date of death or the date at which the patient was last known to be alive. SNPs and additional covariates age at start of sunitinib treatment, gender, country, and Heng prognostic risk group (favourable, intermediate or poor) were included in the cox regression for outcomes PFS and OS using an additive genetic model [30]. Statistical analyses were performed in R statistics version 3.2.3, using base package survival to evaluate Cox regressions. To impute missing values for the Heng variables (i.e., WHO performance status, haemoglobin, neutrophil count, thrombocytes, calcium, and time from diagnosis until start of sunitinib), R-package mice was used with 100 imputations. From these 100 imputations, the most likely Heng score was imputed as a single imputation. Associations with a p-value ≤ 5 × 10⁻⁸ were considered genome-wide significant. Associations between p = 5 × 10⁻⁸ and p = 5 × 10⁻⁷ were considered suggestive. Post association QC was performed by visual inspection of p-values in the Quantile-Quantile (QQ) plots and computation of the inflation factor λ.
RIKEN cohort: GWAS summary statistics (HRs and standard errors) in the RIKEN cohort were tested for association on PFS and OS. Association analyses were adjusted for age, gender, ECOG performance and RCC histology [23].

3. Results

3.1. Patients and Genetic Data

Clinical data were available for 713 sunitinib treated patients in the EuroTARGET cohort. In total, 85 patients were removed from the analysis because their blood sample contained insufficient DNA. The remaining 628 patients entered the QC prior to association analyses (Figure 1) [21]. The observed individual genotype call rates varied between 99.2 to 100% and met the quality criteria. Based on further quality control steps, 24 patients were excluded from analysis. A sample mix-up rate of 0.2% was observed resulting in the removal of two patients as well as 20 individuals recognized as outliers by the multi-dimensional scaling (MDS) analysis (Figure S1a,b). The mean inbreeding coefficient was F = 0.01 (95% CI: −0.02, 0.04), leading to the exclusion of two patients with an inbreeding coefficient of F > 0.1. Pairwise IBS scores are plotted in Figure S2. For efficacy analysis, 54 patients with a non-clear cell subtype of RCC were excluded. This resulted in a total of 550 mRCC patients for whom information on efficacy data and genotypes were available, and these were included in the EuroTARGET cohort analysis (Figure 1). The starting dose of sunitinib was 50 mg/day in most patients (n = 482, 87.6%) in a 4-weeks-on/2-weeks-off schedule. Patient characteristics for both the EuroTARGET cohort and the RIKEN cohort are shown in Table 1.
For the EuroTARGET cohort, median follow-up times of PFS and OS were 7.6 months (range: 3 days–112.5 months) and 17.0 months (range: 9 days–112.5 months), respectively. The quality criteria for statistical analysis were met for 679,324 SNPs based on measured genotypes (Table S2). This number was supplemented using SNP imputation procedures using the 1000 Genomes data as reference panel [29]. A total of 8,148,675 SNPs with a minor allele frequency (MAF) of >2% were analysed for the EuroTARGET cohort.
For the RIKEN cohort, median follow-up times of PFS and OS were 10.6 months (range: 0.4–69.7 months) and 12.3 months (range: 0.5–69.7 months), respectively. For the 204 individuals from the RIKEN cohort, QC procedures were performed prior to association analyses. A total of 5,518,066 SNPs with a minor allele frequency (MAF) of >2% were analysed for the RIKEN cohort.
Duration of prior drug treatment refers to the number of months that a patient has received an antitumor treatment prior to start with sunitinib that is not a TKI or TKI-like drug as mentioned in Table S1, because these patients have already been excluded from analyses.

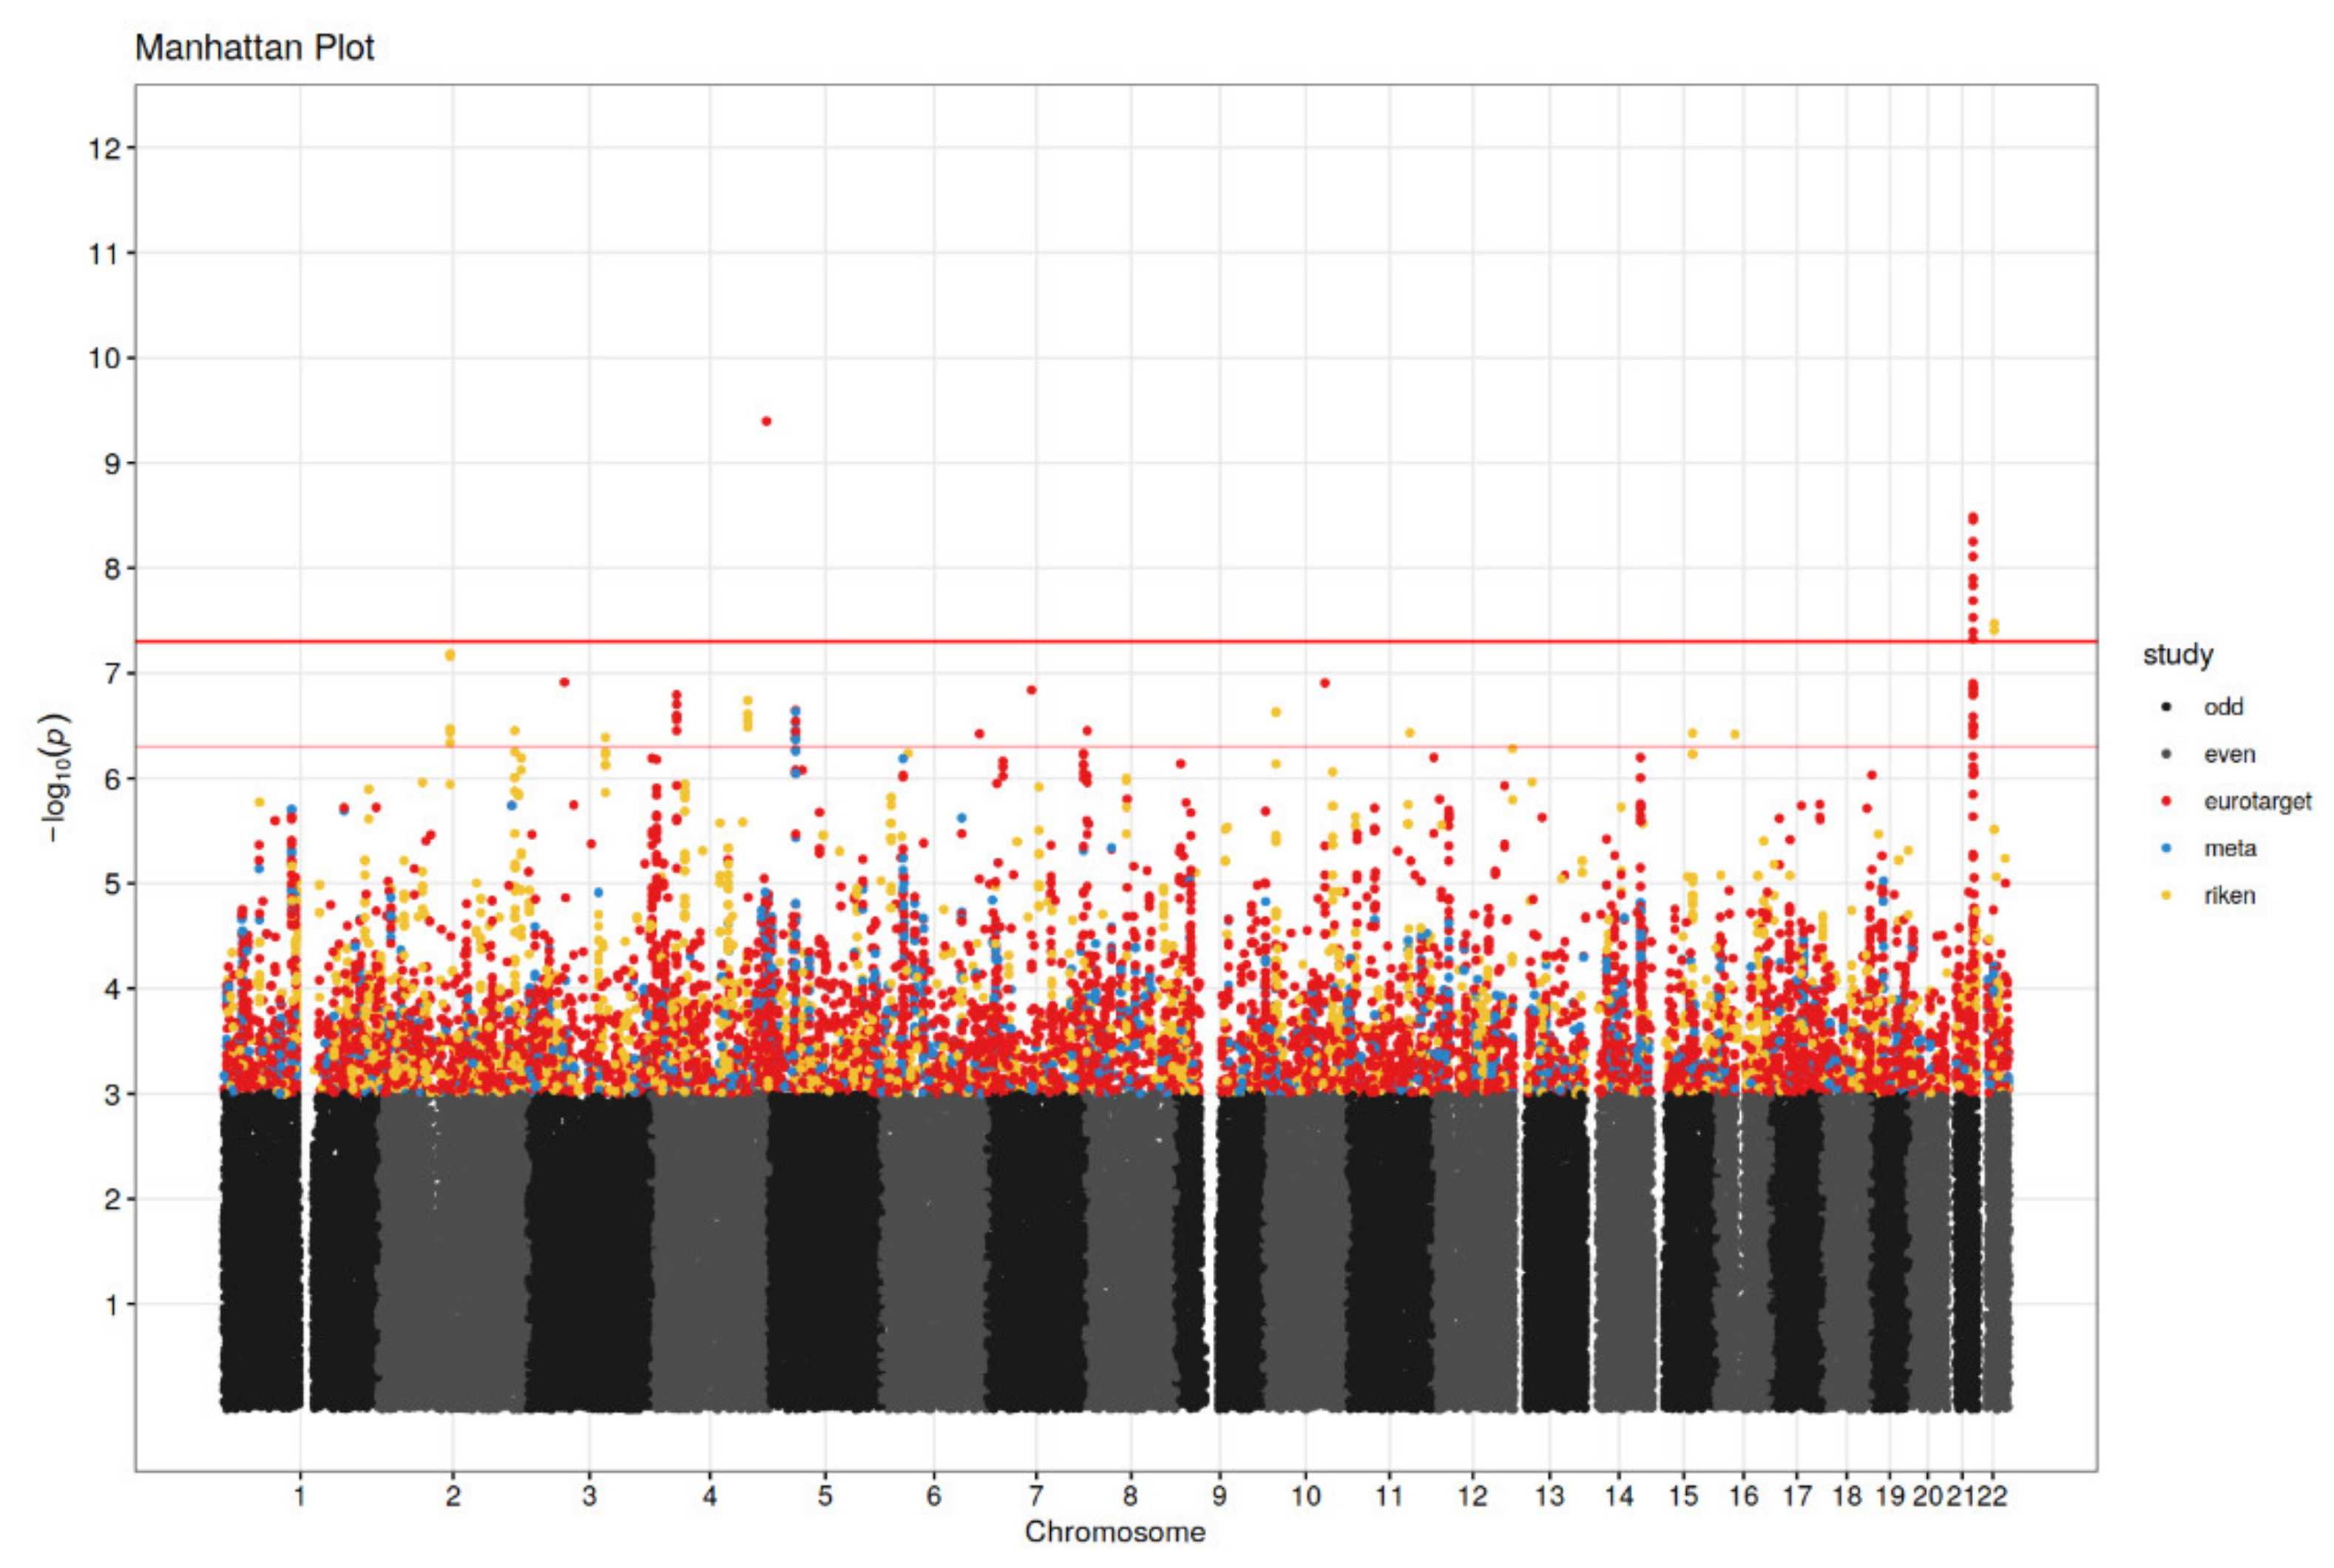
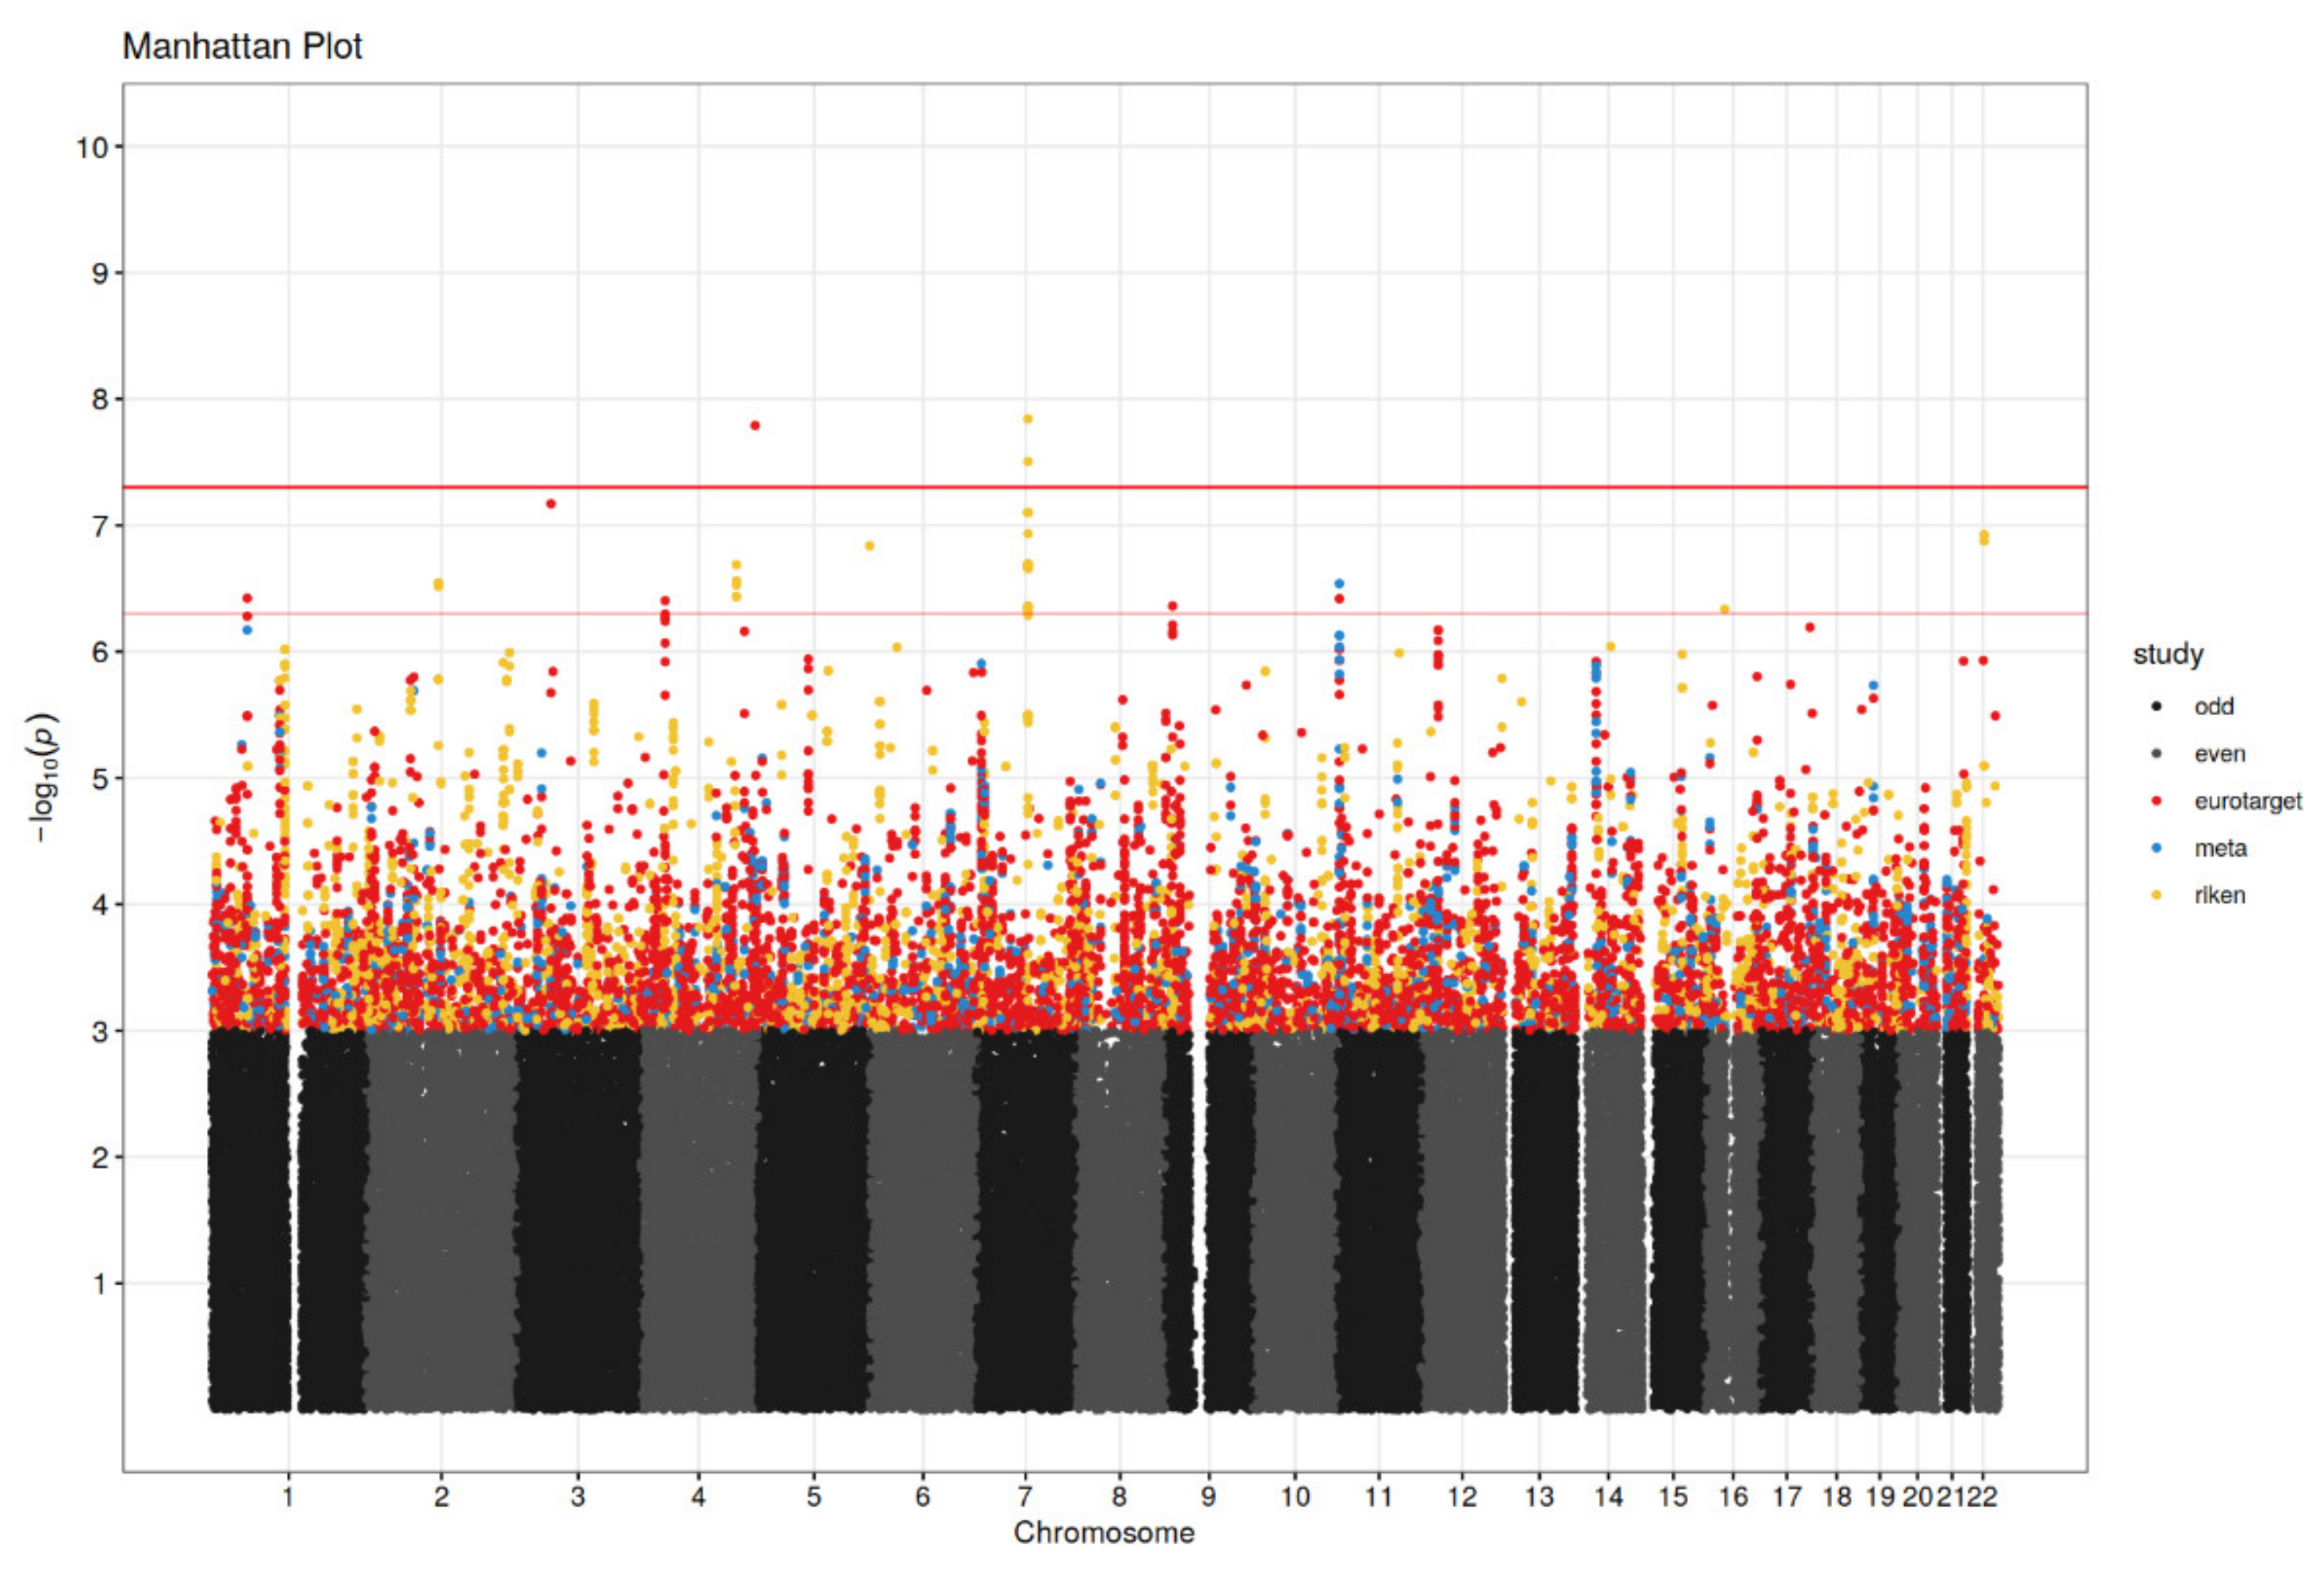
3.2. Genetic Association Analysis

For the meta-analysis, results of statistically significant or suggestive association with PFS or OS are presented in Table 2 and Table 3, respectively. The GWAS results for the meta-analysis and separate cohorts are visualized in Manhattan plots in Figure 2 and Figure 3. The associated SNPs in the meta-analysis come from imputed SNPs in the EuroTARGET cohort and are not present in the Japanese dataset. The annotation and interpretation of our findings therefore apply only to European populations. In the meta-analysis, SNP rs28520013 in PDLIM3 (p = 4.02 × 10⁻¹⁰, HR = 7.26), and SNPs rs2205096 (p = 5.60 × 10⁻⁹, HR = 2.5) and rs111356738 (p = 4.77 × 10⁻⁸, HR = 2.51), both in DSCAM, were significantly associated with PFS. Most of the SNPs in DSCAM show high levels of linkage disequilibrium (R2 > 0.8) (Supplementary File S2) suggesting a single causal variant at this locus. However, for SNPs rs2205096 and rs111356738 in DSCAM the R2 is 0.694. Furthermore, suggestive association with PFS was found for 7 SNPs in DSCAM, DNASE1L3, CALN1, LIMCH1, or in proximity of LOXL4, PYROXD2, HPS1, and HPSE2. Results from the meta-analysis on OS, showed that SNP rs28520013 in PDLIM3 (p = 1.62 × 10⁻⁸, HR = 5.96) was the statistically strongest finding. Additionally, SNPs in CACNA2D3, ART1, DAB1, LIMCH1, and SNPs close to PTPRD were suggestively associated with OS (p-values between 6.75 × 10⁻⁸ and 4.36 × 10⁻⁷). Median PFS for non-carriers of the PDLIM3 variant in rs28520013 was 12.5 months (95% CI: 10.9–14.9) versus only 5.1 months (95% CI: 1.5–6.2) for variant T-allele carriers (p = 4.02 × 10⁻¹⁰, HR = 7.26). For OS, the median was 30.2 months (95% CI: 27.4–33.4) for non-carriers of rs28520013 versus only 6.9 months (95% CI: 5.5–27.6) for the variant T-allele carriers (p = 1.62 × 10⁻⁸, HR = 5.96). The variant A-allele of SNPs rs2205096 in DSCAM was associated with an inferior PFS compared to non-carriers (p = 5.60 × 10⁻⁹, HR = 2.50) with a median PFS of 1.5 months for the AA genotype, 6.8 months for AT, and 12.6 months for the TT genotype. Also, the variant A-allele of rs111356738 in DSCAM was associated with an inferior PFS versus non-carriers (p = 4.77 × 10⁻⁸, HR = 2.51) with a median PFS of 1.5 months for the AA genotype, 5.6 months for AT, and 12.7 months for the TT genotype.
Significant or suggestive associations with PFS and OS in the RIKEN and EuroTARGET cohort separately are presented in Tables S3 and S4. The QQ plots from the EuroTARGET cohort are shown in Figure S3, with inflation factors of 1.08 and 1.05.

4. Discussion

This GWAS identified novel germline DNA variants in PDLIM3 and DSCAM for PFS and OS in sunitinib treated mRCC patients. The most significant finding with a large effect size on both PFS and OS was found for SNP rs28520013 in PDLIM3. Variants in PDLIM3 and DSCAM may well modify p21-associated kinases (PAKs) activity and influence the PI3K/AKT signalling pathway and thereby modify drug resistance and decrease sunitinib efficacy through NF-κB/IL-6 activation (Figure S4) [31,32,33,34,35,36,37,38,39]. Yet, this mechanism is hypothetical, based on previous literature findings. The underlying link between the identified novel candidate genes and the molecular mechanisms of sunitinib action remains to be elucidated.
This is the largest pharmacogenetic association study for outcome in sunitinib-treated mRCC patients to date. Our current knowledge on the pharmacology of sunitinib and its impact on efficacy is not represented in this GWAS, and thus may involve other mechanisms that contribute to efficacy. The suggestively associated SNP rs595883 with PFS in the meta-analysis was located close to LOXL4, which is in the same lysyl oxidase-like gene family as the earlier reported LOXL2 gene in the GWAS by Motzer et al. [19]. Furthermore, both the identified SNP associations for DSCAM, PDLIM3, and CACNA2D3 in this study as well as the earlier reported SNP associations for IL2RA in the GWAS of Motzer et al. may act via the PI3K/AKT pathway [19]. As opposed to earlier studies, we aimed to confirm our findings in a meta-analysis, which emphasizes robustness. However, rs28520013 in PDLIM3 was analysed only in the EuroTARGET cohort. On the other hand, rs28520013 was associated with both PFS and OS lending support to its importance.
The associated SNPs in PDLIM3 and in DSCAM are intronic variants. PDLIM3 encodes the PDLIM3 protein from the LIM family and contains a PDZ and LIM domain. This protein is found in muscle cells and polymorphisms in PDLIM3 were earlier associated with systolic blood pressure and an increased risk of cardiomyopathy [31]. It is assumed that PDLIM proteins negatively regulate NF-κB by inhibition of p65 activation. PDLIM1 deficiency in mice results in augmented production of cytokines [32]. Furthermore, a subfamily of the PDZ-LIM proteins (LIMK1) possibly interacts with receptor tyrosine kinases [33]. The DSCAM gene is located on chromosome 21q22.2-q22.3 in the Down Syndrome Critical Region (DSCR) and encodes the Down Syndrome Cell Adhesion Molecule (DSCAM), an immunoglobulin-superfamily member adhesion molecule. DSCAM regulates the function of p21-associated kinases (PAKs) that belong to the serine/threonine intracellular protein kinases [34,35,36]. Furthermore, expression of CACNA2D3 was reported to enhance chemosensitivity to cisplatin therapy by inducing Ca2+-mediated apoptosis and blocking the PI3K/AKT signalling pathways [37]. LOXL4 expression was related to an improved OS in liver cancer patients with wild-type p53 tumours [38]. A theory that fits with our findings is ‘phenoconversion’, in which an increased cytokine expression could inhibit the metabolism of sunitinib and thereby increase actual drug exposure, resulting in favourable PFS and OS outcomes [39].
Differences in associated loci or SNPs between the two cohorts may be explained by possible ethnicity-specific effects, including differences in MAFs. Also, the number of analysed SNPs and hence genome coverage differed between the two cohorts. When comparing SNPs across the cohorts allowing for some physical distance, more overlap can be identified in an explorative way. While other approaches are possible, such as gene-based analyses, they were outside the scope of this study. The frequency of the variant T-allele of rs28520013 in PDLIM3 in this study was 2.3% while the frequency reported in Asians in the NCBI database is 0.1% [40]. This suggests that an Asian population can hardly contribute to this SNP association. For the variant A-allele of rs2205096 in DSCAM the MAF reported in this study is 6.3%, whereas the reported MAF for Asians in the NCBI database is 36% [40]. SNPs rs2205096 and rs111356738 in DSCAM are moderately to highly correlated (R2 = 0.7) and other observed SNPs in DSCAM were strongly correlated with rs2205096 (R2 > 0.8). Hence, SNPs in DSCAM are likely not to act independently on PFS, and sequence analyses and possibly experimental systems would be needed to determine the actual causal variant.
A clear distinction between the prognostic or predictive character of the current identified relevant SNPs is not yet possible. An increased PAK function is often seen in tumours and is correlated with angiogenesis, tumour progression and a poor prognosis [36]. Yet, the influence of sunitinib and genetic variants on the PAK/PI3K/AKT pathway are not clear yet. Hypothetically, pharmacogenetic effects in this pathway could lead to drug resistance or a poor response to sunitinib [31,32,33,34,35,36,37,38].
The treatment arsenal for mRCC patients has undergone a very rapid development, with many new treatments being added in recent years. Immune checkpoint inhibitors (ICI) are now an essential element of therapy and there is increasing evidence that combination therapies with two ICIs or a ICI with a TKI are highly effective in mRCC [3]. Although sunitinib is no longer first-line treatment of mRCC, for some patients it still remains the best option or provides an effective second-line treatment for patients who have progressed to first-line ICIs. In addition, sunitinib now serves as a reference standard in studies to compare with new treatment options. It is therefore still important to be able to use sunitinib in the most optimal way. Indeed, while many treatment options for mRCC available, no validated markers have been identified yet to ensure that each individual receives the most appropriate treatment tailored to their individual characteristics. Our future aim therefore remains to use the patient’s genetic profile to predict the efficacy or toxicity on treatment with sunitinib, another TKI or an ICI. This GWAS serves as an important step in that direction. Likewise, it would be clinically relevant to investigate whether the variants in PDLIM3 and DSCAM will also be predictive for PFS and OS of other TKIs given in mono- or combination therapy (e.g., axitinib and cabozantinib) to discover similar properties within this group of drugs. The knowledge gained from this GWAS and earlier candidate gene studies on sunitinib with regard to study design, data analysis and interpretation, will therefore be useful in follow-up studies on pharmacogenetics in other drugs used in mRCC or as a lead in new drug development. By building further on this research, we ultimately expect to know for each drug which pre-emptive genotyping test should be performed in order to optimally treat each unique mRCC patient.
The use of a structured eCRF ensured consistency in data collection by all participating EuroTARGET centres. Some single variables for calculating the Heng score were not present in all patients. Using the multiple imputation procedure to infer uncertain Heng risk group was necessary for only 17% of patients which we consider to be of low impact. The genome inflation factors in this analysis were above 1.05 suggesting slightly inflated test statistics. The moderate sample size prevented us from fitting larger models, for example including several principal components. Another limitation is the relatively small sample size for both studies, which substantially reduced the overlap of imputed SNPs when filtered at the 2% MAF level. Additionally, the small sample size leads to biased effect estimates when studying the strongest associated SNPs. HRs therefore have to be interpreted with care.
The findings presented in this study provide new insight into the pharmacogenetics of sunitinib with possible determinants of drug efficacy in mRCC patients (Figure S4).

5. Conclusions

We identified germline DNA variants in PDLIM3 and DSCAM as novel determinants of PFS and OS in sunitinib-treated mRCC patients. The underlying link between the identified novel candidate genes and the molecular mechanisms of sunitinib action needs to be elucidated.

Supplementary Materials

The following supporting information can be downloaded at: https://www.mdpi.com/article/10.3390/cancers14122838/s1, Figure S1: Multi-dimensional scaling (MDS); Figure S2: Pairwise IBS values form the basis for MDS and the IBD/IBS clustering. Figure S3: Quantile-Quantile (QQ) plots for the EuroTARGET cohort. Figure S4: Genetic variants that possibly affect PFS and OS of sunitinib in mRCC. Table S1: List of TKIs or TKI-like antitumor treatments. Table S2: Summary of exclusions of markers for QC steps. Table S3a: GWAS significantly or suggestively associated SNPs with PFS from the EuroTARGET cohort. Table S3b: GWAS significantly or suggestively associated SNPs with PFS from the RIKEN cohort. Supplementary File S1a: EuroTARGET eCRF. Supplementary File S1b: User Manual EuroTARGET eCRF. Supplementary File S2: Linkage Disequilibrium (LD) with R2 values for DSCAM gene variants.

Author Contributions

Conceptualization, M.H.M.D., J.J.S., S.B., H.-J.G. and L.A.L.M.K.; methodology, M.H.M.D., J.J.S., S.B. and H.-J.G.; software, M.H.M.D. and S.B.; validation, M.H.M.D., J.J.S., S.B. and H.-J.G.; formal analysis, M.H.M.D., T.M. (Taisei Mushiroda), F.H., T.M. (Tsuneharu Miki), S.B., M.K. and H.-J.G.; investigation, M.H.M.D., S.B., J.J.S. and H.-J.G.; resources, L.F.M.v.d.Z., E.B., R.H.J.M., K.F., T.M. (Taisei Mushiroda), F.H., E.O., A.C.-T., D.C., A.F., J.G.D., C.R.-A., R.R., M.T.R., T.E., K.J., M.R., U.J., T.M. (Tsuneharu Miki), S.B., M.K. and H.-J.G.; data curation, M.H.M.D., L.F.M.v.d.Z. and S.B.; writing—original draft preparation, M.H.M.D., J.J.S., H.-J.G. and S.B.; writing—reviewing and editing, M.H.M.D., J.J.S., L.F.M.v.d.Z., S.H.V., E.B., R.H.J.M., K.F., T.M. (Taisei Mushiroda), F.H., E.O., A.C.-T., D.C., A.F., J.G.D., C.R.-A., R.R., M.T.R., T.E., K.J., M.R., U.J., T.M. (Tsuneharu Miki), M.K., L.A.L.M.K. and H.-J.G.; visualization, M.H.M.D., L.F.M.v.d.Z. and S.B.; supervision, J.J.S. and H.-J.G.; project administration, M.H.M.D.; funding acquisition, L.A.L.M.K. All authors have read and agreed to the published version of the manuscript.

Funding

The research leading to these results has received funding from the European Union’s Seventh Framework Programme (FP7/2007-2013) under grant agreement no 259939.

Institutional Review Board Statement

The study was conducted in accordance with the Declaration of Helsinki, and approved by the Institutional Review Boards (or Ethics Committees) of all participating institues in the EuroTARGET consortium: A European collaborative project on TArgeted therapy in renal cell cacer-GEnetic- and tumor-related bomarkers for response and toxicity (EuroTARGET).

Informed Consent Statement

EuroTARGET is an international, multicenter observational study that started in March 2011. The EuroTARGET study has been approved by the local research ethics committees of all participating centres and all patients gave their written informed consent. A total of 748 patients were recruited prospectively in 62 centers; 36 in The Netherlands, 16 in Spain, 8 in Germany, 1 in Romania, and 1 in the United Kingdom. Patient identification and invitation procedures differed per country, but at all locations, the following were the inclusion criteria: patients gave written informed consent, were at least 18 years of age, and had newly diagnosed metastatic renal-cell carcinoma. Patients were enrolled in the study regardless of RCC subtype and (pre)treatment. For this GWAS, a separate selection of patients was applied (Figure 1). For subjects of the Dutch SUTOX consortium (the ‘historical patients’ in the EuroTARGET cohort), DNA samples were anonymized by a third party according to the instructions stated in the Codes for Proper Use and Proper Conduct in the Self-Regulatory Codes of Conduct (www.federa.org (accessed on 24 March 2020)). For more details, we refer to van der Zanden et al. [21] in which a description of the Eurotarget cohort is given. All authors are mebers of the EuroTARGET consortium: A European collaborative project on TArgeted therapy in renal cell cacer-GEnetic- and tumor-related bomarkers for response and toxicity (EuroTARGET).

Data Availability Statement

All clinical and platform data generated in EuroTARGET are freely available in an anonymized way for the research community. The data can be accessed through the European Genome-phenome Archive (EGA) which is the controlled access repository under the European Bioinformatics Institute (EMBL-EBI). Interested parties will be able to find the EuroTARGET project under the Studies section.

Acknowledgments

We would like to thank our collaborators from all EuroTARGET participating centers for their help in the EuroTARGET project on patient inclusion and data collection.

Conflicts of Interest

Ron HJ Mathijssen received unrestricted grants for investigator-initiated research from Astellas, Bayer, Boehringer-Ingelheim, Cristal Therapeutics, Novartis, Pamgene, Pfizer, Roche, Sanofi, and Servier. Daniel Castellano reported personal financial interests in Astellas, Astra Zeneca, BMS, GSK, Ipsen, Janssen, MSD, Novartis, Pfizer, and Roche. As a local PI Daniel Castellano reported to have no financial interest in Astellas, Astra Zeneca, Bayer, BMS, Clovis, EISAI, Exelisis, GSK, Ipsen, Janssen, Lilly, MSD, Pfizer, QED, and Roche. Further, he reported non-financial interests for SOGUG (the Spanish Oncology Genito-Urinary Group). Jesus Garcia Donas reported financial interests in research funding from Astra Zeneca, BMS, GSK, Ipsen, Janssen, MSD, Novartis, Pfizer, Roche, Bayer, and Clovis. The other authors have no conflicts of interest to declare. The funders had no role in the design of the study; in the collection, analyses, or interpretation of data; in the writing of the manuscript, or in the decision to publish the results. Other authors declare no conflict of interest.

References

  1. Van Erp, N.P.; Eechoute, K.; van der Veldt, A.A.; Haanen, J.B.; Reyners, A.K.L.; Mathijssen, A.H.J.; Boven, E.; van der Straaten, T.; Baak-Pablo, R.F.; Wessels, J.A.M.; et al. Pharmacogenetic pathway analysis for determination of sunitinib-induced toxicity. J. Clin. Oncol. 2009, 27, 4406–4412. [Google Scholar] [CrossRef] [Green Version]
  2. Garcia-Donas, J.; Esteban, E.; Leandro-García, L.J.; Castellano, D.E.; González del Alba, A.; Climent, M.A.; Arranz, J.A.; Gallardo, E.; Puente, J.; Bellmunt, J.; et al. Single nucleotide polymorphism associations with response and toxic effects in patients with advanced renal-cell carcinoma treated with first-line sunitinib: A multicentre, observational, prospective study. Lancet Oncol. 2011, 12, 1143–1150. [Google Scholar] [CrossRef]
  3. Alessandro Rizzo, A.; Mollica, V.; Santoni, M.; Ricci, A.D.; Rosellini, M.; Marchetti, A.; Montironi, R.; Ardizzoni, A.; Massari, F. Impact of Clinicopathological Features on Survival in Patients Treated with First-line Immune Checkpoint Inhibitors Plus Tyrosine Kinase Inhibitors for Renal Cell Carcinoma: A Meta-analysis of Randomized Clinical Trials. Eur. Urol. Focus. 2021; online ahead of print. [Google Scholar] [CrossRef]
  4. Linehan, W.M.; Ricketts, C.J. The Cancer Genome Atlas of renal cell carcinoma: Findings and clinical implications. Nat. Rev. Urol. 2019, 16, 539–552. [Google Scholar] [CrossRef] [PubMed]
  5. Houk, B.E.; Bello, C.L.; Kang, D.; Amantea, M. A population pharmacokinetic meta-analysis of sunitinib malate (SU11248) and its primary metabolite (SU12662) in healthy volunteers and oncology patients. Clin. Cancer Res. 2009, 15, 2497–2506. [Google Scholar] [CrossRef] [Green Version]
  6. Diekstra, M.H.M.; Swen, J.J.; Gelderblom, H.; Guchelaar, H.J. A decade of pharmacogenomics research on tyrosine kinase inhibitors in metastatic renal cell cancer: A systematic review. Exp. Rev. Mol. Diagn. 2016, 16, 605–618. [Google Scholar] [CrossRef]
  7. Rini, B.I.; Cohen, D.P.; Lu, D.R.; Chen, I.; Hariharan, S.; Gore, M.E.; Figlin, R.A.; Baum, M.S.; Motzer, R.J. Hypertension as a biomarker of efficacy in patients with metastatic renal cell carcinoma treated with sunitinib. J. Natl. Cancer Inst. 2011, 103, 763–773. [Google Scholar] [CrossRef] [Green Version]
  8. Van der Veldt, A.A.; Eechoute, K.; Gelderblom, H.; Gietema, J.; Guchelaar, H.J.; van Erp, N.P.; van den Eertwegh, A.J.M.; Haanen, J.B.; Mathijssen, R.H.J.; Wessels, J.A.M. Genetic polymorphisms associated with a prolonged progression-free survival in patients with metastatic renal cell cancer treated with sunitinib. Clin. Cancer Res. 2011, 17, 620–629. [Google Scholar] [CrossRef] [Green Version]
  9. Kim, J.J.; Vaziri, S.A.J.; Rini, B.I.; Elson, P.; Garcia, J.A.; Wirka, R.; Dreicer, R.; Ganapathi, M.K.; Ganapathi, R. Association of VEGF and VEGFR2 single nucleotide polymorphisms with hypertension and clinical outcome in metastatic clear cell renal cell carcinoma patients treated with sunitinib. Cancer 2012, 118, 1946–1954. [Google Scholar] [CrossRef]
  10. Eechoute, K.; van der Veldt, A.A.M.; Oosting, S.; Kappers, M.H.W.; Wessels, J.A.M.; Gelderblom, H.; Guchelaar, H.J.; Reyners, A.K.L.; van Herpen, C.M.L.; Haanen, J.B.; et al. Polymorphisms in endothelial nitric oxide synthase (eNOS) and vascular endothelial growth factor (VEGF) predict sunitinib-induced hypertension. Clin. Pharmacol. Ther. 2012, 92, 503–510. [Google Scholar] [CrossRef]
  11. Beuselinck, B.; Karadimou, A.; Lambrechts, D.; Claes, B.; Wolter, P.; Couchy, G.; Berkers, J.; Paridaens, R.; Schöffski, P.; Méjean, A.; et al. Single-nucleotide polymorphisms associated with outcome in metastatic renal cell carcinoma treated with sunitinib. Br. J. Cancer 2013, 108, 887–900. [Google Scholar] [CrossRef] [Green Version]
  12. Beuselinck, B.; Lambrechts, D.; Van Brussel, T.; Wolter, P.; Cardinaels, N.; Joniau, S.; Lerut, E.; Karadimou, A.; Couchy, G.; Sebe, P.; et al. Efflux pump ABCB1 single nucleotide polymorphisms and dose reductions in patients with metastatic renal cell carcinoma treated with sunitinib. Acta Oncol. 2014, 53, 1413–1422. [Google Scholar] [CrossRef] [Green Version]
  13. Beuselinck, B.; Karadimou, A.; Lambrechts, D.; Claes, B.; Wolter, P.; Couchy, G.; Berkers, J.; van Poppel, H.; Paridaens, R.; Schöffski, P.; et al. VEGFR1 single nucleotide polymorphisms associated with outcome in patients with metastatic renal cell carcinoma treated with sunitinib—A multicentric retrospective analysis. Acta Oncol. 2014, 53, 103–112. [Google Scholar] [CrossRef] [Green Version]
  14. Diekstra, M.H.M.; Klümpen, H.J.; Lolkema, M.P.J.K.; Yu, H.; Kloth, J.S.L.; Gelderblom, H.; van Schaik, R.H.N.; Gurney, H.; Swen, J.J.; Huitema, A.D.R.; et al. Association analysis of genetic polymorphisms in genes related to sunitinib pharmacokinetics, specifically clearance of sunitinib and SU12662. Clin. Pharmacol. Ther. 2014, 96, 81–89. [Google Scholar] [CrossRef] [Green Version]
  15. Motzer, R.J.; Johnson, T.; Choueiri, T.K.; Deen, K.C.; Xue, Z.; Pandite, L.N.; Carpenter, C.; Xu, C.F. Hyperbilirubinemia in pazopanib- or sunitinib-treated patients in COMPARZ is associated with UGT1A1 polymorphisms. Ann. Oncol. 2013, 24, 2927–2928. [Google Scholar] [CrossRef]
  16. Xu, C.F.; Johnson, T.; Garcia-Donas, J.; Choueiri, T.K.; Sternberg, C.N.; Davis, I.D.; Bing, N.; Deen, K.C.; Xue, Z.; McCann, L.; et al. IL8 polymorphisms and overall survival in pazopanib- or sunitinib-treated patients with renal cell carcinoma. Br. J. Cancer 2015, 112, 1190–1198. [Google Scholar] [CrossRef] [Green Version]
  17. Diekstra, M.H.M.; Swen, J.J.; Boven, E.; Castellano, D.; Gelderblom, H.; Mathijssen, R.H.J.; Rodríguez-Antona, C.; García-Donas, J.; Rini, B.I.; Guchelaar, H.J. CYP3A5 and ABCB1 Polymorphisms as Predictors for Sunitinib Outcome in Metastatic Renal Cell Carcinoma. Eur. Urol. 2015, 68, 621–629. [Google Scholar] [CrossRef]
  18. Low, S.K.; Takahashi, A.; Mushiroda, T.; Kubo, M. Genome-Wide Association Study: A useful tool to identify common genetic variants associated with drug toxicity and efficacy in cancer pharmacogenomics. Clin. Cancer Res. 2014, 20, 2541–2552. [Google Scholar] [CrossRef] [Green Version]
  19. Johnson, T.; Xu, C.F.; Choueiri, T.K.; Figlin, R.A.; Sternberg, C.N.; King, K.S.; Xue, Z.; Stinnett, S.; Deen, K.C.; Carpenter, C.; et al. Genome-wide association study (GWAS) of efficacy and safety endpoints in pazopanib- or sunitinib-treated patients with renal cell carcinoma (RCC), ASCO annual meeting abstract. J. Clin. Oncol. 2014, 32, 5s. Available online: https://ascopubs.org/doi/abs/10.1200/jco.2014.32.15_suppl.4503 (accessed on 4 April 2022). [CrossRef]
  20. Motzer, R.J.; Hutson, T.E.; Cella, D.; Reeves, J.; Hawkins, R.; Guo, J.; Nathan, P.; Staehler, M.; de Souza, P.; Merchan, J.R.; et al. Pazopanib versus sunitinib in metastatic renal-cell carcinoma. N. Engl. J. Med. 2013, 369, 722–731. [Google Scholar] [CrossRef] [Green Version]
  21. Van der Zanden, L.F.; Vermeulen, S.H.; Oskarsdottir, A.; Maurits, J.S.F.; Diekstra, M.H.M.; Ambert, V.; Cambon-Thomsen, A.; Castellano, D.; Fritsch, A.; Garcia Donas, J.; et al. Description of the EuroTARGET cohort: A European collaborative project on Targeted therapy in Renal cell cancer: Genetic and Tumour related biomarkers for response and toxicity. Urol. Oncol. 2017, 35, e9–e16. [Google Scholar] [CrossRef]
  22. De Groot, S.; Sleijfer, S.; Redekop, W.K.; Oosterwijk, E.; Haanen, J.B.A.G.; Kiemeney, L.A.L.M.; Uyl-de Groot, C.A. Variation in use of targeted therapies for metastatic renal cell carcinoma: Results from a Dutch population-based registry. BMC Cancer 2016, 16, 364. [Google Scholar] [CrossRef] [Green Version]
  23. Low, S.-K.; Fukunaga, K.; Takahashi, A.; Matsuda, K.; Hongo, F.; Nakanishi, H.; Kitamura, H.; Inoue, T.; Kato, Y.; Tomita, Y.; et al. Association Study of a Functional Variant on ABCG2 Gene With Sunitinib-Induced Severe Adverse Drug Reaction. PLoS ONE 2016, 11, e0148177. [Google Scholar] [CrossRef]
  24. Illumina Human OmniExpress BeadChips. Available online: https://support.illumina.com/content/illumina-support/us/en/downloads.html (accessed on 4 April 2022).
  25. R Core Team. R: A Language and Environment for Statistical Computing; R Foundation for Statistical Computing: Vienna, Austria, 2013; Available online: http://www.R-project.org/ (accessed on 4 April 2022).
  26. Purcell, S.; Neale, B.; Todd-Brown, K.; Thomas, L.; Ferreira, M.A.R.; Bender, D.; Maller, J.; Sklar, P.; de Bakker, P.I.W.; Daly, M.J.; et al. PLINK: A toolset for whole-genome association and population-based linkage analysis. Am. J. Hum. Genet. 2007, 81, 559–575. [Google Scholar] [CrossRef] [Green Version]
  27. Marchini, J.; Howie, B.; Myers, S.; McVean, G.; Donnelly, P. A new multipoint method for genome-wide association studies via imputation of genotypes. Nat. Genet. 2007, 39, 906–913. [Google Scholar] [CrossRef]
  28. Delaneau, O.; Marchini, J.; Zagury, J.F. A linear complexity phasing method for thousands of genomes. Nat. Methods 2011, 9, 179–181. [Google Scholar] [CrossRef] [PubMed]
  29. 1000 Genomes Project Consortium; Abecasis, G.R.; Auton, A.; Brooks, L.D.; DePristo, M.A.; Durbin, R.M.; Handsaker, R.E.; Kang, H.M.; Marth, G.T.; McVean, G.A. An integrated map of genetic variation from 1092 human genomes. Nature 2012, 491, 56–65. Available online: http://www.1000genomes.org/home. [CrossRef] [Green Version]
  30. Heng, D.Y.C.; Xie, W.; Regan, M.M.; Warren, M.A.; Golshayan, A.R.; Sahi, C.; Eigl, B.J.; Ruether, J.D.; Cheng, T.; North, S.; et al. Prognostic factors for overall survival in patients with metastatic renal cell carcinoma treated with vascular endothelial growth factor-targeted agents: Results from a large, multicenter study. J. Clin. Oncol. 2009, 27, 5794–5799. [Google Scholar] [CrossRef]
  31. Wang, D.; Fang, J.; Lv, J.; Pan, Z.; Yin, X.; Cheng, H.; Guo, X. Novel polymorphisms in PDLIM3 and PDLIM5 gene encoding Z-line proteins increase risk of idiopathic dilated cardiomyopathy. J. Cell Mol. Med. 2019, 23, 7054–7062. [Google Scholar] [CrossRef] [Green Version]
  32. Ono, R.; Kaisho, T.; Tanaka, T. PDLIM1 inhibits NF-κB-mediated inflammatory signaling by sequestering the p65 subunit of NF-κB in the cytoplasm. Sci. Rep. 2015, 5, 18327. [Google Scholar] [CrossRef] [PubMed] [Green Version]
  33. Krcmery, J.; Camarata, T.; Kulisz, A.; Simon, H.G. Nucleocytoplasmic functions of the PDZ-LIM protein family: New insights into organ development. Bioessays 2010, 32, 100–108. [Google Scholar] [CrossRef] [PubMed] [Green Version]
  34. Pérez-Núñez, R.; Barraza, N.; Gonzalez-Jamett, A.; Cárdenas, A.M.; Barnier, J.V.; Caviedes, P. Overexpressed Down Syndrome Cell Adhesion Molecule (DSCAM) Deregulates P21-Activated Kinase (PAK) Activity in an In Vitro Neuronal Model of Down Syndrome: Consequences on Cell Process Formation and Extension. Neurotox. Res. 2016, 30, 76–87. [Google Scholar] [CrossRef] [PubMed]
  35. Jia, Y.L.; Jing, L.J.; Li, J.Y.; Lu, J.J.; Han, R.; Wang, S.Y.; Peng, T.; Jia, Y.J. Expression and significance of DSCAM in the cerebral cortex of APP transgenic mice. Neurosci. Lett. 2011, 491, 153–157. [Google Scholar] [CrossRef]
  36. Zhu, Y.; Liu, H.; Xu, L.; An, H.; Liu, W.; Liu, Y.; Lin, Z.; Xu, J. p21-activated kinase 1 determines stem-like phenotype and sunitinib resistance via NF-κB/IL-6 activation in renal cell carcinoma. Cell Death Dis. 2015, 6, e1637. [Google Scholar] [CrossRef] [Green Version]
  37. Nie, C.; Qin, X.; Li, X.; Tian, B.; Zhao, Y.; Jin, Y.; Li, Y.; Wang, Q.; Zeng, D.; Hong, A.; et al. CACNA2D3 Enhances the Chemosensitivity of Esophageal Squamous Cell Carcinoma to Cisplatin via Inducing Ca 2+-Mediated Apoptosis and Suppressing PI3K/Akt Pathways. Front. Oncol. 2019, 9, 185. [Google Scholar] [CrossRef]
  38. Shao, J.; Lu, J.; Zhu, W.; Yu, H.; Jing, X.; Wang, Y.L.; Wang, X.; Wang, X.J. Derepression of LOXL4 inhibits liver cancer growth by reactivating compromised p53. Cell Death Differ. 2019, 26, 2237–2252. [Google Scholar] [CrossRef]
  39. De Jong, L.M.; Jiskoot, W.; Swen, J.J.; Manson, M.L. Distinct effects of inflammation on cytochrome P450 regulation and drug metabolism: Lessons from experimental models and a potential role for pharmacogenetics. Genes 2020, 11, 1509. [Google Scholar] [CrossRef]
  40. Sherry, S.T.; Ward, M.H.; Kholodov, M.; Baker, J.; Phan, L.; Smigielski, E.M.; Sirotkin, K. dbSNP: The NCBI database of genetic variation. Nucleic Acids Res. 2001, 29, 308–311. [Google Scholar] [CrossRef] [Green Version]
Figure 1. Flowchart on patient inclusion EuroTARGET and RIKEN. N indicates the number of patients. In total, 1210 mRCC patients were included in EuroTARGET, of which 748 were collected prospectively and 462 were available as historical (retrospective) series at the start of EuroTARGET [21]. Of the 1210 patients, we selected the 979 patients (81%) who received sunitinib, sorafenib, or pazopanib as first TKI (remainder of patients did for example have no treatment or were treated with an mTOR inhibitor or other TKI). We did not exclude patients who used cytokine therapy before the TKI. To allow for informative analyses, we only focused on the subset of 920 patients for whom outcome could be assessed for at least 6 months (24 weeks). Patients with missing genotypes (N = 85) were excluded for GWAS purposes. 24 patients were excluded after Quality Control (QC) checks. For efficacy analyses, 54 non-clear cell patients were excluded resulting in 550 patients available for the EuroTARGET GWAS [21]. An additional 204 patients from 15 Japanese medical institutes, the RIKEN cohort, was included to test efficacy endpoints in a genome-wide meta-analysis on mRCC patients treated with sunitinib.
Cancers 14 02838 g001
Figure 2. Manhattan plot for progression-free survival (PFS) analysis. Significance threshold (red horizontal line in bold) is set to p = 5 × 10⁻⁸ and p-values ≤ 5 × 10⁻⁷ (between red horizontal lines) were considered suggestive. Results are shown for EuroTARGET (red dots), RIKEN (green dots) and the meta-analysis (purple dots). Chromosomes are represented in odd numbers (black) and even numbers (grey).
Cancers 14 02838 g002
Figure 3. Manhattan plot for overall survival (OS) analysis. Significance threshold (red horizontal line in bold) is set to p = 5 × 10⁻⁸ and p-values ≤ 5 × 10⁻⁷ (between red horizontal lines) were considered suggestive. Results are shown for EuroTARGET (red dots), RIKEN (green dots) and the meta-analysis (purple dots). Chromosomes are represented in odd numbers (black) and even numbers (grey).
Cancers 14 02838 g003
Table 1. Patient characteristics. Patients diagnosed with metastatic renal cell carcinoma, treated with sunitinib, and included for efficacy analyses for EuroTARGET cohort (n = 550) and Japanese RIKEN cohort (n = 204).
EuroTARGETRIKEN
CharacteristicValue (Range)%Value (Range)%
Gender
■ male4057415174
■ female145265326
Median age at start sunitinib (years)63 (33–87)
Country
■ Netherlands28151
■ Spain (SOGUG)16830.5
■ Germany (CESAR)397
■ Iceland (Landspitali University Hospital)275
■ United Kingdom (Addenbrooke’s Cambridge)203.5
■ Romania (University of Medicine and Farmacy Carol Davila)153
■ Japan 204100
Prior nephrectomy before start sunitinib
■ yes20136.516681
■ no34963.53216
■ unknown 63
WHO performance status (EuroTARGET), ECOG performance status (RIKEN)
■ 020637.514672
■ 120637.54422
■ 2254.5105
■ 320.321
■ 410.200
■ unknown1102021
Treatment line sunitinib
■ 1512939848
■ 23264120
■ 350.93919
■ 410.1157
■ 5 42
■ Unknown 73
Heng prognostic risk group *
■ Good (0 risk factors)8014.5
■ Intermediate (1–2 risk factors)29854.2
■ Poor (3–6 risk factors)17231.3
MSKCC prognostic risk group **
■ Favourable (0 risk factors) 3819
■ Intermediate (1–2 risk factors) 12461
■ Poor (3–6 risk factors) 3216
■ Unknown 105
Prior drugs (excluding TKI or TKI-like antitumor treatment)
■ Yes38710250
■ No512939547
■ Unknown 73
Duration of prior drug treatment (months)1 to 231 to 123 months
Sunitinib starting dose (daily dose in mg)
■ 5048287.612561
■ 37.5468.47235
■ 25203.673
■ 12.520.400
Median treatment duration of sunitinib10 months (2 days–113 months)5 months (2 days–53 months)
Dose reduction
■ yes2234100
■ no3105620199
■ unknown17331
Dose reduction within 12 weeks (equal to 2 cycles) of treatment
■ yes1112000
■ no4167620199
■ unknown23431
Dose reduction within 24 weeks (equal to 4 cycles) of treatment
■ yes1452600
■ no3827020199
■ unknown23431
Values are presented as median unless otherwise indicated. Abbreviations: WHO = World Health Organization. * The Heng prognostic risk group was based on six risk scores: WHO performance status (≥1), low haemoglobin (<lower limit of normal (LLN); for males LLN = 8.1 mmol/L OR 13 g/dL, for females LLN = 7.1 mmol/L OR 11.5 g/dL), high calcium (>2.5 mmol/L) and time from initial diagnosis to treatment with sunitinib (<1 year), neutrophil count (>upper limit of normal (ULN)) and thrombocytes (>ULN). The Heng risk groups as presented in this table were obtained after imputation of missing values. ** The MSKCC prognostic risk group was based on five risk scores: Karnofsky performance status (<80%), low haemoglobin (<lower limit of normal (LLN); for males LLN = 8.1 mmol/L OR 13 g/dL, for females LLN = 7.1 mmol/L OR 11.5 g/dL), high calcium (>2.5 mmol/L), high LDH (>1.5 × ULN), and time from initial diagnosis to treatment with sunitinib (<1 year).
Table 2. GWAS significantly or suggestively associated SNPs with PFS from the meta-analysis.
SNPChromosomePositionGeneMAF (%)Allele *p-ValueHazard Ratio (HR)BetaSeSOEAssociation
rs285200134186442067PDLIM32.30G/T4.02 × 10−107.261.980.32EGWAS significant
rs22050962141683405DSCAM6.30T/A5.60 × 10−92.500.920.16E
rs1113567382141677845DSCAM5.30G/A4.77 × 10−82.510.920.17E
rs76403021358195886DNASE1L3 G/C1.22 × 10−74.231.440.27EGWAS suggestive
rs5958831098483774Position close to LOXL4, PYROXD2, HPS1, and HPSE22.00C/T1.24 × 10−71.630.490.09E
rs118150161771421614CALN12.00T/C1.45 × 10−73.831.340.26E
rs1131686472141679847DSCAM2.00C/T1.59 × 10−72.460.900.17E
rs72821792141670052DSCAM5.00T/C1.61 × 10−72.260.810.16E
rs79433348441381011LIMCH16.40A/C1.61 × 10−72.700.990.19E
rs79160607441395370LIMCH13.60A/G1.98 × 10−72.570.940.18E
* The first mentioned alleles are the reference alleles, the second mentioned alleles are the variant alleles. Abbreviations: DSCAM = Down Syndrome Cell Adhesion Molecule. MAF = Minor Allele Frequency. HR = Hazard Ratio. CI = Confidence Interval. SOE = source of evidence. E: Eurotarget, R: Riken, M: meta-analysis.
Table 3. GWAS significantly or suggestively associated SNPs with OS from the meta-analysis.
SNPChromosomePositionGeneMAF (%)Allele *p-ValueHazard Ratio (HR)BetaSeSOEAssociation
rs285200134186442067PDLIM32.30G1.62 × 10−85.961.790.32EGWAS significant
rs62256189355094589CACNA2D32.50G/T6.75 × 10−83.201.160.22EGWAS suggestive
rs2271583113685655ART114.70G/A2.90 × 10−71.720.540.11E
rs80071112157650640DAB12.90C/T3.78 × 10−73.091.130.22E
rs79160607441395370LIMCH14.00A/G3.95 × 10−72.490.910.18E
rs10959526911107610Position close to PTPRD4.20T/C4.36 × 10−72.520.930.18E
* The first mentioned alleles are the reference alleles, the second mentioned alleles are the variant alleles. Abbreviations: DSCAM = Down Syndrome Cell Adhesion Molecule. MAF = Minor Allele Frequency. OR = Odds Ratio. CI = Confidence Interval. SOE = source of evidence. E: Eurotarget, R: Riken, M: meta-analysis.
Publisher’s Note: MDPI stays neutral with regard to jurisdictional claims in published maps and institutional affiliations.

