
Machine Learning Algorithm for Distinguishing Ductal Carcinoma In Situ from Invasive Breast Cancer


Abstract
:Simple Summary
Abstract
1. Introduction
2. Materials and Methods
2.1. Study Design
2.2. Data Acquisition
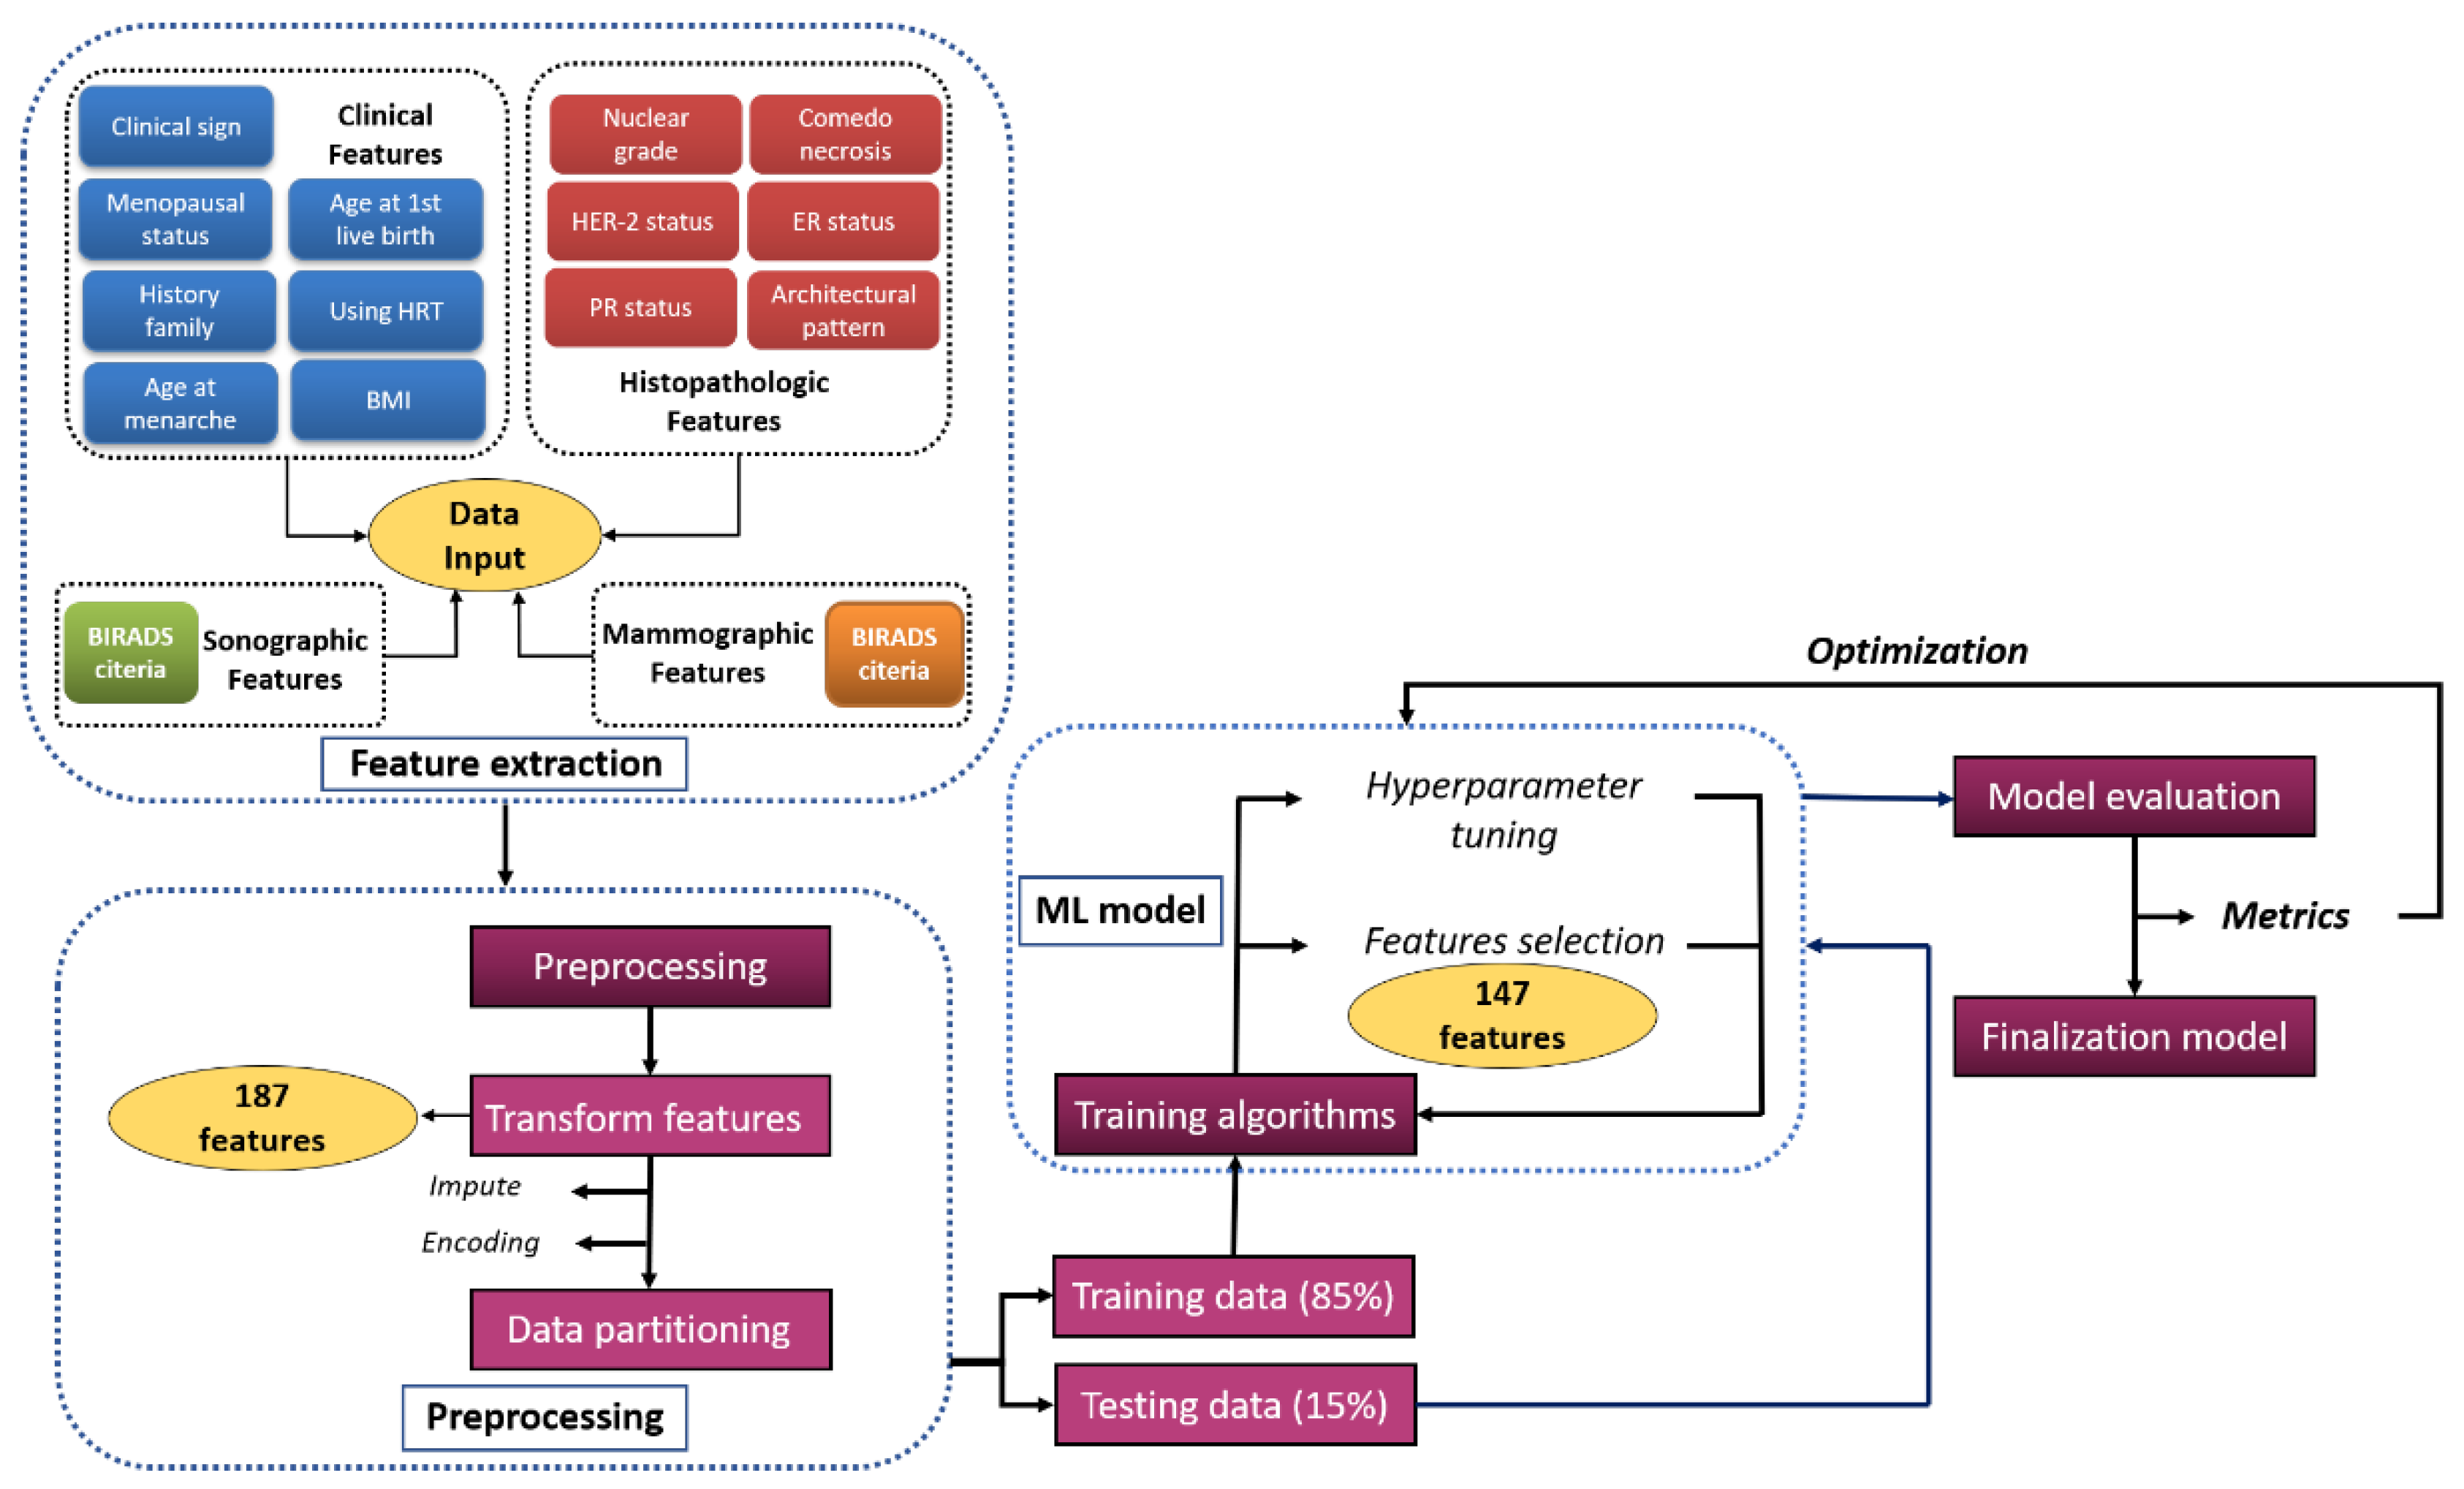
2.3. Model Development
2.4. Statistical Analysis
- Precision =
- Recall =
- Accuracy =
- F1 score =
- Specificity =
- Sensitivity =
3. Results
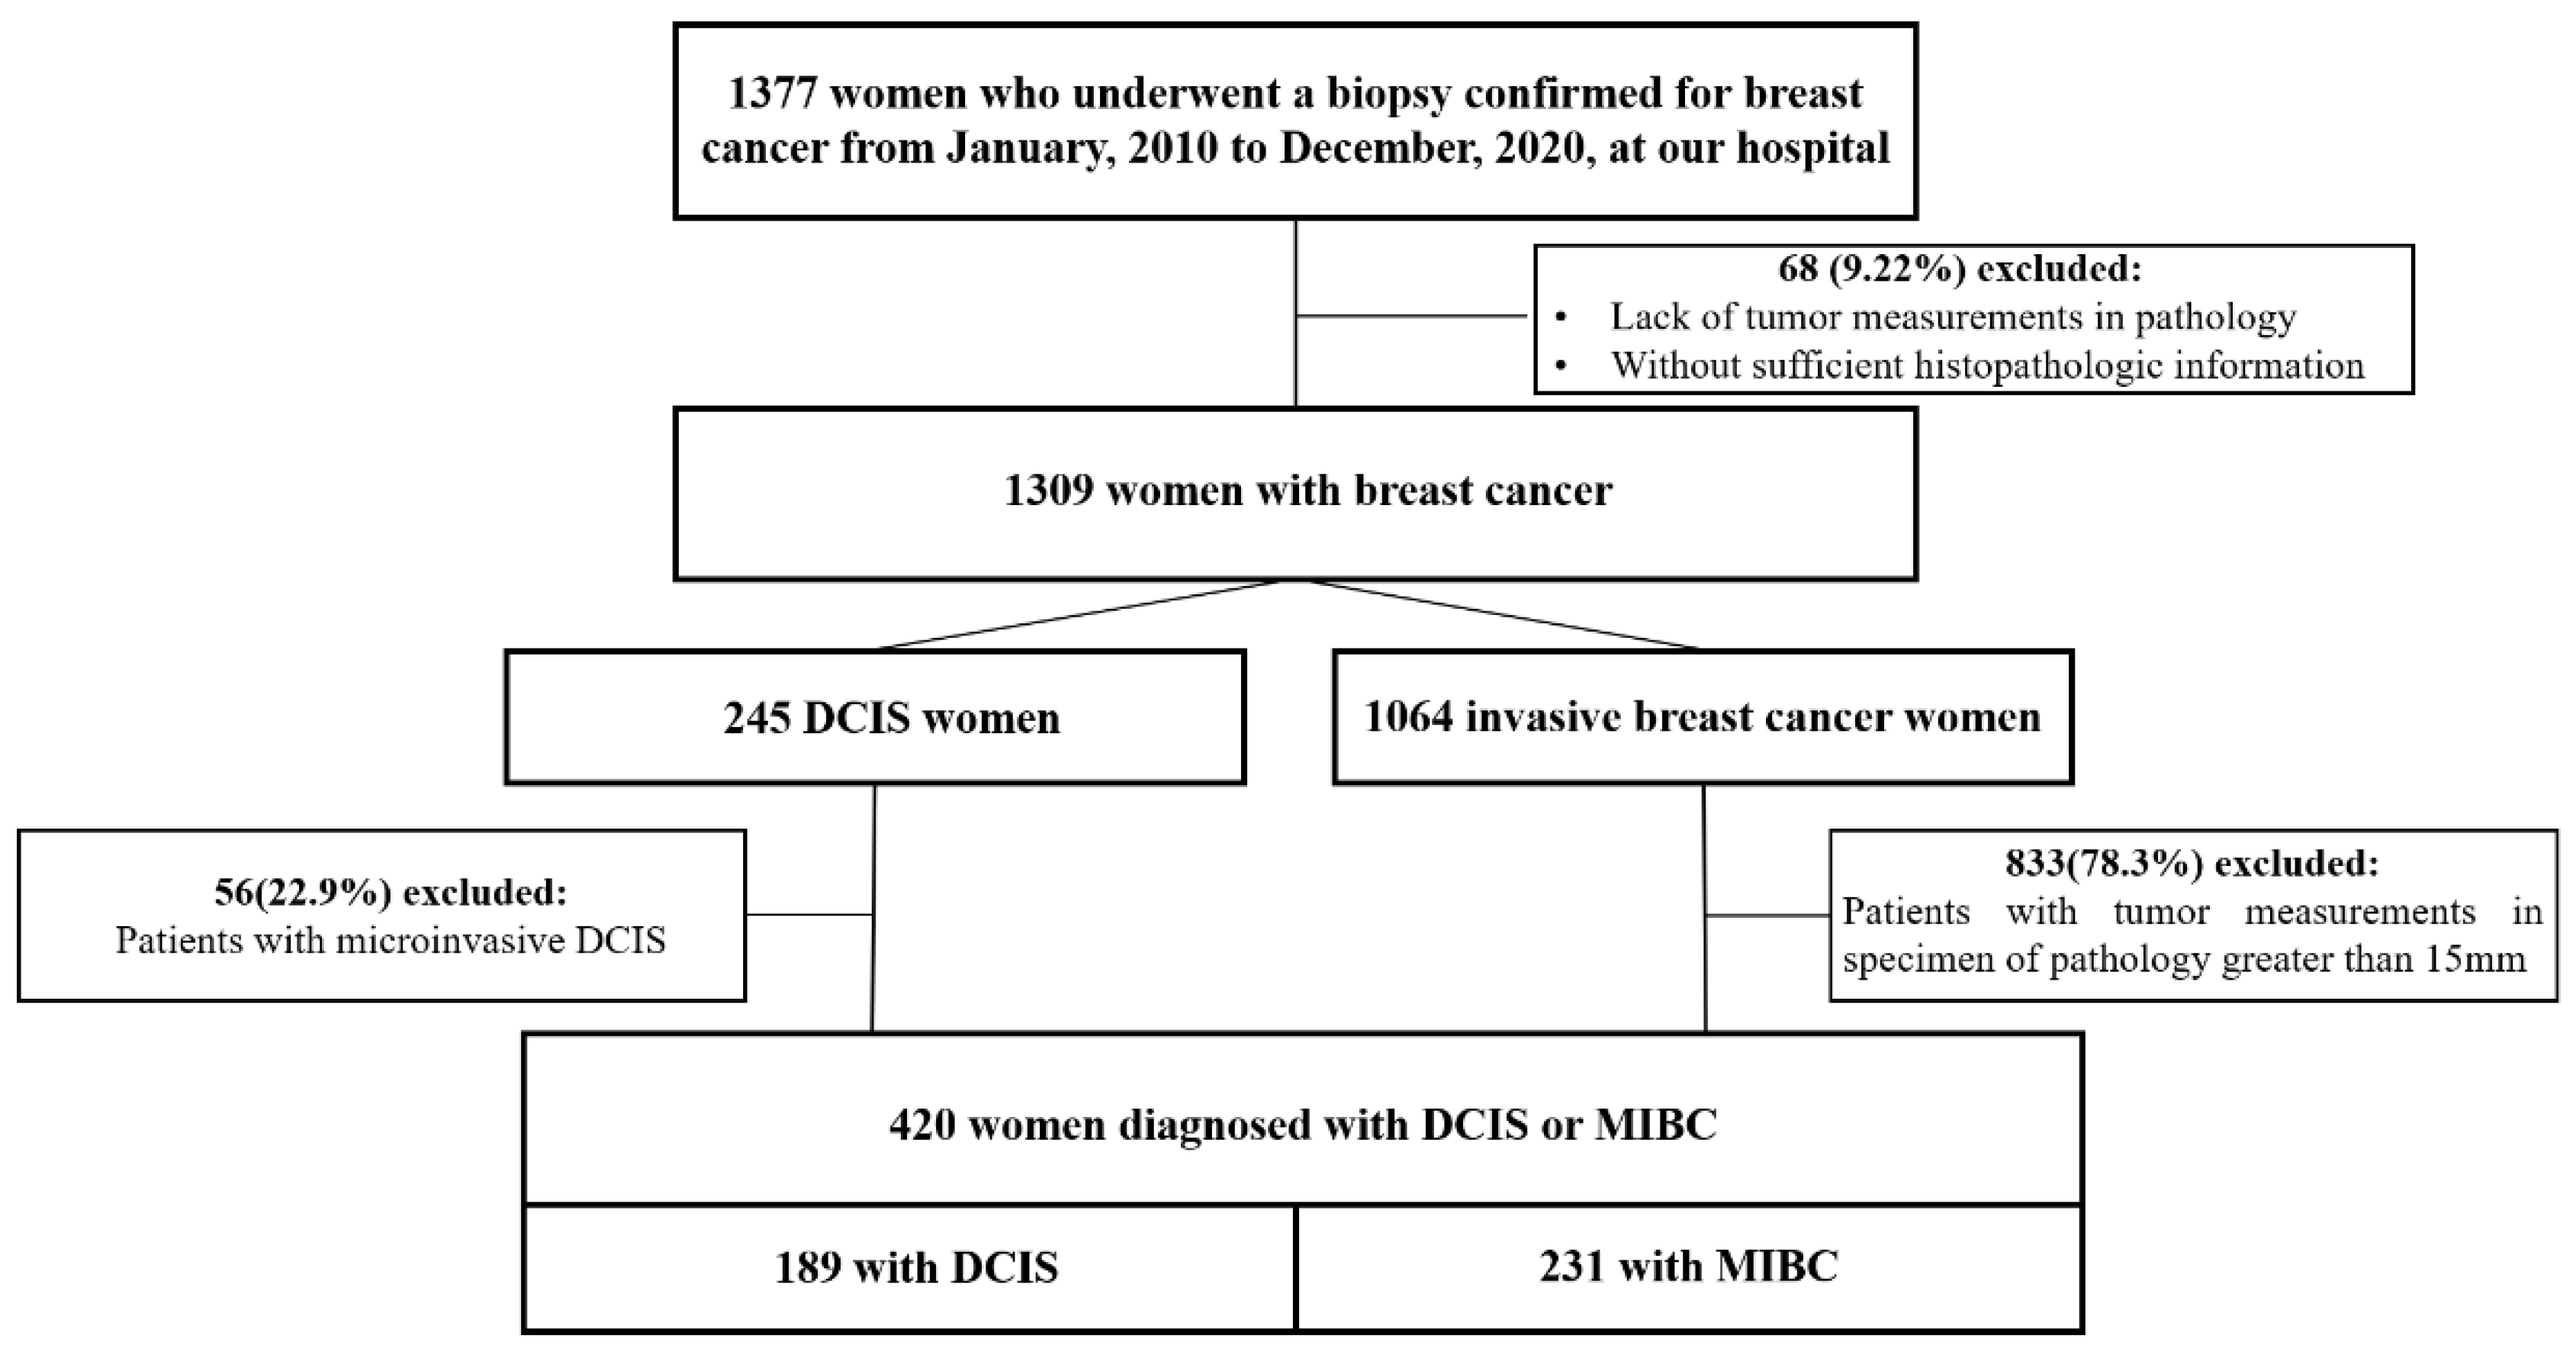
3.1. Study Population
3.2. Model Development
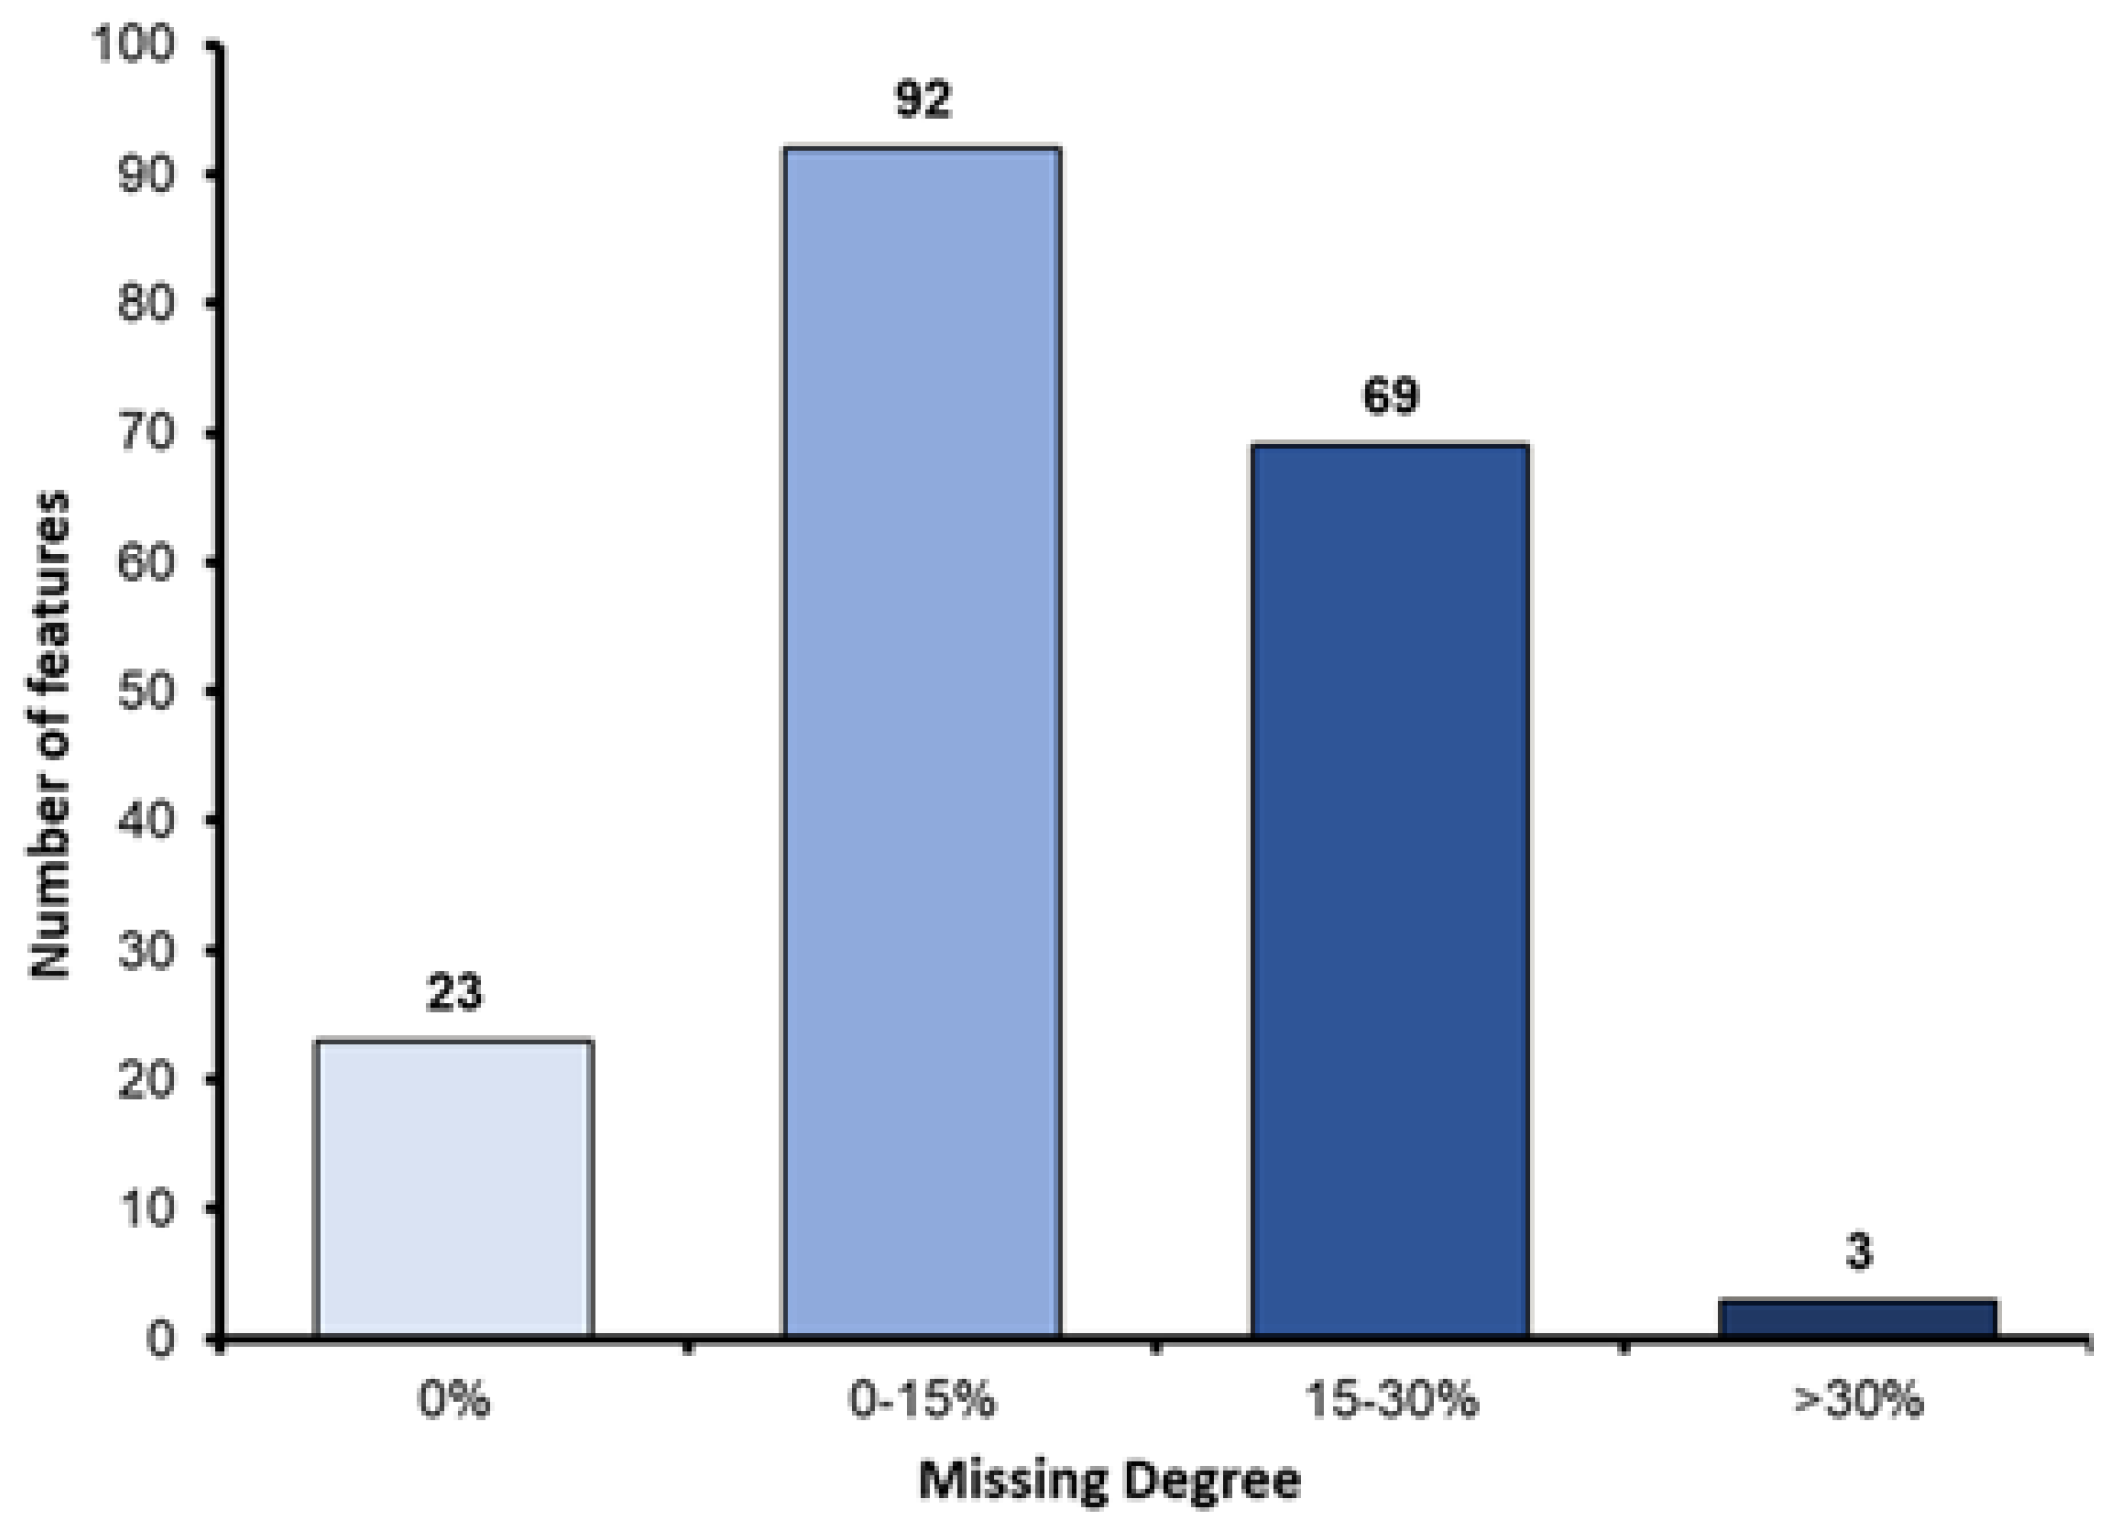
3.2.1. Missing Value Processing
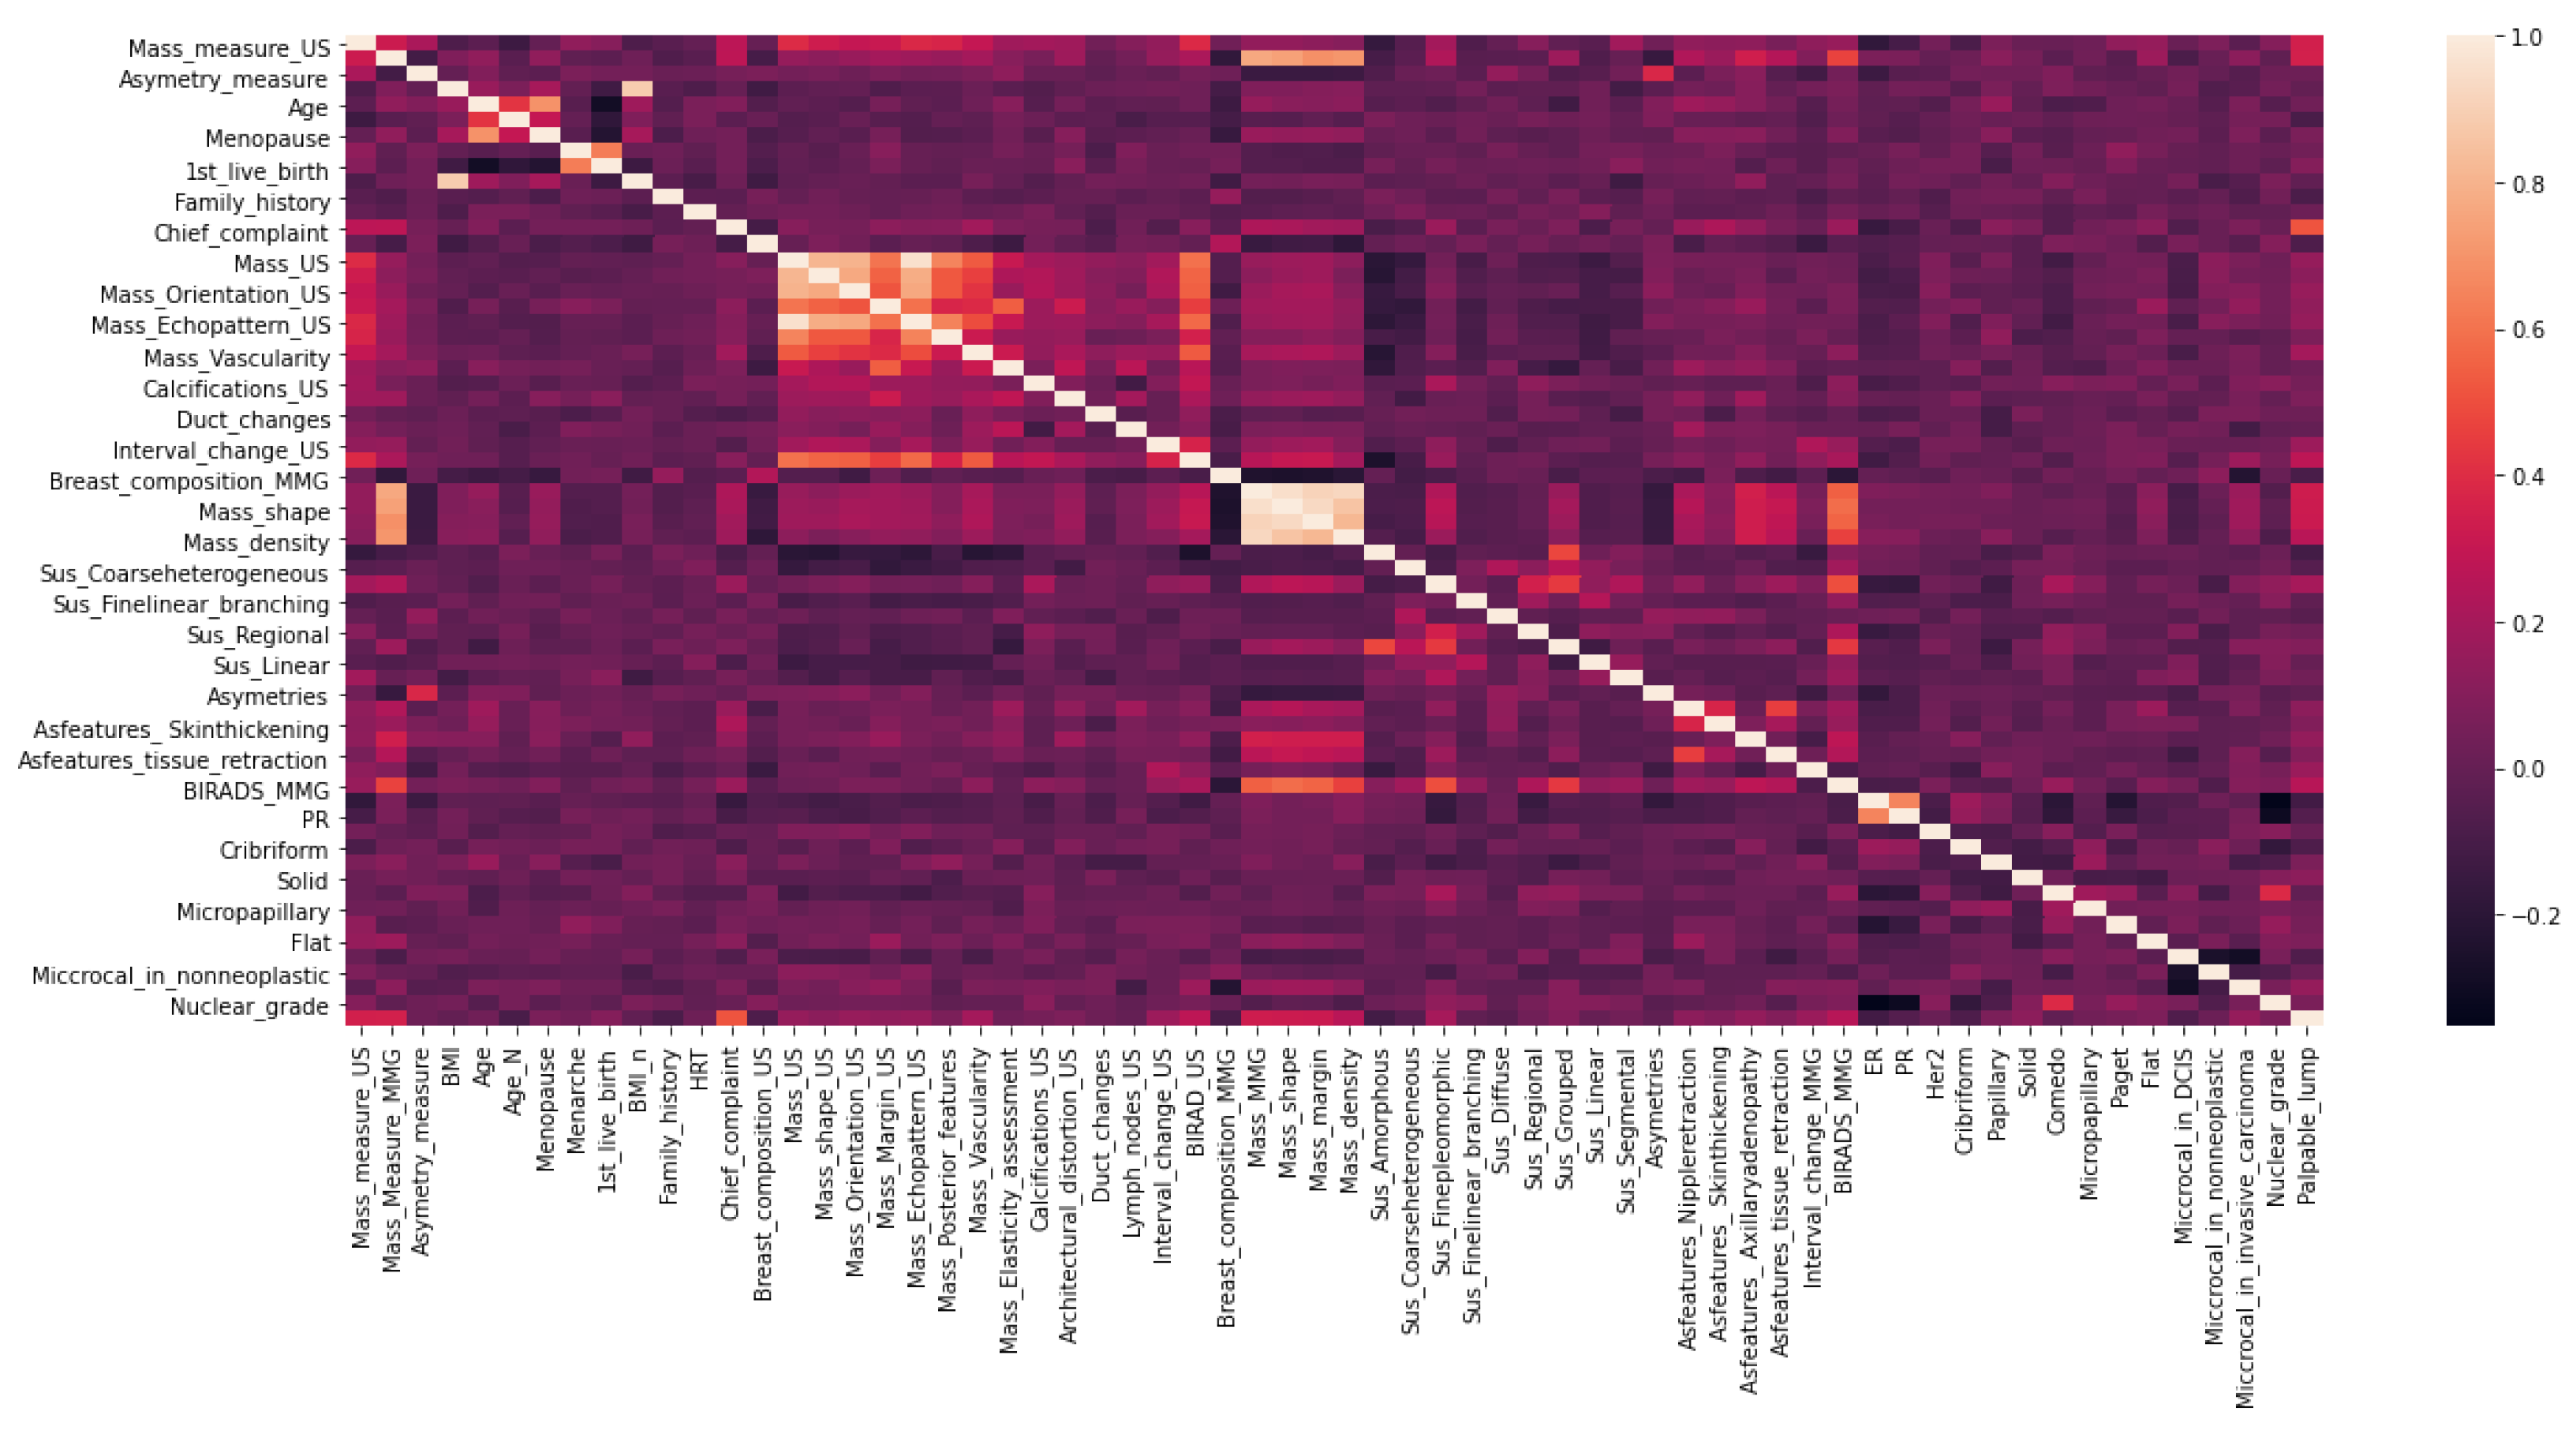
3.2.2. Correlation-Based Feature Selection
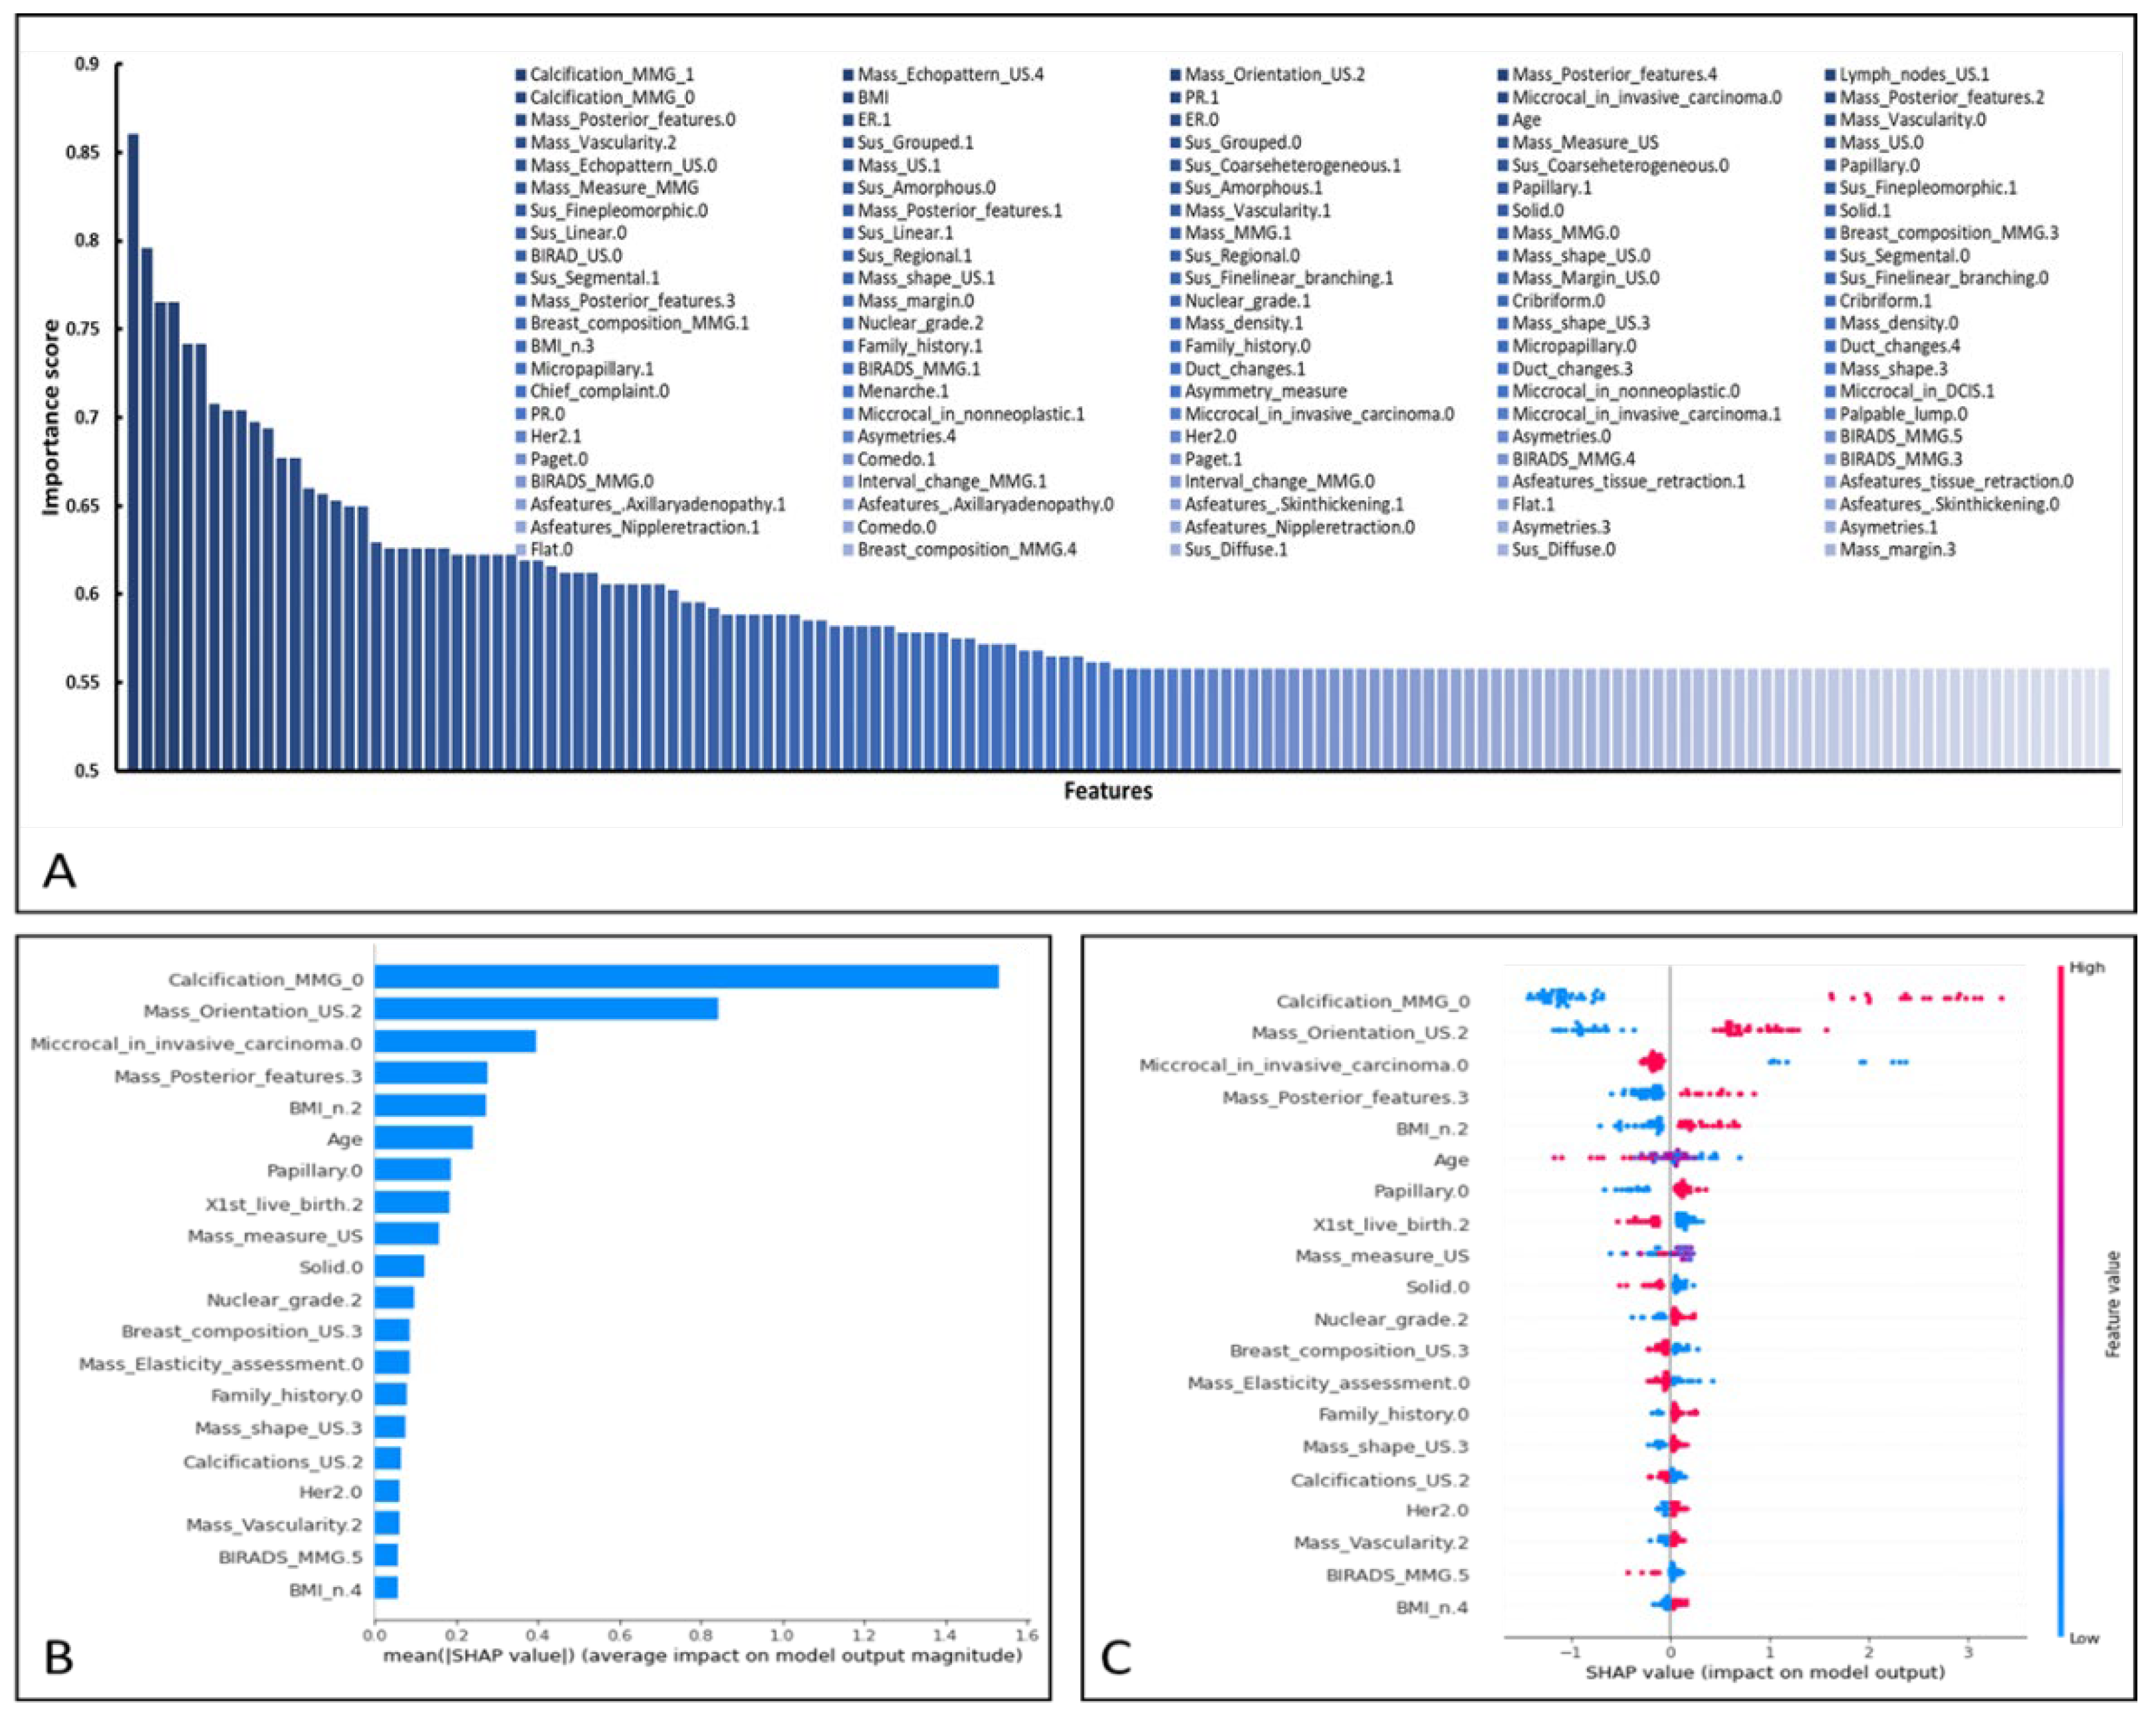
3.3. Performance of XGBoost and Feature Importance Analysis
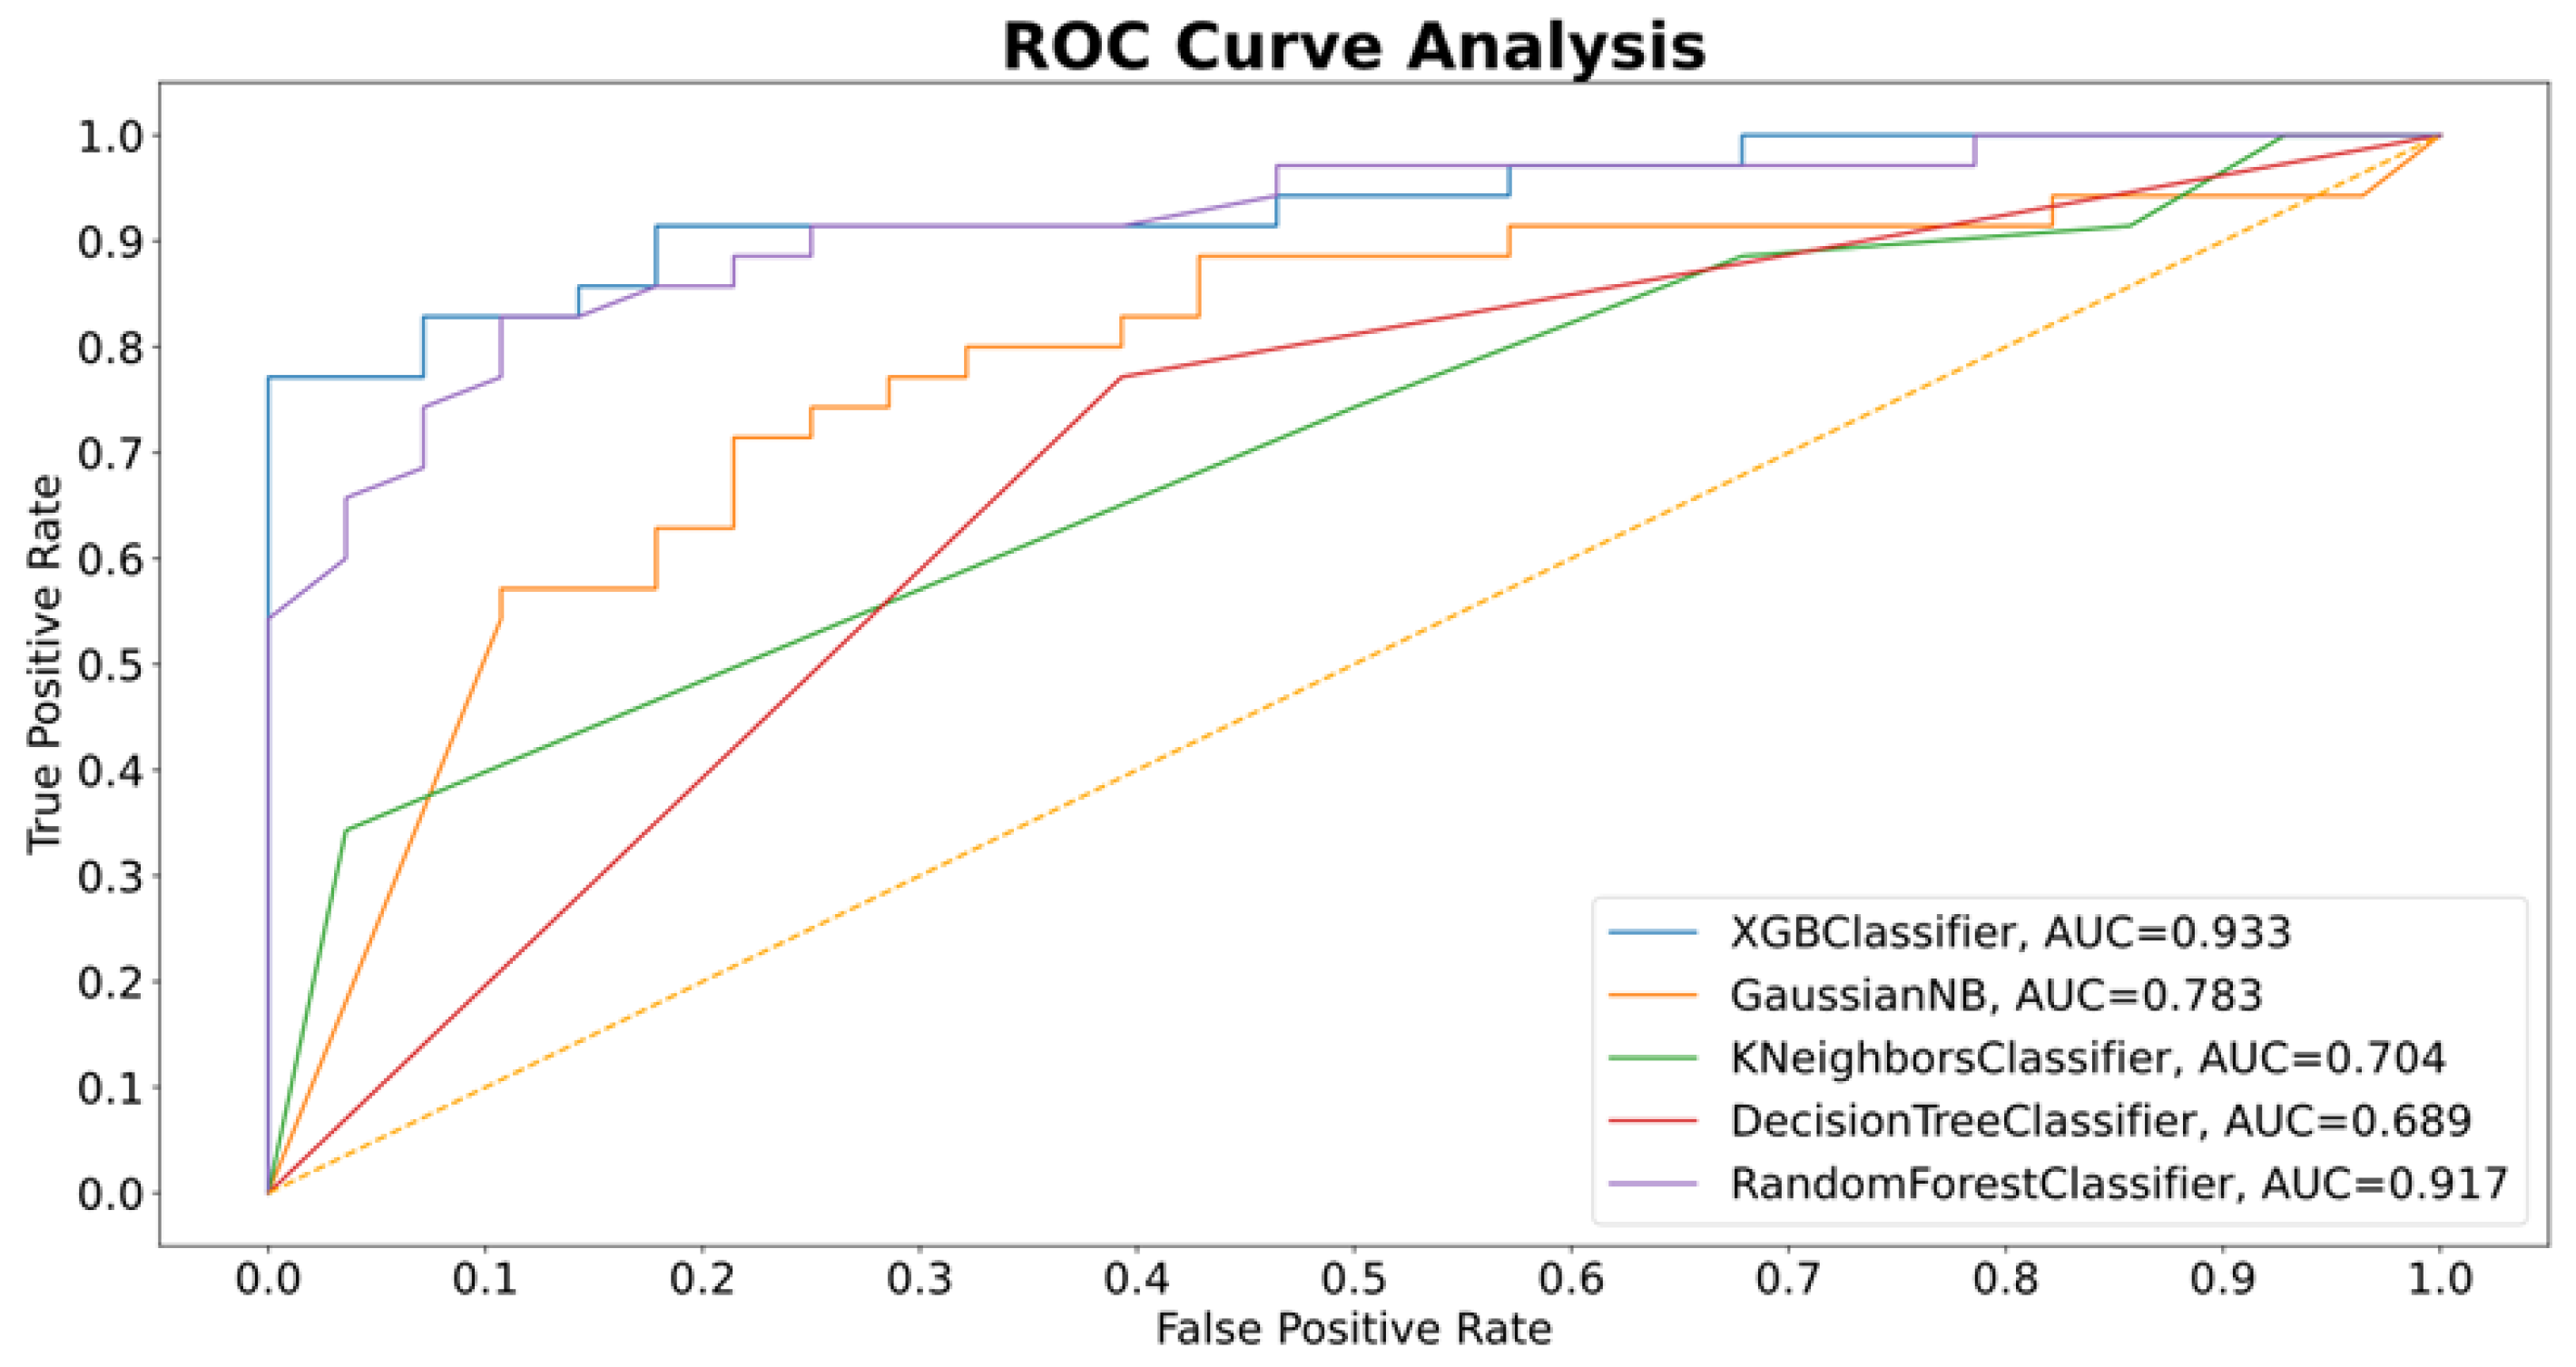
3.4. Performance as Compared with Other ML Methods
3.5. Performance as Compared with Radiologists
4. Discussion
5. Conclusions
Author Contributions
Funding
Institutional Review Board Statement
Informed Consent Statement
Data Availability Statement
Conflicts of Interest
Appendix A

| Features | Description |
|---|---|
| Age | age of patient |
| BMI | body mass index of patient |
| Mass_measure_US | size of mass on ultrasound |
| Mass_Measure_MMG | size of mass on mammography |
| Asymetry_measure | size of asymmetry on mammography |
| Age_N.1 | <40 |
| Age_N.2 | ≥40 |
| Menopause.0 | premenopause |
| Menopause.1 | menopause |
| Menarche.0 | not available |
| Menarche.1 | menarche: <12 |
| Menarche.2 | menarche: 12–14 |
| Menarche.3 | menarche: ≥15 |
| X1st_live_birth.0 | age at 1st live birth: <20 |
| X1st_live_birth.1 | age at 1st live birth: 20–24 |
| X1st_live_birth.2 | age at 1st live birth: 25–29 |
| X1st_live_birth.3 | age at 1st live birth: ≥30 |
| X1st_live_birth.4 | nulliparous |
| BMI_n.1 | BMI < 18.5 |
| BMI_n.2 | BMI 18.5–24 |
| BMI_n.3 | BMI 24–27 |
| BMI_n.4 | BMI ≥ 27 |
| Family_history.0 | have family history of breast cancer |
| Family_history.1 | do not have family history of breast cancer |
| HRT.0 | have history of use hormone replacement therapy |
| HRT.1 | do not have history of use hormone replacement therapy |
| Chief_complaint.0 | screening |
| Chief_complaint.1 | have symptom |
| Breast_composition_US.1 | breast composition category A on ultrasound |
| Breast_composition_US.2 | breast composition category B on ultrasound |
| Breast_composition_US.3 | breast composition category C on ultrasound |
| Mass_US.0 | have mass in ultrasound |
| Mass_US.1 | do not have mass in ultrasound |
| Mass_shape_US.0 | not available |
| Mass_shape_US.1 | oval-shape |
| Mass_shape_US.2 | round-shape |
| Mass_shape_US.3 | irregular-shape |
| Mass_Orientation_US.0 | not available |
| Mass_Orientation_US.1 | parallel |
| Mass_Orientation_US.2 | not parallel |
| Mass_Margin_US.0 | not available |
| Mass_Margin_US.1 | circumscribed |
| Mass_Margin_US.2 | indistinct |
| Mass_Margin_US.3 | angular |
| Mass_Margin_US.4 | microlobulated |
| Mass_Margin_US.5 | spiculated |
| Mass_Echopattern_US.0 | not available |
| Mass_Echopattern_US.1 | anechoic |
| Mass_Echopattern_US.2 | hyperechoic |
| Mass_Echopattern_US.3 | complex cystic and solid |
| Mass_Echopattern_US.4 | hyperechoic |
| Mass_Echopattern_US.5 | isoechoic |
| Mass_Echopattern_US.6 | heterogenous |
| Mass_Posterior_features.0 | not available |
| Mass_Posterior_features.1 | no posterior features |
| Mass_Posterior_features.2 | enhancement |
| Mass_Posterior_features.3 | shadowing |
| Mass_Posterior_features.4 | combined pattern |
| Mass_Vascularity.0 | not available |
| Mass_Vascularity.1 | absent |
| Mass_Vascularity.2 | internal vascularity |
| Mass_Vascularity.3 | vessels in rim |
| Mass_Elasticity_assessment.0 | not available |
| Mass_Elasticity_assessment.1 | soft |
| Mass_Elasticity_assessment.2 | intermediate |
| Mass_Elasticity_assessment.3 | hard |
| Calcifications_US.1 | calcifications in a mass |
| Calcifications_US.2 | calcifications outside of a mass |
| Calcifications_US.3 | intraductal calcifications |
| Calcifications_US.4 | no calcifications |
| Architectural_distortion_US.1 | have architectural distortion |
| Architectural_distortion_US.2 | do not have architectural distortion |
| Duct_changes.1 | not available |
| Duct_changes.2 | ectasia |
| Duct_changes.3 | dilation |
| Duct_changes.4 | calcification |
| Lymph_nodes_US.0 | do not have lymph nodes |
| Lymph_nodes_US.1 | have lymph nodes |
| Interval_change_US.0 | do not have interval change on ultrasound |
| Interval_change_US.1 | have interval change on ultrasound |
| Interval_change_US.2 | no previous ultrasound |
| BIRAD_US.0 | not available |
| BIRAD_US.1 | BIRADS ultrasound 0 |
| BIRAD_US.2 | BIRADS ultrasound 1 |
| BIRAD_US.3 | BIRADS ultrasound 2 |
| BIRAD_US.4 | BIRADS ultrasound 3 |
| BIRAD_US.5 | BIRADS ultrasound 4 |
| BIRAD_US.6 | BIRADS ultrasound 5 |
| Breast_composition_MMG.1 | breast composition category A on mammography |
| Breast_composition_MMG.2 | breast composition category B on mammography |
| Breast_composition_MMG.3 | breast composition category C on mammography |
| Breast_composition_MMG.4 | breast composition category D on mammography |
| Mass_MMG.0 | do not have mass in mammography |
| Mass_MMG.1 | have mass in mammography |
| Mass_shape.0 | not available |
| Mass_shape.1 | oval-shape on mammography |
| Mass_shape.2 | round-shape on mammography |
| Mass_shape.3 | irregular-shape on mammography |
| Mass_margin.0 | not available |
| Mass_margin.1 | circumscribed mass on mammography |
| Mass_margin.2 | obscured mass on mammography |
| Mass_margin.3 | microlobulated mass on mammography |
| Mass_margin.4 | indistinct mass on mammography |
| Mass_margin.5 | spiculated mass on mammography |
| Mass_density.0 | not available |
| Mass_density.1 | high density |
| Mass_density.2 | equal density |
| Mass_density.3 | low density |
| Mass_density.4 | fat-containing |
| Calcification_MMG_1 | have suspicious morphology calcification on mammography |
| Calcification_MMG_0 | do not have suspicious morphology calcification on mammography |
| Sus_Amorphous.1 | amorphous calcifications on mammography |
| Sus_Amorphous.0 | do not have amorphous calcifications on mammography |
| Sus_Coarseheterogeneous.1 | coarse heterogeneous calcifications on mammography |
| Sus_Coarseheterogeneous.0 | do not have coarse heterogenous calcifications on mammography |
| Sus_Finepleomorphic.1 | fine pleomorphic calcifications on mammography |
| Sus_Finepleomorphic.0 | do not have fine pleomorphic calcifications on mammography |
| Sus_Finelinear_branching.1 | fine linear or fine linear branching calcifications on mammography |
| Sus_Finelinear_branching.0 | do not have fine linear or fine linear branching calcifications on mammography |
| Sus_Diffuse.1 | distribution diffuse suspicious calcification on mammography |
| Sus_Diffuse.0 | do not have distribution diffuse suspicious calcification on mammography |
| Sus_Regional.1 | distribution regional suspicious calcification on mammography |
| Sus_Regional.0 | do not have distribution regional suspicious calcification on mammography |
| Sus_Grouped.1 | distribution grouped suspicious calcification on mammography |
| Sus_Grouped.0 | do not have distribution grouped suspicious calcification on mammography |
| Sus_Linear.1 | distribution linear suspicious calcification on mammography |
| Sus_Linear.0 | do not have distribution linear suspicious calcification on mammography |
| Sus_Segmental.1 | distribution segmental suspicious calcification on mammography |
| Sus_Segmental.0 | do not have distribution segmental suspicious calcification on mammography |
| Asymetries.0 | asymmetry |
| Asymetries.1 | global asymmetry |
| Asymetries.3 | focal asymmetry |
| Asymetries.4 | developing asymmetry |
| Asfeatures_Nippleretraction.0 | do not have associated features: nipple retraction |
| Asfeatures_Nippleretraction.1 | associated features: nipple retraction |
| Asfeatures_Skinthickening.0 | do not have associated features: skin thickening |
| Asfeatures_Skinthickening.1 | associated features: skin thickening |
| Asfeatures_Axillaryadenopathy.0 | do not have associated features: axillary adenopathy |
| Asfeatures_Axillaryadenopathy.1 | associated features: axillary adenopathy |
| Asfeatures_tissue_retraction.0 | do not have associated features: tissue retraction |
| Asfeatures_tissue_retraction.1 | associated features: tissue retraction |
| Interval_change_MMG.0 | do not have interval change on mammography |
| Interval_change_MMG.1 | have interval change on mammography |
| Interval_change_MMG.2 | no previous mammography |
| BIRADS_MMG.0 | not available |
| BIRADS_MMG.1 | BIRADS MMG 0 |
| BIRADS_MMG.2 | BIRADS MMG 1 |
| BIRADS_MMG.3 | BIRADS MMG 2 |
| BIRADS_MMG.4 | BIRADS MMG 3 |
| BIRADS_MMG.5 | BIRADS MMG 4A |
| BIRADS_MMG.6 | BIRADS MMG 4B |
| BIRADS_MMG.7 | BIRADS MMG 4C |
| BIRADS_MMG.8 | BIRADS MMG 5 |
| ER.0 | ER negative |
| ER.1 | ER positive |
| PR.0 | PR negative |
| PR.1 | PR positive |
| Her2.0 | HER2 negative |
| Her2.1 | HER2 positive |
| Cribriform.0 | do not have architectural pattern: cribriform |
| Cribriform.1 | have architectural patterns: cribriform |
| Papillary.0 | do not have architectural pattern: papillary |
| Papillary.1 | have architectural pattern: papillary |
| Solid.0 | do not have architectural pattern: solid |
| Solid.1 | have architectural pattern: solid |
| Comedo.0 | do not have architectural pattern: comedo |
| Comedo.1 | have architectural pattern: comedo |
| Micropapillary.0 | do not have architectural pattern: micropapillary |
| Micropapillary.1 | have architectural pattern: micropapillary |
| Paget.0 | do not have architectural pattern: paget |
| Paget.1 | have architectural pattern: paget |
| Flat.0 | do not have architectural pattern: flat (clinging) |
| Flat.1 | have architectural pattern: flat (clinging) |
| Miccrocal_in_DCIS.0 | do not have microcalcification on pathology pattern |
| Miccrocal_in_DCIS.1 | have microcalcification on pathology pattern |
| Miccrocal_in_nonneoplastic.0 | do not have microcalcification in non- neoplastic tissue |
| Miccrocal_in_nonneoplastic.1 | have microcalcification in non- neoplastic tissue |
| Miccrocal_in_invasive_carcinoma.0 | do not have microcalcification in invasive carcinoma |
| Miccrocal_in_invasive_carcinoma.1 | have microcalcification in invasive carcinoma |
| Necrosis.0 | necrosis not available |
| Necrosis.1 | necrosis in focal (small foci or single cell necrosis) |
| Necrosis.2 | necrosis in central (expansive comedo necrosis) |
| Nuclear_grade.1 | nuclear grade i |
| Nuclear_grade.2 | nuclear grade ii |
| Nuclear_grade.3 | nuclear grade iii |
| Palpable_lump.0 | do not have palpable lump |
| Palpable_lump.1 | have palpable lump |
Appendix B
| Parameters | Index |
|---|---|
| learning_rate | 0.03 |
| gamma | 0 |
| max_depth | 6 |
| colsample_bylevel | 0.06 |
| colsample_bytree | 0.61 |
| colsample_bynode | 1 |
| subsample | 0.7 |
| n_estimators | 200 |
| Feature | XGBoost_Importance _Score |
|---|---|
| Calcification_MMG_1 | 0.860544218 |
| Mass_Echopattern_US.4 | 0.795918367 |
| Mass_Orientation_US.2 | 0.765306122 |
| Mass_Posterior_features.4 | 0.765306122 |
| Lymph_nodes_US.1 | 0.741496599 |
| Calcification_MMG_0 | 0.741496599 |
| BMI | 0.707482993 |
| PR.1 | 0.704081633 |
| Miccrocal_in_invasive_carcinoma.0 | 0.704081633 |
| Mass_Posterior_features.2 | 0.697278912 |
| Mass_Posterior_features.0 | 0.693877551 |
| ER.1 | 0.676870748 |
| ER.0 | 0.676870748 |
| Age | 0.659863946 |
| Mass_Vascularity.0 | 0.656462585 |
| Mass_Vascularity.2 | 0.653061224 |
| Sus_Grouped.1 | 0.649659864 |
| Sus_Grouped.0 | 0.649659864 |
| Mass_Measure_US | 0.629251701 |
| Mass_US.0 | 0.62585034 |
| Mass_Echopattern_US.0 | 0.62585034 |
| Mass_US.1 | 0.62585034 |
| Sus_Coarseheterogeneous.1 | 0.62585034 |
| Sus_Coarseheterogeneous.0 | 0.62585034 |
| Papillary.0 | 0.62244898 |
| Mass_Measure_MMG | 0.62244898 |
| Sus_Amorphous.0 | 0.62244898 |
| Sus_Amorphous.1 | 0.62244898 |
| Papillary.1 | 0.62244898 |
| Sus_Finepleomorphic.1 | 0.619047619 |
| Sus_Finepleomorphic.0 | 0.619047619 |
| Mass_Posterior_features.1 | 0.615646259 |
| Mass_Vascularity.1 | 0.612244898 |
| Solid.0 | 0.612244898 |
| Solid.1 | 0.612244898 |
| Sus_Linear.0 | 0.605442177 |
| Sus_Linear.1 | 0.605442177 |
| Mass_MMG.1 | 0.605442177 |
| Mass_MMG.0 | 0.605442177 |
| Breast_composition_MMG.3 | 0.605442177 |
| BIRAD_US.0 | 0.602040816 |
| Sus_Regional.1 | 0.595238095 |
| Sus_Regional.0 | 0.595238095 |
| Mass_shape_US.0 | 0.591836735 |
| Sus_Segmental.0 | 0.588435374 |
| Sus_Segmental.1 | 0.588435374 |
| Mass_shape_US.1 | 0.588435374 |
| Sus_Finelinear_branching.1 | 0.588435374 |
| Mass_Margin_US.0 | 0.588435374 |
| Sus_Finelinear_branching.0 | 0.588435374 |
| Mass_Posterior_features.3 | 0.585034014 |
| Mass_margin.0 | 0.585034014 |
| Nuclear_grade.1 | 0.581632653 |
| Cribriform.0 | 0.581632653 |
| Cribriform.1 | 0.581632653 |
| Breast_composition_MMG.1 | 0.581632653 |
| Nuclear_grade.2 | 0.581632653 |
| Mass_density.1 | 0.578231293 |
| Mass_shape_US.3 | 0.578231293 |
| Mass_density.0 | 0.578231293 |
| BMI_n.3 | 0.578231293 |
| Family_history.1 | 0.574829932 |
| Family_history.0 | 0.574829932 |
| Micropapillary.0 | 0.571428571 |
| Duct_changes.4 | 0.571428571 |
| Micropapillary.1 | 0.571428571 |
| BIRADS_MMG.1 | 0.568027211 |
| Duct_changes.1 | 0.568027211 |
| Duct_changes.3 | 0.56462585 |
| Mass_shape.3 | 0.56462585 |
| Chief_complaint.0 | 0.56462585 |
| Menarche.1 | 0.56122449 |
| Asymmetry_measure | 0.56122449 |
| Miccrocal_in_nonneoplastic.0 | 0.557823129 |
| Miccrocal_in_DCIS.1 | 0.557823129 |
| PR.0 | 0.557823129 |
| Miccrocal_in_nonneoplastic.1 | 0.557823129 |
| Miccrocal_in_invasive_carcinoma.0 | 0.557823129 |
| Miccrocal_in_invasive_carcinoma.1 | 0.557823129 |
| Palpable_lump.0 | 0.557823129 |
| Her2.1 | 0.557823129 |
| Asymetries.4 | 0.557823129 |
| Her2.0 | 0.557823129 |
| Asymetries.0 | 0.557823129 |
| BIRADS_MMG.5 | 0.557823129 |
| Paget.0 | 0.557823129 |
| Comedo.1 | 0.557823129 |
| Paget.1 | 0.557823129 |
| BIRADS_MMG.4 | 0.557823129 |
| BIRADS_MMG.3 | 0.557823129 |
| BIRADS_MMG.0 | 0.557823129 |
| Interval_change_MMG.1 | 0.557823129 |
| Interval_change_MMG.0 | 0.557823129 |
| Asfeatures_tissue_retraction.1 | 0.557823129 |
| Asfeatures_tissue_retraction.0 | 0.557823129 |
| Asfeatures_.Axillaryadenopathy.1 | 0.557823129 |
| Asfeatures_.Axillaryadenopathy.0 | 0.557823129 |
| Asfeatures_.Skinthickening.1 | 0.557823129 |
| Flat.1 | 0.557823129 |
| Asfeatures_.Skinthickening.0 | 0.557823129 |
| Asfeatures_Nippleretraction.1 | 0.557823129 |
| Comedo.0 | 0.557823129 |
| Asfeatures_Nippleretraction.0 | 0.557823129 |
| Asymetries.3 | 0.557823129 |
| Asymetries.1 | 0.557823129 |
| Flat.0 | 0.557823129 |
| Breast_composition_MMG.4 | 0.557823129 |
| Sus_Diffuse.1 | 0.557823129 |
| Sus_Diffuse.0 | 0.557823129 |
| Mass_margin.3 | 0.557823129 |
| Mass_margin.1 | 0.557823129 |
| Lymph_nodes_US.1 | 0.557823129 |
| Mass_Orientation_US.1 | 0.557823129 |
| Mass_shape.1 | 0.557823129 |
| Breast_composition_US.3 | 0.557823129 |
| Breast_composition_US.2 | 0.557823129 |
| Breast_composition_US.1 | 0.557823129 |
| Chief_complaint.1 | 0.557823129 |
| Chief_complaint.0 | 0.557823129 |
| HRT.1 | 0.557823129 |
| HRT.0 | 0.557823129 |
| BMI_n.4 | 0.557823129 |
| BMI_n.1 | 0.557823129 |
| BMI_n.2 | 0.557823129 |
| X1st_live_birth.4 | 0.557823129 |
| X1st_live_birth.3 | 0.557823129 |
| X1st_live_birth.1 | 0.557823129 |
| X1st_live_birth.0 | 0.557823129 |
| Menarche.3 | 0.557823129 |
| Menarche.0 | 0.557823129 |
| Menopause.1 | 0.557823129 |
| Menopause.0 | 0.557823129 |
| Age_N.2 | 0.557823129 |
| Age_N.1 | 0.557823129 |
| Mass_margin.4 | 0.557823129 |
| Mass_margin.5 | 0.557823129 |
| Mass_Echopattern_US.1 | 0.557823129 |
| Interval_change_US.0 | 0.557823129 |
| Mass_margin.1 | 0.557823129 |
| Mass_margin.3 | 0.557823129 |
| Mass_margin.2 | 0.557823129 |
| Mass_density.4 | 0.557823129 |
| Mass_shape.1 | 0.557823129 |
| Breast_composition_MMG.1 | 0.557823129 |
| BIRAD_US.5 | 0.557823129 |
| BIRAD_US.4 | 0.557823129 |
| BIRAD_US.3 | 0.557823129 |
| Feature | SHAP_Importance_Score |
|---|---|
| Calcification_MMG_1 | 1.530532241 |
| Mass_Orientation_US.2 | 0.843982518 |
| Miccrocal_in_invasive_carcinoma.0 | 0.394437432 |
| Mass_Posterior_features.3 | 0.278461546 |
| BMI_n.2 | 0.272588193 |
| Age | 0.240817562 |
| Papillary.0 | 0.188818902 |
| X1st_live_birth.2 | 0.182896554 |
| Mass_measure_US | 0.159969047 |
| Solid.0 | 0.120786794 |
| Nuclear_grade.2 | 0.097087704 |
| Breast_composition_US.3 | 0.088376589 |
| Mass_Elasticity_assessment.0 | 0.085524194 |
| Family_history.0 | 0.080155298 |
| Mass_shape_US.3 | 0.07565444 |
| Calcifications_US.2 | 0.066437013 |
| Her2.0 | 0.062137935 |
| Mass_Vascularity.2 | 0.062031701 |
| BIRADS_MMG.5 | 0.058612607 |
| BMI_n.4 | 0.058029428 |
References
- Sung, H.; Ferlay, J.; Siegel, R.L.; Laversanne, M.; Soerjomataram, I.; Jemal, A.; Bray, F. Global cancer statistics 2020: GLOBOCAN estimates of incidence and mortality worldwide for 36 cancers in 185 countries. CA Cancer J. Clin. 2021, 71, 209–249. [Google Scholar] [CrossRef] [PubMed]
- Kerlikowske, K. Epidemiology of ductal carcinoma in situ. J. Natl. Cancer Inst. Monogr. 2010, 2010, 139–141. [Google Scholar] [CrossRef] [PubMed] [Green Version]
- Lee, R.J.; Vallow, L.A.; McLaughlin, S.A.; Tzou, K.S.; Hines, S.L.; Peterson, J.L. Ductal carcinoma in situ of the breast. Int. J. Surg. Oncol. 2012, 2012, 123549. [Google Scholar] [CrossRef] [PubMed]
- Alkabban, F.; Ferguson, T. Breast Cancer; StatPearls: Treasure Island, FL, USA, 2021. [Google Scholar]
- Sharma, G.N.; Dave, R.; Sanadya, J.; Sharma, P.; Sharma, K. Various types and management of breast cancer: An overview. J. Adv. Pharm. Technol. Res. 2010, 1, 109. [Google Scholar] [PubMed]
- Tabár, L.; Chen, H.-H.; Duffy, S.W.; Yen, M.; Chiang, C.; Dean, P.B.; Smith, R.A. A novel method for prediction of long-term outcome of women with T1a, T1b, and 10–14 mm invasive breast cancers: A prospective study. Lancet 2000, 355, 429–433. [Google Scholar] [CrossRef]
- Tabar, L.; Tony Chen, H.H.; Amy Yen, M.; Tot, T.; Tung, T.H.; Chen, L.S.; Chiu, Y.H.; Duffy, S.W.; Smith, R.A. Mammographic tumor features can predict long-term outcomes reliably in women with 1–14-mm invasive breast carcinoma: Suggestions for the reconsideration of current therapeutic practice and the TNM classification system. Cancer Interdiscip. Int. J. Am. Cancer Soc. 2004, 101, 1745–1759. [Google Scholar] [CrossRef]
- Silverstein, M.J.; Lagios, M.D.; Craig, P.H.; Waisman, J.R.; Lewinsky, B.S.; Colburn, W.J.; Poller, D.N. A prognostic index for ductal carcinoma in situ of the breast. Cancer Interdiscip. Int. J. Am. Cancer Soc. 1996, 77, 2267–2274. [Google Scholar] [CrossRef]
- Tabár, L.; Duffy, S.W.; Vitak, B.; Chen, H.H.; Prevost, T.C. The natural history of breast carcinoma: What have we learned from screening? Cancer 1999, 86, 449–462. [Google Scholar] [CrossRef]
- Joensuu, H.; Pylkkänen, L.; Toikkanen, S. Late mortality from pT1N0M0 breast carcinoma. Cancer 1999, 85, 2183–2189. [Google Scholar] [CrossRef]
- Koscielny, M.T. Serge The rationale for early diagnosis of cancer: The example of breast cancer. Procedia Comput. Sci. 1999, 38, 295–303. [Google Scholar]
- Vaka, A.R.; Soni, B.; Reddy, S. Breast cancer detection by leveraging Machine Learning. ICT Express 2020, 6, 320–324. [Google Scholar] [CrossRef]
- Naji, M.A.; El Filali, S.; Aarika, K.; Benlahmar, E.H.; Abdelouhahid, R.A.; Debauche, O. Machine Learning Algorithms For Breast Cancer Prediction And Diagnosis. Procedia Comput. Sci. 2021, 191, 487–492. [Google Scholar] [CrossRef]
- D’Orsi, C.J.; Sickles, E.A.; Mendelson, E.B.; Morris, E.A.; Bassett, L.W.; Böhm-Vélez, M.; Comstock, C.E.; CH, L. ACR BI-RADS® Atlas, Breast Imaging Reporting and Data System; American College of Radiology: New York, NY, USA, 2014. [Google Scholar]
- Brinton, L.A.; Hoover, R.; Fraumeni, J.F. Epidemiology of minimal breast cancer. JAMA 1983, 249, 483–487. [Google Scholar] [CrossRef] [PubMed]
- Chen, T.; Guestrin, C. XGBoost: A Scalable Tree Boosting System. In Proceedings of the The 22nd ACM SIGKDD International Conference, San Francisco, CA, USA, 13–17 August 2016; pp. 785–794. [Google Scholar]
- Lundberg, S.M.; Lee, S.-I. A unified approach to interpreting model predictions. In Proceedings of the Advances in Neural Information Processing Systems 30 (NIPS 2017), Long Beach, CA, USA, 4–9 December 2017. [Google Scholar]
- Kim, S.H.; Seo, B.K.; Lee, J.; Kim, S.J.; Cho, K.R.; Lee, K.Y.; Je, B.-K.; Kim, H.Y.; Kim, Y.-S.; Lee, J.-H. Correlation of ultrasound findings with histology, tumor grade, and biological markers in breast cancer. Acta Oncol. 2008, 47, 1531–1538. [Google Scholar] [CrossRef] [Green Version]
- Chen, S.; Cheung, Y.; Lo, Y.; Chen, M.; Hwang, T.; Su, C.; Hsueh, S. Sonographic differentiation of invasive and intraductal carcinomas of the breast. Br. J. Radiol. 2003, 76, 600–604. [Google Scholar] [CrossRef]
- Rana, M.; Chandorkar, P.; Dsouza, A.; Kazi, N. Breast cancer diagnosis and recurrence prediction using machine learning techniques. Int. J. Res. Eng. 2015, 04, 372–376. [Google Scholar]
- Maysanjaya, I.; Pradnyana, I.; Putrama, I. Classification of breast cancer using Wrapper and Naïve Bayes algorithms. J. Phys. Conf. Ser. 2018, 1040, 012017. [Google Scholar] [CrossRef]
- Mercan, E.; Mehta, S.; Bartlett, J.; Shapiro, L.G.; Weaver, D.L.; Elmore, J.G. Assessment of Machine Learning of Breast Pathology Structures for Automated Differentiation of Breast Cancer and High-Risk Proliferative Lesions. JAMA Netw. Open 2019, 2, e198777. [Google Scholar] [CrossRef] [Green Version]
- Roy, S.; Kumar, R.; Mittal, V.; Gupta, D. Classification models for Invasive Ductal Carcinoma Progression, based on gene expression data-trained supervised machine learning. Sci. Rep. 2020, 10, 4113. [Google Scholar] [CrossRef]
- Senturk, N.; Tuncel, G.; Dogan, B.; Aliyeva, L.; Dundar, M.S.; Ozemri Sag, S.; Mocan, G.; Temel, S.G.; Dundar, M.; Ergoren, M.C. BRCA Variations Risk Assessment in Breast Cancers Using Different Artificial Intelligence Models. Genes 2021, 12, 1774. [Google Scholar] [CrossRef]
- Rebolj, M.; Assi, V.; Brentnall, A.; Parmar, D.; Duffy, S.W. Addition of ultrasound to mammography in the case of dense breast tissue: Systematic review and meta-analysis. Br. J. Cancer 2018, 118, 1559–1570. [Google Scholar] [CrossRef] [PubMed]
- Berg, W.A.; Blume, J.D.; Cormack, J.B.; Mendelson, E.B.; Lehrer, D.; Böhm-Vélez, M.; Pisano, E.D.; Jong, R.A.; Evans, W.P.; Morton, M.J. Combined screening with ultrasound and mammography vs mammography alone in women at elevated risk of breast cancer. JAMA 2008, 299, 2151–2163. [Google Scholar] [CrossRef] [PubMed]


| Characteristic | Study Group (n = 420) | DCIS Group (n = 189) | MIBC Group (n = 231) | p Value b |
|---|---|---|---|---|
| Age a, y | 57.1 (12.0) | 57.1 (12.0) | 57.3 (12.0) | 0.694 |
| Age group | 0.086 | |||
| <40 y | 22 (5.2) | 6 (3.2) | 16 (6.8) | … |
| ≥40 y | 398 (94.8) | 183 (96.8) | 215 (93.2) | … |
| Menopause | 0.643 | |||
| Premenopause | 145 (34.5) | 63 (33.3) | 82 (35.3) | … |
| Postmenopause | 275 (65.5) | 126 (66.7) | 149 (64.5) | … |
| Age at menarche | 0.837 | |||
| NA | 93 (22.1) | 44 (23.2) | 49 (21.2) | … |
| <12 y | 27 (6.4) | 13 (6.9) | 14 (6.1) | … |
| 12–14 y | 222 (52.9) | 99 (52.4) | 123 (53.2) | … |
| ≥15 y | 78 (18.6) | 33 (17.5) | 45 (19.5) | … |
| Age at first live birth | 0.002 | |||
| <20 y | 12 (3.6) | 1 (0.7) | 11 (6.0) | … |
| 20–29 y | 166 (49.7) | 91 (60.3) | 75 (41.0) | … |
| ≥30 y | 82 (24.6) | 34 (22.5) | 48 (26.2) | … |
| Nulliparous | 74 (22.1) | 25 (16.5) | 49 (26.8) | … |
| Family history of BC | 0.002 | |||
| Yes | 83 (19.8) | 50 (26.5) | 33 (14.3) | … |
| No | 333 (80.2) | 139 (73.5) | 198 (85.7) | … |
| History of HRT use | 0.464 | |||
| Yes | 31 (7.4) | 12 (6.3) | 19 (8.2) | … |
| No | 389 (92.6) | 177 (93.7) | 212 (91.8) | … |
| BMI a (kg/m²) | 24.02 (4.40) | 24.02 (4.39) | 24.00 (4.41) | 0.542 |
| BMI group | 0.002 | |||
| BMI < 18.5 kg/m² | 14 (3.33) | 4 (2.12) | 10 (4.32) | … |
| 18.5 ≤ BMI < 24 kg/m² | 227 (54.05) | 98 (51.85) | 129 (55.84) | … |
| 24 ≤ BMI < 27 kg/m² | 82 (19.52) | 44 (23.28) | 38 (16.45) | … |
| BMI ≥ 27 kg/m² | 97 (23.10) | 43 (22.75) | 54 (23.39) | … |
| Characteristic | Training Set | Testing Set | p Value |
|---|---|---|---|
| No. of patients | 357 | 63 | |
| DCIS | 161 (45.1) | 35 (55.5) | |
| MIBC | 196 (54.9) | 28 (45.4) | |
| Age a, y | 57.1 (11.6) | 58.5 (12.8) | >0.05 |
| BMI a, kg/m2 | 24.1 (4.7) | 24.1 (4.9) | >0.05 |
| Premenopause | 124 (34.7) | 21 (33.3) | >0.05 |
| Postmenopause | 233 (65.3) | 42 (66.7) | >0.05 |
| Family history of BC | 61 (18.7) | 16 (25.4) | >0.05 |
| Model | Accuracy | F1 Score | Recall | Precision |
|---|---|---|---|---|
| XGBoost | 0.84 [0.76–0.91] | 0.87 [0.79–0.93] | 0.91 [0.76–0.94] | 0.82 [0.71–0.92] |
| GaussianNB | 0.75 [0.67–0.84] | 0.79 [0.67–0.86] | 0.88 [0.68–0.93] | 0.72 [0.65–0.92] |
| KNeighbors Classifier | 0.63 [0.54–0.69] | 0.73 [0.56–0.80] | 0.87 [0.57–0.92] | 0.62 [0.55–0.90] |
| DecisionTree Classifier | 0.73 [0.64–0.82] | 0.76 [0.64–0.84] | 0.77 [0.64–0.86] | 0.75 [0.64–0.86] |
| RandomForest Classifier | 0.82 [0.74–0.89] | 0.84 [0.76–0.91] | 0.89 [0.73–0.93] | 0.81 [0.78–0.91] |
| Sensitivity | pse | Specificity | psp | |
|---|---|---|---|---|
| Radiologist 1 | ||||
| Using MMG alone | 0.65 (0.61–0.71) | 0.59 (0.57–0.62) | ||
| Using US alone | 0.67 (0.62–0.72) | 0.59 (0.55–0.63) | ||
| Using both US and MMG | 0.74 (0.68–0.79) | <0.05 | 0.64 (0.57–0.66) | <0.05 |
| Radiologist 2 | ||||
| Using MMG alone | 0.81 (0.74–0.86) | 0.68 (0.65–0.72) | ||
| Using US alone | 0.77 (0.73–0.82) | 0.64(0.61–0.74) | ||
| Using both US and MMG | 0.83 (0.74–0.88) | >0.05 | 0.71 (0.68–0.74) | >0.05 |
| XGBoost Model | 0.91 (0.76–0.94) | 0.75 (0.68–0.78) |
Publisher’s Note: MDPI stays neutral with regard to jurisdictional claims in published maps and institutional affiliations. |
© 2022 by the authors. Licensee MDPI, Basel, Switzerland. This article is an open access article distributed under the terms and conditions of the Creative Commons Attribution (CC BY) license (https://creativecommons.org/licenses/by/4.0/).
Share and Cite
Vy, V.P.T.; Yao, M.M.-S.; Khanh Le, N.Q.; Chan, W.P. Machine Learning Algorithm for Distinguishing Ductal Carcinoma In Situ from Invasive Breast Cancer. Cancers 2022, 14, 2437. https://doi.org/10.3390/cancers14102437
Vy VPT, Yao MM-S, Khanh Le NQ, Chan WP. Machine Learning Algorithm for Distinguishing Ductal Carcinoma In Situ from Invasive Breast Cancer. Cancers. 2022; 14(10):2437. https://doi.org/10.3390/cancers14102437
Chicago/Turabian StyleVy, Vu Pham Thao, Melissa Min-Szu Yao, Nguyen Quoc Khanh Le, and Wing P. Chan. 2022. "Machine Learning Algorithm for Distinguishing Ductal Carcinoma In Situ from Invasive Breast Cancer" Cancers 14, no. 10: 2437. https://doi.org/10.3390/cancers14102437
APA StyleVy, V. P. T., Yao, M. M.-S., Khanh Le, N. Q., & Chan, W. P. (2022). Machine Learning Algorithm for Distinguishing Ductal Carcinoma In Situ from Invasive Breast Cancer. Cancers, 14(10), 2437. https://doi.org/10.3390/cancers14102437