
MET Expression Level in Lung Adenocarcinoma Loosely Correlates with MET Copy Number Gain/Amplification and Is a Poor Predictor of Patient Outcome


 ,
,  , and
, and
Abstract
:Simple Summary
Abstract
1. Introduction
2. Materials and Methods
2.1. Study Cohort
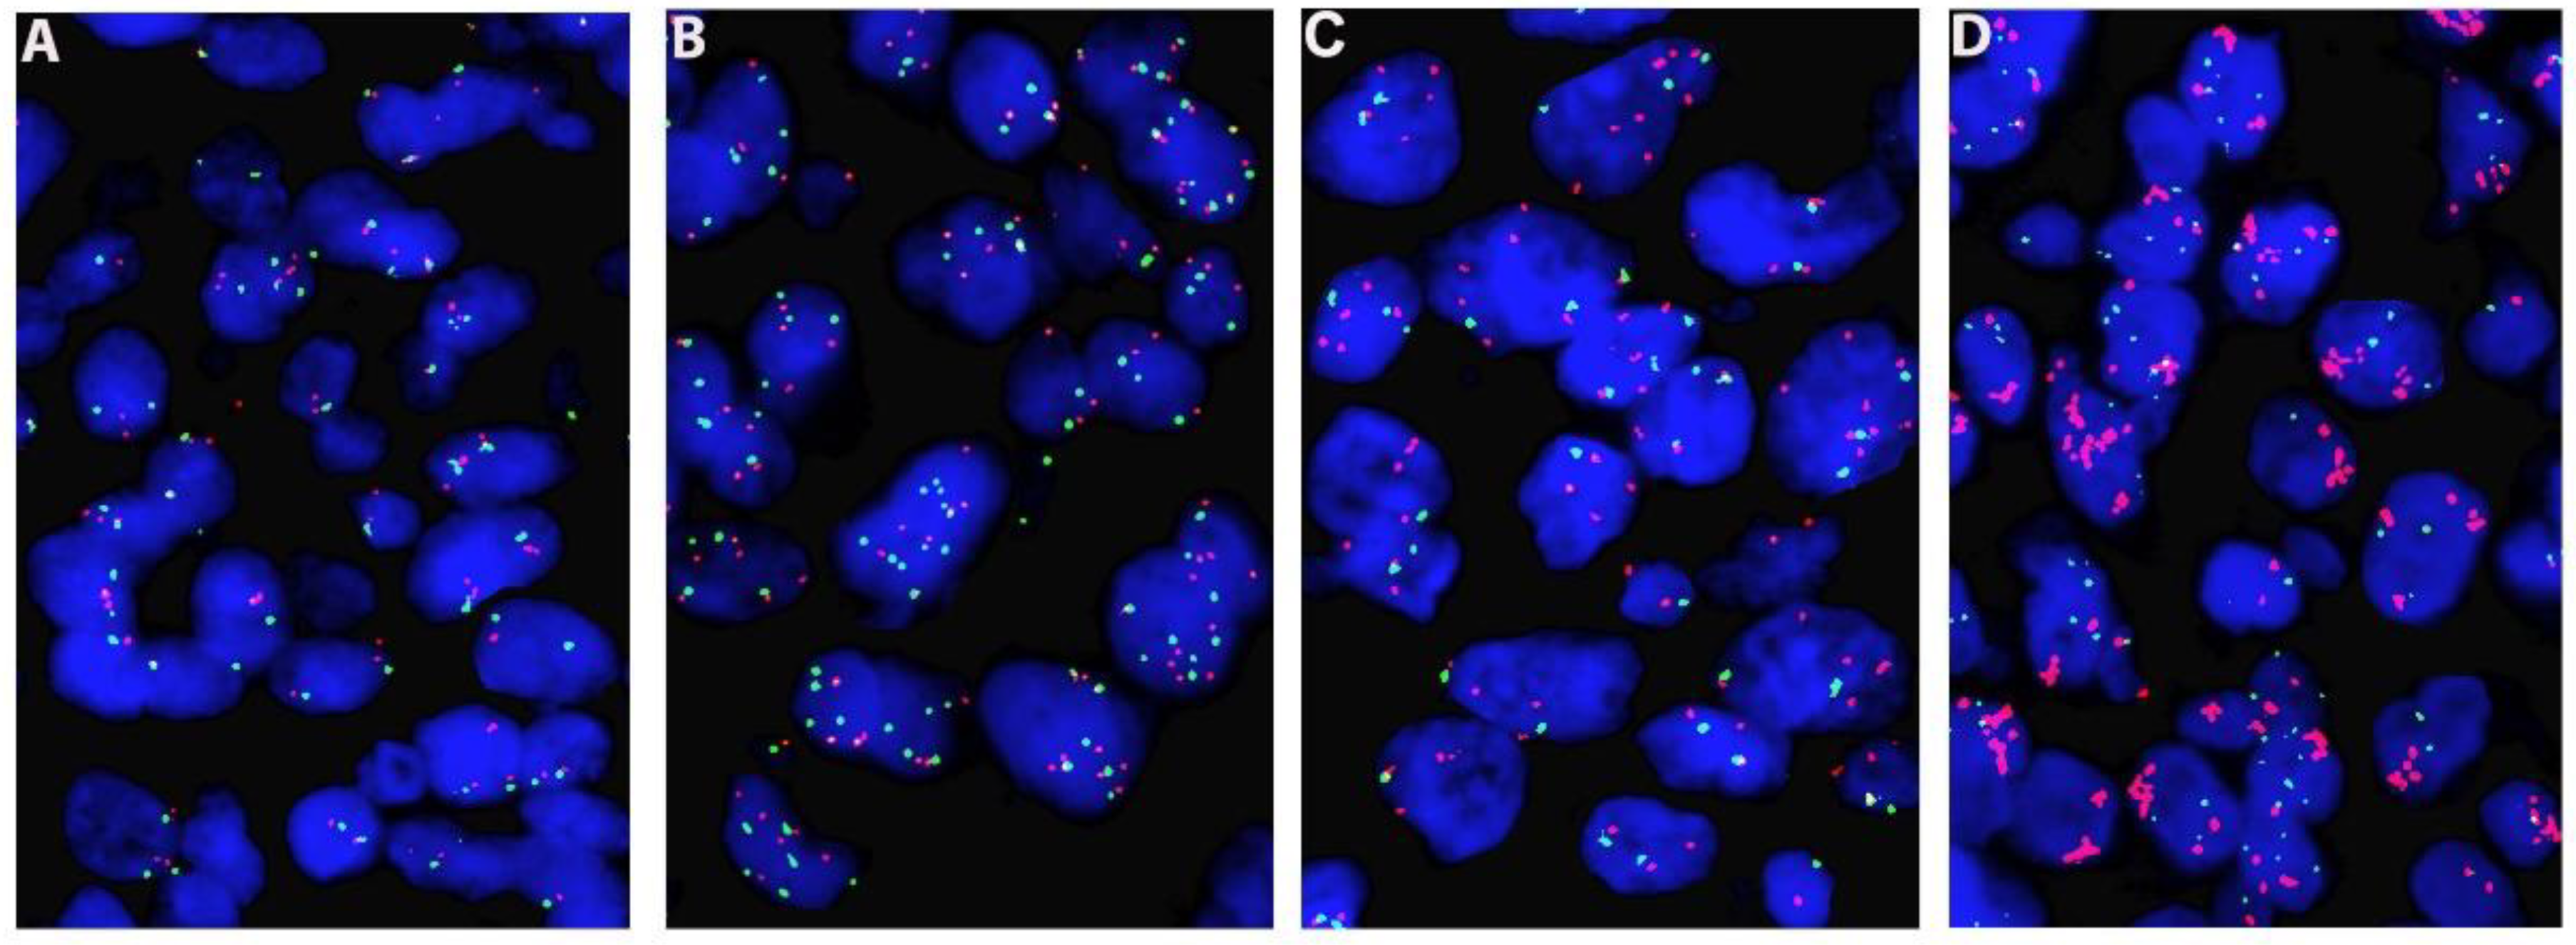
2.2. FISH Analysis
2.3. Immunohistochemistry Stain
2.4. Statistical Analysis
3. Results
3.1. Patients
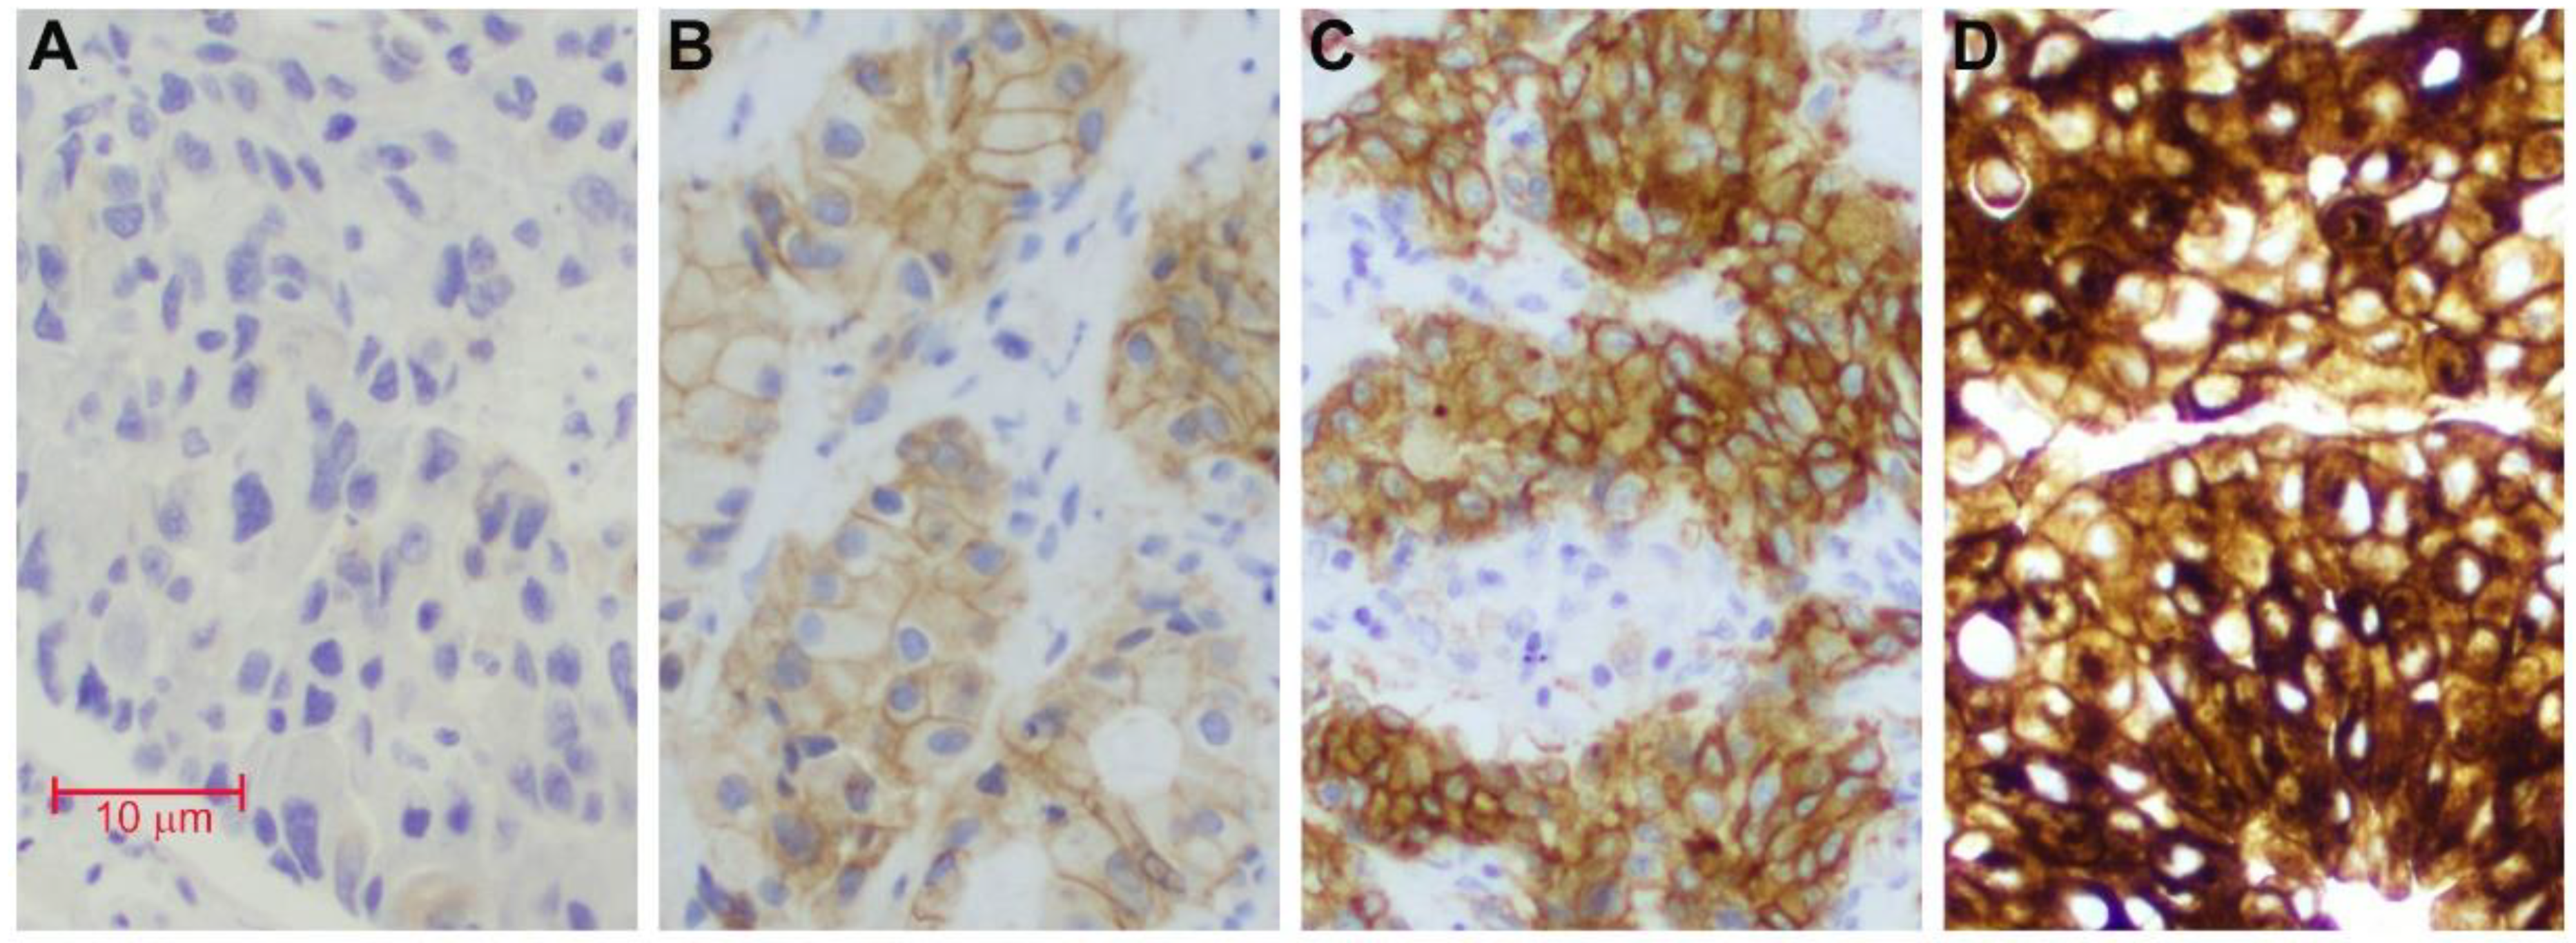
3.2. Immunohistochemistry
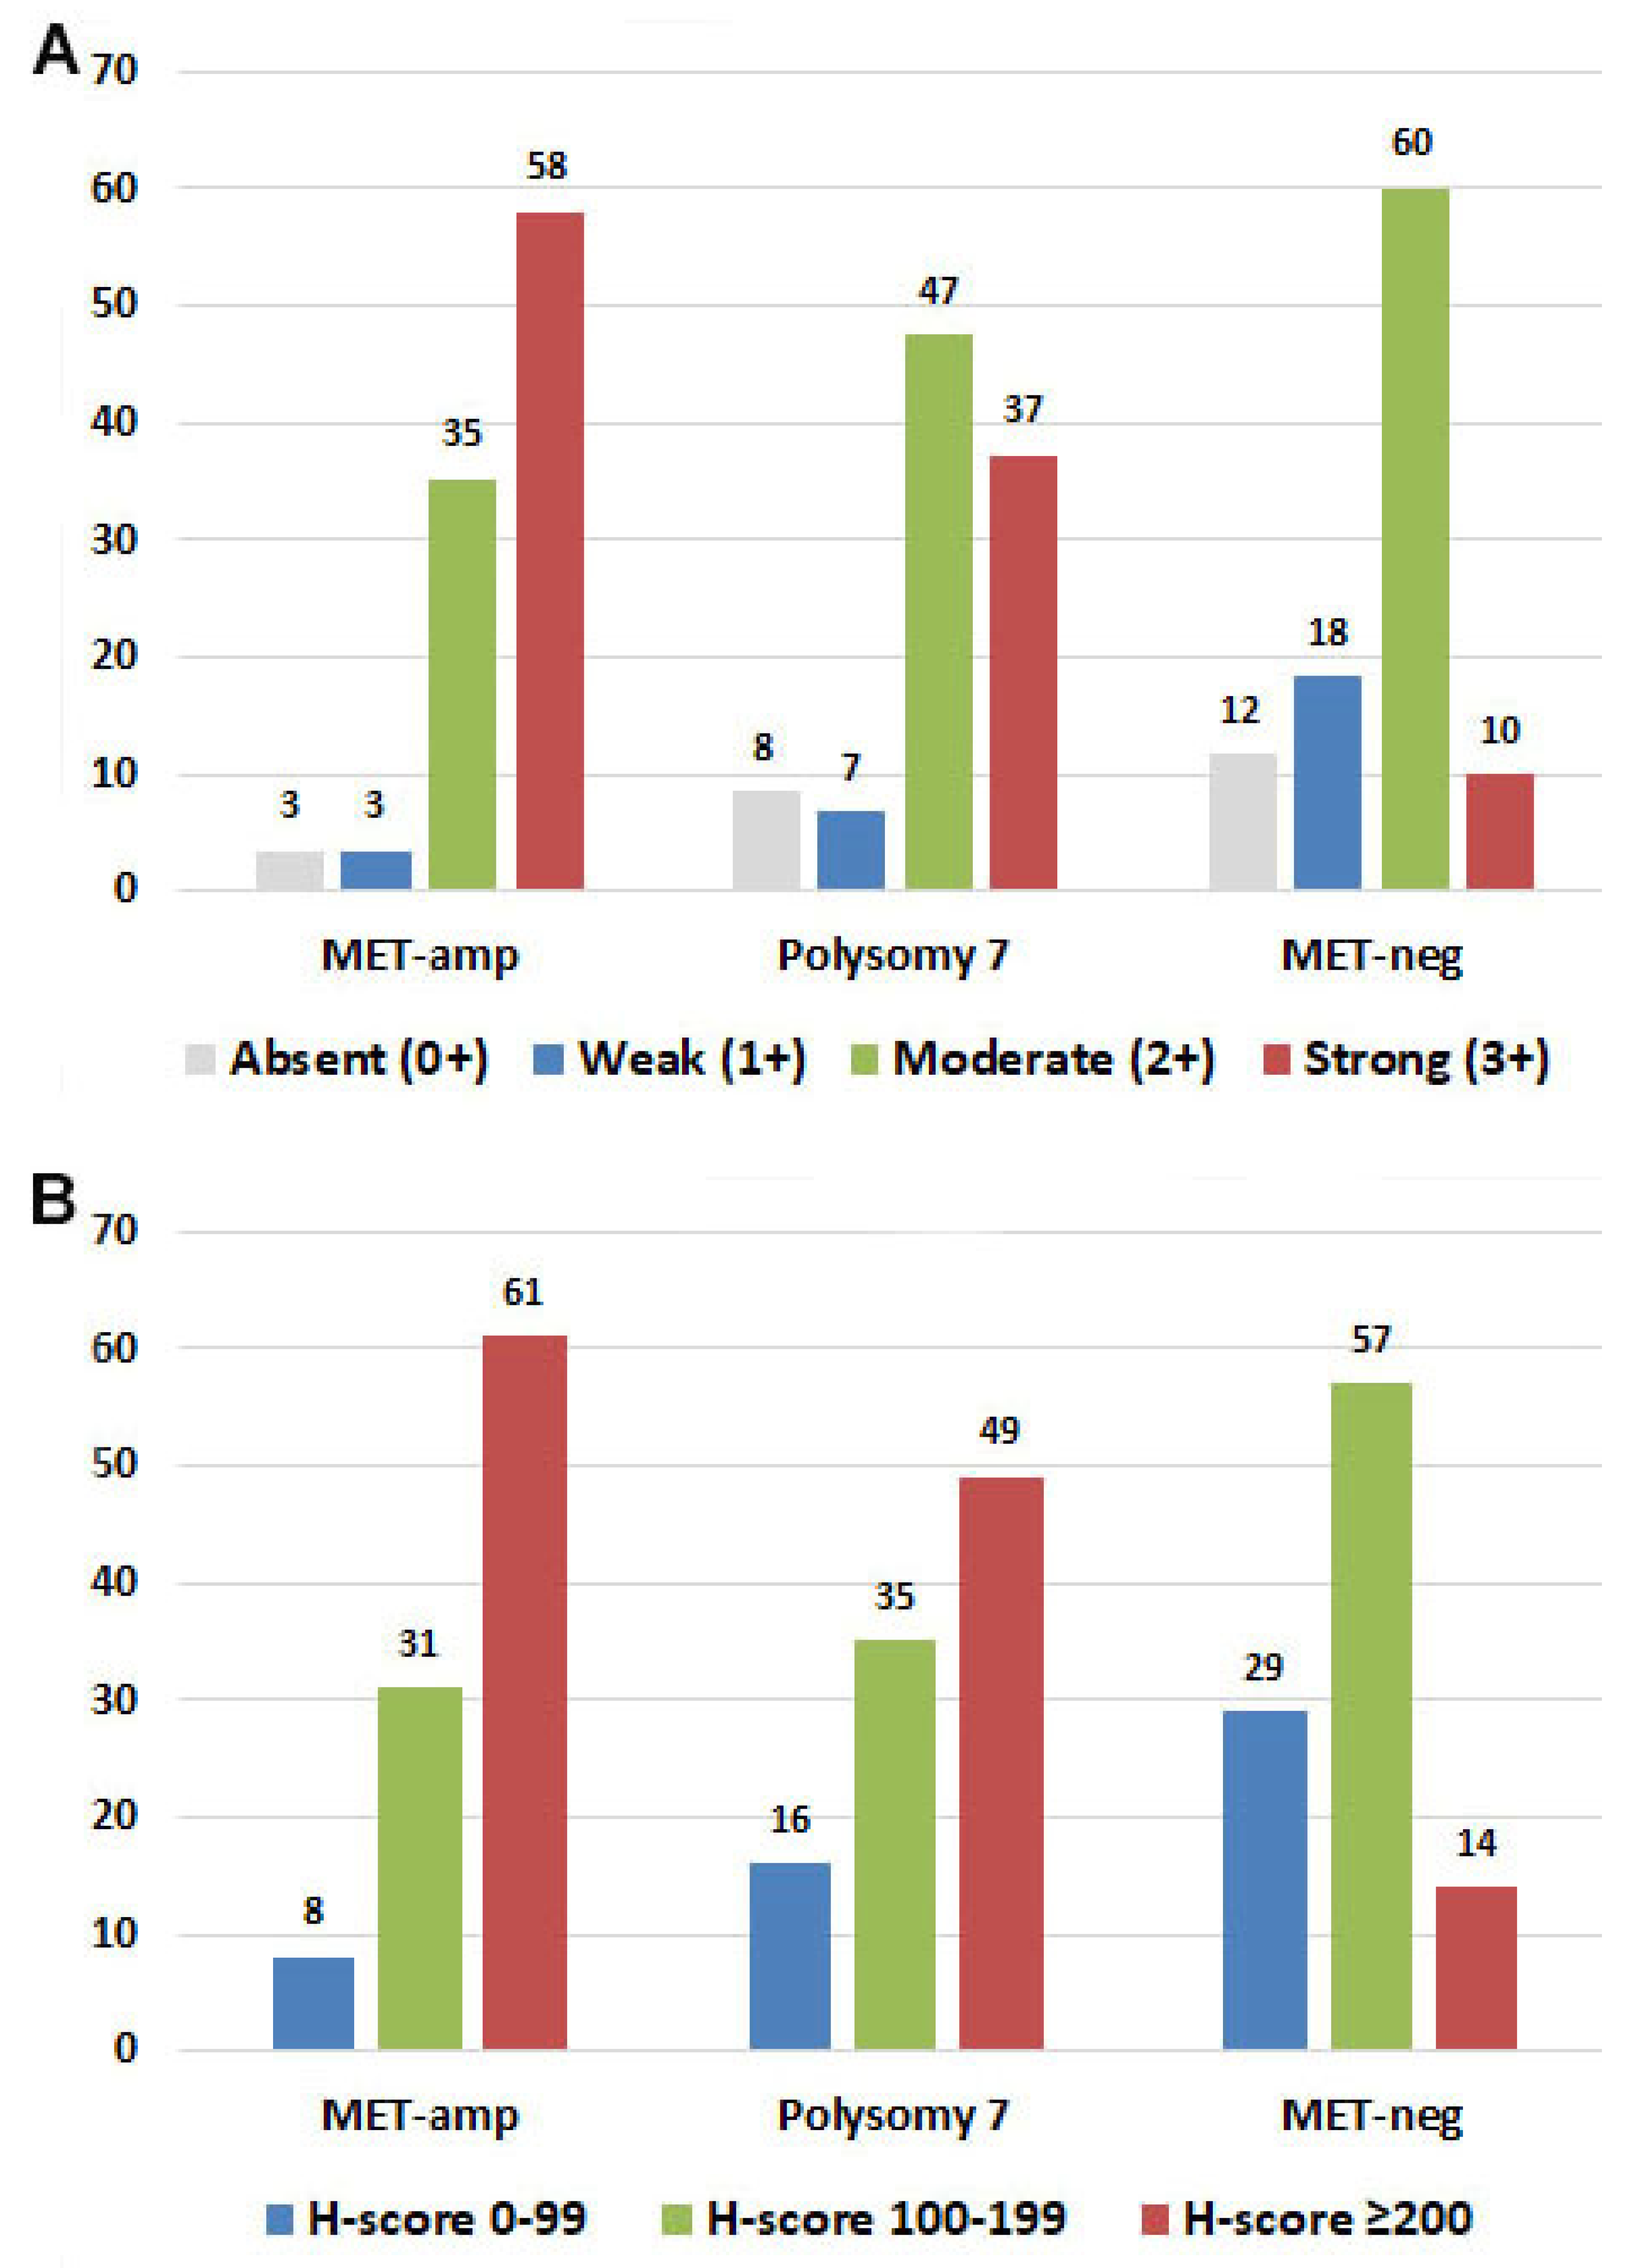
3.3. Correlation of MET Expression with MET Copy Number or MET/CEP7 Ratio
3.4. Correlation of MET Expression and Tumor Stage
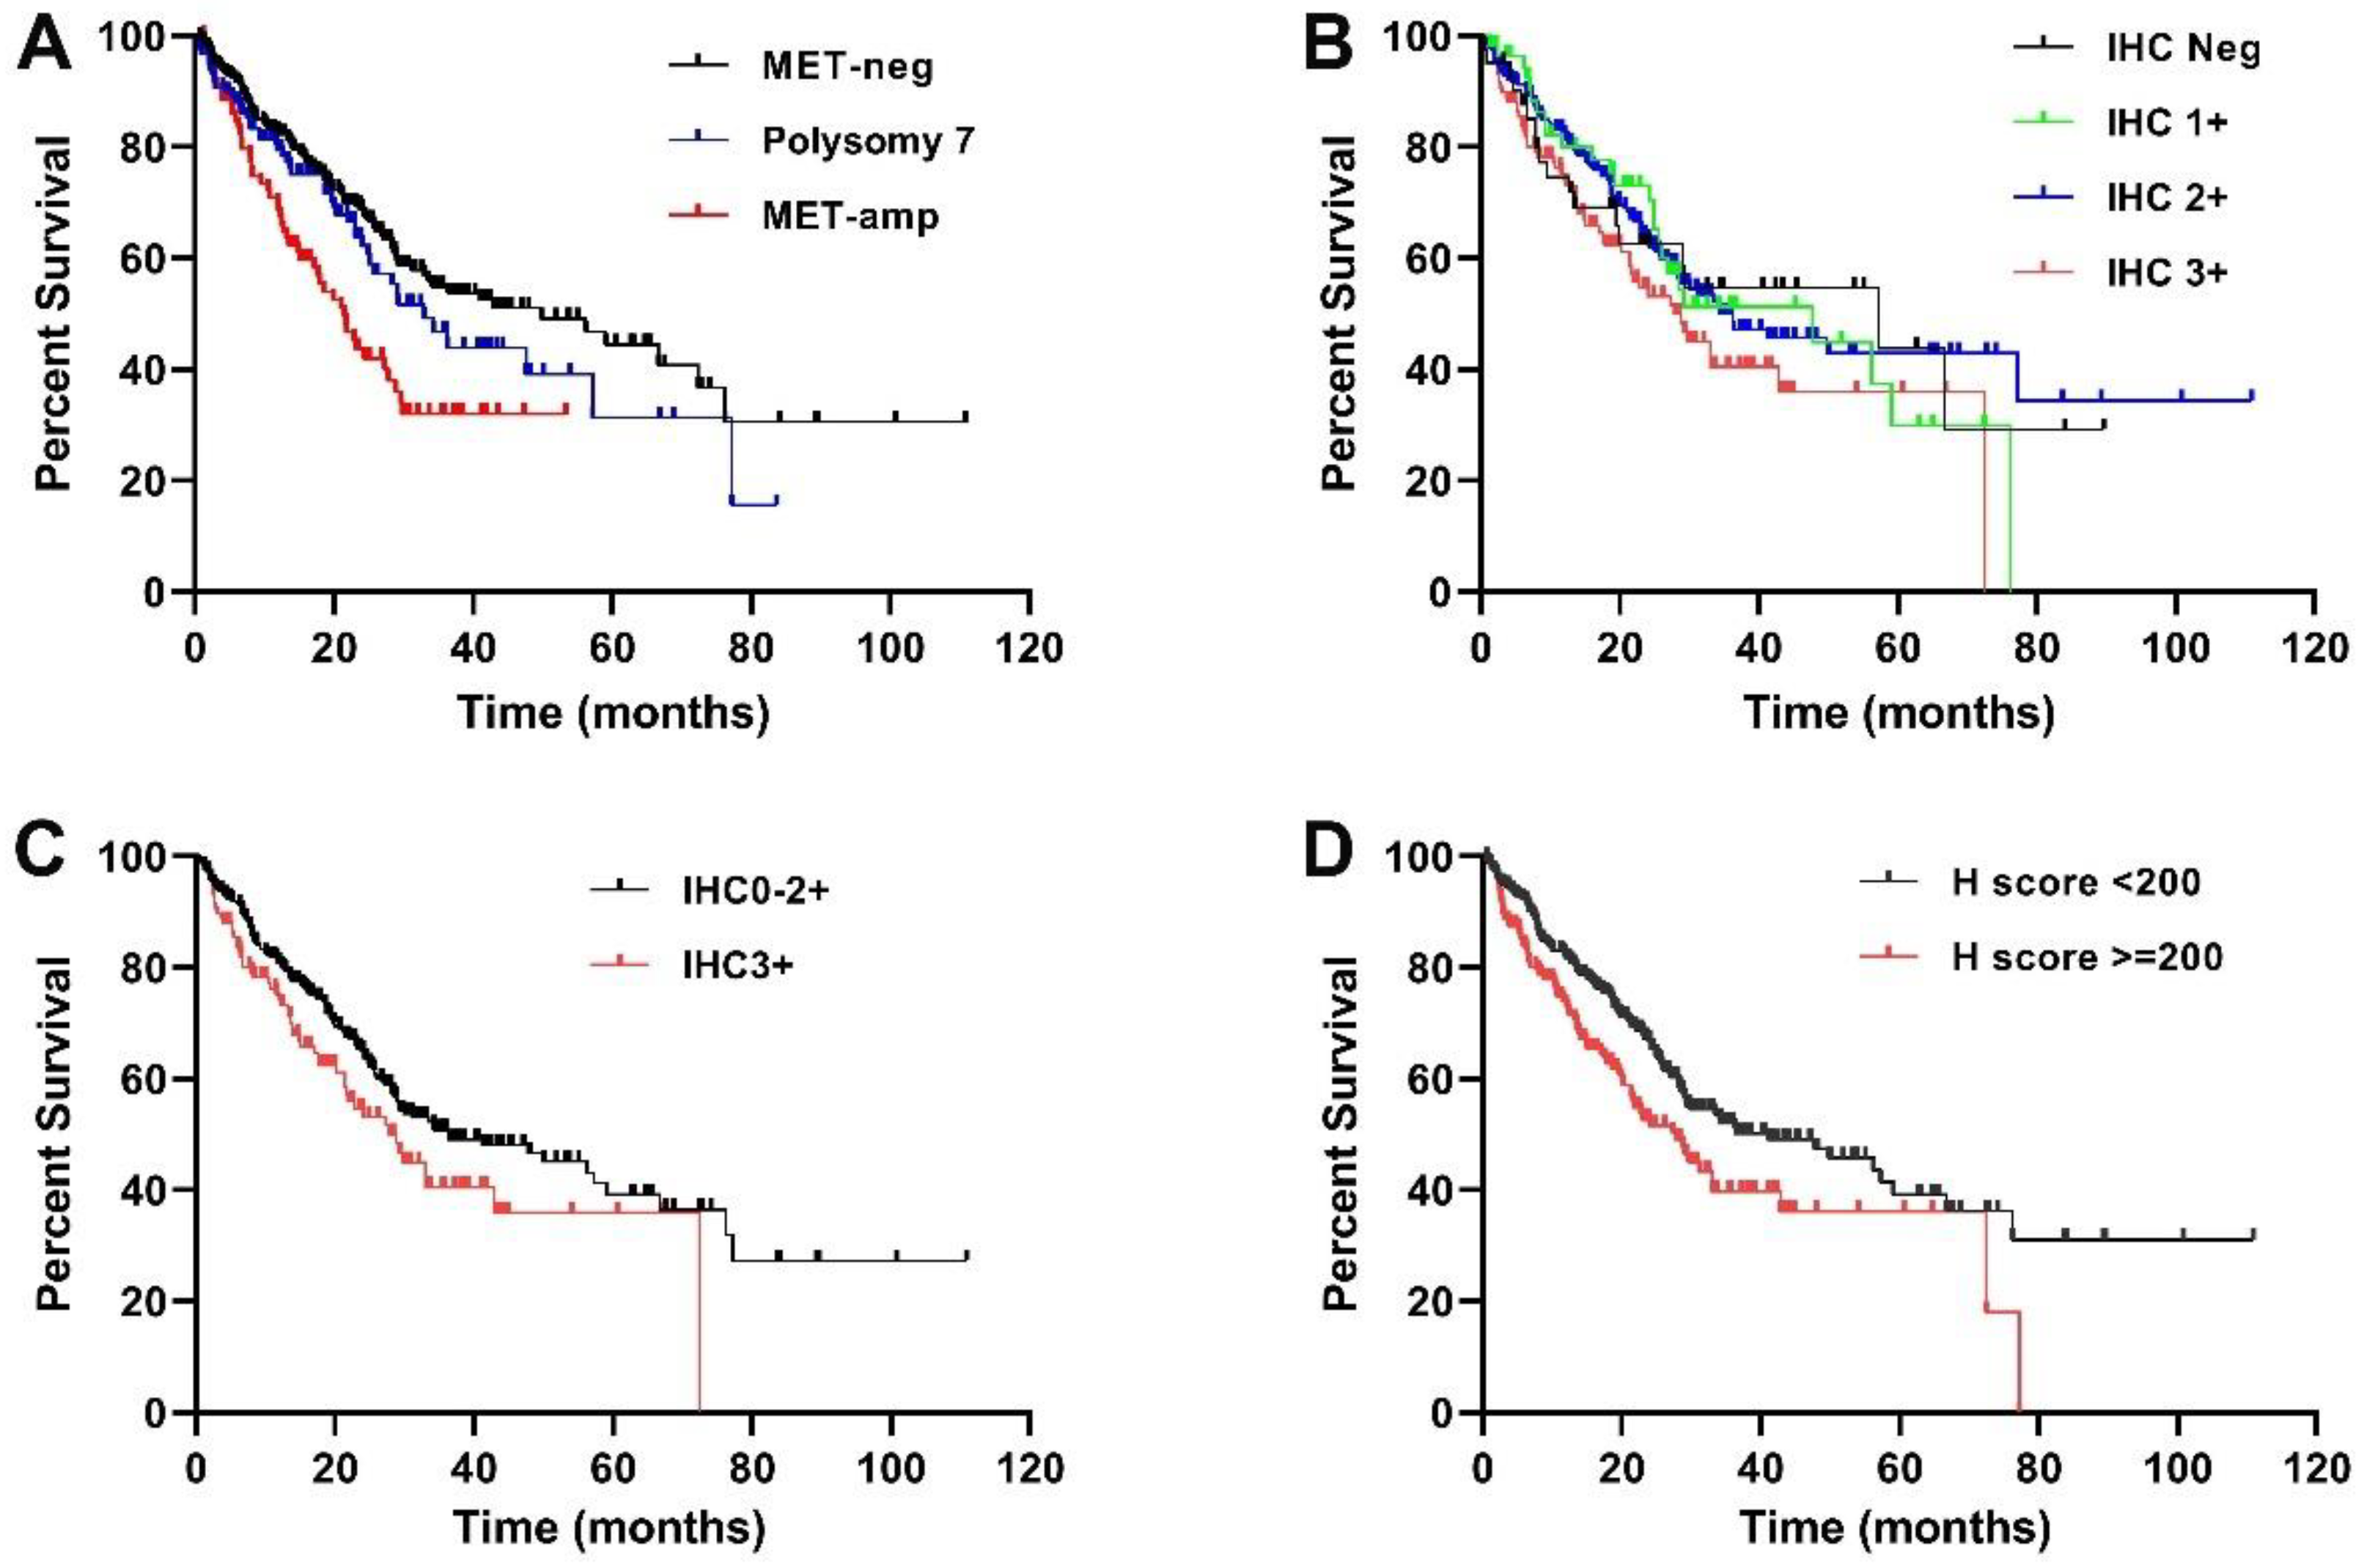
3.5. Correlation of MET Expression and Patient Outcome
4. Discussion
5. Conclusions
Author Contributions
Funding
Institutional Review Board Statement
Informed Consent Statement
Data Availability Statement
Acknowledgments
Conflicts of Interest
References
- Birchmeier, C.; Birchmeier, W.; Gherardi, E.; Vande Woude, G.F. Met, metastasis, motility and more. Nat. Rev. Mol. Cell. Biol. 2003, 4, 915–925. [Google Scholar] [CrossRef]
- Frampton, G.M.; Ali, S.M.; Rosenzweig, M.; Chmielecki, J.; Lu, X.; Bauer, T.M.; Akimov, M.; Bufill, J.A.; Lee, C.; Jentz, D.; et al. Activation of MET via diverse exon 14 splicing alterations occurs in multiple tumor types and confers clinical sensitivity to MET inhibitors. Cancer Discov. 2015, 5, 850–859. [Google Scholar] [CrossRef] [Green Version]
- Drilon, A.; Cappuzzo, F.; Ou, S.I.; Camidge, D.R. Targeting MET in Lung Cancer: Will Expectations Finally Be MET? J. Thorac. Oncol. 2017, 12, 15–26. [Google Scholar] [CrossRef] [Green Version]
- Dagogo-Jack, I.; Yoda, S.; Lennerz, J.K.; Langenbucher, A.; Lin, J.J.; Rooney, M.M.; Prutisto-Chang, K.; Oh, A.; Adams, N.A.; Yeap, B.Y.; et al. MET Alterations Are a Recurring and Actionable Resistance Mechanism in ALK-Positive Lung Cancer. Clin. Cancer Res. 2020, 26, 2535–2545. [Google Scholar] [CrossRef] [Green Version]
- Wu, Y.L.; Zhang, L.; Kim, D.W.; Liu, X.; Lee, D.H.; Yang, J.C.; Ahn, M.J.; Vansteenkiste, J.F.; Su, W.C.; Felip, E.; et al. Phase Ib/II Study of Capmatinib (INC280) Plus Gefitinib After Failure of Epidermal Growth Factor Receptor (EGFR) Inhibitor Therapy in Patients With EGFR-Mutated, MET Factor-Dysregulated Non-Small-Cell Lung Cancer. J. Clin. Oncol. 2018, 36, 3101–3109. [Google Scholar] [CrossRef]
- Ou, S.H.; Kwak, E.L.; Siwak-Tapp, C.; Dy, J.; Bergethon, K.; Clark, J.W.; Camidge, D.R.; Solomon, B.J.; Maki, R.G.; Bang, Y.J.; et al. Activity of crizotinib (PF02341066), a dual mesenchymal-epithelial transition (MET) and anaplastic lymphoma kinase (ALK) inhibitor, in a non-small cell lung cancer patient with de novo MET amplification. J. Thorac. Oncol. 2011, 6, 942–946. [Google Scholar] [CrossRef] [Green Version]
- Spigel, D.R.; Edelman, M.J.; O’Byrne, K.; Paz-Ares, L.; Shames, D.S.; Yu, W.; Paton, V.E.; Mok, T. Onartuzumab plus erlotinib versus erlotinib in previously treated stage IIIb or IV NSCLC: Results from the pivotal phase III randomized, multicenter, placebo-controlled MET Lung (OAM4971g) global trial. J. Clin. Oncol. 2014, 32, 8000. [Google Scholar] [CrossRef]
- Noonan, S.A.; Berry, L.; Lu, X.; Gao, D.; Baron, A.E.; Chesnut, P.; Sheren, J.; Aisner, D.L.; Merrick, D.; Doebele, R.C.; et al. Identifying the Appropriate FISH Criteria for Defining MET Copy Number-Driven Lung Adenocarcinoma through Oncogene Overlap Analysis. J. Thorac. Oncol. 2016, 11, 1293–1304. [Google Scholar] [CrossRef] [Green Version]
- Yin, W.; Cheng, J.; Tang, Z.; Toruner, G.; Hu, S.; Guo, M.; Robinson, M.; Medeiros, L.J.; Tang, G. MET Amplification (MET/CEP7 Ratio ≥ 1.8) Is an Independent Poor Prognostic Marker in Patients with Treatment-naive Non-Small-cell Lung Cancer. Clin. Lung Cancer 2020, 22, e512–e518. [Google Scholar] [CrossRef]
- Schildhaus, H.U.; Schultheis, A.M.; Ruschoff, J.; Binot, E.; Merkelbach-Bruse, S.; Fassunke, J.; Schulte, W.; Ko, Y.D.; Schlesinger, A.; Bos, M.; et al. MET amplification status in therapy-naive adeno- and squamous cell carcinomas of the lung. Clin. Cancer Res. 2015, 21, 907–915. [Google Scholar] [CrossRef] [Green Version]
- Go, H.; Jeon, Y.K.; Park, H.J.; Sung, S.W.; Seo, J.W.; Chung, D.H. High MET gene copy number leads to shorter survival in patients with non-small cell lung cancer. J. Thorac. Oncol. 2010, 5, 305–313. [Google Scholar] [CrossRef] [PubMed] [Green Version]
- Cappuzzo, F.; Marchetti, A.; Skokan, M.; Rossi, E.; Gajapathy, S.; Felicioni, L.; Del Grammastro, M.; Sciarrotta, M.G.; Buttitta, F.; Incarbone, M.; et al. Increased MET gene copy number negatively affects survival of surgically resected non-small-cell lung cancer patients. J. Clin. Oncol. 2009, 27, 1667–1674. [Google Scholar] [CrossRef] [PubMed] [Green Version]
- Bean, J.; Brennan, C.; Shih, J.Y.; Riely, G.; Viale, A.; Wang, L.; Chitale, D.; Motoi, N.; Szoke, J.; Broderick, S.; et al. MET amplification occurs with or without T790M mutations in EGFR mutant lung tumors with acquired resistance to gefitinib or erlotinib. Proc. Natl. Acad. Sci. USA 2007, 104, 20932–20937. [Google Scholar] [CrossRef] [PubMed] [Green Version]
- Engelman, J.A.; Zejnullahu, K.; Mitsudomi, T.; Song, Y.; Hyland, C.; Park, J.O.; Lindeman, N.; Gale, C.M.; Zhao, X.; Christensen, J.; et al. MET amplification leads to gefitinib resistance in lung cancer by activating ERBB3 signaling. Science 2007, 316, 1039–1043. [Google Scholar] [CrossRef] [PubMed]
- Lai, G.G.Y.; Lim, T.H.; Lim, J.; Liew, P.J.R.; Kwang, X.L.; Nahar, R.; Aung, Z.W.; Takano, A.; Lee, Y.Y.; Lau, D.P.X.; et al. Clonal MET Amplification as a Determinant of Tyrosine Kinase Inhibitor Resistance in Epidermal Growth Factor Receptor-Mutant Non-Small-Cell Lung Cancer. J. Clin. Oncol. 2019, 37, 876–884. [Google Scholar] [CrossRef] [PubMed]
- Chen, H.-J.; Mok, T.S.; Chen, Z.-H.; Guo, A.-L.; Zhang, X.-C.; Su, J.; Wu, Y.-L. Clinicopathologic and molecular features of epidermal growth factor receptor T790M mutation and c-MET amplification in tyrosine kinase inhibitor-resistant Chinese non-small cell lung cancer. Pathol. Oncol. Res. 2009, 15, 651–658. [Google Scholar] [CrossRef]
- Guo, R.; Berry, L.D.; Aisner, D.L.; Sheren, J.; Boyle, T.; Bunn, P.A., Jr.; Johnson, B.E.; Kwiatkowski, D.J.; Drilon, A.; Sholl, L.M.; et al. MET IHC Is a Poor Screen for MET Amplification or MET Exon 14 Mutations in Lung Adenocarcinomas: Data from a Tri-Institutional Cohort of the Lung Cancer Mutation Consortium. J. Thorac. Oncol. 2019, 14, 1666–1671. [Google Scholar] [CrossRef]
- Sequist, L.V.; Waltman, B.A.; Dias-Santagata, D.; Digumarthy, S.; Turke, A.B.; Fidias, P.; Bergethon, K.; Shaw, A.T.; Gettinger, S.; Cosper, A.K.; et al. Genotypic and histological evolution of lung cancers acquiring resistance to EGFR inhibitors. Sci. Transl. Med. 2011, 3, 75ra26. [Google Scholar] [CrossRef] [Green Version]
- Yu, H.A.; Arcila, M.E.; Rekhtman, N.; Sima, C.S.; Zakowski, M.F.; Pao, W.; Kris, M.G.; Miller, V.A.; Ladanyi, M.; Riely, G.J. Analysis of tumor specimens at the time of acquired resistance to EGFR-TKI therapy in 155 patients with EGFR-mutant lung cancers. Clin. Cancer Res. 2013, 19, 2240–2247. [Google Scholar] [CrossRef] [Green Version]
- Yin, W.; Liu, W.; Guo, M.; Tang, Z.; Toruner, G.; Robinson, M.; Cheng, J.; Hu, S.; Medeiros, L.J.; Tangm, G. Acquired MET amplification in non-small cell lung cancer is highly associated with the exposure of EGFR inhibitors and may not affect patients’ outcome. Exp. Mol. Pathol 2021, 118, 104572. [Google Scholar] [CrossRef]
- Moosavi, F.; Giovannetti, E.; Saso, L.; Firuzi, O. HGF/MET pathway aberrations as diagnostic, prognostic, and predictive biomarkers in human cancers. Crit. Rev. Clin. Lab. Sci. 2019, 56, 533–566. [Google Scholar] [CrossRef] [PubMed] [Green Version]
- Miller, C.T.; Lin, L.; Casper, A.M.; Lim, J.; Thomas, D.G.; Orringer, M.B.; Chang, A.C.; Chambers, A.F.; Giordano, T.J.; Glover, T.W.; et al. Genomic amplification of MET with boundaries within fragile site FRA7G and upregulation of MET pathways in esophageal adenocarcinoma. Oncogene 2006, 25, 409–418. [Google Scholar] [CrossRef] [PubMed] [Green Version]
- Tong, J.H.; Yeung, S.F.; Chan, A.W.; Chung, L.Y.; Chau, S.L.; Lung, R.W.; Tong, C.Y.; Chow, C.; Tin, E.K.; Yu, Y.H.; et al. MET Amplification and Exon 14 Splice Site Mutation Define Unique Molecular Subgroups of Non-Small Cell Lung Carcinoma with Poor Prognosis. Clin. Cancer Res. 2016, 22, 3048–3056. [Google Scholar] [CrossRef] [Green Version]
- Park, S.; Choi, Y.L.; Sung, C.O.; An, J.; Seo, J.; Ahn, M.J.; Ahn, J.S.; Park, K.; Shin, Y.K.; Erkin, O.C.; et al. High MET copy number and MET overexpression: Poor outcome in non-small cell lung cancer patients. Histol. Histopathol. 2012, 27, 197–207. [Google Scholar] [PubMed]
- Tsuta, K.; Kozu, Y.; Mimae, T.; Yoshida, A.; Kohno, T.; Sekine, I.; Tamura, T.; Asamura, H.; Furuta, K.; Tsuda, H. C-MET/phospho-MET protein expression and MET gene copy number in non-small cell lung carcinomas. J. Thorac. Oncol. 2012, 7, 331–339. [Google Scholar] [CrossRef] [PubMed] [Green Version]
- Mignard, X.; Ruppert, A.M.; Antoine, M.; Vasseur, J.; Girard, N.; Mazieres, J.; Moro-Sibilot, D.; Fallet, V.; Rabbe, N.; Thivolet-Bejui, F.; et al. C-MET Overexpression as a Poor Predictor of MET Amplifications or Exon 14 Mutations in Lung Sarcomatoid Carcinomas. J. Thorac. Oncol. 2018, 13, 1962–1967. [Google Scholar] [CrossRef] [Green Version]
- Rivalland, G.; Mitchell, P.; Murone, C.; Asadi, K.; Morey, A.L.; Starmans, M.; Boutros, P.C.; Walkiewicz, M.; Solomon, B.; Wright, G.; et al. Mesenchyme to epithelial transition protein expression, gene copy number and clinical outcome in a large non-small cell lung cancer surgical cohort. Transl. Lung Cancer Res. 2019, 8, 167–175. [Google Scholar] [CrossRef]
- Bubendorf, L.; Dafni, U.; Schobel, M.; Finn, S.P.; Tischler, V.; Sejda, A.; Marchetti, A.; Thunnissen, E.; Verbeken, E.K.; Warth, A.; et al. Prevalence and clinical association of MET gene overexpression and amplification in patients with NSCLC: Results from the European Thoracic Oncology Platform (ETOP) Lungscape project. Lung Cancer 2017, 111, 143–149. [Google Scholar] [CrossRef]
- Dziadziuszko, R.; Wynes, M.W.; Singh, S.; Asuncion, B.R.; Ranger-Moore, J.; Konopa, K.; Rzyman, W.; Szostakiewicz, B.; Jassem, J.; Hirsch, F.R. Correlation between MET gene copy number by silver in situ hybridization and protein expression by immunohistochemistry in non-small cell lung cancer. J. Thorac. Oncol. 2012, 7, 340–347. [Google Scholar] [CrossRef] [Green Version]
- Tsakonas, G.; Botling, J.; Micke, P.; Rivard, C.; LaFleur, L.; Mattsson, J.; Boyle, T.; Hirsch, F.R.; Ekman, S. c-MET as a biomarker in patients with surgically resected non-small cell lung cancer. Lung Cancer 2019, 133, 69–74. [Google Scholar] [CrossRef]
- Weingertner, N.; Meyer, N.; Voegeli, A.C.; Guenot, D.; Renaud, S.; Massard, G.; Falcoz, P.E.; Olland, A.; Mennecier, B.; Gaub, M.P.; et al. Correlation between MET protein expression and MET gene copy number in a Caucasian cohort of non-small cell lung cancers according to the new IASLC/ATS/ERS classification. Pathology 2015, 47, 320–328. [Google Scholar] [CrossRef] [PubMed]
- Koeppen, H.; Yu, W.; Zha, J.; Pandita, A.; Penuel, E.; Rangell, L.; Raja, R.; Mohan, S.; Patel, R.; Desai, R.; et al. Biomarker analyses from a placebo-controlled phase II study evaluating erlotinib+/-onartuzumab in advanced non-small cell lung cancer: MET expression levels are predictive of patient benefit. Clin. Cancer Res. 2014, 20, 4488–4498. [Google Scholar] [CrossRef] [PubMed] [Green Version]
- Pyo, J.S.; Kang, G.; Cho, W.J.; Choi, S.B. Clinicopathological significance and concordance analysis of c-MET immunohistochemistry in non-small cell lung cancers: A meta-analysis. Pathol. Res. Pract. 2016, 212, 710–716. [Google Scholar] [CrossRef] [PubMed]
- Patane, S.; Avnet, S.; Coltella, N.; Costa, B.; Sponza, S.; Olivero, M.; Vigna, E.; Naldini, L.; Baldini, N.; Ferracini, R.; et al. MET overexpression turns human primary osteoblasts into osteosarcomas. Cancer Res. 2006, 66, 4750–4757. [Google Scholar] [CrossRef] [Green Version]
- Wang, R.; Ferrell, L.D.; Faouzi, S.; Maher, J.J.; Bishop, J.M. Activation of the Met receptor by cell attachment induces and sustains hepatocellular carcinomas in transgenic mice. J. Cell. Biol. 2001, 153, 1023–1034. [Google Scholar] [CrossRef]
- Wu, Y.L.; Cheng, Y.; Zhou, J.; Lu, S.; Zhang, Y.; Zhao, J.; Kim, D.W.; Soo, R.A.; Kim, S.W.; Pan, H.; et al. Tepotinib plus gefitinib in patients with EGFR-mutant non-small-cell lung cancer with MET overexpression or MET amplification and acquired resistance to previous EGFR inhibitor (INSIGHT study): An open-label, phase 1b/2, multicentre, randomised trial. Lancet Respir. Med. 2020, 8, 1132–1143. [Google Scholar] [CrossRef]
- Casadevall, D.; Gimeno, J.; Clave, S.; Taus, A.; Pijuan, L.; Arumi, M.; Lorenzo, M.; Menendez, S.; Canadas, I.; Albanell, J.; et al. MET expression and copy number heterogeneity in nonsquamous non-small cell lung cancer (nsNSCLC). Oncotarget 2015, 6, 16215–16226. [Google Scholar] [CrossRef] [Green Version]


| Absent (0+) (n = 41) | Weak (1+) (n = 55) | Moderate (2+) (n = 231) | Strong (3+) (n = 119) | Total (n = 446) | |
|---|---|---|---|---|---|
| Age (range) | 68 (33–85) | 68 (44–83) | 67 (29–94) | 65 (29–83) | 66 (29–94) |
| Gender (M/F) | 22/19 | 30/25 | 100/131 | 51/68 | 203/243 |
| FISH analysis | |||||
| MET-amp | 3 (3.4%) | 3 (3.4%) | 31 (35.2%) | 51 (58%) | 88 (19.7%) |
| Polysomy 7 | 10 (8.5%) | 8 (6.8%) | 56 (47.5%) | 44 (37.3%) | 118 (26.5%) |
| MET-neg | 28 (11.7%) | 44 (18.3%) | 144 (60%) | 24 (10%) | 240 (53.8%) |
| Cancer stage | |||||
| I/II | 15 (36.6%) | 12 (21.8%) | 59 (25.5%) | 9 (7.6%) | 95 (21.3) |
| III/IV | 26 (66%) | 43 (78.2%) | 172 (74.5%) | 110 (92.3%) | 351 (78.7) |
| Outcome | |||||
| Alive/Dead | 23/18 | 30/25 | 139/92 | 63/56 | 255/191 |
| Median OS (mon) | 57.2 | 47.7 | 34.3 | 28.8 |
| MET-amp (n = 88) | Polysomy 7 (n = 118) | MET-neg (n = 240) | Total (n = 446) | Correlation (r) | p | |
|---|---|---|---|---|---|---|
| IHC0 | 3 (7%) | 10 (24%) | 28 (68%) | 41 | a 0.4431 b 0.4401 | <0.0001 <0.0001 |
| IHC1+ | 3 (5%) | 8 (15%) | 44 (80%) | 55 | ||
| IHC2+ | 31 (13%) | 56 (24%) | 144 (62%) | 231 | ||
| IHC3+ | 51 (43%) | 44 (37%) | 24 (20%) | 119 | ||
| H-score 0–99 | 7 (7%) | 19 (20%) | 70 (73%) | 96 | a 0.4381 b 0.4298 | <0.0001 <0.0001 |
| H-score 100–199 | 27 (13%) | 41 (20%) | 137 (67%) | 205 | ||
| H-score 200–00 | 54 (37%) | 58 (40%) | 33 (23%) | 145 |
| No. of Patients | Median Survival | p | |
|---|---|---|---|
| IHC0/1+ | 96 | 47.7 | 0.6630 |
| IHC2+/3+ | 350 | 33 | |
| IHC0/1+/-2+ | 327 | 36.3 | 0.0463 |
| IHC3+ | 119 | 28.8 | |
| H-score < 150 | 122 | 47.5 | 0.2950 |
| H-score ≥ 150 | 324 | 32.8 | |
| H-score < 200 | 301 | 41.1 | 0.0110 |
| H-score ≥ 200 | 145 | 27.8 |
| a Overall Survival | b Overall Survival | |||
|---|---|---|---|---|
| Variables | Hazard Ratio (95% CI) | p | Hazard Ratio (95% CI) | p |
| Age (≥65 vs. <65 years) | 1.849 (1.372–2.491) | <0.0001 | 1.827 (1.355–2.462) | <0.0001 |
| Stage (I/II vs. III/IV) | 4.163 (2.560–6.770) | <0.0001 | 4.215 (2.585–6.873) | <0.0001 |
| MET FISH | ||||
| 1.046 (0.729–1.501) | 0.588 | 1.100 (0.769–1.573) | 0.602 |
| 1.407 (1.057–2.311) | 0.045 | 1.547 (1.067–2.422) | 0.027 |
| Immunohistochemistry | ||||
| 1.200 (0.865–1.664) | 0.275 | ||
| 0.984 (0.694–1.396) | 0.930 | ||
| Reference | Criteria for MET Overexpression | Positive Rate | Tissue | Antibody | Correlates with MET GCN? | Associates with Survival? |
|---|---|---|---|---|---|---|
| Bubendorf (2017) [28] | >50% exhibit 2+ staining | 23.8% | TMA | SP44 | Yes | Not correlated |
| Dziadziuszko (2012) [29] | METMab: ≥50% of cells with ≥2+ | 25% (44/174) | TMA | SP44 | Yes | Not correlated |
| Guo (2019) [17] | H-score ≥ 200 | 39% (71/181) | SP44 | Poor | NA | |
| Mignard (2018) [26] | H-score ≥ 150 MetMab Score: 2+/3+ | 15/81(18.5%) 14/81 (17%) | SP44 | Poor | NA | |
| MetMab Score: 2+/3+ | ||||||
| Park (2012) [24] | 4–12 (of 0–12 scale) (intensity x fraction) | 13.7 (52/380) | 3D4 (Rabbit polyclonal | Yes | Significant shorter OS and DFS | |
| Rivalland (2019) [27] | >50% exhibit 2+ staining | 25% (193/763) | TMA | SP44 | Yes | Not correlated |
| Tsuta (2012) [25] | Cytoplasmic/membrane, ≥10% cells | 22.2% | SP44 | NA | Not correlated | |
| Weingertner (2015) [31] | METMab: ≥50% of cells ≥2+ | 44% (89/201) | TMA | SP44 | High GCN often have overexpression; ~1/3 overexpression cases had high MET GCN | Only in non-smoke group (32/201) |
| 3+ in ≥10% of cells | 28% (57/201) | |||||
| H-score: >140 | 42% (84/201) | |||||
| Current study | IHC3+, ≥50% of cells | 26.7% | Tissue section | SP44 | Yes, but low correlation | Yes, but not an independent factor |
| H-score ≥ 200 | 32.5% | Yes, but low correlation | Yes, but not an independent factor |
Publisher’s Note: MDPI stays neutral with regard to jurisdictional claims in published maps and institutional affiliations. |
© 2022 by the authors. Licensee MDPI, Basel, Switzerland. This article is an open access article distributed under the terms and conditions of the Creative Commons Attribution (CC BY) license (https://creativecommons.org/licenses/by/4.0/).
Share and Cite
Yin, W.; Guo, M.; Tang, Z.; Toruner, G.A.; Cheng, J.; Medeiros, L.J.; Tang, G. MET Expression Level in Lung Adenocarcinoma Loosely Correlates with MET Copy Number Gain/Amplification and Is a Poor Predictor of Patient Outcome. Cancers 2022, 14, 2433. https://doi.org/10.3390/cancers14102433
Yin W, Guo M, Tang Z, Toruner GA, Cheng J, Medeiros LJ, Tang G. MET Expression Level in Lung Adenocarcinoma Loosely Correlates with MET Copy Number Gain/Amplification and Is a Poor Predictor of Patient Outcome. Cancers. 2022; 14(10):2433. https://doi.org/10.3390/cancers14102433
Chicago/Turabian StyleYin, Wei, Ming Guo, Zhenya Tang, Gokce A. Toruner, Joanne Cheng, L. Jeffrey Medeiros, and Guilin Tang. 2022. "MET Expression Level in Lung Adenocarcinoma Loosely Correlates with MET Copy Number Gain/Amplification and Is a Poor Predictor of Patient Outcome" Cancers 14, no. 10: 2433. https://doi.org/10.3390/cancers14102433
APA StyleYin, W., Guo, M., Tang, Z., Toruner, G. A., Cheng, J., Medeiros, L. J., & Tang, G. (2022). MET Expression Level in Lung Adenocarcinoma Loosely Correlates with MET Copy Number Gain/Amplification and Is a Poor Predictor of Patient Outcome. Cancers, 14(10), 2433. https://doi.org/10.3390/cancers14102433