
Validation of Breast Cancer Risk Models by Race/Ethnicity, Family History and Molecular Subtypes

 , ,
, ,  , and
, and
Abstract
:Simple Summary
Abstract
1. Introduction
2. Materials and Methods
2.1. Study Population
2.2. Outcomes
2.3. Statistical Analysis
3. Results
4. Discussion
5. Conclusions
Author Contributions
Funding
Institutional Review Board Statement
Informed Consent Statement
Data Availability Statement
Conflicts of Interest
Appendix A

| Performance Metric by Site | BCRAT | BCSC | BRCAPRO | BRCAPRO+BCRAT | ||||
|---|---|---|---|---|---|---|---|---|
| MGH (N = 804 cases) | Estimate | 95% CI | Estimate | 95% CI | Estimate | 95% CI | Estimate | 95% CI |
| O/E | 1.060 | 0.993, 1.131 | 1.196 | 1.119, 1.275 | 1.057 | 0.988, 1.126 | 1.095 | 1.025, 1.166 |
| AUC | 0.595 a | 0.576, 0.615 | 0.620 c | 0.604, 0.639 | 0.587 d | 0.567, 0.610 | 0.603 b | 0.585, 0.625 |
| TPR | 0.331 | 0.302, 0.362 | 0.270 | 0.244, 0.307 | 0.340 | 0.311, 0.375 | 0.294 | 0.263, 0.325 |
| FPR | 0.204 | 0.201, 0.207 | 0.162 | 0.159, 0.166 | 0.238 | 0.235, 0.241 | 0.186 | 0.183, 0.188 |
| Patients with high 5-year risk, N (%) | 12,089 (20.59) | - | 9600 (16.35) | - | 14,049 (23.93) | - | 10,983 (18.71) | - |
| NWH (N = 512 cases) | ||||||||
| O/E | 0.930 | 0.850, 1.003 | 1.039 | 0.950, 1.123 | 1.026 | 0.938, 1.107 | 0.947 | 0.866, 1.022 |
| AUC | 0.618 | 0.592, 0.640 | 0.624 c | 0.602, 0.646 | 0.599 d | 0.574, 0.622 | 0.622 | 0.598, 0.644 |
| TPR | 0.408 | 0.368, 0.452 | 0.369 | 0.329, 0.406 | 0.324 | 0.281, 0.365 | 0.387 | 0.345, 0.433 |
| FPR | 0.252 | 0.248, 0.256 | 0.218 | 0.213, 0.222 | 0.205 | 0.201, 0.209 | 0.228 | 0.224, 0.232 |
| Patients with high 5-year risk, N (%) | 9960 (25.42) | - | 8603 (21.95) | - | 8078 (20.61) | - | 9015 (23.00) | - |
| UPenn (N = 418 cases) | ||||||||
| O/E | 1.146 | 1.044, 1.261 | 1.402 | 1.275, 1.544 | 1.186 | 1.080, 1.306 | 1.174 | 1.070, 1.294 |
| AUC | 0.598 e | 0.567, 0.625 | 0.603 c | 0.578, 0.631 | 0.576 d | 0.549, 0.603 | 0.597 | 0.568, 0.624 |
| TPR | 0.433 | 0.380, 0.477 | 0.304 | 0.265, 0.344 | 0.433 | 0.389, 0.475 | 0.402 | 0.356, 0.447 |
| FPR | 0.296 | 0.291, 0.301 | 0.182 | 0.177, 0.187 | 0.318 | 0.313, 0.323 | 0.275 | 0.270, 0.280 |
| Patients with high 5-year risk, N (%) | 7347 (29.79) | - | 4548 (18.44) | - | 7889 (31.99) | - | 6832 (27.70) | - |
Appendix B


Appendix C
| Performance Metric by Race | BCRAT | BCSC | BRCAPRO | BRCAPRO+BCRAT | ||||
|---|---|---|---|---|---|---|---|---|
| White (N = 220 Cases) | Estimate | 95% CI | Estimate | 95% CI | Estimate | 95% CI | Estimate | 95% CI |
| O/E | 1.129 | 0.999, 1.281 | 1.400 | 1.241, 1.588 | 1.259 | 1.117, 1.434 | 1.161 | 1.027, 1.317 |
| AUC | 0.580 | 0.544, 0.619 | 0.565 a | 0.525, 0.601 | 0.549 b,c | 0.513, 0.583 | 0.583 | 0.548, 0.623 |
| TPR | 0.532 | 0.47, 0.595 | 0.373 | 0.309, 0.431 | 0.473 | 0.402, 0.533 | 0.500 | 0.436, 0.561 |
| FPR | 0.421 | 0.412, 0.429 | 0.273 | 0.264, 0.281 | 0.401 | 0.394, 0.41 | 0.383 | 0.373, 0.391 |
| Patients with high 5-year risk, N (%) | 4783 (42.28) | - | 3112 (27.51) | - | 4557 (40.28) | - | 4354 (38.49) | - |
| Black or African American (N = 170 cases) d | ||||||||
| O/E | 1.152 | 0.984, 1.377 | 1.413 | 1.218, 1.691 | 1.112 | 0.957, 1.33 | 1.190 | 1.016, 1.423 |
| AUC | 0.610 | 0.571, 0.653 | 0.644 | 0.594, 0.684 | 0.608 | 0.565, 0.648 | 0.615 | 0.572, 0.659 |
| TPR | 0.353 | 0.276, 0.424 | 0.241 | 0.178, 0.305 | 0.429 | 0.353, 0.5 | 0.324 | 0.263, 0.393 |
| FPR | 0.199 | 0.192, 0.206 | 0.110 | 0.105, 0.116 | 0.273 | 0.265, 0.282 | 0.193 | 0.186, 0.2 |
| Patients with high 5-year risk, N (%) | 2266 (20.09) | - | 1267 (11.23) | - | 3108 (27.56) | - | 2201 (19.51) | - |
References
- Siegel, R.L.; Miller, K.D.; Fuchs, H.E.; Jemal, A. Cancer Statistics, 2021. CA Cancer J. Clin. 2021, 71, 7–33. [Google Scholar] [CrossRef]
- Cintolo-Gonzalez, J.A.; Braun, D.; Blackford, A.L.; Mazzola, E.; Acar, A.; Plichta, J.K.; Griffin, M.; Hughes, K.S. Breast cancer risk models: A comprehensive overview of existing models, validation, and clinical applications. Breast Cancer Res. Treat. 2017, 164, 263–284. [Google Scholar] [CrossRef]
- Banegas, M.P.; John, E.M.; Slattery, M.L.; Gomez, S.L.; Yu, M.; LaCroix, A.Z.; Pee, D.; Chlebowski, R.T.; Hines, L.M.; Thompson, C.A.; et al. Projecting Individualized Absolute Invasive Breast Cancer Risk in US Hispanic Women. J. Natl. Cancer Inst. 2017, 109, djw215. [Google Scholar] [CrossRef] [PubMed] [Green Version]
- Gail, M.H.; Brinton, L.A.; Byar, D.P.; Corle, D.K.; Green, S.B.; Schairer, C.; Mulvihill, J.J. Projecting individualized probabilities of developing breast cancer for white females who are being examined annually. J. Natl. Cancer Inst. 1989, 81, 1879–1886. [Google Scholar] [CrossRef] [PubMed]
- Gail, M.H.; Costantino, J.P.; Pee, D.; Bondy, M.; Newman, L.; Selvan, M.; Anderson, G.L.; Malone, K.E.; Marchbanks, P.A.; McCaskill-Stevens, W.; et al. Projecting individualized absolute invasive breast cancer risk in African American women. J. Natl. Cancer Inst. 2007, 99, 1782–1792. [Google Scholar] [CrossRef] [PubMed] [Green Version]
- Matsuno, R.K.; Costantino, J.P.; Ziegler, R.G.; Anderson, G.L.; Li, H.; Pee, D.; Gail, M.H. Projecting individualized absolute invasive breast cancer risk in Asian and Pacific Islander American women. J. Natl. Cancer Inst. 2011, 103, 951–961. [Google Scholar] [CrossRef] [PubMed]
- Tice, J.A.; Cummings, S.R.; Smith-Bindman, R.; Ichikawa, L.; Barlow, W.E.; Kerlikowske, K. Using clinical factors and mammographic breast density to estimate breast cancer risk: Development and validation of a new predictive model. Ann. Intern. Med. 2008, 148, 337–347. [Google Scholar] [CrossRef] [PubMed] [Green Version]
- Sickles, E.A.; D’Orsi, C.J.; Bassett, L.W.; Appleton, C.M.; Berg, W.A.; Burnside, E.S. ACR BI-RADS® Mammography. In ACR BI-RADS® Atlas, Breast Imaging Reporting and Data System; American College of Radiology: Reston, VA, USA, 2013; Volume 5, pp. 134–136. [Google Scholar]
- Berry, D.A.; Parmigiani, G.; Sanchez, J.; Schildkraut, J.; Winer, E. Probability of carrying a mutation of breast-ovarian cancer gene BRCA1 based on family history. J. Natl. Cancer Inst. 1997, 89, 227–238. [Google Scholar] [CrossRef] [Green Version]
- Guan, Z.; Huang, T.; McCarthy, A.M.; Hughes, K.S.; Semine, A.; Uno, H.; Trippa, L.; Parmigiani, G.; Braun, D. Combining Breast Cancer Risk Prediction Models. arXiv 2020, arXiv:2008.01019. [Google Scholar]
- McCarthy, A.M.; Guan, Z.; Welch, M.; Griffin, M.E.; Sippo, D.A.; Deng, Z.; Coopey, S.B.; Acar, A.; Semine, A.; Parmigiani, G.; et al. Performance of Breast Cancer Risk-Assessment Models in a Large Mammography Cohort. J. Natl. Cancer Inst. 2020, 112, 489–497. [Google Scholar] [CrossRef]
- Howlader, N.; Altekruse, S.F.; Li, C.I.; Chen, V.W.; Clarke, C.A.; Ries, L.A.; Cronin, K.A. US incidence of breast cancer subtypes defined by joint hormone receptor and HER2 status. J. Natl. Cancer Inst. 2014, 106, dju055. [Google Scholar] [CrossRef] [Green Version]
- Phipps, A.I.; Ichikawa, L.; Bowles, E.J.; Carney, P.A.; Kerlikowske, K.; Miglioretti, D.L.; Buist, D.S. Defining menopausal status in epidemiologic studies: A comparison of multiple approaches and their effects on breast cancer rates. Maturitas 2010, 67, 60–66. [Google Scholar] [CrossRef] [Green Version]
- Fisher, B.; Costantino, J.P.; Wickerham, D.L.; Redmond, C.K.; Kavanah, M.; Cronin, W.M.; Vogel, V.; Robidoux, A.; Dimitrov, N.; Atkins, J.; et al. Tamoxifen for prevention of breast cancer: Report of the National Surgical Adjuvant Breast and Bowel Project P-1 Study. J. Natl. Cancer Inst. 1998, 90, 1371–1388. [Google Scholar] [CrossRef]
- Vogel, V.G.; Costantino, J.P.; Wickerham, D.L.; Cronin, W.M.; Cecchini, R.S.; Atkins, J.N.; Bevers, T.B.; Fehrenbacher, L.; Pajon, E.R., Jr.; Wade, J.L., 3rd; et al. Effects of tamoxifen vs raloxifene on the risk of developing invasive breast cancer and other disease outcomes: The NSABP Study of Tamoxifen and Raloxifene (STAR) P-2 trial. JAMA 2006, 295, 2727–2741. [Google Scholar] [CrossRef] [PubMed] [Green Version]
- Robin, X.; Turck, N.; Hainard, A.; Tiberti, N.; Lisacek, F.; Sanchez, J.C.; Müller, M. pROC: An open-source package for R and S+ to analyze and compare ROC curves. BMC Bioinform. 2011, 12, 77. [Google Scholar] [CrossRef]
- Amir, E.; Evans, D.G.; Shenton, A.; Lalloo, F.; Moran, A.; Boggis, C.; Wilson, M.; Howell, A. Evaluation of breast cancer risk assessment packages in the family history evaluation and screening programme. J. Med. Genet. 2003, 40, 807–814. [Google Scholar] [CrossRef] [PubMed] [Green Version]
- Anothaisintawee, T.; Teerawattananon, Y.; Wiratkapun, C.; Kasamesup, V.; Thakkinstian, A. Risk prediction models of breast cancer: A systematic review of model performances. Breast Cancer Res. Treat. 2012, 133, 1–10. [Google Scholar] [CrossRef] [PubMed]
- Brentnall, A.R.; Cuzick, J.; Buist, D.S.M.; Bowles, E.J.A. Long-term Accuracy of Breast Cancer Risk Assessment Combining Classic Risk Factors and Breast Density. JAMA Oncol. 2018, 4, e180174. [Google Scholar] [CrossRef] [PubMed]
- Brentnall, A.R.; Harkness, E.F.; Astley, S.M.; Donnelly, L.S.; Stavrinos, P.; Sampson, S.; Fox, L.; Sergeant, J.C.; Harvie, M.N.; Wilson, M.; et al. Mammographic density adds accuracy to both the Tyrer-Cuzick and Gail breast cancer risk models in a prospective UK screening cohort. Breast Cancer Res. 2015, 17, 147. [Google Scholar] [CrossRef] [Green Version]
- Chlebowski, R.T.; Anderson, G.L.; Lane, D.S.; Aragaki, A.K.; Rohan, T.; Yasmeen, S.; Sarto, G.; Rosenberg, C.A.; Hubbell, F.A.; Women’s Health Initiative, I. Predicting risk of breast cancer in postmenopausal women by hormone receptor status. J. Natl. Cancer Inst. 2007, 99, 1695–1705. [Google Scholar] [CrossRef] [PubMed] [Green Version]
- Dite, G.S.; MacInnis, R.J.; Bickerstaffe, A.; Dowty, J.G.; Allman, R.; Apicella, C.; Milne, R.L.; Tsimiklis, H.; Phillips, K.A.; Giles, G.G.; et al. Breast Cancer Risk Prediction Using Clinical Models and 77 Independent Risk-Associated SNPs for Women Aged Under 50 Years: Australian Breast Cancer Family Registry. Cancer Epidemiol. Biomark. Prev. 2016, 25, 359–365. [Google Scholar] [CrossRef] [Green Version]
- Louro, J.; Posso, M.; Hilton Boon, M.; Roman, M.; Domingo, L.; Castells, X.; Sala, M. A systematic review and quality assessment of individualised breast cancer risk prediction models. Br. J. Cancer 2019, 121, 76–85. [Google Scholar] [CrossRef] [Green Version]
- McTiernan, A.; Kuniyuki, A.; Yasui, Y.; Bowen, D.; Burke, W.; Culver, J.B.; Anderson, R.; Durfy, S. Comparisons of two breast cancer risk estimates in women with a family history of breast cancer. Cancer Epidemiol. Biomark. Prev. 2001, 10, 333–338. [Google Scholar]
- Quante, A.S.; Whittemore, A.S.; Shriver, T.; Strauch, K.; Terry, M.B. Breast cancer risk assessment across the risk continuum: Genetic and nongenetic risk factors contributing to differential model performance. Breast Cancer Res. 2012, 14, R144. [Google Scholar] [CrossRef] [PubMed] [Green Version]
- Rockhill, B.; Spiegelman, D.; Byrne, C.; Hunter, D.J.; Colditz, G.A. Validation of the Gail et al. model of breast cancer risk prediction and implications for chemoprevention. J. Natl. Cancer Inst. 2001, 93, 358–366. [Google Scholar] [CrossRef]
- Terry, M.B.; Liao, Y.; Whittemore, A.S.; Leoce, N.; Buchsbaum, R.; Zeinomar, N.; Dite, G.S.; Chung, W.K.; Knight, J.A.; Southey, M.C.; et al. 10-year performance of four models of breast cancer risk: A validation study. Lancet Oncol. 2019. [Google Scholar] [CrossRef]
- Tice, J.A.; Bissell, M.C.S.; Miglioretti, D.L.; Gard, C.C.; Rauscher, G.H.; Dabbous, F.M.; Kerlikowske, K. Validation of the breast cancer surveillance consortium model of breast cancer risk. Breast Cancer Res. Treat. 2019, 175, 519–523. [Google Scholar] [CrossRef]
- Wang, X.; Huang, Y.; Li, L.; Dai, H.; Song, F.; Chen, K. Assessment of performance of the Gail model for predicting breast cancer risk: A systematic review and meta-analysis with trial sequential analysis. Breast Cancer Res. 2018, 20, 18. [Google Scholar] [CrossRef]
- Zardavas, D.; Te Marvelde, L.; Milne, R.L.; Fumagalli, D.; Fountzilas, G.; Kotoula, V.; Razis, E.; Papaxoinis, G.; Joensuu, H.; Moynahan, M.E.; et al. Tumor PIK3CA Genotype and Prognosis in Early-Stage Breast Cancer: A Pooled Analysis of Individual Patient Data. J. Clin. Oncol. 2018, 36, 981–990. [Google Scholar] [CrossRef] [PubMed] [Green Version]
- Adams-Campbell, L.L.; Makambi, K.H.; Palmer, J.R.; Rosenberg, L. Diagnostic accuracy of the Gail model in the Black Women’s Health Study. Breast J. 2007, 13, 332–336. [Google Scholar] [CrossRef]
- Sprague, B.L.; Conant, E.F.; Onega, T.; Garcia, M.P.; Beaber, E.F.; Herschorn, S.D.; Lehman, C.D.; Tosteson, A.N.; Lacson, R.; Schnall, M.D.; et al. Variation in Mammographic Breast Density Assessments Among Radiologists in Clinical Practice: A Multicenter Observational Study. Ann. Intern. Med. 2016, 165, 457–464. [Google Scholar] [CrossRef] [PubMed] [Green Version]
- Engmann, N.J.; Scott, C.G.; Jensen, M.R.; Winham, S.; Miglioretti, D.L.; Ma, L.; Brandt, K.; Mahmoudzadeh, A.; Whaley, D.H.; Hruska, C.; et al. Combined effect of volumetric breast density and body mass index on breast cancer risk. Breast Cancer Res. Treat. 2019, 177, 165–173. [Google Scholar] [CrossRef] [PubMed]
- Kerlikowske, K.; Walker, R.; Miglioretti, D.L.; Desai, A.; Ballard-Barbash, R.; Buist, D.S. Obesity, mammography use and accuracy, and advanced breast cancer risk. J. Natl. Cancer Inst. 2008, 100, 1724–1733. [Google Scholar] [CrossRef] [Green Version]
- McCarthy, A.M.; Ehsan, S.; Appel, S.; Welch, M.; He, W.; Bahl, M.; Chen, J.; Lehman, C.D.; Armstrong, K. Risk factors for an advanced breast cancer diagnosis within 2 years of a negative mammogram. Cancer 2021, 127, 3334–3342. [Google Scholar] [CrossRef] [PubMed]
- Hurson, A.N.; Pal Choudhury, P.; Gao, C.; Husing, A.; Eriksson, M.; Shi, M.; Jones, M.E.; Evans, D.G.R.; Milne, R.L.; Gaudet, M.M.; et al. Prospective evaluation of a breast-cancer risk model integrating classical risk factors and polygenic risk in 15 cohorts from six countries. Int. J. Epidemiol. 2021. [Google Scholar] [CrossRef] [PubMed]
| Risk Factors | MGH | NWH | UPenn |
|---|---|---|---|
| N = 58,706 | N = 39,189 | N = 24,661 | |
| N (%) | |||
| Age, mean +/− SD | 52.57 +/− 9.55 | 51.37 +/− 8.82 | 55.6 +/− 9.29 |
| Age | |||
| 40–44 years | 15,723 (26.78) | 10,796 (27.55) | 3966 (16.08) |
| 45–49 years | 9811 (16.71) | 8380 (21.38) | 3851 (15.62) |
| 50–54 years | 9246 (15.75) | 6976 (17.80) | 4154 (16.84) |
| 55–59 years | 8862 (15.10) | 5245 (13.38) | 4226 (17.14) |
| 60–64 years | 7047 (12.00) | 3845 (9.81) | 3787 (15.36) |
| 65–69 years | 4724 (8.05) | 2400 (6.12) | 2857 (11.59) |
| 70–74 years | 3293 (5.61) | 1547 (3.95) | 1820 (7.38) |
| Race/Ethnicity | |||
| White | 48,072 (81.89) | 35,394 (90.32) | 11,312 (45.87) |
| Black or African American | 3266 (5.56) | 630 (1.61) | 11,279 (45.74) |
| Hispanic | 3177 (5.41) | 392 (1.00) | 560 (2.27) |
| Asian | 3027 (5.16) | 1545 (3.94) | 920 (3.73) |
| Other/Unknown | 1164 (1.98) | 1228 (3.13) | 590 (2.39) |
| Age at menarche | |||
| 7 to 11 years | 10,216 (17.40) | 5895 (15.04) | 4653 (18.87) |
| 12 to 13 years | 29,764 (50.70) | 22,502 (57.42) | 13,190 (53.49) |
| ≤14 years | 15,529 (26.45) | 10,643 (27.16) | 4445 (18.02) |
| Missing | 3197 (5.45) | 149 (0.38) | 2373 (9.62) |
| Age at first birth | |||
| Nulliparous | 15,673 (26.70) | 7297 (18.62) | 5794 (23.49) |
| <20 years | 5721 (9.75) | 1671 (4.26) | 4731 (19.18) |
| 20–24 years | 11,652 (19.85) | 5979 (15.26) | 5001 (20.28) |
| 25–29 years | 11,349 (19.33) | 9923 (25.32) | 4671 (18.94) |
| ≤30 | 12,217 (20.81) | 14,124 (36.04) | 3895 (15.79) |
| Missing | 2094 (3.57) | 195 (0.50) | 569 (2.31) |
| Breast density | |||
| Almost entirely fat | 4342 (7.40) | 755 (1.93) | 2359 (9.57) |
| Scattered fibroglandular tissue | 23,145 (39.43) | 9608 (24.52) | 12,216 (49.54) |
| Heterogeneously dense | 27,112 (46.18) | 22,898 (58.43) | 9162 (37.15) |
| Extremely dense | 4107 (7.0) | 5928 (15.13) | 924 (3.75) |
| Menopausal | |||
| Pre-or peri-menopausal | 24,645 (41.98) | 19,235 (49.08) | 11,971 (48.54) |
| Post-menopausal | 34061 (58.02) | 19,954 (50.92) | 12,690 (51.46) |
| BMI, mean (SD) | 27.21 (6.39) | 26.2 (5.80) | 29.46 (7.40) |
| Prior Breast Biopsy | |||
| None | 57,807 (98.47) | 32,788 (83.67) | 19,764 (80.14) |
| One | 541 (0.92) | 4656 (11.88) | 4259 (17.27) |
| Two or more | 358 (0.61) | 1745 (4.45) | 638 (2.59) |
| Prior atypical hyperplasia/benign breast findings 1 | 849 (1.45) | 204 (0.52) | 91 (0.37) |
| No. of first-degree relatives with breast cancer (%) | |||
| None | 51,037 (86.94) | 32,666 (83.36) | 20,756 (84.17) |
| One | 7093 (12.08) | 5865 (14.97) | 3500 (14.19) |
| Two or more | 576 (0.98) | 658 (1.68) | 405 (1.64) |
| No. of second-degree relatives with breast cancer (%) | |||
| None | 51,285 (87.36) | 28,052 (71.58) | 21,893 (88.78) |
| One | 5818 (9.91) | 7764 (19.81) | 2169 (8.80) |
| Two or more | 1603 (2.73) | 3373 (8.61) | 599 (2.43) |
| No. of first or second degree relatives with ovarian cancer (%) | |||
| None | 58,646 (99.90) | 39,152 (99.91) | 23,644 (95.88) |
| One | 58 (0.10) | 7 (0.02) | 919 (3.73) |
| Two or more | 2 (0.00) | 30 (0.08) | 98 (0.40) |
| 5-year invasive cancer subtype, N (%) | |||
| ER/PR+HER2− | 619 (57.31) | 379 (56.48) | 318 (55.99) |
| ER/PR+HER2+ | 77 (7.13) | 55 (8.20%) | 30 (5.28) |
| ERPR−HER2+ | 29 (2.69) | 15 (2.24) | 18 (3.17) |
| ERPR−HER2− | 58 (5.37) | 36 (5.37) | 38 (6.69) |
| Invasive cancer, missing subtype | 21 (1.94) | 27 (4.02) | 14 (2.46) |
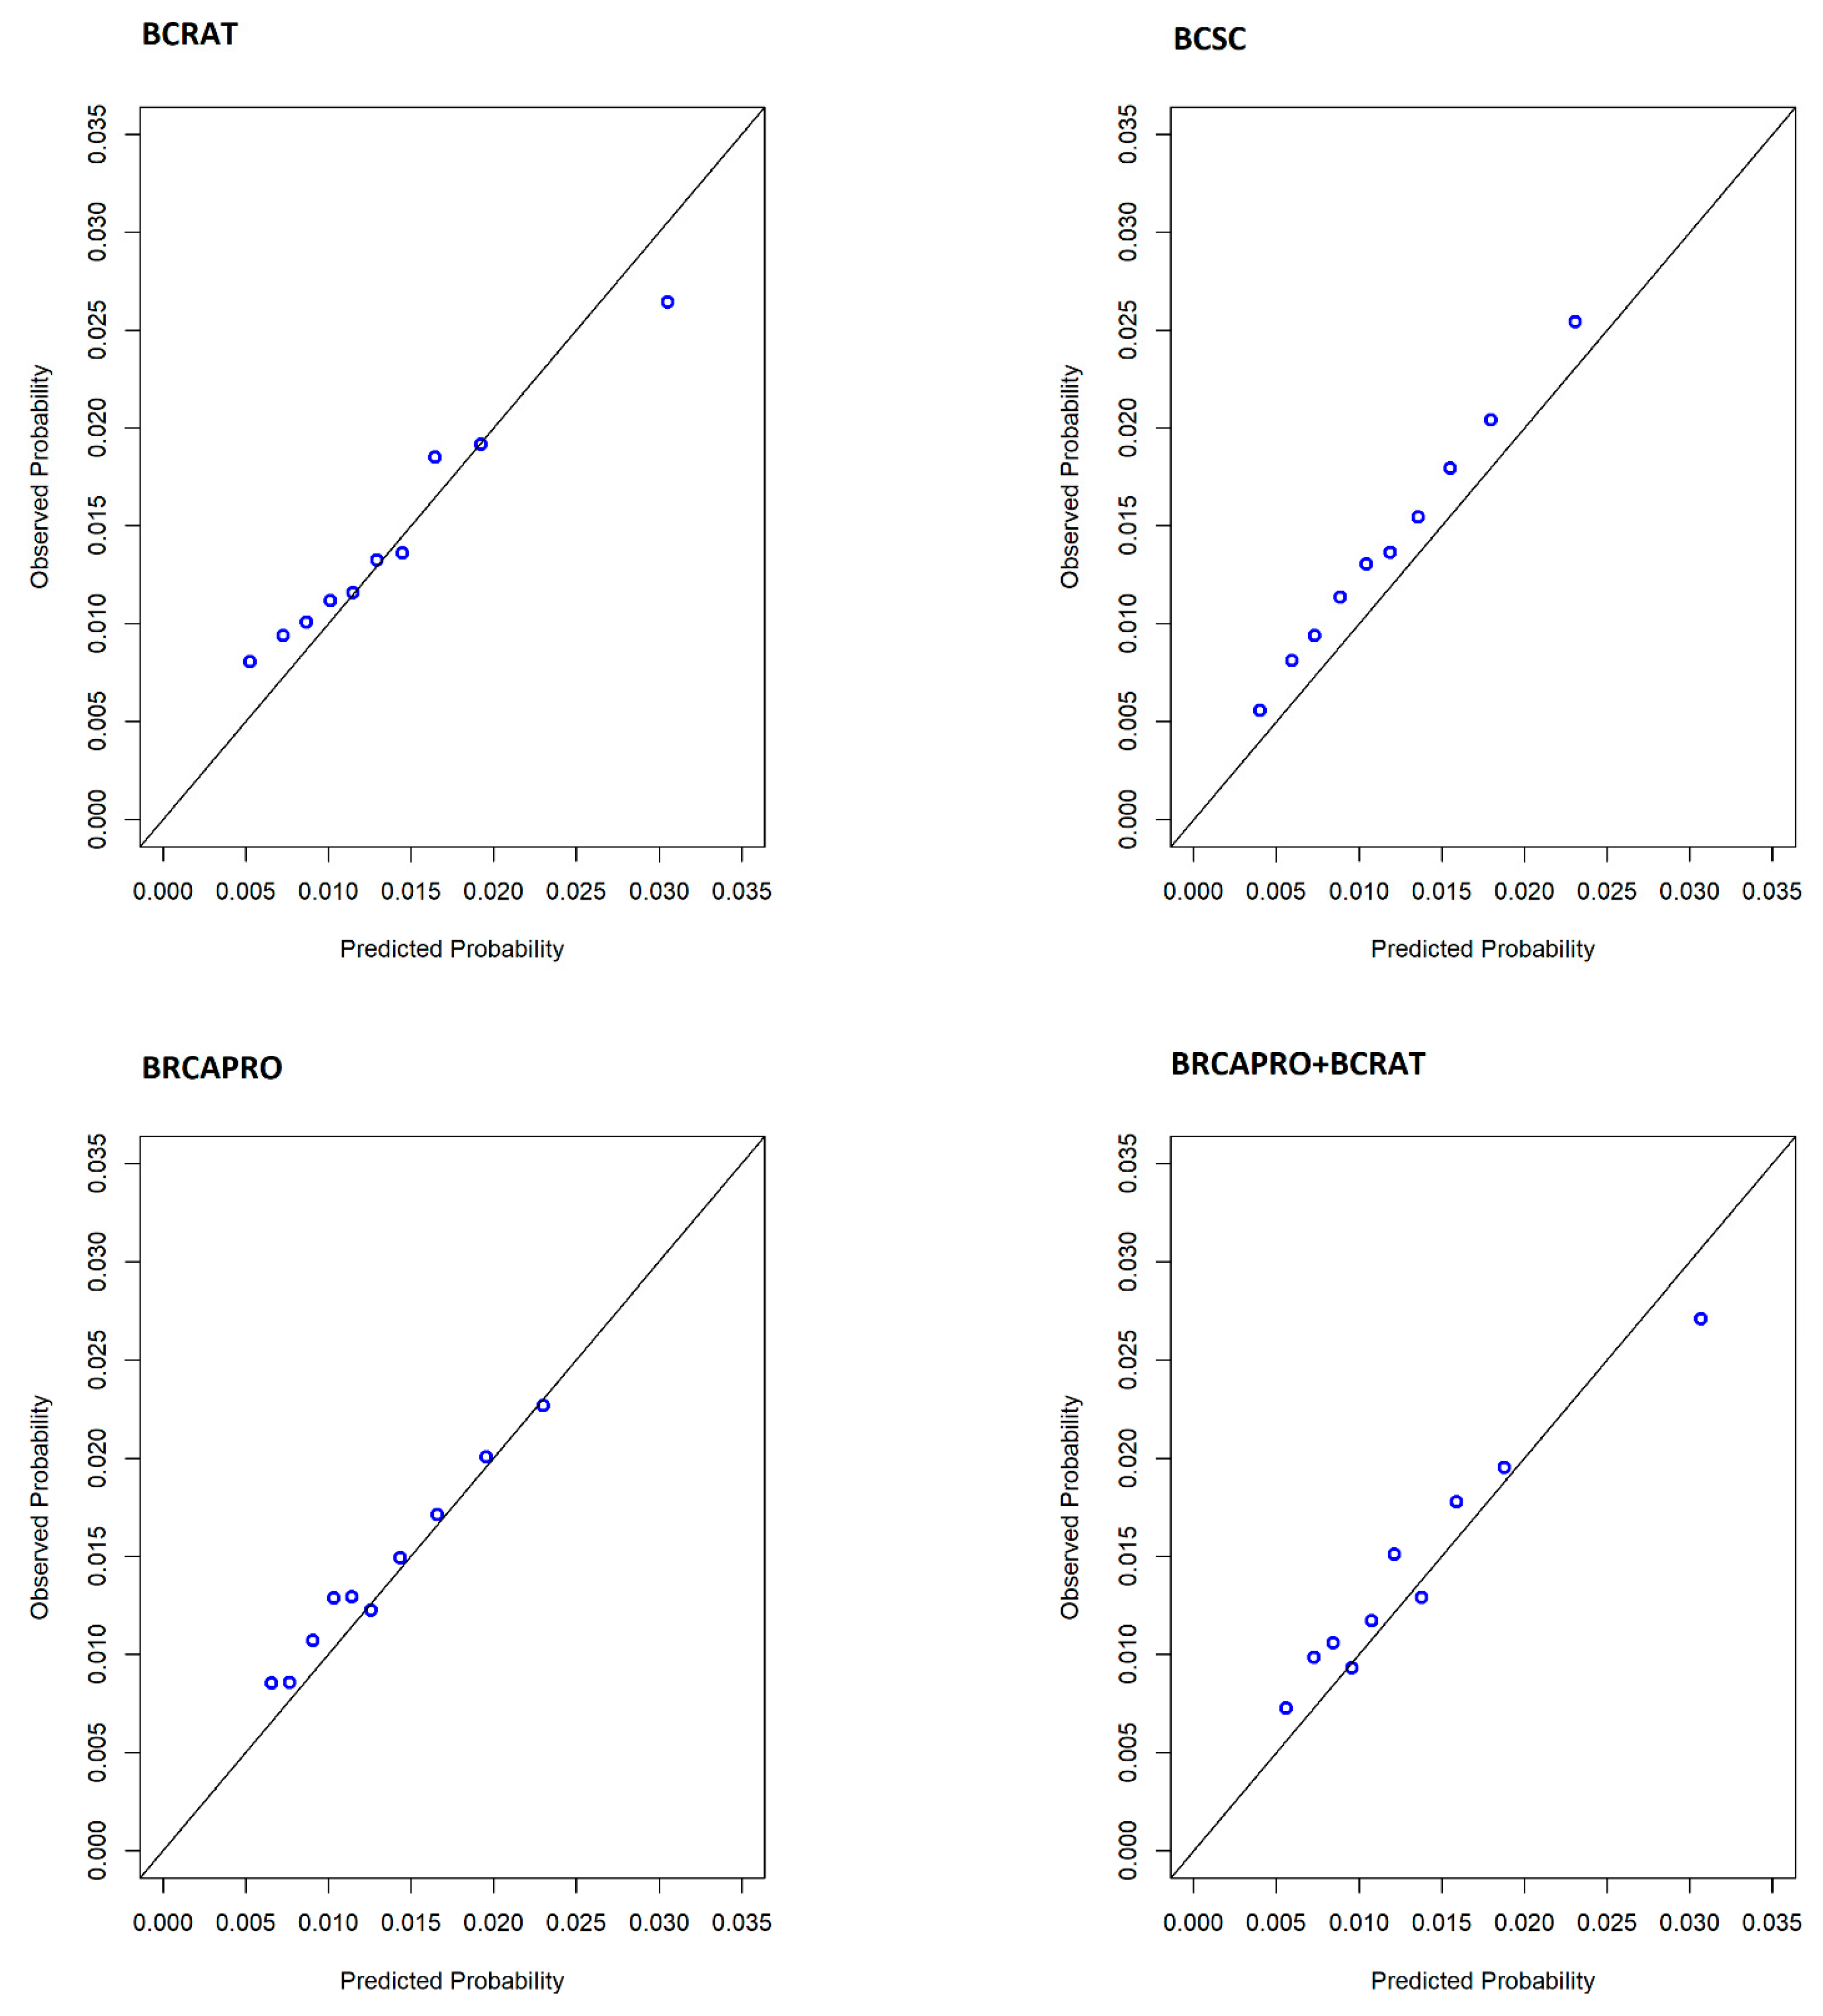
| Performance Metric | All Sites (N = 1734 Cases & 120,822 Non-Cases) | |||||||
|---|---|---|---|---|---|---|---|---|
| BCRAT | BCSC | BRCAPRO | BRCAPRO+BCRAT | |||||
| Estimate | 95% CI | Estimate | 95% CI | Estimate | 95% CI | Estimate | 95% CI | |
| O/E | 1.036 | 0.989, 1.084 | 1.185 | 1.130, 1.239 | 1.076 | 1.027, 1.125 | 1.063 | 1.014, 1.112 |
| AUC 1 | 0.604 | 0.590, 0.618 | 0.617 | 0.603, 0.630 | 0.590 | 0.578, 0.603 | 0.608 | 0.594, 0.621 |
| TPR | 0.378 | 0.354, 0.402 | 0.307 | 0.284, 0.328 | 0.358 | 0.338, 0.378 | 0.347 | 0.324, 0.368 |
| FPR | 0.238 | 0.235, 0.240 | 0.184 | 0.181, 0.186 | 0.243 | 0.241, 0.245 | 0.217 | 0.215, 0.219 |
| Patients with high 5-year risk, N (%) | 29,396 (23.99) | - | 22,751 (18.56) | - | 30,016 (24.49) | - | 26,830 (21.89) | - |
| Performance Metric by Race/Ethnicity | BCRAT | BCSC | BRCAPRO | BRCAPRO+BCRAT | ||||
|---|---|---|---|---|---|---|---|---|
| White (N = 1411 cases) | Estimate | 95% CI | Estimate | 95% CI | Estimate | 95% CI | Estimate | 95% CI |
| O/E | 1.031 | 0.98, 1.082 | 1.183 | 1.124, 1.242 | 1.100 | 1.045, 1.154 | 1.063 | 1.012, 1.116 |
| AUC | 0.601 | 0.588, 0.613 | 0.607 | 0.595, 0.621 | 0.581 | 0.567, 0.596 | 0.604 | 0.59, 0.616 |
| TPR | 0.410 | 0.387, 0.432 | 0.337 | 0.311, 0.361 | 0.378 | 0.352, 0.404 | 0.377 | 0.351, 0.402 |
| FPR | 0.270 | 0.267, 0.273 | 0.215 | 0.212, 0.217 | 0.269 | 0.266, 0.272 | 0.244 | 0.241, 0.246 |
| Patients with high 5-year risk, N (%) | 25,777 (27.2) | - | 20,503 (21.63) | - | 25,628 (27.04) | - | 23,275 (24.56) | - |
| Black or African American (N = 209 cases) | ||||||||
| O/E | 1.100 | 0.964, 1.24 | 1.316 | 1.155, 1.483 | 1.054 | 0.924, 1.186 | 1.141 | 1.000, 1.287 |
| AUC | 0.614 | 0.581, 0.647 | 0.644 | 0.606, 0.675 | 0.610 | 0.577, 0.646 | 0.617 | 0.585, 0.653 |
| TPR | 0.321 | 0.267, 0.382 | 0.225 | 0.171, 0.282 | 0.378 | 0.319, 0.445 | 0.287 | 0.234, 0.350 |
| FPR | 0.175 | 0.169, 0.181 | 0.103 | 0.098, 0.107 | 0.244 | 0.237, 0.251 | 0.169 | 0.164, 0.175 |
| Patients with high 5-year risk, N (%) | 2689 (17.72) | - | 1584 (10.44) | - | 3738 (24.63) | - | 2588 (17.05) | - |
| Hispanic (N = 32 cases) | ||||||||
| O/E | 0.748 | 0.492, 0.983 | 1.028 | 0.68, 1.354 | 0.840 | 0.552, 1.106 | 0.934 | 0.614, 1.223 |
| AUC | 0.583 | 0.489, 0.699 | 0.582 | 0.491, 0.671 | 0.570 | 0.495, 0.645 | 0.567 | 0.467, 0.668 |
| TPR | 0.063 | 0.000, 0.172 | 0.000 | 0.000, 0.000 | 0.000 | 0.000, 0.000 | 0.000 | 0.000, 0.000 |
| FPR | 0.051 | 0.044, 0.057 | 0.020 | 0.016, 0.024 | 0.006 | 0.004, 0.008 | 0.024 | 0.02, 0.029 |
| Patients with high 5-year risk, N (%) | 209 (5.06) | - | 81 (1.96) | - | 24 (0.58) | - | 100 (2.42) | - |
| Asian (N = 54 cases) | ||||||||
| O/E | 1.588 | 1.172, 1.999 | 1.157 | 0.860, 1.458 | 0.962 | 0.714, 1.212 | 1.054 | 0.781, 1.327 |
| AUC | 0.557 | 0.476, 0.641 | 0.621 | 0.555, 0.705 | 0.617 | 0.542, 0.703 | 0.588 | 0.506, 0.656 |
| TPR | 0.000 | 0.000, 0.000 | 0.037 | 0.000, 0.093 | 0.000 | 0.000, 0.000 | 0.037 | 0.000, 0.093 |
| FPR | 0.021 | 0.018, 0.025 | 0.017 | 0.014, 0.021 | 0.004 | 0.003, 0.006 | 0.068 | 0.062, 0.075 |
| Patients with high 5-year risk, N (%) | 116 (2.11) | - | 96 (1.75) | - | 23 (0.42) | - | 373 (6.79) | - |
| Performance Metric by Subtype | BCRAT 1 | BCSC 2 | BRCAPRO 3 | BRCAPRO+BCRAT 4 | ||||
|---|---|---|---|---|---|---|---|---|
| ER/PR+HER2− (N = 1316 cases) | Estimate | 95% CI | Estimate | 95% CI | Estimate | 95% CI | Estimate | 95% CI |
| AUC | 0.616 | 0.603, 0.631 | 0.629 | 0.615, 0.645 | 0.605 | 0.590, 0.621 | 0.621 | 0.606, 0.636 |
| TPR | 0.390 | 0.363, 0.417 | 0.313 | 0.290, 0.337 | 0.384 | 0.360, 0.410 | 0.358 | 0.331, 0.384 |
| FPR | 0.238 | 0.236, 0.240 | 0.184 | 0.182, 0.186 | 0.243 | 0.241, 0.245 | 0.217 | 0.215, 0.219 |
| Patients with high 5-year risk, N (%) | 29,253 (23.95) | - | 22,630 (18.53) | - | 29,902 (24.48) | - | 26,699 (21.86) | - |
| All HER2+ (N = 224 cases) | ||||||||
| AUC | 0.560 | 0.525, 0.600 | 0.567 | 0.535, 0.610 | 0.513 | 0.479, 0.553 | 0.561 | 0.526, 0.599 |
| TPR | 0.330 | 0.270, 0.390 | 0.281 | 0.236, 0.338 | 0.246 | 0.200, 0.307 | 0.299 | 0.248, 0.353 |
| FPR | 0.238 | 0.235, 0.240 | 0.184 | 0.182, 0.186 | 0.243 | 0.241, 0.246 | 0.217 | 0.215, 0.219 |
| Patients with high 5-year risk, N (%) | 28,794 (23.80) | - | 22,266 (18.40) | - | 29,438 (24.33) | - | 26,278 (21.72) | - |
| ER/PR/HER2− (N = 132 cases) | ||||||||
| AUC | 0.570 | 0.516, 0.617 | 0.585 | 0.546, 0.630 | 0.564 | 0.522, 0.604 | 0.569 | 0.513, 0.621 |
| TPR | 0.348 | 0.252, 0.430 | 0.295 | 0.215, 0.375 | 0.295 | 0.216, 0.369 | 0.303 | 0.220, 0.380 |
| FPR | 0.238 | 0.236, 0.240 | 0.184 | 0.182, 0.186 | 0.243 | 0.241, 0.246 | 0.217 | 0.215, 0.219 |
| Patients with high 5-year risk, N (%) | 28,786 (23.80) | - | 22,257 (18.40) | - | 29,435 (24.34) | - | 26,268 (21.72) | - |
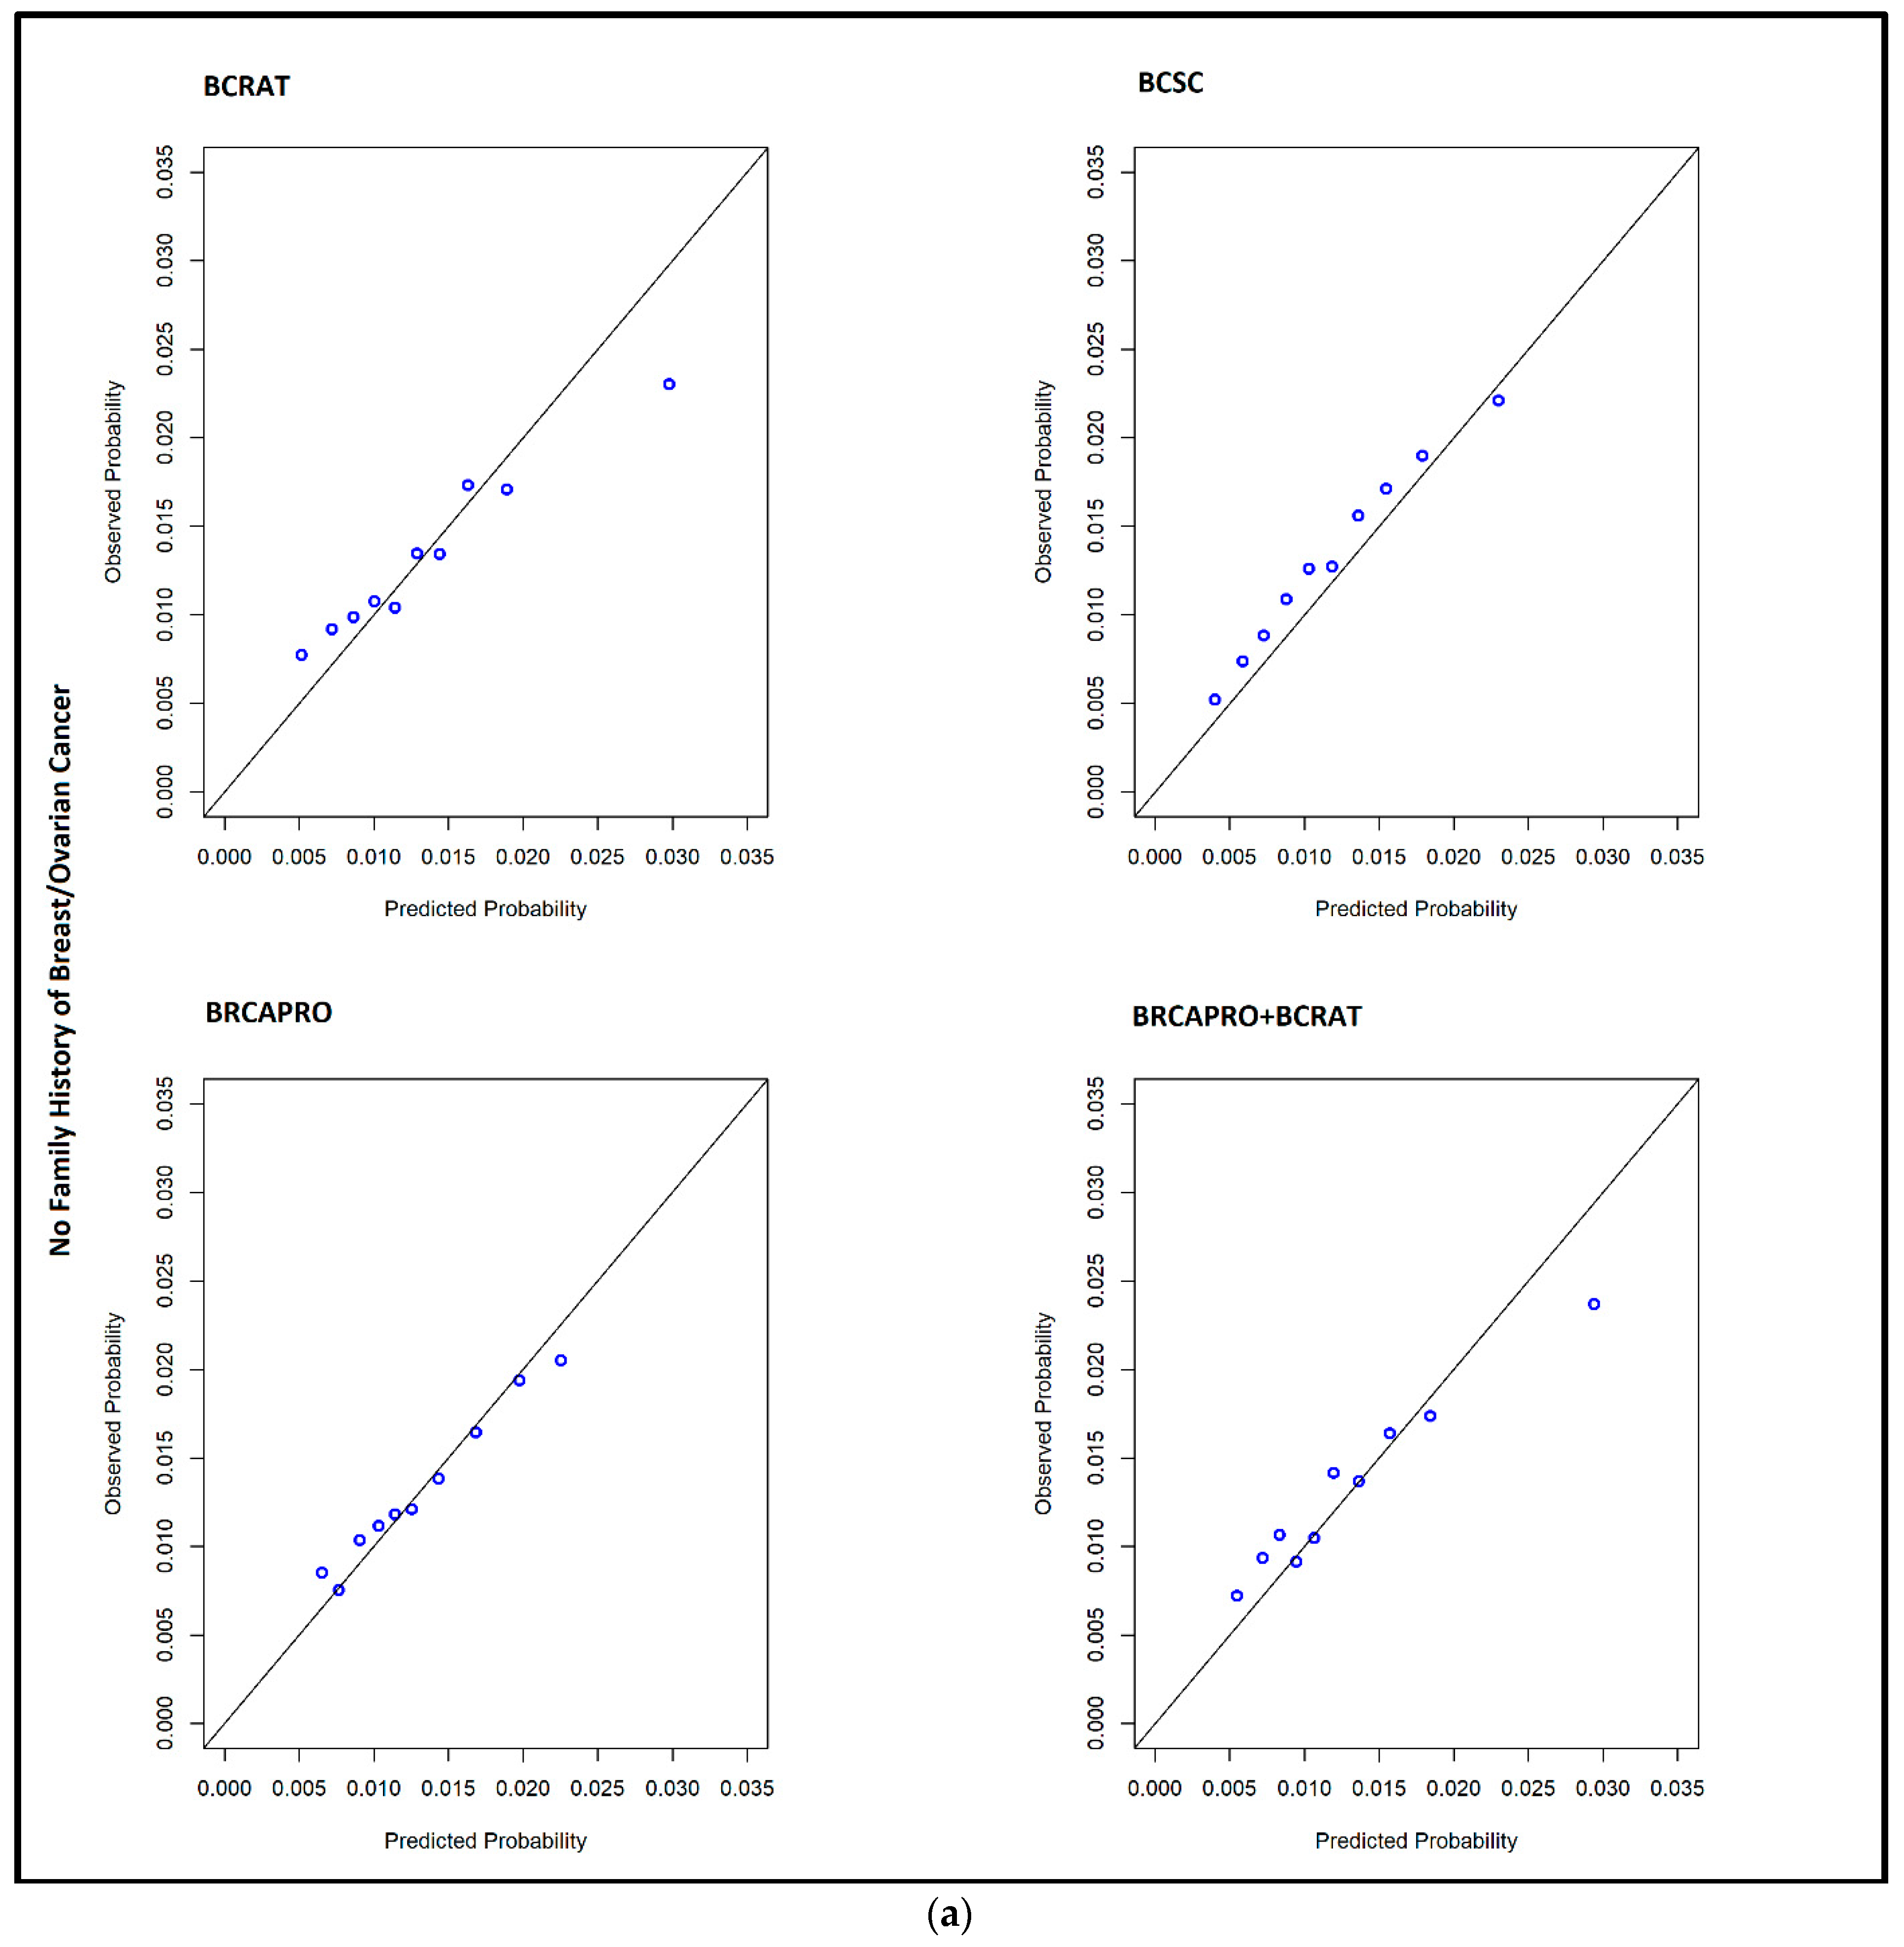
| Family History 1 | No Family History of Breast Cancer (N = 1340 Cases) | |||||||
|---|---|---|---|---|---|---|---|---|
| BCRAT | BCSC | BRCAPRO | BRCAPRO+BCRAT | |||||
| Estimate | 95% CI | Estimate | 95% CI | Estimate | 95% CI | Estimate | 95% CI | |
| O/E | 0.982 | 0.934, 1.045 | 1.115 | 1.061, 1.186 | 1.007 | 0.959, 1.07 | 1.016 | 0.966, 1.081 |
| AUC | 0.594 | 0.582, 0.61 | 0.612 | 0.601, 0.625 | 0.588 | 0.575, 0.601 | 0.597 | 0.584, 0.613 |
| TPR | 0.352 | 0.328, 0.377 | 0.284 | 0.262, 0.311 | 0.361 | 0.339, 0.385 | 0.316 | 0.293, 0.342 |
| FPR | 0.231 | 0.229, 0.235 | 0.179 | 0.177, 0.181 | 0.248 | 0.245, 0.251 | 0.208 | 0.205, 0.211 |
| High 5-year risk, N (%) | 23,590 (23.3) | - | 18,253 (18.03) | - | 25,270 (24.96) | - | 21,173 (20.92) | - |
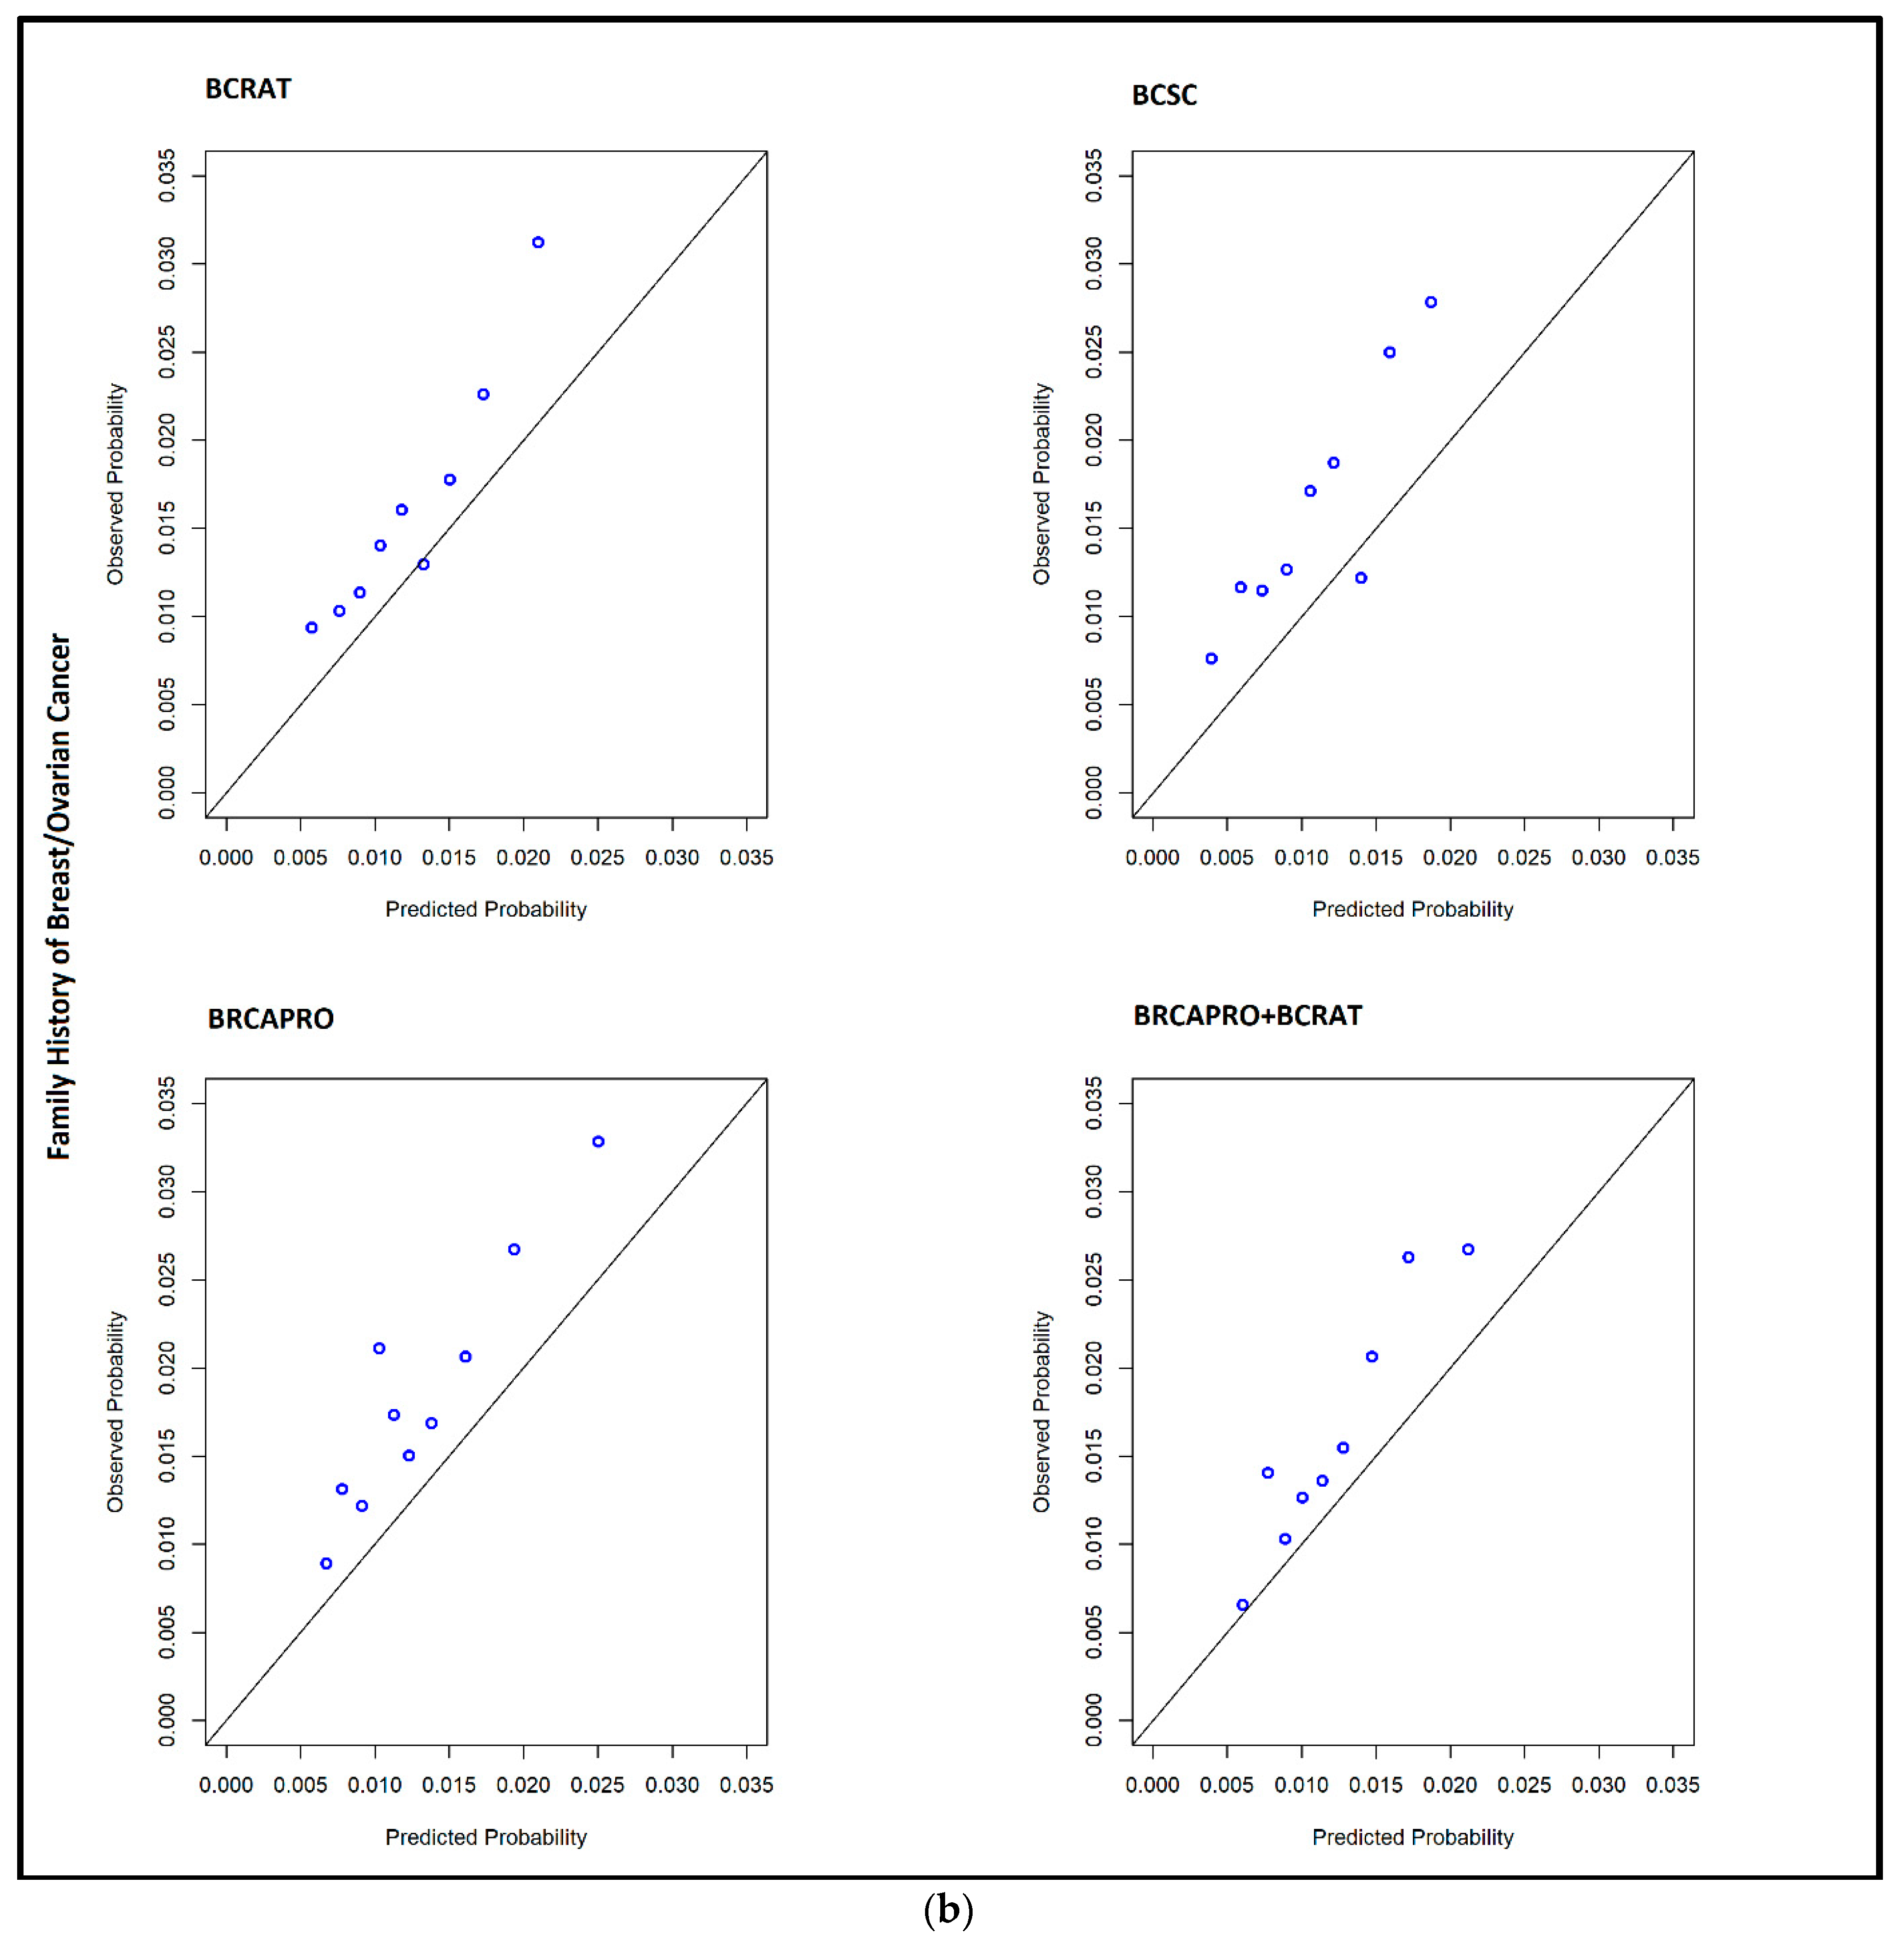
| Family History of Breast Cancer (N = 394 cases) | ||||||||
| O/E | 1.273 | 1.161, 1.42 | 1.509 | 1.38, 1.686 | 1.402 | 1.283, 1.569 | 1.263 | 1.153, 1.408 |
| AUC | 0.633 | 0.607, 0.659 | 0.631 | 0.603, 0.657 | 0.597 | 0.571, 0.625 | 0.636 | 0.611, 0.666 |
| TPR | 0.467 | 0.42, 0.519 | 0.386 | 0.337, 0.428 | 0.345 | 0.295, 0.392 | 0.454 | 0.405, 0.501 |
| FPR | 0.269 | 0.262, 0.275 | 0.208 | 0.202, 0.213 | 0.220 | 0.213, 0.227 | 0.262 | 0.256, 0.268 |
| High 5-year risk, N (%) | 5806 (27.22) | - | 4498 (21.09) | - | 4746 (22.25) | - | 5657 (26.53) | - |
| Age 2 | <50 (N = 567 cases) | |||||||
| O/E | 1.150 | 1.067, 1.251 | 1.386 | 1.287, 1.508 | 1.219 | 1.134, 1.325 | 1.144 | 1.062, 1.244 |
| AUC | 0.590 | 0.568, 0.616 | 0.617 | 0.593, 0.642 | 0.566 | 0.544, 0.594 | 0.592 | 0.569, 0.62 |
| TPR | 0.136 | 0.11, 0.161 | 0.067 | 0.048, 0.088 | 0.019 | 0.009, 0.03 | 0.129 | 0.102, 0.153 |
| FPR | 0.055 | 0.053, 0.057 | 0.023 | 0.021, 0.024 | 0.009 | 0.008, 0.01 | 0.052 | 0.051, 0.054 |
| High 5-year risk, N (%) | 2947 (5.61) | - | 1216 (2.31) | - | 463 (0.88) | - | 2788 (5.31) | - |
| ≥50 (N = 1167 cases) | ||||||||
| O/E | 0.989 | 0.929, 1.034 | 1.107 | 1.041, 1.16 | 1.018 | 0.958, 1.064 | 1.028 | 0.966, 1.075 |
| AUC | 0.582 | 0.564, 0.598 | 0.595 | 0.579, 0.608 | 0.571 | 0.555, 0.586 | 0.588 | 0.57, 0.603 |
| TPR | 0.496 | 0.467, 0.524 | 0.424 | 0.396, 0.449 | 0.522 | 0.496, 0.549 | 0.453 | 0.424, 0.479 |
| FPR | 0.376 | 0.372, 0.379 | 0.306 | 0.302, 0.309 | 0.420 | 0.417, 0.424 | 0.341 | 0.338, 0.345 |
| High 5-year risk, N (%) | 26,449 (37.77) | - | 21,535 (30.75) | - | 29,553 (42.20) | - | 24,042 (34.33) | - |
| Body Mass Index 3 | BMI < 30 kg/m2 (N = 999 cases) | |||||||
| O/E | 1.080 | 1.019, 1.15 | 1.188 | 1.122, 1.265 | 1.128 | 1.066, 1.2 | 1.102 | 1.040, 1.173 |
| AUC | 0.588 | 0.569, 0.604 | 0.597 | 0.58, 0.612 | 0.568 | 0.552, 0.586 | 0.594 | 0.576, 0.613 |
| TPR | 0.353 | 0.328, 0.382 | 0.305 | 0.277, 0.334 | 0.309 | 0.289, 0.339 | 0.327 | 0.300, 0.358 |
| FPR | 0.236 | 0.233, 0.239 | 0.205 | 0.202, 0.209 | 0.233 | 0.23, 0.237 | 0.217 | 0.213, 0.220 |
| High 5-year risk, N (%) | 16,254 (23.76) | - | 14,157 (20.7) | - | 16,048 (23.46) | - | 14,934 (21.83) | - |
| BMI ≥ 30 kg/m2 (N = 428 cases) | ||||||||
| O/E | 1.164 | 1.054, 1.264 | 1.525 | 1.384, 1.661 | 1.179 | 1.071, 1.285 | 1.206 | 1.091, 1.309 |
| AUC | 0.634 | 0.612, 0.657 | 0.661 | 0.639, 0.683 | 0.617 | 0.592, 0.639 | 0.634 | 0.609, 0.659 |
| TPR | 0.428 | 0.388, 0.468 | 0.250 | 0.215, 0.283 | 0.432 | 0.389, 0.477 | 0.390 | 0.348, 0.435 |
| FPR | 0.231 | 0.226, 0.236 | 0.111 | 0.107, 0.114 | 0.267 | 0.26, 0.273 | 0.212 | 0.208, 0.218 |
| High 5-year risk, N (%) | 6268 (23.42) | - | 3032 (11.33) | - | 7212 (26.94) | - | 5755 (21.5) | - |
| Risk Model | Risk Level | BCSC | BRCAPRO | BRCAPRO+BCRAT | |||
|---|---|---|---|---|---|---|---|
| N (% of Total) | N (% of Total) | N (% of Total) | |||||
| High | Low | High | Low | High | Low | ||
| BCRAT | High | 15,995 (13.05) | 13,401 (10.93) | 17,880 (14.59) | 11,516 (9.4) | 25,826 (21.07) | 3570 (2.91) |
| Low | 6756 (5.51) | 86,404 (70.5) | 12,136 (9.9) | 81,024 (66.11) | 1004 (0.82) | 92,156 (75.2) | |
| BCSC | High | - | - | 14,297 (11.67) | 8454 (6.9) | 15,013 (12.25) | 7738 (6.31) |
| Low | - | - | 15,719 (12.83) | 84,086 (68.61) | 11,817 (9.64) | 87,988 (71.79) | |
| BRCAPRO | High | - | - | - | - | 17,537 (14.31) | 12,479 (10.18) |
| Low | - | - | - | - | 9293 (7.58) | 83,247 (67.93) | |
Publisher’s Note: MDPI stays neutral with regard to jurisdictional claims in published maps and institutional affiliations. |
© 2021 by the authors. Licensee MDPI, Basel, Switzerland. This article is an open access article distributed under the terms and conditions of the Creative Commons Attribution (CC BY) license (https://creativecommons.org/licenses/by/4.0/).
Share and Cite
McCarthy, A.M.; Liu, Y.; Ehsan, S.; Guan, Z.; Liang, J.; Huang, T.; Hughes, K.; Semine, A.; Kontos, D.; Conant, E.; et al. Validation of Breast Cancer Risk Models by Race/Ethnicity, Family History and Molecular Subtypes. Cancers 2022, 14, 45. https://doi.org/10.3390/cancers14010045
McCarthy AM, Liu Y, Ehsan S, Guan Z, Liang J, Huang T, Hughes K, Semine A, Kontos D, Conant E, et al. Validation of Breast Cancer Risk Models by Race/Ethnicity, Family History and Molecular Subtypes. Cancers. 2022; 14(1):45. https://doi.org/10.3390/cancers14010045
Chicago/Turabian StyleMcCarthy, Anne Marie, Yi Liu, Sarah Ehsan, Zoe Guan, Jane Liang, Theodore Huang, Kevin Hughes, Alan Semine, Despina Kontos, Emily Conant, and et al. 2022. "Validation of Breast Cancer Risk Models by Race/Ethnicity, Family History and Molecular Subtypes" Cancers 14, no. 1: 45. https://doi.org/10.3390/cancers14010045
APA StyleMcCarthy, A. M., Liu, Y., Ehsan, S., Guan, Z., Liang, J., Huang, T., Hughes, K., Semine, A., Kontos, D., Conant, E., Lehman, C., Armstrong, K., Braun, D., Parmigiani, G., & Chen, J. (2022). Validation of Breast Cancer Risk Models by Race/Ethnicity, Family History and Molecular Subtypes. Cancers, 14(1), 45. https://doi.org/10.3390/cancers14010045