
Claudin-Low Breast Cancer Inflammatory Signatures Support Polarization of M1-Like Macrophages with Protumoral Activity

 and
and 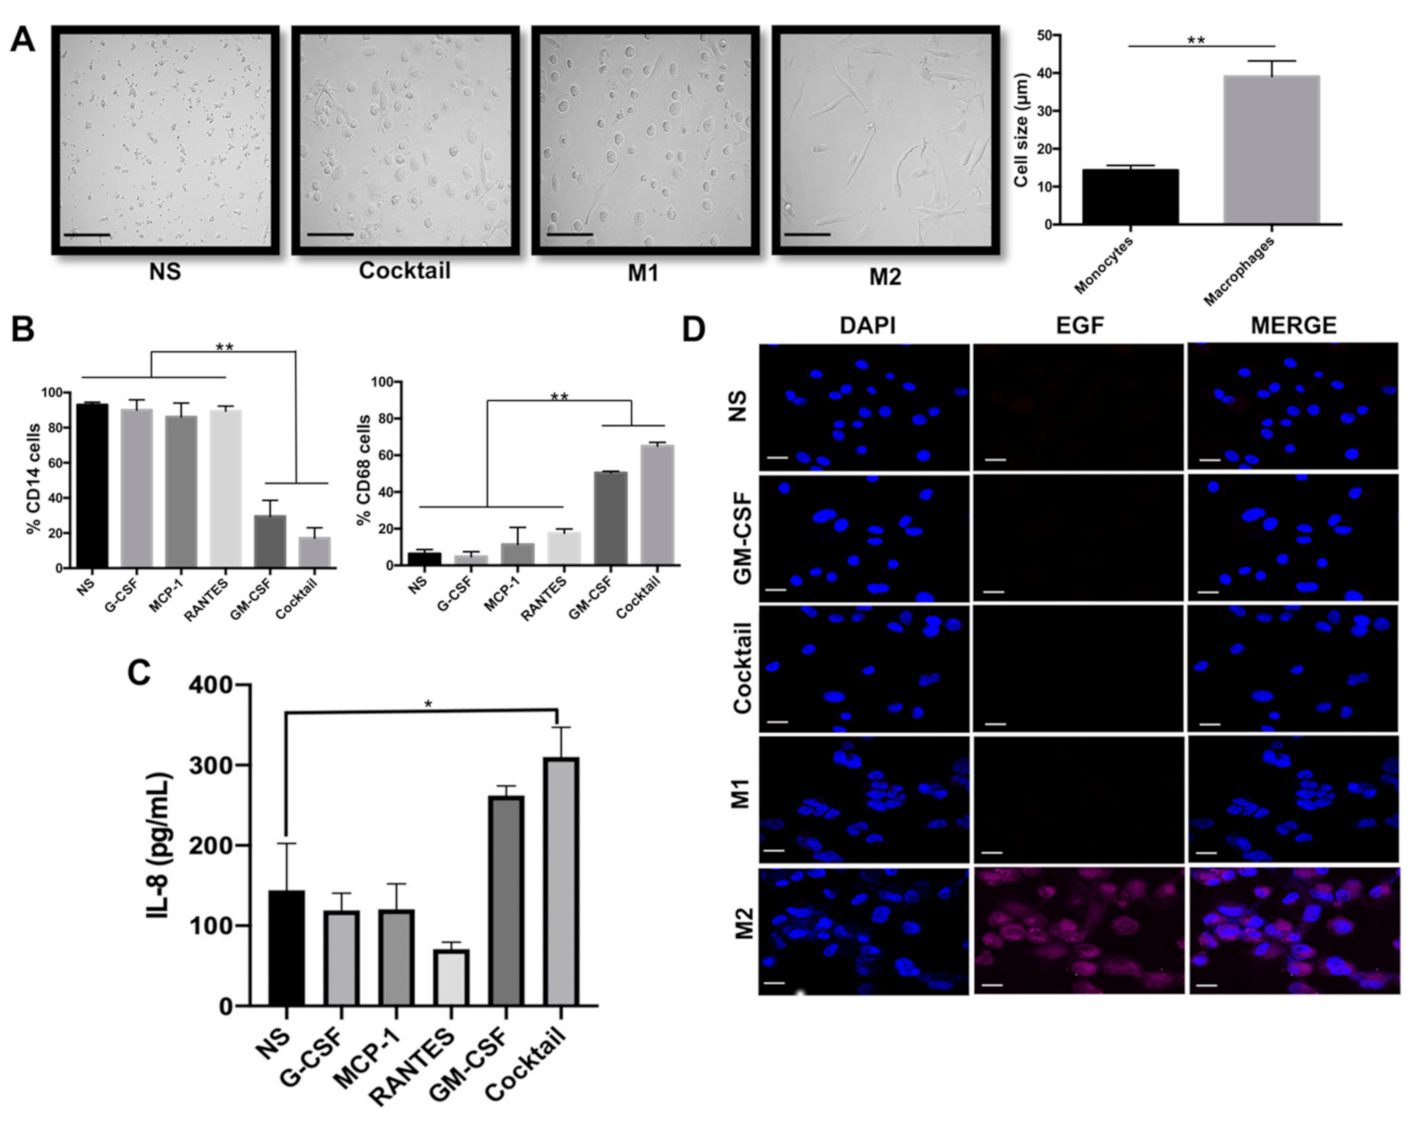
Abstract
:Simple Summary
Abstract
1. Introduction
2. Results
2.1. GM-CSF, G-CSF, MCP1, and RANTES Drive Formation of M1-Like Macrophages
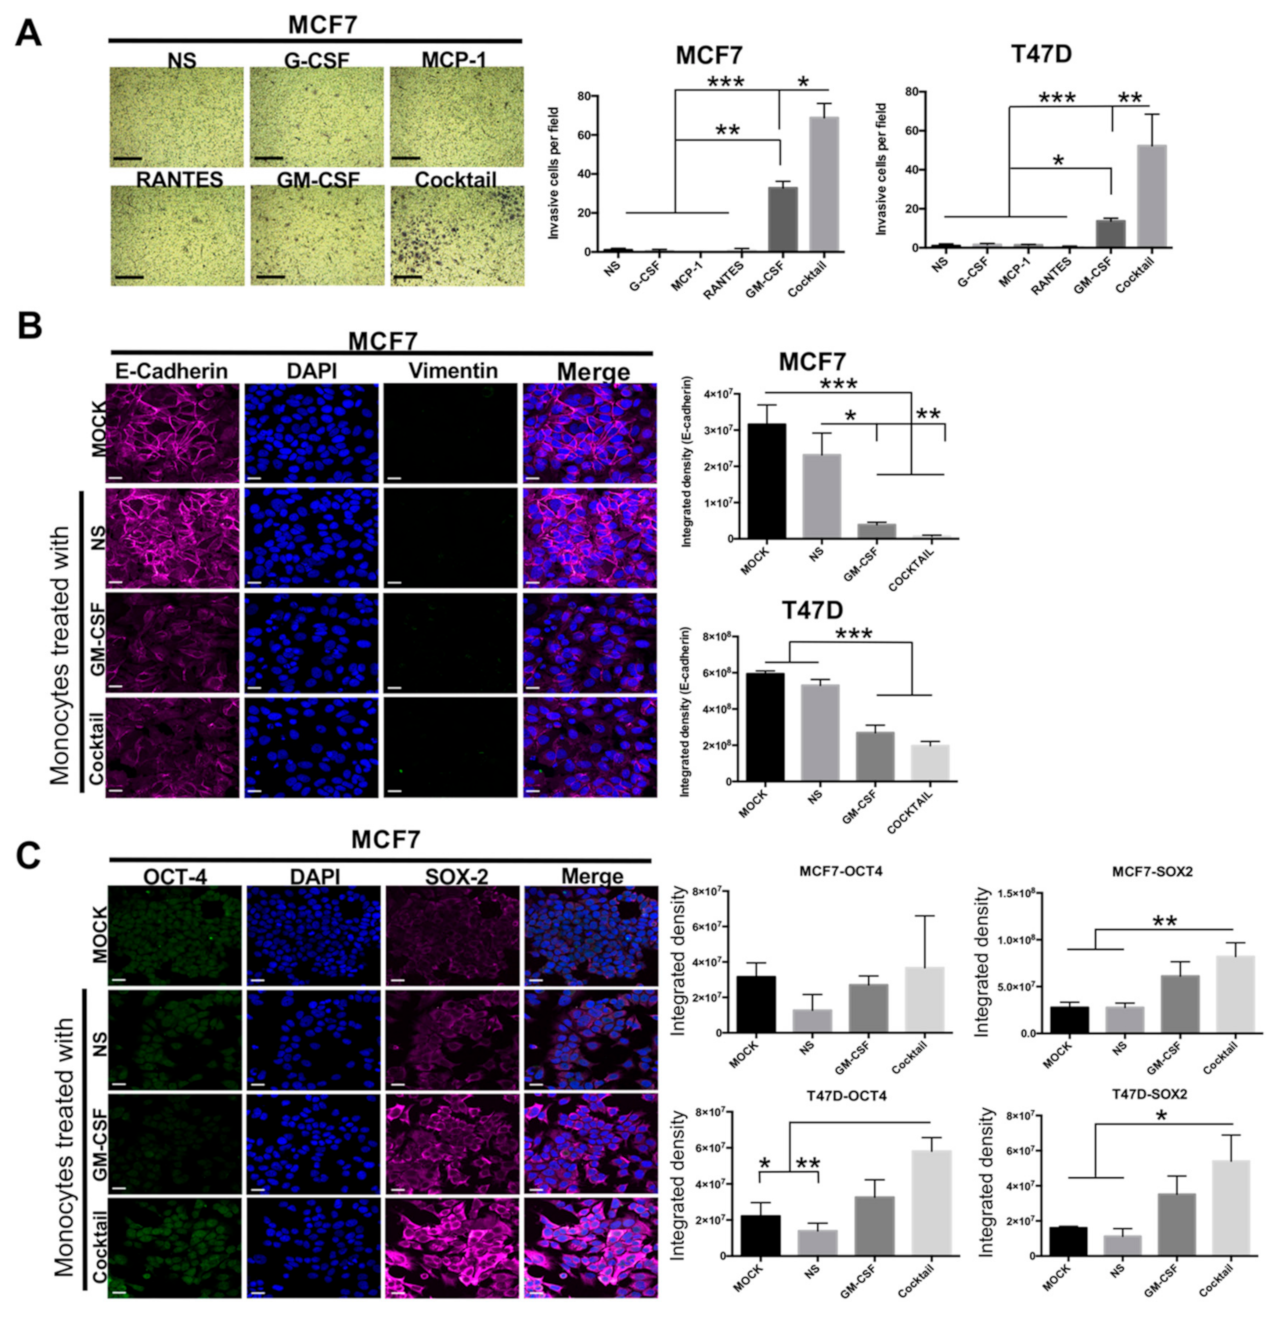
2.2. Induced-M1-Like Macrophages Promote Aggressive Features in Breast Cancer Cells
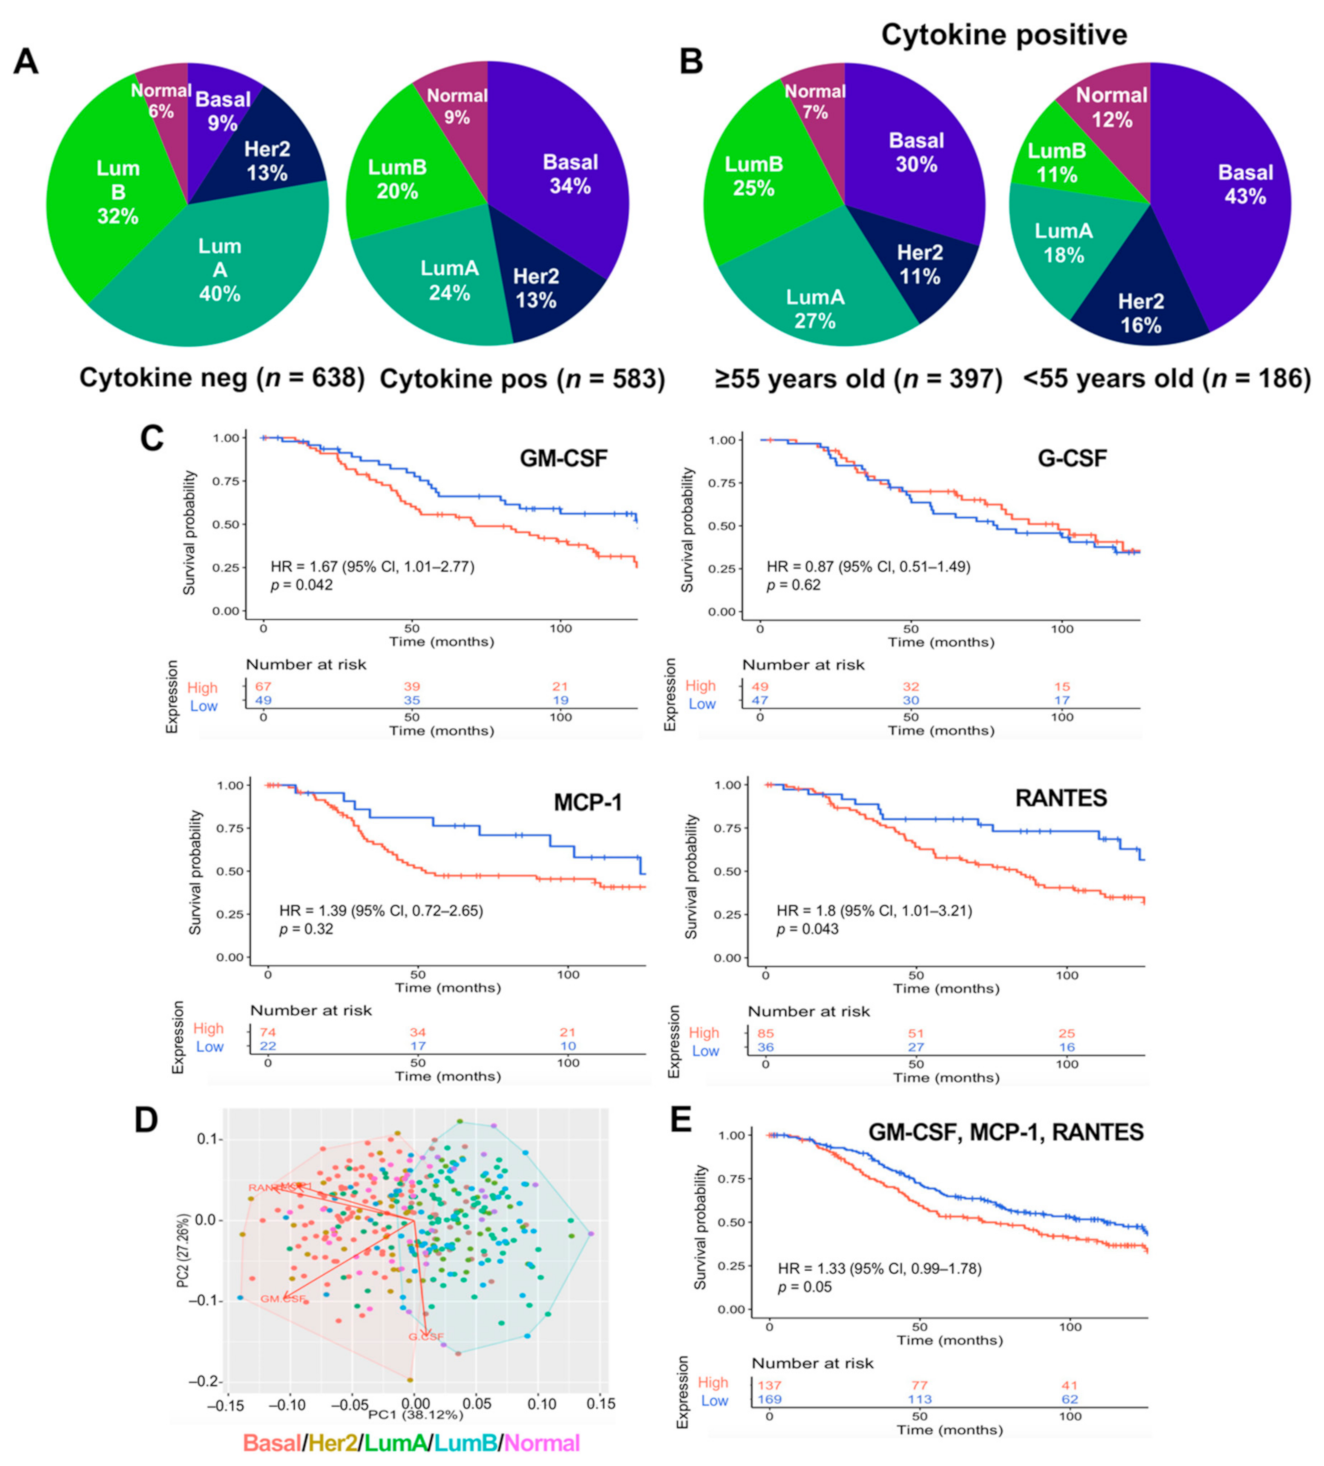
2.3. GM-CSF, MCP1, and RANTES Are Overexpressed in Breast Tumors of Poor Prognosis
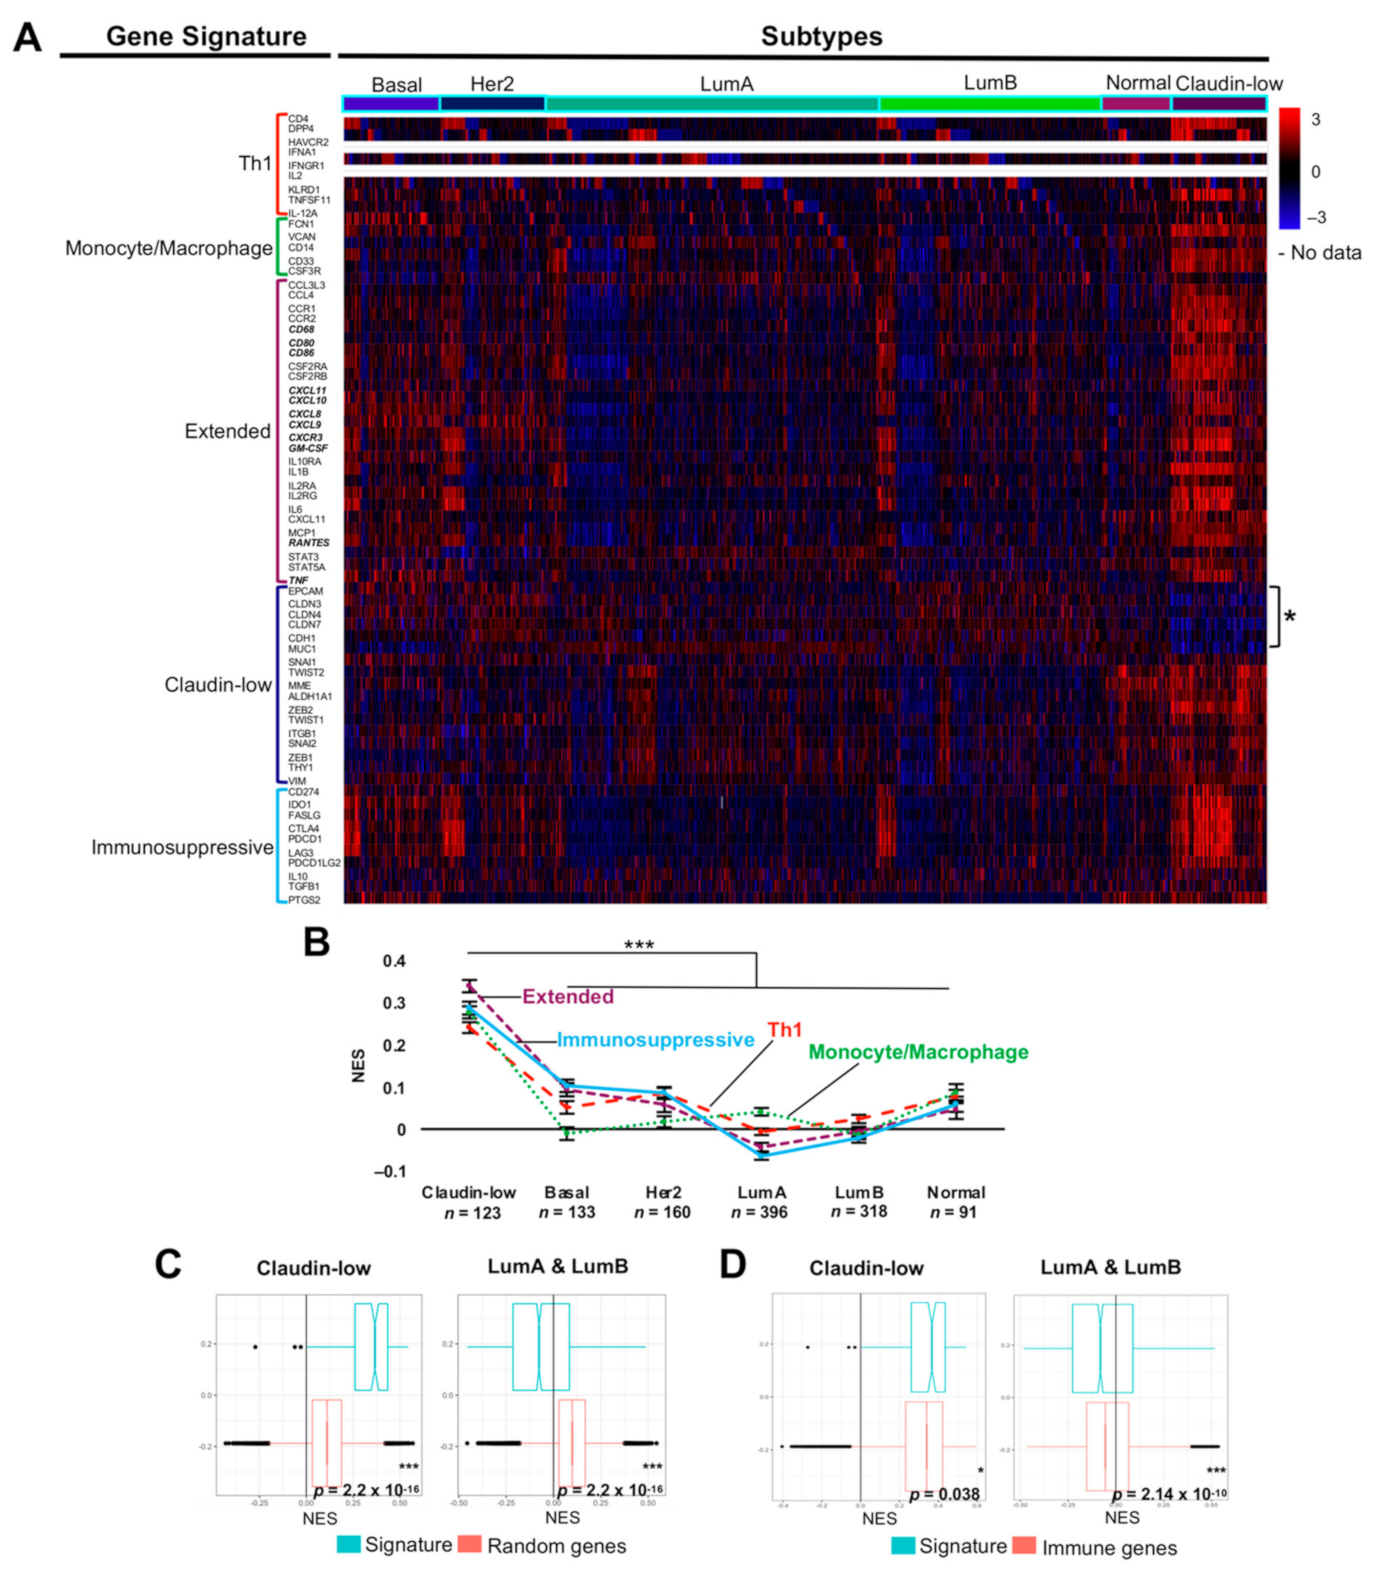
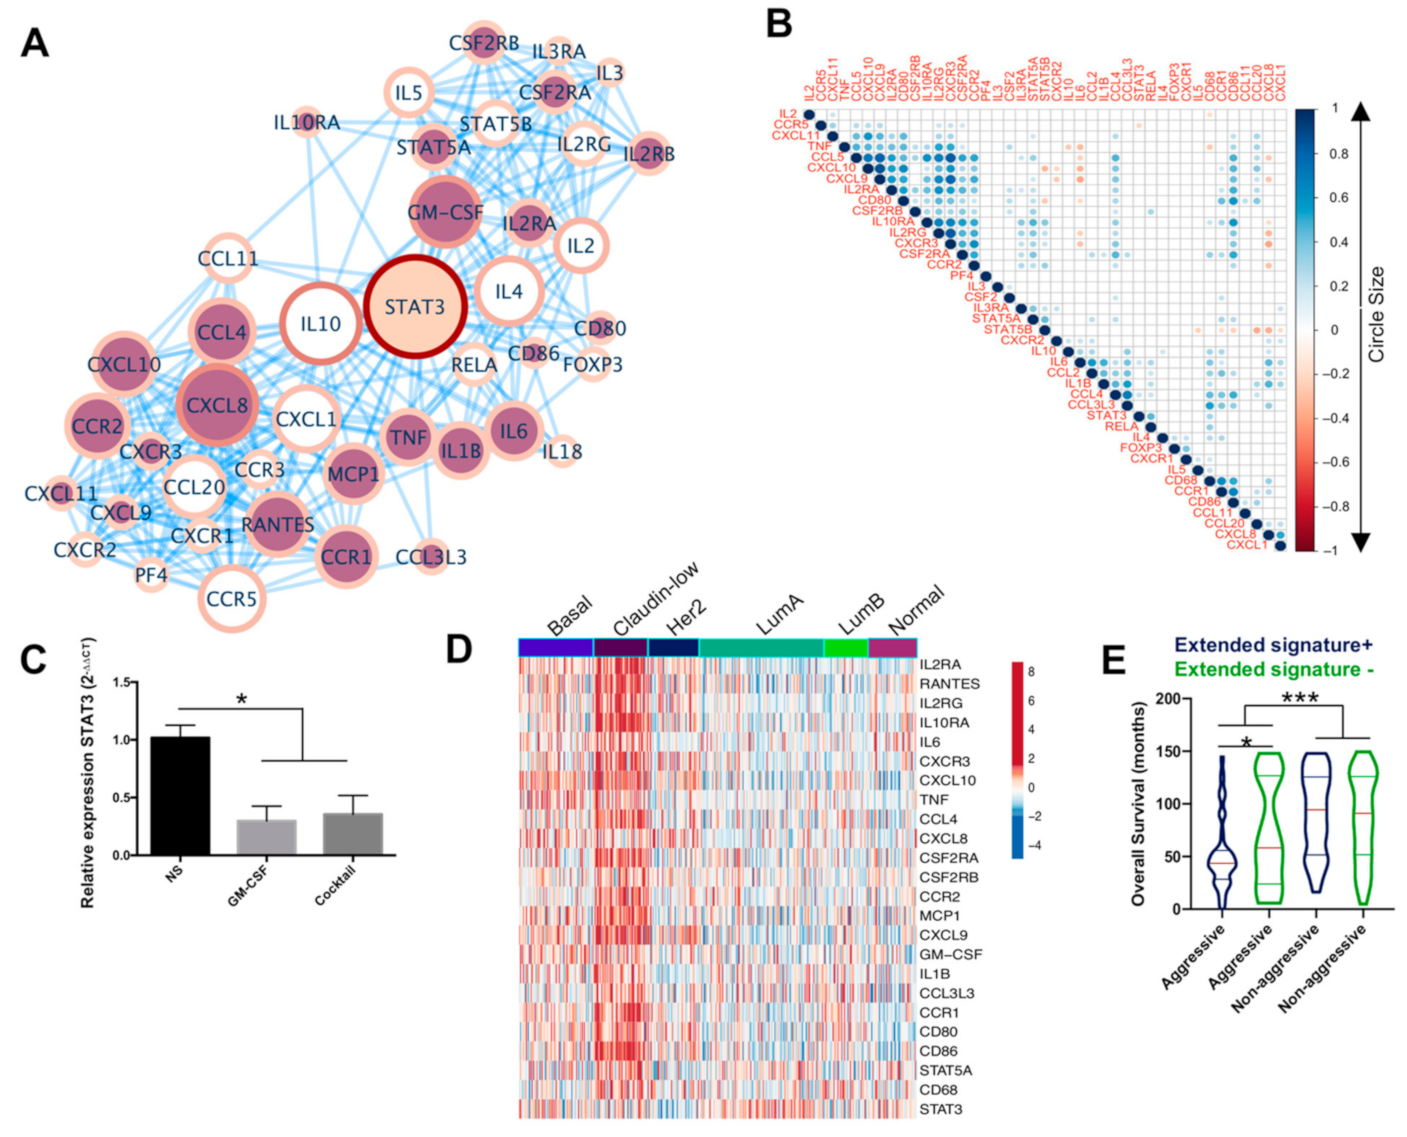
2.4. An Extended Gene Signature Associated with M1-Like Macrophages Is Enriched in Claudin-Low Breast Tumors
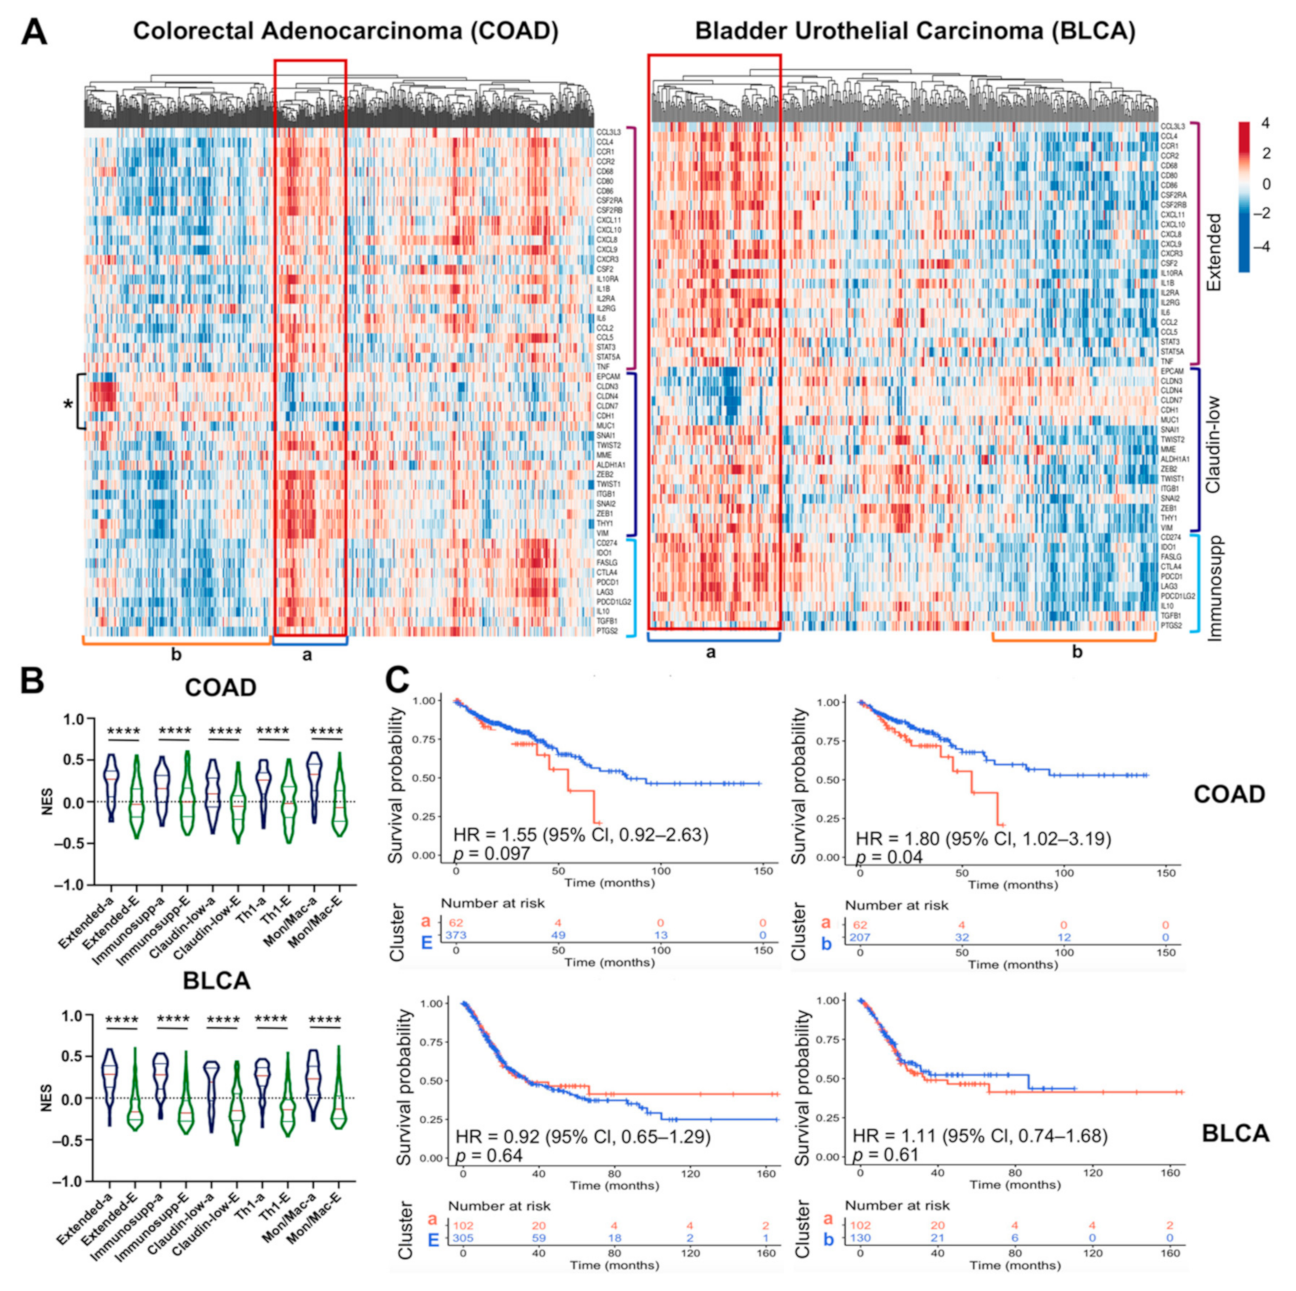
2.5. The M1-Like Macrophage Extended Signature Concur with Th1 and Immunosuppressive Signatures in Claudin-Low Tumors Denoting Poor Prognosis
3. Discussion
4. Materials and Methods
4.1. Cell Culture and Generation of PBM
4.2. Macrophage Differentiation and Polarization
4.3. Migration Assay
4.4. Quantitative Determination of IL-8
4.5. Flow Cytometry
4.6. Immunofluorescence Assay
4.7. Invasion Assay
4.8. Quantitative RT-PCR
4.9. METABRIC and TCGA Data Analysis
4.10. Single-Sample Gene Set Enrichment Analysis
4.11. Statistical Analysis
5. Conclusions
Supplementary Materials
Author Contributions
Funding
Institutional Review Board Statement
Informed Consent Statement
Data Availability Statement
Acknowledgments
Conflicts of Interest
References
- Ferlay, J.; Colombet, M.; Soerjomataram, I.; Mathers, C.; Parkin, D.M.; Piñeros, M.; Znaor, A.; Bray, F. Estimating the global cancer incidence and mortality in 2018: GLOBOCAN sources and methods. Int. J. Cancer 2019, 144, 1941–1953. [Google Scholar] [CrossRef] [PubMed] [Green Version]
- Guo, L.; Chen, G.; Zhang, W.; Zhou, L.; Xiao, T.; Di, X.; Wang, Y.; Feng, L.; Zhang, K. A high-risk luminal A dominant breast cancer subtype with increased mobility. Breast Cancer Res. Treat. 2019, 175, 459–472. [Google Scholar] [CrossRef] [PubMed] [Green Version]
- Espinoza-Sánchez, N.A.; Chimal-Ramírez, G.K.; Mantilla, A.; Fuentes-Pananá, E.M. IL-1β, IL-8, and matrix metalloproteinases-1, -2, and -10 are enriched upon monocyte-breast cancer cell cocultivation in a matrigel-based three-dimensional system. Front. Immunol. 2017, 8, 856. [Google Scholar] [CrossRef] [PubMed]
- Lango-Chavarría, M.; Chimal-Ramírez, G.K.; Ruiz-Tachiquín, M.E.; Espinoza-Sánchez, N.A.; Suárez-Arriaga, M.C.; Fuentes-Pananá, E.M. A 22q11.2 amplification in the region encoding microRNA-650 correlates with the epithelial to mesenchymal transition in breast cancer primary cultures of Mexican patients. Int. J. Oncol. 2017, 50, 432–440. [Google Scholar] [CrossRef] [Green Version]
- Turkoz, F.P.; Solak, M.; Petekkaya, I.; Keskin, O.; Kertmen, N.; Sarici, F.; Arik, Z.; Babacan, T.; Ozisik, Y.; Altundag, K. Association between common risk factors and molecular subtypes in breast cancer patients. Breast 2013, 22, 344–350. [Google Scholar] [CrossRef]
- Quail, D.F.; Joyce, J.A. Microenvironmental regulation of tumor progression and metastasis. Nat. Med. 2013, 19, 1423–1437. [Google Scholar]
- Chimal-Ramírez, G.K.; Espinoza-Sánchez, N.A.; Fuentes-Pananá, E.M. Protumor activities of the immune response: Insights in the mechanisms of immunological shift, oncotraining, and oncopromotion. J. Oncol. 2013, 2013, 835956. [Google Scholar] [CrossRef] [Green Version]
- Davies, A.E.; Albeck, J.G. Microenvironmental signals and biochemical information processing: Cooperative determinants of intratumoral plasticity and heterogeneity. Front. Cell Dev. Biol. 2018, 6, 44. [Google Scholar] [CrossRef] [Green Version]
- Rosenberg, S.A.; Restifo, N.P. Adoptive cell transfer as personalized immunotherapy for human cancer. Science 2015, 348, 62–68. [Google Scholar] [CrossRef] [Green Version]
- Chen, D.S.; Mellman, I. Elements of cancer immunity and the cancer-immune set point. Nature 2017, 541, 321–330. [Google Scholar] [CrossRef]
- León-Letelier, R.A.; Bonifaz, L.C.; Fuentes-Pananá, E.M. OMIC signatures to understand cancer immunosurveillance and immunoediting: Melanoma and immune cells interplay in immunotherapy. J. Leukoc. Biol. 2019, 105, 915–933. [Google Scholar] [CrossRef]
- Soundararajan, R.; Fradette, J.J.; Konen, J.M.; Moulder, S.; Zhang, X.; Gibbons, D.L.; Varadarajan, N.; Wistuba, I.I.; Tripathy, D.; Bernatchez, C.; et al. Targeting the interplay between epithelial-to-mesenchymal-transition and the immune system for effective immunotherapy. Cancers 2019, 11, 714. [Google Scholar] [CrossRef] [Green Version]
- Planes-Laine, G.; Rochigneux, P.; Bertucci, F.; Chrétien, A.S.; Viens, P.; Sabatier, R.; Gonçalves, A. PD-1/PD-l1 targeting in breast cancer: The first clinical evidences are emerging. a literature review. Cancers 2019, 11, 1033. [Google Scholar] [CrossRef] [Green Version]
- Charoentong, P.; Finotello, F.; Angelova, M.; Mayer, C.; Efremova, M.; Rieder, D.; Hackl, H.; Trajanoski, Z. Pan-cancer Immunogenomic Analyses Reveal Genotype-Immunophenotype Relationships and Predictors of Response to Checkpoint Blockade. Cell Rep. 2017, 18, 248–262. [Google Scholar] [CrossRef] [Green Version]
- Brady, N.J.; Chuntova, P.; Schwertfeger, K.L. Macrophages: Regulators of the inflammatory microenvironment during mammary gland development and breast cancer. Mediat. Inflamm. 2016, 2016, 4549676. [Google Scholar] [CrossRef] [Green Version]
- Hodson, L.J.; Chua, A.C.L.; Evdokiou, A.; Robertson, S.A.; Ingman, W.V. Macrophage phenotype in the mammary gland fluctuates over the course of the estrous cycle and is regulated by ovarian steroid hormones. Biol. Reprod. 2013, 89, 65. [Google Scholar] [CrossRef] [Green Version]
- Chua, A.C.L.; Hodson, L.J.; Moldenhauer, L.M.; Robertson, S.A.; Ingman, W.V. Dual roles for macrophages in ovarian cycle-associated development and remodelling of the mammary gland epithelium. Development 2010, 137, 4229–4238. [Google Scholar] [CrossRef] [Green Version]
- Kannan, N.; Eaves, C.J. Macrophages stimulate mammary stem cells. Science 2018, 360, 1401–1402. [Google Scholar] [CrossRef]
- Gouon-Evans, V.; Rothenberg, M.E.; Pollard, J.W. Postnatal mammary gland development requires macrophages and eosinophils. Development 2000, 127, 2269–2282. [Google Scholar] [CrossRef]
- Van Nguyen, A.; Pollard, J.W. Colony stimulating factor-1 is required to recruit macrophages into the mammary gland to facilitate mammary ductal outgrowth. Dev. Biol. 2002, 247, 11–25. [Google Scholar] [CrossRef] [Green Version]
- Solinas, G.; Germano, G.; Mantovani, A.; Allavena, P. Tumor-associated macrophages (TAM) as major players of the cancer-related inflammation. J. Leukoc. Biol. 2009, 86, 1065–1073. [Google Scholar] [CrossRef] [PubMed] [Green Version]
- Zhao, X.; Qu, J.; Sun, Y.; Wang, J.; Liu, X.; Wang, F.; Zhang, H.; Wang, W.; Ma, X.; Gao, X.; et al. Prognostic significance of tumor-associated macrophages in breast cancer: A meta-analysis of the literature. Oncotarget 2017, 8, 30576–30586. [Google Scholar] [CrossRef] [PubMed] [Green Version]
- Zhang, Q.W.; Liu, L.; Gong, C.Y.; Shi, H.S.; Zeng, Y.H.; Wang, X.Z.; Zhao, Y.W.; Wei, Y.Q. Prognostic Significance of Tumor-Associated Macrophages in Solid Tumor: A Meta-Analysis of the Literature. PLoS ONE 2012, 7, e50946. [Google Scholar] [CrossRef] [Green Version]
- Williams, C.B.; Yeh, E.S.; Soloff, A.C. Tumor-associated macrophages: Unwitting accomplices in breast cancer malignancy. NPJ Breast Cancer 2016, 2, 15025. [Google Scholar] [CrossRef] [PubMed] [Green Version]
- Goswami, S.; Sahai, E.; Wyckoff, J.B.; Cammer, M.; Cox, D.; Pixley, F.J.; Stanley, E.R.; Segall, J.E.; Condeelis, J.S. Macrophages promote the invasion of breast carcinoma cells via a colony-stimulating factor-1/epidermal growth factor paracrine loop. Cancer Res. 2005, 65, 5278–5283. [Google Scholar] [CrossRef] [PubMed] [Green Version]
- Sidani, M.; Wyckoff, J.; Xue, C.; Segall, J.E.; Condeelis, J. Probing the microenvironment of mammary tumors using multiphoton microscopy. J. Mammary Gland Biol. Neoplasia 2006, 11, 151–163. [Google Scholar] [CrossRef] [PubMed]
- Robinson, B.D.; Sica, G.L.; Liu, Y.F.; Rohan, T.E.; Gertler, F.B.; Condeelis, J.S.; Jones, J.G. Tumor microenvironment of metastasis in human breast carcinoma: A potential prognostic marker linked to hematogenous dissemination. Clin. Cancer Res. 2009, 15, 2433–2441. [Google Scholar] [CrossRef] [Green Version]
- Oh, S.A.; Li, M.O. TGF-β: Guardian of T Cell Function. J. Immunol. 2013, 191, 3973–3979. [Google Scholar] [CrossRef]
- Ng, T.H.S.; Britton, G.J.; Hill, E.V.; Verhagen, J.; Burton, B.R.; Wraith, D.C. Regulation of adaptive immunity; the role of interleukin-10. Front. Immunol. 2013, 4, 129. [Google Scholar] [CrossRef] [Green Version]
- Watanabe, M.A.E.; Oda, J.M.M.; Amarante, M.K.; Cesar Voltarelli, J. Regulatory T cells and breast cancer: Implications for immunopathogenesis. Cancer Metastasis Rev. 2010, 29, 569–579. [Google Scholar] [CrossRef]
- Gabrilovich, D.I.; Ostrand-Rosenberg, S.; Bronte, V. Coordinated regulation of myeloid cells by tumours. Nat. Rev. Immunol. 2012, 12, 253–268. [Google Scholar] [CrossRef] [Green Version]
- Mazzoni, A.; Bronte, V.; Visintin, A.; Spitzer, J.H.; Apolloni, E.; Serafini, P.; Zanovello, P.; Segal, D.M. Myeloid Suppressor Lines Inhibit T Cell Responses by an NO-Dependent Mechanism. J. Immunol. 2002, 168, 689–695. [Google Scholar] [CrossRef]
- Yang, J.; Liao, D.; Chen, C.; Liu, Y.; Chuang, T.H.; Xiang, R.; Markowitz, D.; Reisfeld, R.A.; Luo, Y. Tumor-associated macrophages regulate murine breast cancer stem cells through a novel paracrine egfr/stat3/sox-2 signaling pathway. Stem Cells 2013, 31, 248–258. [Google Scholar] [CrossRef]
- Mills, C.D. Anatomy of a discovery: M1 and M2 macrophages. Front. Immunol. 2015, 6, 212. [Google Scholar] [CrossRef]
- Chimal-Ramírez, G.K.; Espinoza-Sánchez, N.A.; Chávez-Sánchez, L.; Arriaga-Pizano, L.; Fuentes-Pananá, E.M. Monocyte Differentiation towards Protumor Activity Does Not Correlate with M1 or M2 Phenotypes. J. Immunol. Res. 2016, 2016, 6031486. [Google Scholar] [CrossRef] [Green Version]
- Chimal-Ramírez, G.K.; Espinoza-Sánchez, N.A.; Fuentes-Pananá, E.M. A Role for the Inflammatory Mediators Cox-2 and Metalloproteinases in Cancer Stemness. Anticancer Agents Med. Chem. 2015, 15, 837–855. [Google Scholar] [CrossRef]
- Chimal-Ramírez, G.K.; Espinoza-Sánchez, N.A.; Utrera-Barillas, D.; Benítez-Bribiesca, L.; Velázquez, J.R.; Arriaga-Pizano, L.A.; Monroy-García, A.; Reyes-Maldonado, E.; Domínguez-López, M.L.; Piña-Sánchez, P.; et al. MMP1, MMP9, and COX2 expressions in promonocytes are induced by breast cancer cells and correlate with collagen degradation, transformation-like morphological changes in MCF-10A acini, and tumor aggressiveness. Biomed. Res. Int. 2013, 2013, 279505. [Google Scholar] [CrossRef] [Green Version]
- Sousa, S.; Brion, R.; Lintunen, M.; Kronqvist, P.; Sandholm, J.; Mönkkönen, J.; Kellokumpu-Lehtinen, P.L.; Lauttia, S.; Tynninen, O.; Joensuu, H.; et al. Human breast cancer cells educate macrophages toward the M2 activation status. Breast Cancer Res. 2015, 17, 101. [Google Scholar] [CrossRef] [Green Version]
- Zhang, M.; He, Y.; Sun, X.; Li, Q.; Wang, W.; Zhao, A.; Di, W. A high M1/M2 ratio of tumor-associated macrophages is associated with extended survival in ovarian cancer patients. J. Ovarian Res. 2014, 7, 19. [Google Scholar] [CrossRef] [Green Version]
- Macciò, A.; Gramignano, G.; Cherchi, M.C.; Tanca, L.; Melis, L.; Madeddu, C. Role of M1-polarized tumor-associated macrophages in the prognosis of advanced ovarian cancer patients. Sci. Rep. 2020, 10, 1–8. [Google Scholar] [CrossRef] [Green Version]
- Pantano, F.; Berti, P.; Guida, F.M.; Perrone, G.; Vincenzi, B.; Amato, M.M.C.; Righi, D.; Dell’Aquila, E.; Graziano, F.; Catalano, V.; et al. The role of macrophages polarization in predicting prognosis of radically resected gastric cancer patients. J. Cell. Mol. Med. 2013, 17, 1415–1421. [Google Scholar] [CrossRef] [Green Version]
- Petrillo, M.; Zannoni, G.F.; Martinelli, E.; Anchora, L.P.; Ferrandina, G.; Tropeano, G.; Fagotti, A.; Scambia, G. Polarisation of tumor-associated macrophages toward M2 phenotype correlates with poor response to chemoradiation and reduced survival in patients with locally advanced cervical cancer. PLoS ONE 2015, 10, e0136654. [Google Scholar] [CrossRef]
- Espinoza-Sánchez, N.A.; Enciso, J.; Pelayo, R.; Fuentes-Pananá, E.M. An NFκB-dependent mechanism of tumor cell plasticity and lateral transmission of aggressive features. Oncotarget 2018, 9, 26679–26700. [Google Scholar] [CrossRef]
- Espinoza-Sánchez, N.A.; Vadillo, E.; Balandrán, J.C.; Monroy-García, A.; Pelayo, R.; Fuentes-Pananá, E.M. Evidence of lateral transmission of aggressive features between different types of breast cancer cells. Int. J. Oncol. 2017, 51, 1482–1496. [Google Scholar] [CrossRef] [PubMed] [Green Version]
- Diab, S.G.; Elledge, R.M.; Clark, G.M. Tumor characteristics and clinical outcome of elderly women with breast cancer. J. Natl. Cancer Inst. 2000, 92, 550–556. [Google Scholar] [CrossRef] [PubMed] [Green Version]
- Azim, H.A.; Partridge, A.H. Biology of breast cancer in young women. Breast Cancer Res. 2014, 16, 427. [Google Scholar] [CrossRef] [PubMed]
- Szklarczyk, D.; Gable, A.L.; Lyon, D.; Junge, A.; Wyder, S.; Huerta-Cepas, J.; Simonovic, M.; Doncheva, N.T.; Morris, J.H.; Bork, P.; et al. STRING v11: Protein-protein association networks with increased coverage, supporting functional discovery in genome-wide experimental datasets. Nucleic Acids Res. 2019, 47, D607–D613. [Google Scholar] [CrossRef] [PubMed] [Green Version]
- Shannon, P.; Markiel, A.; Ozier, O.; Baliga, N.S.; Wang, J.T.; Ramage, D.; Amin, N.; Schwikowski, B.; Ideker, T. Cytoscape: A software Environment for integrated models of biomolecular interaction networks. Genome Res. 2003, 13, 2498–2504. [Google Scholar] [CrossRef]
- Yin, Z.; Ma, T.; Lin, Y.; Lu, X.; Zhang, C.; Chen, S.; Jian, Z. IL-6/STAT3 pathway intermediates M1/M2 macrophage polarization during the development of hepatocellular carcinoma. J. Cell. Biochem. 2018, 119, 9419–9432. [Google Scholar] [CrossRef]
- Fletcher, J.S.; Springer, M.G.; Choi, K.; Jousma, E.; Rizvi, T.A.; Dombi, E.; Kim, M.O.; Wu, J.; Ratner, N. STAT3 inhibition reduces macrophage number and tumor growth in neurofibroma. Oncogene 2019, 38, 2876–2884. [Google Scholar] [CrossRef]
- Su, Y.L.; Banerjee, S.; White, S.V.; Kortylewski, M. STAT3 in tumor-associated myeloid cells: Multitasking to disrupt immunity. Int. J. Mol. Sci. 2018, 19, 1803. [Google Scholar] [CrossRef] [Green Version]
- Prat, A.; Parker, J.S.; Karginova, O.; Fan, C.; Livasy, C.; Herschkowitz, J.I.; He, X.; Perou, C.M. Phenotypic and molecular characterization of the claudin-low intrinsic subtype of breast cancer. Breast Cancer Res. 2010, 12, R68. [Google Scholar] [CrossRef] [Green Version]
- Sabatier, R.; Finetti, P.; Guille, A.; Adelaide, J.; Chaffanet, M.; Viens, P.; Birnbaum, D.; Bertucci, F. Claudin-low breast cancers: Clinical, pathological, molecular and prognostic characterization. Mol. Cancer 2014, 13, 228. [Google Scholar] [CrossRef] [Green Version]
- Mills, C.D.; Kincaid, K.; Alt, J.M.; Heilman, M.J.; Hill, A.M. M-1/M-2 Macrophages and the Th1/Th2 Paradigm. J. Immunol. 2000, 164, 6166–6173. [Google Scholar] [CrossRef] [Green Version]
- Jerby-Arnon, L.; Shah, P.; Cuoco, M.S.; Rodman, C.; Su, M.J.; Melms, J.C.; Leeson, R.; Kanodia, A.; Mei, S.; Lin, J.R.; et al. A Cancer Cell Program Promotes T Cell Exclusion and Resistance to Checkpoint Blockade. Cell 2018, 175, 984–997.e24. [Google Scholar] [CrossRef] [Green Version]
- Sade-Feldman, M.; Yizhak, K.; Bjorgaard, S.L.; Ray, J.P.; de Boer, C.G.; Jenkins, R.W.; Lieb, D.J.; Chen, J.H.; Frederick, D.T.; Barzily-Rokni, M.; et al. Defining T Cell States Associated with Response to Checkpoint Immunotherapy in Melanoma. Cell 2018, 175, 998–1013.e20. [Google Scholar] [CrossRef] [Green Version]
- Fougner, C.; Bergholtz, H.; Norum, J.H.; Sørlie, T. Re-definition of claudin-low as a breast cancer phenotype. Nat. Commun. 2020, 11, 1787. [Google Scholar] [CrossRef] [Green Version]
- Kardos, J.; Chai, S.; Mose, L.E.; Selitsky, S.R.; Krishnan, B.; Saito, R.; Iglesia, M.D.; Milowsky, M.I.; Parker, J.S.; Kim, W.Y.; et al. Claudin-low bladder tumors are immune infiltrated and actively immune suppressed. JCI Insight 2016, 1, e85902. [Google Scholar] [CrossRef] [Green Version]
- Roepman, P.; Schlicker, A.; Tabernero, J.; Majewski, I.; Tian, S.; Moreno, V.; Snel, M.H.; Chresta, C.M.; Rosenberg, R.; Nitsche, U.; et al. Colorectal cancer intrinsic subtypes predict chemotherapy benefit, deficient mismatch repair and epithelial-to-mesenchymal transition. Int. J. Cancer 2014, 134, 552–562. [Google Scholar] [CrossRef]
- Hahn-Strömberg, V.; Askari, S.; Ahmad, A.; Befekadu, R.; Nilsson, T.K. Expression of claudin 1, claudin 4, and claudin 7 in colorectal cancer and its relation with CLDN DNA methylation patterns. Tumor Biol. 2017, 4. [Google Scholar] [CrossRef] [Green Version]
- Klingen, T.A.; Chen, Y.; Aas, H.; Wik, E.; Akslen, L.A. Tumor-associated macrophages are strongly related to vascular invasion, non-luminal subtypes, and interval breast cancer. Hum. Pathol. 2017, 69, 72–80. [Google Scholar] [CrossRef] [PubMed]
- Lee, C.; Lee, J.; Choi, S.A.; Kim, S.K.; Wang, K.C.; Park, S.H.; Kim, S.H.; Lee, J.Y.; Phi, J.H. M1 macrophage recruitment correlates with worse outcome in SHH Medulloblastomas. BMC Cancer 2018, 18, 535. [Google Scholar] [CrossRef] [Green Version]
- Azizi, E.; Carr, A.J.; Plitas, G.; Cornish, A.E.; Konopacki, C.; Prabhakaran, S.; Nainys, J.; Wu, K.; Kiseliovas, V.; Setty, M.; et al. Single-Cell Map of Diverse Immune Phenotypes in the Breast Tumor Microenvironment. Cell 2018, 174, 1293–1308.e36. [Google Scholar] [CrossRef] [Green Version]
- Cassetta, L.; Fragkogianni, S.; Sims, A.H.; Swierczak, A.; Forrester, L.M.; Zhang, H.; Soong, D.Y.H.; Cotechini, T.; Anur, P.; Lin, E.Y.; et al. Human Tumor-Associated Macrophage and Monocyte Transcriptional Landscapes Reveal Cancer-Specific Reprogramming, Biomarkers, and Therapeutic Targets. Cancer Cell 2019, 35, 588–602.e10. [Google Scholar] [CrossRef] [PubMed] [Green Version]
- Wagner, J.; Rapsomaniki, M.A.; Chevrier, S.; Anzeneder, T.; Langwieder, C.; Dykgers, A.; Rees, M.; Ramaswamy, A.; Muenst, S.; Soysal, S.D.; et al. A Single-Cell Atlas of the Tumor and Immune Ecosystem of Human Breast Cancer. Cell 2019, 177, 1330–1345.e18. [Google Scholar] [CrossRef] [PubMed] [Green Version]
- Schupp, J.; Krebs, F.K.; Zimmer, N.; Trzeciak, E.; Schuppan, D.; Tuettenberg, A. Targeting myeloid cells in the tumor sustaining microenvironment. Cell. Immunol. 2019, 343, 103713. [Google Scholar] [CrossRef] [PubMed]
- Mosser, D.M.; Edwards, J.P. Exploring the full spectrum of macrophage activation. Nat. Rev. Immunol. 2008, 8, 958–969. [Google Scholar] [CrossRef] [PubMed]
- Stout, R.D.; Jiang, C.; Matta, B.; Tietzel, I.; Watkins, S.K.; Suttles, J. Macrophages sequentially change their functional phenotype in response to changes in microenvironmental influences. J. Immunol. 2005, 175, 342–349. [Google Scholar] [CrossRef]
- Xue, J.; Schmidt, S.V.; Sander, J.; Draffehn, A.; Krebs, W.; Quester, I.; DeNardo, D.; Gohel, T.D.; Emde, M.; Schmidleithner, L.; et al. Transcriptome-Based Network Analysis Reveals a Spectrum Model of Human Macrophage Activation. Immunity 2014, 40, 274–288. [Google Scholar] [CrossRef] [Green Version]
- Soria, G.; Ofri-Shahak, M.; Haas, I.; Yaal-Hahoshen, N.; Leider-Trejo, L.; Leibovich-Rivkin, T.; Weitzenfeld, P.; Meshel, T.; Shabtai, E.; Gutman, M.; et al. Inflammatory mediators in breast cancer: Coordinated expression of TNFα & IL-1β with CCL2 & CCL5 and effects on epithelial-to-mesenchymal transition. BMC Cancer 2011, 11, 130. [Google Scholar]
- Velasco-Velázquez, M.; Jiao, X.; De La Fuente, M.; Pestell, T.G.; Ertel, A.; Lisanti, M.P.; Pestell, R.G. CCR5 antagonist blocks metastasis of basal breast cancer cells. Cancer Res. 2012, 72, 3839–3850. [Google Scholar] [CrossRef] [Green Version]
- Li, M.; Knight, D.A.; Snyder, L.A.; Smyth, M.J.; Stewart, T.J. A role for CCL2 in both tumor progression and immunosurveillance. Oncoimmunology 2013, 2, e25474. [Google Scholar] [CrossRef] [Green Version]
- Dutta, P.; Sarkissyan, M.; Paico, K.; Wu, Y.; Vadgama, J.V. MCP-1 is overexpressed in triple-negative breast cancers and drives cancer invasiveness and metastasis. Breast Cancer Res. Treat. 2018, 170, 477–486. [Google Scholar] [CrossRef] [Green Version]
- Soria, G.; Yaal-Hahoshen, N.; Azenshtein, E.; Shina, S.; Leider-Trejo, L.; Ryvo, L.; Cohen-Hillel, E.; Shtabsky, A.; Ehrlich, M.; Meshel, T.; et al. Concomitant expression of the chemokines RANTES and MCP-1 in human breast cancer: A basis for tumor-promoting interactions. Cytokine 2008, 44, 191–200. [Google Scholar] [CrossRef]
- Parmiani, G.; Castelli, C.; Pilla, L.; Santinami, M.; Colombo, M.P.; Rivoltini, L. Opposite immune functions of GM-CSF administered as vaccine adjuvant in cancer patients. Ann. Oncol. 2007, 18, 226–232. [Google Scholar] [CrossRef]
- Kawashima, T.; Murata, K.; Akira, S.; Tonozuka, Y.; Minoshima, Y.; Feng, S.; Kumagai, H.; Tsuruga, H.; Ikeda, Y.; Asano, S.; et al. STAT5 Induces Macrophage Differentiation of M1 Leukemia Cells Through Activation of IL-6 Production Mediated by NF-κB p65. J. Immunol. 2001, 167, 3652–3660. [Google Scholar] [CrossRef] [Green Version]
- Smith, A.; Metcalf, D.; Nicola, N.A. Cytoplasmic domains of the common β-chain of the GM-CSF/IL-3/IL-5 receptors that are required for inducing differentiation or clonal suppression in myeloid leukaemic cell lines. EMBO J. 1997, 16, 451–564. [Google Scholar] [CrossRef] [Green Version]
- Nath, A.; Chattopadhya, S.; Chattopadhyay, U.; Sharma, N.K. Macrophage inflammatory protein (MIP)1α and MIP1β differentially regulate release of inflammatory cytokines and generation of tumoricidal monocytes in malignancy. Cancer Immunol. Immunother. 2006, 55, 1534–1541. [Google Scholar] [CrossRef]
- Qian, B.Z.; Pollard, J.W. Macrophage Diversity Enhances Tumor Progression and Metastasis. Cell 2010, 141, 39–51. [Google Scholar] [CrossRef] [Green Version]
- Hanahan, D.; Weinberg, R.A. Hallmarks of cancer: The next generation. Cell 2011, 144, 646–674. [Google Scholar] [CrossRef] [Green Version]
- Grivennikov, S.I.; Greten, F.R.; Karin, M. Immunity, Inflammation, and Cancer. Cell 2010, 140, 883–899. [Google Scholar] [CrossRef] [PubMed] [Green Version]
- Hussain, S.P.; Hofseth, L.J.; Harris, C.C. Radical causes of cancer. Nat. Rev. Cancer 2003, 3, 276–285. [Google Scholar] [CrossRef] [PubMed]
- Morel, A.P.; Ginestier, C.; Pommier, R.M.; Cabaud, O.; Ruiz, E.; Wicinski, J.; Devouassoux-Shisheboran, M.; Combaret, V.; Finetti, P.; Chassot, C.; et al. A stemness-related ZEB1-MSRB3 axis governs cellular pliancy and breast cancer genome stability. Nat. Med. 2017, 23, 568–578. [Google Scholar] [CrossRef]
- Van Keymeulen, A.; Lee, M.Y.; Ousset, M.; Brohée, S.; Rorive, S.; Giraddi, R.R.; Wuidart, A.; Bouvencourt, G.; Dubois, C.; Salmon, I.; et al. Reactivation of multipotency by oncogenic PIK3CA induces breast tumour heterogeneity. Nature 2015, 525, 119–123. [Google Scholar] [CrossRef]
- Lim, E.; Vaillant, F.; Wu, D.; Forrest, N.C.; Pal, B.; Hart, A.H.; Asselin-Labat, M.L.; Gyorki, D.E.; Ward, T.; Partanen, A.; et al. Aberrant luminal progenitors as the candidate target population for basal tumor development in BRCA1 mutation carriers. Nat. Med. 2009, 15, 907–913. [Google Scholar] [CrossRef]
- Morel, A.P.; Hinkal, G.W.; Thomas, C.; Fauvet, F.; Courtois-Cox, S.; Wierinckx, A.; Devouassoux-Shisheboran, M.; Treilleux, I.; Tissier, A.; Gras, B.; et al. EMT inducers catalyze malignant transformation of mammary epithelial cells and drive tumorigenesis towards claudin-low tumors in transgenic mice. PLoS Genet. 2012, 8, e1002723. [Google Scholar] [CrossRef] [PubMed] [Green Version]
- Taube, J.H.; Herschkowitz, J.I.; Komurov, K.; Zhou, A.Y.; Gupta, S.; Yang, J.; Hartwell, K.; Onder, T.T.; Gupta, P.B.; Evans, K.W.; et al. Core epithelial-to-mesenchymal transition interactome gene-expression signature is associated with claudin-low and metaplastic breast cancer subtypes. Proc. Natl. Acad. Sci. USA 2010, 107, 15449–15454. [Google Scholar] [CrossRef] [Green Version]
- Herschkowitz, J.I.; Simin, K.; Weigman, V.J.; Mikaelian, I.; Usary, J.; Hu, Z.; Rasmussen, K.E.; Jones, L.P.; Assefnia, S.; Chandrasekharan, S.; et al. Identification of conserved gene expression features between murine mammary carcinoma models and human breast tumors. Genome Biol. 2007, 8, R76. [Google Scholar] [CrossRef] [Green Version]
- Dias, K.; Dvorkin-Gheva, A.; Hallett, R.M.; Wu, Y.; Hassell, J.; Pond, G.R.; Levine, M.; Whelan, T.; Bane, A.L. Claudin-low breast cancer; clinical & pathological characteristics. PLoS ONE 2017, 12, e0168669. [Google Scholar]
- Havel, J.J.; Chowell, D.; Chan, T.A. The evolving landscape of biomarkers for checkpoint inhibitor immunotherapy. Nat. Rev. Cancer 2019, 19, 133–150. [Google Scholar] [CrossRef]
- Butt, A.Q.; Mills, K.H.G. Immunosuppressive networks and checkpoints controlling antitumor immunity and their blockade in the development of cancer immunotherapeutics and vaccines. Oncogene 2014, 33, 4623–4631. [Google Scholar] [CrossRef] [PubMed] [Green Version]
- Pommier, R.M.; Sanlaville, A.; Tonon, L.; Kielbassa, J.; Thomas, E.; Ferrari, A.; Sertier, A.S.; Hollande, F.; Martinez, P.; Tissier, A.; et al. Comprehensive characterization of claudin-low breast tumors reflects the impact of the cell-of-origin on cancer evolution. Nat. Commun. 2020, 11, 3431. [Google Scholar] [CrossRef] [PubMed]
- Bareche, Y.; Buisseret, L.; Gruosso, T.; Girard, E.; Venet, D.; Dupont, F.; Desmedt, C.; Larsimont, D.; Park, M.; Rothé, F.; et al. Unraveling Triple-Negative Breast Cancer Tumor Microenvironment Heterogeneity: Towards an Optimized Treatment Approach. J. Natl. Cancer Inst. 2020, 112, 708–719. [Google Scholar] [CrossRef] [Green Version]
- Damrauer, J.S.; Hoadley, K.A.; Chism, D.D.; Fan, C.; Tignanelli, C.J.; Wobker, S.E.; Yeh, J.J.; Milowsky, M.I.; Iyer, G.; Parker, J.S.; et al. Intrinsic subtypes of high-grade bladder cancer reflect the hallmarks of breast cancer biology. Proc. Natl. Acad. Sci. USA 2014, 111, 3110–3115. [Google Scholar] [CrossRef] [Green Version]
- Dienstmann, R.; Vermeulen, L.; Guinney, J.; Kopetz, S.; Tejpar, S.; Tabernero, J. Consensus molecular subtypes and the evolution of precision medicine in colorectal cancer. Nat. Rev. Cancer 2017, 17, 79–92. [Google Scholar] [CrossRef] [PubMed]
- Thanki, K.; Nicholls, M.E.; Gajjar, A.; Senagore, A.J.; Qiu, S.; Szabo, C.; Hellmich, M.R.; Chao, C. Consensus Molecular Subtypes of Colorectal Cancer and their Clinical Implications. Int. Biol. Biomed. J. 2017, 3, 105–111. [Google Scholar] [PubMed]
- Guinney, J.; Dienstmann, R.; Wang, X.; De Reyniès, A.; Schlicker, A.; Soneson, C.; Marisa, L.; Roepman, P.; Nyamundanda, G.; Angelino, P.; et al. The consensus molecular subtypes of colorectal cancer. Nat. Med. 2015, 21, 1350–1356. [Google Scholar] [CrossRef]
- Becht, E.; De Reyniès, A.; Giraldo, N.A.; Pilati, C.; Buttard, B.; Lacroix, L.; Selves, J.; Sautès-Fridman, C.; Laurent-Puig, P.; Fridman, W.H. Immune and stromal classification of Colorectal cancer is associated with molecular subtypes and relevant for precision immunotherapy. Clin. Cancer Res. 2016, 22, 4057–4066. [Google Scholar] [CrossRef] [Green Version]
- Mlecnik, B.; Bindea, G.; Kirilovsky, A.; Angell, H.K.; Obenauf, A.C.; Tosolini, M.; Church, S.E.; Maby, P.; Vasaturo, A.; Angelova, M.; et al. The tumor microenvironment and Immunoscore are critical determinants of dissemination to distant metastasis. Sci. Transl. Med. 2016, 8, 327ra326. [Google Scholar] [CrossRef]
- Dongre, A.; Weinberg, R.A. New insights into the mechanisms of epithelial–mesenchymal transition and implications for cancer. Nat. Rev. Mol. Cell Biol. 2019, 20, 69–84. [Google Scholar] [CrossRef]
- Rinkenbaugh, A.; Baldwin, A. The NF-κB Pathway and Cancer Stem Cells. Cells 2016, 5, 16. [Google Scholar] [CrossRef]
- Wu, Y.; Deng, J.; Rychahou, P.G.; Qiu, S.; Evers, B.M.; Zhou, B.P. Stabilization of Snail by NF-κB Is Required for Inflammation-Induced Cell Migration and Invasion. Cancer Cell 2009, 15, 416–428. [Google Scholar] [CrossRef] [Green Version]
- Jin, W. Role of JAK/STAT3 Signaling in the Regulation of Metastasis, the Transition of Cancer Stem Cells, and Chemoresistance of Cancer by Epithelial–Mesenchymal Transition. Cells 2020, 9, 217. [Google Scholar] [CrossRef] [Green Version]
- Chen, W.; Gao, Q.; Han, S.; Pan, F.; Fan, W. The CCL2/CCR2 axis enhances IL-6-induced epithelial-mesenchymal transition by cooperatively activating STAT3-Twist signaling. Tumor Biol. 2015, 36, 973–981. [Google Scholar] [CrossRef]
- Wan, S.; Zhao, E.; Kryczek, I.; Vatan, L.; Sadovskaya, A.; Ludema, G.; Simeone, D.M.; Zou, W.; Welling, T.H. Tumor-associated macrophages produce interleukin 6 and signal via STAT3 to promote expansion of human hepatocellular carcinoma stem cells. Gastroenterology 2014, 147, 1393–1404. [Google Scholar] [CrossRef] [Green Version]
- Yadav, A.; Kumar, B.; Datta, J.; Teknos, T.N.; Kumar, P. IL-6 promotes head and neck tumor metastasis by inducing epithelial-mesenchymal transition via the JAK-STAT3-SNAIL signaling pathway. Mol. Cancer Res. 2011, 9, 1658–1667. [Google Scholar] [CrossRef] [Green Version]
- Fu, X.T.; Dai, Z.; Song, K.; Zhang, Z.J.; Zhou, Z.J.; Zhou, S.L.; Zhao, Y.M.; Xiao, Y.S.; Sun, Q.M.; Ding, Z.; et al. Macrophage-secreted IL-8 induces epithelial-mesenchymal transition in hepatocellular carcinoma cells by activating the JAK2/STAT3/Snail pathway. Int. J. Oncol. 2015, 46, 587–596. [Google Scholar] [CrossRef] [Green Version]
- Qu, X.; Tang, Y.; Hua, S. Immunological approaches towards cancer and inflammation: A cross talk. Front. Immunol. 2018, 9, 563. [Google Scholar] [CrossRef] [Green Version]
- Liubomirski, Y.; Lerrer, S.; Meshel, T.; Rubinstein-Achiasaf, L.; Morein, D.; Wiemann, S.; Körner, C.; Ben-Baruch, A. Tumor-stroma-inflammation networks promote pro-metastatic chemokines and aggressiveness characteristics in triple-negative breast cancer. Front. Immunol. 2019, 10, 757. [Google Scholar] [CrossRef] [Green Version]
- Fougner, C.; Bergholtz, H.; Kuiper, R.; Norum, J.H.; Sørlie, T. Claudin-low-like mouse mammary tumors show distinct transcriptomic patterns uncoupled from genomic drivers. Breast Cancer Res. 2019, 21, 85. [Google Scholar] [CrossRef] [Green Version]
- Russo, E.; Santoni, A.; Bernardini, G. Tumor inhibition or tumor promotion? The duplicity of CXCR3 in cancer. J. Leukoc. Biol. 2020, 108, 673–685. [Google Scholar] [CrossRef] [PubMed]
- Harlin, H.; Meng, Y.; Peterson, A.C.; Zha, Y.; Tretiakova, M.; Slingluff, C.; McKee, M.; Gajewski, T.F. Chemokine expression in melanoma metastases associated with CD8 + T-CeII recruitment. Cancer Res. 2009, 69, 3077–3085. [Google Scholar] [CrossRef] [PubMed] [Green Version]
- Wendel, M.; Galani, I.E.; Suri-Payer, E.; Cerwenka, A. Natural killer cell accumulation in tumors is dependent on IFN-γ and CXCR3 ligands. Cancer Res. 2008, 68, 8437–8445. [Google Scholar] [CrossRef] [PubMed] [Green Version]
- Mullins, I.M.; Slingluff, C.L.; Lee, J.K.; Garbee, C.F.; Shu, J.; Anderson, S.G.; Mayer, M.E.; Knaus, W.A.; Mullins, D.W. CXC chemokine receptor 3 expression by activated CD8+ T cells is associated with survival in melanoma patients with stage III disease. Cancer Res. 2004, 64, 7697–7701. [Google Scholar] [CrossRef] [PubMed] [Green Version]
- Li, K.; Zhu, Z.; Luo, J.; Fang, J.; Zhou, H.; Hu, M.; Maskey, N.; Yang, G. Impact of chemokine receptor CXCR3 on tumor-infiltrating lymphocyte recruitment associated with favorable prognosis in advanced gastric cancer. Int. J. Clin. Exp. Pathol. 2015, 8, 14725–14732. [Google Scholar] [PubMed]
- Mikucki, M.E.; Fisher, D.T.; Matsuzaki, J.; Skitzki, J.J.; Gaulin, N.B.; Muhitch, J.B.; Ku, A.W.; Frelinger, J.G.; Odunsi, K.; Gajewski, T.F.; et al. Non-redundant requirement for CXCR3 signalling during tumoricidal T-cell trafficking across tumour vascular checkpoints. Nat. Commun. 2015, 6, 7458. [Google Scholar] [CrossRef]
- Tokunaga, R.; Zhang, W.; Naseem, M.; Puccini, A.; Berger, M.D.; Soni, S.; McSkane, M.; Baba, H.; Lenz, H.J. CXCL9, CXCL10, CXCL11/CXCR3 axis for immune activation—A target for novel cancer therapy. Cancer Treat. Rev. 2018, 63, 40–47. [Google Scholar] [CrossRef]
- Mulligan, A.M.; Raitman, I.; Feeley, L.; Pinnaduwage, D.; Nguyen, L.T.; O’Malley, F.P.; Ohashi, P.S.; Andrulis, I.L. Tumoral lymphocytic infiltration and expression of the chemokine CXCL10 in breast cancers from the ontario familial breast cancer registry. Clin. Cancer Res. 2013, 19, 336–346. [Google Scholar] [CrossRef] [Green Version]
- Kundu, N.; Ma, X.; Brox, R.; Fan, X.; Kochel, T.; Reader, J.; Tschammer, N.; Fulton, A. The Chemokine Receptor CXCR3 Isoform B Drives Breast Cancer Stem Cells. Breast Cancer Basic Clin. Res. 2019, 13. [Google Scholar] [CrossRef] [Green Version]
- Saahene, R.O.; Wang, J.; Wang, M.-L.; Agbo, E.; Song, H. The role of CXC chemokine ligand 4/CXC chemokine receptor 3-B in breast cancer progression. Biotech. Histochem. 2019, 94, 53–59. [Google Scholar] [CrossRef]
- Bronger, H.; Karge, A.; Dreyer, T.; Zech, D.; Kraeft, S.; Avril, S.; Kiechle, M.; Schmitt, M. Induction of cathepsin B by the CXCR3 chemokines CXCL9 and CXCL10 in human breast cancer cells. Oncol. Lett. 2017, 13, 4224–4230. [Google Scholar] [CrossRef]
- Jafarzadeh, A.; Fooladseresht, H.; Nemati, M.; Assadollahi, Z.; Sheikhi, A.; Ghaderi, A. Higher circulating levels of chemokine CXCL10 in patients with breast cancer: Evaluation of the influences of tumor stage and chemokine gene polymorphism. Cancer Biomark. 2016, 16, 545–554. [Google Scholar] [CrossRef]
- Ejaeidi, A.A.; Craft, B.S.; Puneky, L.V.; Lewis, R.E.; Cruse, J.M. Hormone receptor-independent CXCL10 production is associated with the regulation of cellular factors linked to breast cancer progression and metastasis. Exp. Mol. Pathol. 2015, 99, 163–172. [Google Scholar] [CrossRef]
- Zhu, G.; Yan, H.H.; Pang, Y.; Jian, J.; Achyut, B.R.; Liang, X.; Weiss, J.M.; Wiltrout, R.H.; Christine Hollander, M.; Yang, L. CXCR3 as a molecular target in breast cancer metastasis: Inhibition of tumor cell migration and promotion of host anti-tumor immunity. Oncotarget 2015, 6, 43408–43419. [Google Scholar] [CrossRef] [Green Version]
- Walser, T.C.; Rifat, S.; Ma, X.; Kundu, N.; Ward, C.; Goloubeva, O.; Johnson, M.G.; Medina, J.C.; Collins, T.L.; Fulton, A.M. Antagonism of CXCR3 inhibits lung metastasis in a murine model of metastatic breast cancer. Cancer Res. 2006, 66, 7701–7707. [Google Scholar] [CrossRef] [Green Version]
- Xiong, H.; Du, W.; Sun, T.T.; Lin, Y.W.; Wang, J.L.; Hong, J.; Fang, J.Y. A positive feedback loop between STAT3 and cyclooxygenase-2 gene may contribute to Helicobacter pylori-associated human gastric tumorigenesis. Int. J. Cancer 2014, 134, 2030–2040. [Google Scholar] [CrossRef]
- Wang, S.; Wang, L.; Wu, C.; Sun, S.; Pan, J.H. E2F2 directly regulates the STAT1 and PI3K/AKT/NF-κB pathways to exacerbate the inflammatory phenotype in rheumatoid arthritis synovial fibroblasts and mouse embryonic fibroblasts. Arthritis Res. Ther. 2018, 20, 225. [Google Scholar] [CrossRef] [Green Version]
- Sun, J.; Stetler-Stevenson, W.G. Overexpression of tissue inhibitors of metalloproteinase 2 up-regulates NF-κB activity in melanoma cells. J. Mol. Signal. 2009, 4, 4. [Google Scholar] [CrossRef] [Green Version]
- Jimenez-Sanchez, A.; Cast, O.; Miller, M.L. Comprehensive benchmarking and integration of tumor microenvironment cell estimation methods. Cancer Res. 2019, 79, 6238–6246. [Google Scholar] [CrossRef] [Green Version]


Publisher’s Note: MDPI stays neutral with regard to jurisdictional claims in published maps and institutional affiliations. |
© 2021 by the authors. Licensee MDPI, Basel, Switzerland. This article is an open access article distributed under the terms and conditions of the Creative Commons Attribution (CC BY) license (https://creativecommons.org/licenses/by/4.0/).
Share and Cite
Suárez-Arriaga, M.C.; Méndez-Tenorio, A.; Pérez-Koldenkova, V.; Fuentes-Pananá, E.M. Claudin-Low Breast Cancer Inflammatory Signatures Support Polarization of M1-Like Macrophages with Protumoral Activity. Cancers 2021, 13, 2248. https://doi.org/10.3390/cancers13092248
Suárez-Arriaga MC, Méndez-Tenorio A, Pérez-Koldenkova V, Fuentes-Pananá EM. Claudin-Low Breast Cancer Inflammatory Signatures Support Polarization of M1-Like Macrophages with Protumoral Activity. Cancers. 2021; 13(9):2248. https://doi.org/10.3390/cancers13092248
Chicago/Turabian StyleSuárez-Arriaga, Mayra Cecilia, Alfonso Méndez-Tenorio, Vadim Pérez-Koldenkova, and Ezequiel M. Fuentes-Pananá. 2021. "Claudin-Low Breast Cancer Inflammatory Signatures Support Polarization of M1-Like Macrophages with Protumoral Activity" Cancers 13, no. 9: 2248. https://doi.org/10.3390/cancers13092248
APA StyleSuárez-Arriaga, M. C., Méndez-Tenorio, A., Pérez-Koldenkova, V., & Fuentes-Pananá, E. M. (2021). Claudin-Low Breast Cancer Inflammatory Signatures Support Polarization of M1-Like Macrophages with Protumoral Activity. Cancers, 13(9), 2248. https://doi.org/10.3390/cancers13092248