Article

ATRX Alteration Contributes to Tumor Growth and Immune Escape in Pleomorphic Sarcomas

1
INSERM U1037, Cancer Research Center in Toulouse (CRCT), OncoSarc, 31000 Toulouse, France
2
IUCT-Oncopole, Institut Claudius Régaud, Department of Pathology, 31000 Toulouse, France
3
University of Toulouse 3, Paul Sabatier, 31000 Toulouse, France
4
Centre Hospitalier Universitaire (CHU) de Toulouse, IUCT-Oncopole, 31000 Toulouse, France
5
Inserm UMR1218, Action, Institut Bergonié, 33000 Bordeaux, France
6
CHU de Bordeaux, Department of Medical Genetics, 33000 Bordeaux, France
7
University of Bordeaux, 33000 Bordeaux, France
8
CNRS UMR5800, LaBRI, 33400 Talence, France
9
Institut Bergonie, Department of Pathology, 33000 Bordeaux, France
10
Centre Léon Bérard, Department of Medical Oncology, 69000 Lyon, France
11
Inserm U1052, CNRS 5286, Cancer Research Center of Lyon, University Claude Bernard Lyon 1, 69000 Lyon, France
*
Author to whom correspondence should be addressed.
These authors contributed equally.
Cancers 2021, 13(9), 2151; https://doi.org/10.3390/cancers13092151
Submission received: 23 March 2021 / Revised: 14 April 2021 / Accepted: 21 April 2021 / Published: 29 April 2021
(This article belongs to the Section Molecular Cancer Biology)

Abstract

:

Simple Summary

There is still no efficient systemic treatment for pleomorphic sarcomas. This study shows that 1/4 of them have an ATRX alteration that diminishes the immune response. This phenotype is related to the inhibition of mast cell recruitment upon ATRX alteration, which could be targeted to adapt immunotherapy against pleomorphic sarcomas.

Abstract

Whole genome and transcriptome sequencing of a cohort of 67 leiomyosarcomas has been revealed ATRX to be one of the most frequently mutated genes in leiomyosarcomas after TP53 and RB1. While its function is well described in the alternative lengthening of telomeres mechanism, we wondered whether its alteration could have complementary effects on sarcoma oncogenesis. ATRX alteration is associated with the down-expression of genes linked to differentiation in leiomyosarcomas, and to immunity in an additional cohort of 60 poorly differentiated pleomorphic sarcomas. In vitro and in vivo models showed that ATRX down-expression increases tumor growth rate and immune escape by decreasing the immunity load of active mast cells in sarcoma tumors. These data indicate that an alternative to unsuccessful targeting of the adaptive immune system in sarcoma could target the innate system. This might lead to a better outcome for sarcoma patients in terms of ATRX status.

1. Introduction

Pleomorphic sarcomas are a group of rare mesenchymal tumors comprising different histotypes, such as undifferentiated pleomorphic sarcoma (UPS), myxofibrosarcoma (MFS), dedifferentiated liposarcoma (DDLPS), osteosarcoma (OS), and leiomyosarcoma (LMS), which is the most frequent subtype [1]. LMS has a smooth muscle differentiation and can occur in any anatomical site, although there are three main locations: limbs, trunk, and uterus. Currently, the first-line treatment is wide-margin resection for localized tumors and anthracycline-based chemotherapy for advanced tumors [2]. However, these treatments are still not effective enough as 48 to 89% of LMS develop metastases depending on the tumor location, with a better outcome for patients with tumors in limbs, and the mortality rate is between 50 and 65% with a median survival of around 12 months [3,4]. From a genomic standpoint, LMS, like other pleomorphic sarcomas, have a very rearranged and unbalanced karyotype [2].
In a whole genome and whole transcriptome sequencing study conducted by our team, Darbo et al. showed that LMS could be separated into two groups with specific clinical, transcriptomic and genomic features: the homogenous and the other LMS. Those groups share a low somatic mutation burden and a high level of copy-number alterations [5]. But only three genes came out to be recurrently mutated (considering point mutations only), as also showed by the TCGA study [6]: TP53, RB1, and ATRX (mutated in 48.7%, 17.9%, and 12.8%, respectively). RB1 [7,8] and TP53 [9,10] are tumor suppressor genes that have long been known to be implicated in the oncogenesis of pleomorphic sarcomas. ATRX is a chromatin modifier gene with a Swi/Snf2 domain [11]. Its tumor suppressive function has so far been related to its role in the alternative lengthening of telomeres (ALT) mechanism, which is a way to elongate telomeres without telomerase activation [12], inducing genome instability [13] and leading to a poor prognosis of ATRX-altered tumors [14]. Recently, its involvement in senescence [15] and intrinsic immunity via its interactions within promyelocytic leukemia nuclear bodies (PML NBs) [16] was questioned. Here, we investigated whether ATRX might have additional impacts in the oncogenesis of pleomorphic sarcomas beyond its role in the ALT mechanism and show how its involvement in oncogenesis is also linked to differentiation, tumor growth, and immunity.

2. Material and Methods

2.1. Data Availability

Cohort 1: ICGC whole genome sequencing and RNA sequencing data for the 67 LMS are available at https://dcc.icgc.org/projects/LMS-FR.
Cohort 2: RNA-seq expressions are available on Gene Expression Omnibus under accession GSE71121. RNA-seq raw files (FastQ) are available on sequence read archive under accessions SRP059588 or SRP059588.
Mouse K7M2 tumor expression data are available on Gene Expression Omnibus (GEO) under accession GSE157953 and will be released on 09/01/2021 and available before by contacting the corresponding author.

2.2. Human Samples

Samples used in cohort 1 were collected prospectively by the French Sarcoma Group as part of the ICGC program (International Cancer Genome Consortium). Samples used in cohort 2 were part of the cohort used in Lesluyes et al. [17]. Clinico-pathological data and patient information are summarized in Table 1. All cases were systematically reviewed by expert pathologists of the French Sarcoma Group according to the World Health Organization guidelines [18]. In cohort 1, selected tumors were primarily untreated (before sampling), not superficial LMS without any additional criteria. In cohort 2, selected tumors were primarily untreated (before sampling) pleomorphic sarcoma. For each patient, frozen and FFPE samples of the primary tumor were collected before any treatment.
From those samples, DNA extraction, whole genome sequencing and analysis, RNA extraction, sequencing, and analysis, as well as annotation of variants and breakpoint detection can be found in the supplementary information and in Tables S4–S6.

2.3. Validation of ATRX Alterations

For cohort 1, all FS (frameshift) were verified at both DNA and RNA levels by Sanger sequencing. All SV (structural variants) were verified on DNA by Sanger sequencing, and the effect on RNA was detected by RNAseq. MS (missense) and NS (non-sense) mutations, not found in both Whole Genome sequencing and RNA sequencing, were verified by Sanger sequencing. Total loss of chrXq or chrX was seen in four females. This alteration induces a complete deletion of ATRX, but all cases expressed RNA expression and nuclear protein, implying that the loss occurred on the inactive X. One triploid tumor developed in a male also presented a deletion of the gene, but with one copy left. As one normal copy of the gene is expressed, they were all considered as wild type (WT) regarding ATRX alteration. For cohort 2, whole ATRX cDNA was sequenced by Sanger sequencing for all cases, and alterations found at RNA level were verified on DNA. Method details of PCR, RT-PCR, and Sanger sequencing can be found in the supplementary information.
Immunohistochemistry and immunofluorescence analyses are detailed in the supplementary information.

2.4. Cell Lines and Primary Culture

The cell lines MG63 (RRID:CVCL_0426; Male) and K7M2 (RRID:CVCL_V455; Female) were given by Dr. Françoise Redini. Those and HEK293T (RRID:CVCL_0063; Female) cells were cultured in DMEM (31-966-021, Life Technologies, Carlsbad, CA, USA). IB106 (UPS; Female) cell is a primary culture established as previously described [19] and was cultured in RPMI-1640 (524-000-025, Life Technologies, Carlsbad, CA, USA). Both medium were supplied with 10% fetal bovine serum (S1810-500, Dutscher, Brumath, France), and cells were kept at 37 °C in a humidified chamber containing 5% CO2.
Production and validation of stable ATRX knock-down cell lines, as well as in vitro analyses, can be found in the supplementary information.

2.5. In Vivo Experiment

All experiments were performed in conformity with the rules of the French Institutional Animal Care and Use Committee (approval number DAP-APAFiS-2018041617309605), and all efforts were made to minimize animal suffering. Mice were maintained under specific pathogen-free conditions in the animal facility of the University of Bordeaux (Bordeaux, France) or at the CREFRE (Centre Régional d’Exploration Fonctionnelle et Ressources Expérimentales, Toulouse, France).
For experiments with IB106 cells, 6–8-week-old female NSG (NOD.Cg-Prkdcscid Il2rgtm1Wjl/SzJ; RRID:BCBC_4142) mice were used. Ten mice were injected with 800,000 IB106 ATRXKD cells, and ten with 800,000 IB106 ATRXCT cells as controls. Mice were randomly assigned to one cage of five animals then each cage was randomly assigned to a group of cells. One mouse in the control group was excluded, due to an important and quick loss of weight, so the final number of units is n = 10 in the ATRXKD group and n = 9 in the ATRXCT one. Tumor sizes were blindly measured twice a week using a caliper, and their volume was calculated using the formula: (L2 × l)/2. At the end of the experiment, mice were sacrificed by cervical dislocation. Tumors were then weighed and divided into two parts for formalin fixation and nitrogen freezing. Each tumor was stained with HE and analyzed by a pathologist specialized in sarcomas. Growth rates were calculated with the segmental linear regression of GraphPad Prism (GraphPad Software, version 6, San Diego, CA, USA), and statistical analyses were done using an unpaired T-test.
For experiments with K7M2 cells, 6–8 weeks-old female NSG (NOD.Cg-Prkdcscid Il2rgtm1Wjl/SzJ; RRID:BCBC_4142) or Balb/c (Balb/cJ; RRID:IMSR_JAX:000651) mice were used. Four groups were made, each group was composed of 15 mice, one group of NSG mice was injected with 500,000 K7M2 ATRXKD cells, the other with 500,000 K7M2 ATRXCT cells as controls. The Balb/c mice were injected in the same conditions. Mice were randomly assigned to one cage of five animals then each cage was randomly assigned to a group of cells. One animal from the Balb/c ATRXCT group was excluded, due to a teeth malformation and an incapacity to eat, so the final number of units was n = 15 in each group except in this one which was n = 14. Tumor sizes were measured without knowing the affiliated group twice a week using a caliper, and their volume was calculated using the formula: (L2 × l)/2. At the end of the experiment, mice were sacrificed by cervical dislocation. Tumors were then weighed and divided into two parts for formalin fixation and nitrogen freezing. Each tumor was stained with HE and analyzed by a pathologist specialized in sarcomas. Growth rates were calculated with the segmental linear regression of GraphPad Prism (GraphPad Software, version 6, San Diego, CA, USA), and statistical analyses were done using an unpaired T-test. Survival curves were analyzed with GraphPad Prism using the Kaplan-Meier method.

2.6. Mice Tumor RNA Sequencing and Analysis

Total RNA was extracted, prepared, and sequenced as described in the supplementary information to obtain more than 20 million paired-end reads with a length of 75 bp each. Bioinformatic analysis was done as previously described [17].
RNA reads were aligned to the mm10 genome assembly with STAR v2.6.0c [20]. Low-quality (score < 20) and duplicated PCR paired-end reads were removed with SAMtools v1.8 [21] and PicardTools v2.18.2 [22] (http://broadinstitute.github.io/picard/), respectively. Then, gene expression was quantified with Cufflinks v2.2.1 [23], using RefSeq [24] genes (without miRNA and rRNA) from mm10 UCSC Table Browser [25] fixed on 2019/01.
Differential gene expression was performed by R package DESeq, between ATRXKD and ATRXCT tumors extracted from Balb/c mice. Relationships between proteins overexpressed in ATRXKD and ATRXCT tumors were assessed by the STRING Database [26].

2.7. Quantification and Statistical Analysis

Kaplan-Meier analyses were performed for metastasis-free survival and overall survival. To subdivide ATRX expression into two groups, expression was plotted for ATRX WT and altered cases, separately. The intersection between these two density curves was 4.45 (log2 FPKM) and 2.77 for cohort 1 and 2, respectively.
Differential gene expression (DGE) analyses were performed by R package DESeq. Gene Ontology (GO) analysis was performed on these differentially expressed genes (p < 0.05 and fold-change >2 or <−2), by R package GOseq. In parallel, significant genes with p < 0.01 were used to make a heatmap (R package ComplexHeatMap).
Every other statistical analysis detail can be found in each figure legend.

3. Results

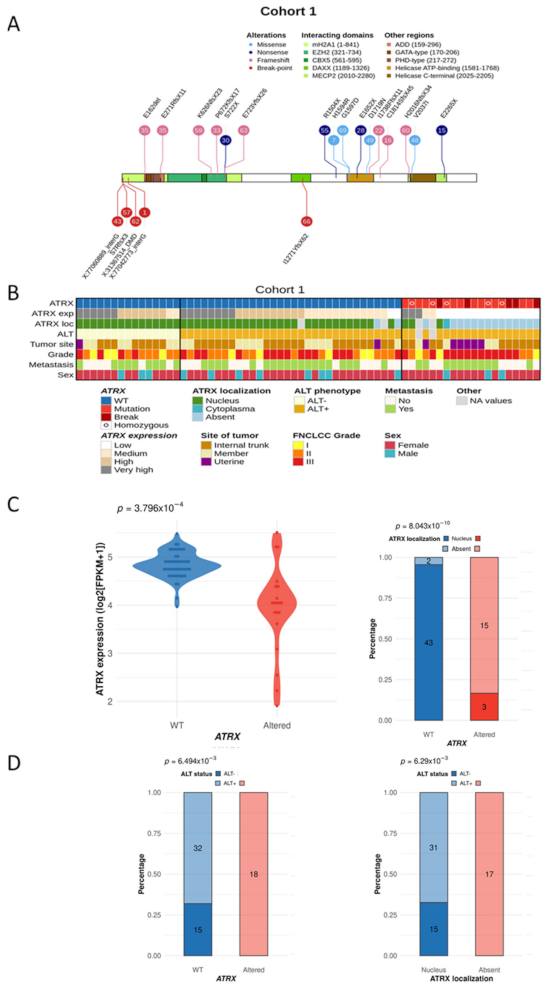
3.1. Distinct Genetic Alterations Trigger Loss of ATRX Protein in Leiomyosarcomas

Sixty-seven LMS (Cohort 1; Table 1) were sequenced at the whole genome, and transcriptome levels (67 LMS) and ATRX was identified as the third most frequently mutated gene after TP53 and RB1. By integrating point mutations and SV, ATRX is altered in 20 cases (29.8%; Figure 1A), with 8 point mutations (MS and NS; 40%), 7 FS (35%) and 5 SV (25%). All mutations and SV were validated by an independent technique (RNA sequencing and/or Sanger sequencing) (Tables S1 and S2). ATRX was altered in 23.7% of non-uterine LMS (14/59) compared to 75% of uterine LMS (6/8), which is significantly higher in this specific anatomical site (p = 0.007; Figure 1B and Figure S1). Altered cases were not enriched in any other clinical annotation (i.e., grade, metastasis, or sex). Regarding SV, 3 out of 5 led to a loss of ATRX expression, and the other two led to an FS (Table S1). These alterations were hemizygous in the three males, due to the location of ATRX on chromosome X (Xq21), and in two females with either deletion of the second allele (LMS69) or an isodisomy (LMS49). In the other 15 females, 93.3% of the alterations (14/15) occurred on the active X, as RNAseq analysis showed the altered transcript expression (Table S1). No expression of the mutated allele was detected in LMS48 (Figure 1B and Table S1). Alterations were distributed throughout the whole gene, but two regions were most frequently affected: one between exons 17 and 21 (40%, 6/15) and the other in exon 9 (33.4%, 5/15). At the mRNA level, mutated cases had a significantly lower ATRX expression than WT tumors (p = 0.000379; Figure 1C), and at the protein level, alterations led to a loss of nuclear protein (p < 0.0001; Figure 1C and Figure S2).

3.2. ATRX Alteration Is Linked to ALT Mechanism in Leiomyosarcomas

Since ATRX loss is linked to the ALT phenotype [27], the ALT status of tumors was determined. Most LMS were ALT-positive (ALT+, 76.9%, 50/65) (Figure 1B and Figure S3). Both ATRX alteration (p = 0.00649) and ATRX protein loss (p = 0.00629) were significantly associated with the ALT mechanism (Figure 1D). However, while all ATRX-altered cases were ALT+, most ALT+ cases were ATRX WT (64%, 32/50), with 93.3% of cases (28/30) expressing the protein in the nucleus (Figure 1B,D).

3.3. ATRX Alteration Is Not Associated with Prognosis in Leiomyosarcomas

Neither ATRX status (altered or WT), mRNA expression (below or above defined cut-off, see material and methods section), protein localization (nuclear or absent), nor ALT phenotype (positive or negative) could split patients into two groups with significantly distinct prognoses (Figure S4).

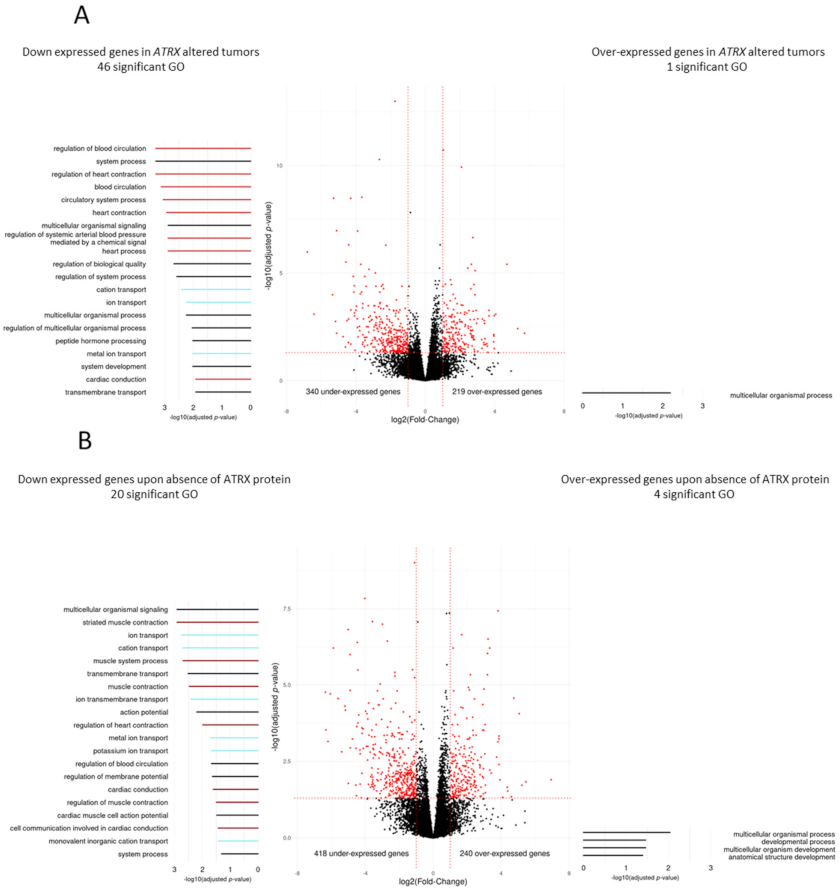
3.4. Differentiation Transcriptomic Programs Is Modified upon ATRX Alteration in Leiomyosarcomas

Searching for the oncogenic impact of these ATRX alterations, we tested whether altered tumors had a distinct transcriptomic program and identified 340 and 219 genes significantly down- and up-expressed in the ATRX-altered group, respectively (p < 0.05; Figure 2A). Functional enrichment analysis (Figure 2A) showed that genes down-expressed were significantly involved in blood pressure, heart contraction, and striated muscle contraction. These findings were strengthened when patients were grouped according to ATRX protein localization, since genes down-expressed upon protein loss were found to be involved in similar biological mechanisms, i.e., muscle system and contraction (Figure 2B).
As expected, clustering based on these 559 differentially expressed genes (Figure S5A) revealed a group with a high percentage of ATRX-altered patients (75%, 15/20). Patients in this cluster had tumors that were enriched in uterine or “other” LMS type (p < 0.0001; Figure S5B) [5]. “Other” LMS are less differentiated than “homogeneous” LMS and are thought to derive from fibroblasts rather than smooth muscle cells (SMC) [5].
The association between enrichment of down-expressed genes linked to muscle system and of oLMS in ATRX altered tumors suggested that either ATRX alteration preferentially occurs in partially or undifferentiated cells, or that it may induce dedifferentiation. To explore these hypotheses, we studied the ATRX status in a second cohort comprising poorly differentiated pleomorphic sarcomas characterized by RNAseq.

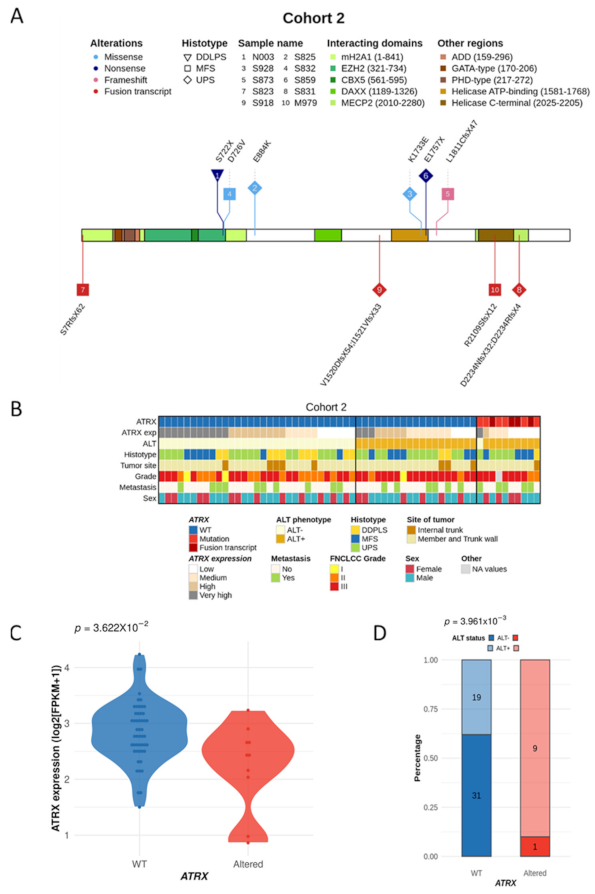
3.5. ATRX Alterations Are Recurrent and Similar in Poorly Differentiated Pleomorphic Sarcomas

RNA sequencing of 60 poorly differentiated pleomorphic sarcomas (cohort 2; Table 1) from a previously published cohort [17] was reanalyzed, and 10 ATRX-altered tumors (16.7%) were identified (Tables S1 and S3). The types of alteration, as well as their functional consequences, were similar to those detected in cohort 1 (Figure 3A). Altered cases were not enriched in any annotation (i.e., histotype, tumor site, grade, metastasis, or sex) (Figure 3B), but had a significantly lower mRNA expression of ATRX (p = 0.0362; Figure 3C) and were significantly associated with ALT (p = 0.00396; Figure 3D). ATRX-altered tumors did not have a distinct prognosis in cohort 2 (Figure S6A), nor when the two cohorts were merged (Figure S6B).

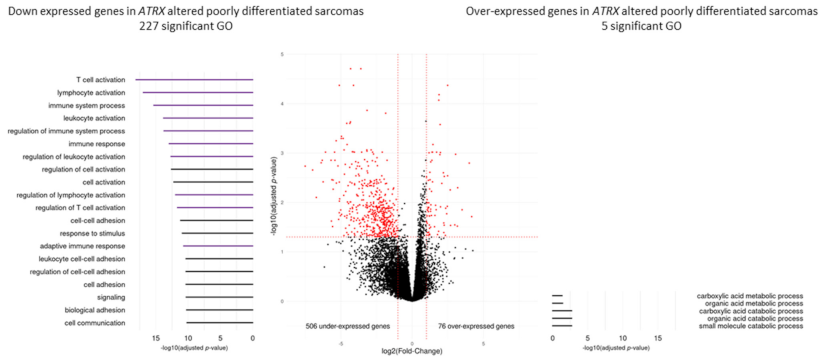
3.6. Immunity Transcriptomic Program Is Modified upon ATRX Alteration in Poorly Differentiated Pleomorphic Sarcomas

Functional enrichment analysis of differentially expressed genes showed that ATRX alteration induced the overexpression of 76 genes enriched in GO terms related to the metabolic process, and the down-expression of 506 genes enriched in GO related to immunity. The five most significantly enriched GO were (Figure 4) “T cell activation” (p < 0.0001), “lymphocyte activation” (p < 0.0001), “immune system process” (p < 0.0001), “leukocyte activation” (p < 0.0001) and “regulation of immune system process” (p < 0.0001).
Results from both cohorts indicated that ATRX alteration was associated with differentiation and immunity. Since this is particularly relevant as immunotherapies are currently not efficient in pleomorphic sarcomas, we functionally tested the hypothesis that ATRX alteration might modify the anti-tumor immune response.

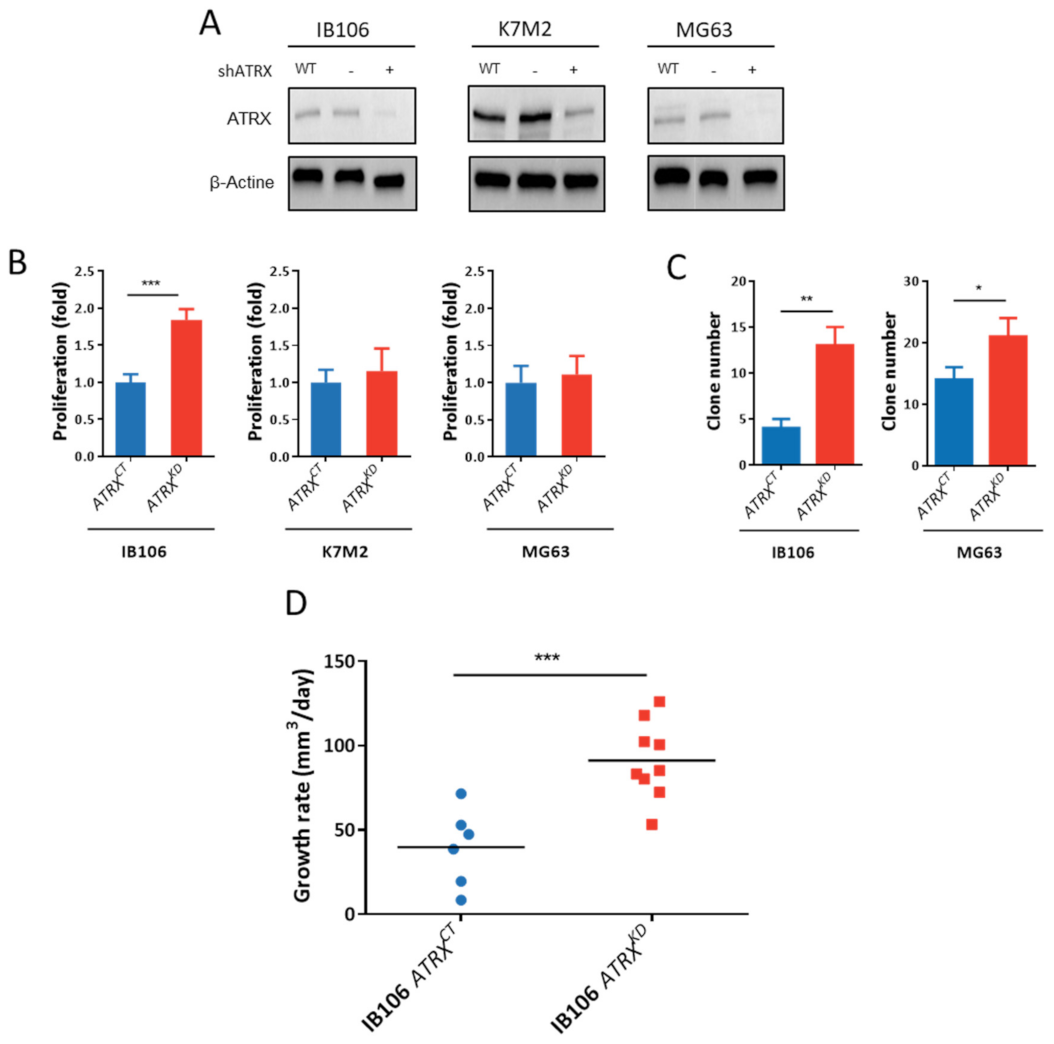
3.7. ATRX Knock-Down Impact Oncogenic Features toward Aggressiveness

To functionally test the impact of ATRX alterations, three models of ATRX knock-down (ATRXKD) were constructed: (i) A model to evaluate tumor growth in vitro and in vivo in a human UPS cell line (IB106), (ii) another to study immune response a syngeneic model was necessary, given that no such model exists for LMS or UPS, we used the mouse poorly differentiated osteosarcoma K7M2 (only available Balb/c syngeneic mouse cell line of poorly differentiated sarcoma with very close genetics to UPS and LMS) and (iii) a third to compare mouse osteosarcoma (K7M2) behavior to human, using a human osteosarcoma cell line (MG63). These cell lines were transduced by lentivirus with an ATRX shRNA. Western blot evidenced the successful extinction of ATRX in each cell line (Figure 5A). ALT analysis showed that ATRX shRNA did not change ALT status in any cell line (Figure S7A).
In vitro, a significant (p < 0.0001) increase in proliferation was observed in the UPS cell line IB106 ATRXKD, but not in OS cell lines (K7M2 and MG63) (Figure 5B). Colonies formed in soft agar assay revealed that the mouse cell line K7M2 was unable to form any colony with or without ATRX expression. In contrast, there was a significant increase in colony number in human cell lines IB106 and MG63 upon ATRX down-expression, from a mean of 14 to 21 colonies (p = 0.0026) and from 4 to 13 (p = 0.001), respectively (Figure 5C). Next, IB106 ATRXCT (control) and ATRXKD cells were subcutaneously grafted in 10 NSG mice each. A tumor grew in the 6/9 ATRXCT group and the 9/10 ATRXKD group. Tumor growth rates were three-fold higher in ATRXKD tumors (91.2 ± 7.6 mm3/day) than in ATRXCT tumors (32.9 ± 10.6 mm3/day) (p = 0.0005; Figure 5D).

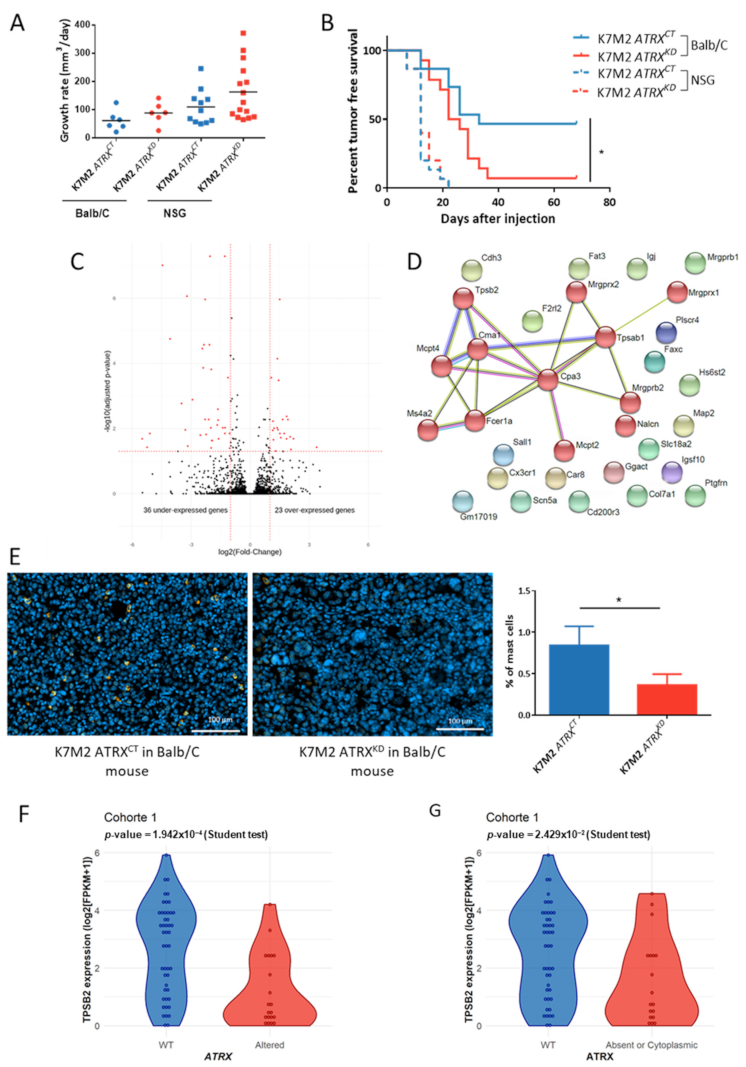
3.8. ATRX Knock down Modifies Anti-Tumor Immune Response In Vivo

The involvement of ATRX alteration in the immune escape was tested by grafting K7M2 ATRXCT and ATRXKD cells in immunodeficient NSG mice and immunocompetent Balb/c mice (n = 15 for each group). The growth rate was not significantly increased upon ATRX knock-down in any hosts (Figure 6A). Tumor-free survival in ATRXCT and ATRXKD models displayed no significant differences in immunodeficient NSG mice, whereas in immunocompetent Balb/c mice, there was 53.4% (8/13) of tumor induction with K7M2 ATRXCT versus 92.8% (13/14) with K7M2 ATRXKD. Therefore, tumor-free survival was significantly poorer upon ATRX knock-down (p = 0.0097; Figure 6B). These results display a higher likelihood of developing a poorly differentiated sarcoma with a low ATRX expression in an immunocompetent host.
Differential gene expression analysis between ATRXKD and ATRXCT K7M2 tumors in Balb/c mice revealed that 37 genes were down-regulated and 23 genes were overexpressed in ATRXKD tumors (Figure 6C). The low number of genes precluded any functional enrichment analysis. Consequently, a String Protein Interaction [26] analysis was performed. Whereas, no consistent clusters arose with up-regulated genes upon ATRX knock-down (Figure S7B), one emerged in down-regulated genes, with 12 proteins out of 37 linked to mast cell pathways (including TPSB2 coding tryptase, a widely used mast cells marker) (Figure 6D).
Immunofluorescence against tryptase on the murine tumors previously processed in RNAseq showed that mast cells expressing tryptase represented a mean of 0.8% of total cells in ATRXCT tumors, whereas they constituted 0.3% of ATRXKD tumors (p = 0.01; Figure 6E). This significant difference prompted us to assess whether the proportion of infiltrating mast cells in human sarcomas is also related to ATRX alteration and the absence of ATRX from the nucleus. In the undifferentiated sarcoma cohort, TPSB2 expression is decreased when ATRX is altered (based on RNAseq analysis) without reaching significance (p = 0.32; Figure S7C). Whereas, in the LMS cohort, which is deeply and fully characterized at both genome and protein levels for ATRX alteration, TPSB2 was significantly under-expressed in ATRX-altered cases (p = 0.00019; Figure 6F) and in tumors with no nuclear ATRX (p = 0.02; Figure 6G). These results indicate that there are most probably fewer infiltrating mast cells in these human sarcoma subtypes.

4. Discussion

This in-depth ATRX genetic analysis revealed that ATRX alteration likely affects a quarter of pleomorphic sarcomas, since it was found in 29.8% of LMS and 16.7% of poorly differentiated pleomorphic sarcomas. Cohort 2 is less deeply characterized (WGseq for cohort 1, RNAseq for cohort 2), so cases might be missed with this RNAseq-based screening (20.7% observed for UPS/MFS/DDLPS in TCGA [6]). The rate of alteration in LMS is consistent with the rate of 24% found by Chudasama and colleagues [28], but it is slightly higher than that generally observed in other LMS cohorts, which is around 16% [6,29,30], probably due to the exhaustiveness of WGseq. ATRX mutations were distributed across the entire gene, as previously observed [6,28,31,32]. Three main factors link the two types of sarcomas in the present study: (i) In females, all alterations except in LMS48 can be interpreted as occurring on the active X, (ii) point mutations are more frequent (75% in LMS and 60% in the US) than structural variations (25% in LMS and 40% in the US), as previously observed [6,28]; and (iii) the alterations lead preferentially to a frameshift, and thus, to a truncated protein in 66.7% of cases (20/30, 65% in LMS and 70% in the US), in agreement with previous descriptions in sarcomas [6,28,31,33]. Of note, ATRX alterations in the present study were not significantly associated with a poorer prognosis. However, this association depends on the cohorts studied [14,32] and was observed in only one cohort that mainly included missense mutations [32].
ATRX mutated cases were also linked to the location of LMS, i.e., 75% of uterine cases were ATRX-altered (6/8) which is consistent with the rate found by Slatter and colleagues in uterine LMS. In this cohort of uterine LMS (26 uterine LMS), ATRX loss was linked to a poorer prognosis [34]. In our cohort, all altered ATRX uterine LMS metastasized and 1 out of 2 in the ATRX wild-type group, but the limited number of uterine LMS does not allow us to do any statistical analysis. Loss of ATRX in uterine tumors is a key difference between benign and malignant tumors. In this location, it has been proposed to use ATRX loss as a marker of the highly probable evolution of benign tumors toward malignancy [35]. In other LMS locations, ATRX loss is linked to the “other” LMS group. LMS belonging to this subtype are mainly poorly differentiated and likely originate from fibroblastic cells [5]. Furthermore, as ATRX loss in LMS is associated with a lower expression of genes related to smooth muscle activity, we hypothesize that it occurs preferentially in poorly differentiated cells. The degree of cell differentiation may be crucial for the loss of ATRX to confer advantages to the precursor leiomyosarcoma cell.
ATRX knock-down modifies tumor cell proliferation, as confirmed in vivo, where ATRX knock-down tumors grew three-fold faster than controls, and clonogenicity in sarcoma models. Interestingly, poorly differentiated pleomorphic sarcomas with ATRX alteration overexpressed genes related to metabolism, whose upregulation is a known hallmark of cancers and supports cell survival and proliferation [36]. The hypothesis that ATRX could act through metabolism regulation is a very appealing one that now requires functional validation.
In vivo experimentation revealed a new role of ATRX, as its alteration was associated with a poorer outcome exclusively in an immunocompetent murine host, and with down-expression of immune-related genes in poorly differentiated pleomorphic human sarcomas. These two findings show that ATRX loss can influence the regulation of immune response in sarcomas, probably by limiting mast cell recruitment, as evidenced by the lower proportion of tumor-infiltrating mast cells upon ATRX down-expression. The role of mast cells in tumor control is currently considered as dual and antagonistic since they can support tumorigenesis or suppress tumor growth. Their role is dependent on the type of tumor [37]. To our knowledge, no study has yet investigated the role of mast cells in the oncogenesis of sarcomas. FcεRI and Ms4a2 are two down-expressed genes in ATRXKD K7M2 tumors. They are part of the IgE activating mast cell pathway that confers them a protective role in epithelial tumors [38]. In addition to their higher proportion, these mast cells present in ATRXWT tumors likely play a suppressor role in recruiting other immune cells to tumor sites by enhancing vascular permeability and direct chemoattraction [39]. In human LMS, the absence of ATRX is linked to the down-expression of TPSB2, which is a protein produced almost exclusively by mast cells and widely used to identify them. As in human sarcomas, immune cells are usually found in infiltrate, staining of mast cells in TMA would have introduced a bias of sampling. This analysis was, then, not performed. However, genes down-expressed by ATRX-altered poorly differentiated pleomorphic sarcomas are mostly linked to adaptive immune cell activation, so adaptive immune cells are either less present or less active. This could be achieved by avoiding the release of chemoattractants, and hence, the recruitment or activation of other immune cells. The precise mechanism involved in ATRX loss that changes the immune microenvironment of sarcomas needs to be deciphered.
Regarding ATRX expression, 27% of cases (17/63) showed no nuclear ATRX protein, which is consistent with the literature [14,31,32,40]. In tumors presenting FS/NS, 87.5% (14/16) exhibited no ATRX protein at all. In these cases, the ATRX mRNA level was low, likely meaning that if the truncated protein is expressed (missed by our screening with the C-terminal antibody), it should be very low. Moreover, if truncated proteins are expressed, the lost domains should be the same in all studied sarcoma types, with partial or complete loss of the helicase C-terminal domain in 90% of cases (18/20) and of both helicase domains in 70% of cases (14/20). As the majority of MS mutations occurred in one helicase domain (71.4%, 5/7) and IHC detected a nuclear localization of the protein, a decrease in ATRX enzymatic activity may be hypothesized [41]. Collectively, these results suggest that alterations of ATRX preferentially target its enzymatic functions rather than its protein-protein interactions, thus explaining why mutations in ATRX partner genes (i.e., DAXX, EZH2, SP100) are not frequent and not an alternative to ATRX alteration in sarcomas. We, thus, hypothesize that, by modifying its chromatin remodeling action, alterations of ATRX trigger a specific transcriptomic program that promotes attenuated mast cell recruitment, leading to the observed immune response in models and human tumors.
Our findings show that ATRX alterations are quite frequent in pleomorphic sarcomas (close to 25%) and mostly lead to the loss of ATRX. In addition, we demonstrate that ATRX alterations are not only associated with ALT phenotype, but also with a lower differentiation in LMS and immune response regulation in poorly differentiated pleomorphic sarcomas, most probably through non-recruitment of mast cells. Currently, most immunotherapies of sarcomas, which target the adaptive immune system and specifically T cells by helping them to recognize tumors, have a low response rate [42]. Indeed, several recent trials have assessed the response to checkpoint inhibitors, which are used to thwart immune system escape by activating CD8+ cytotoxic T cells [42], with an overall response rate not higher than 25% [43,44]. As targeting the adaptive immune system does not work well in sarcomas, some have tried to target the innate immune system, composed of mast cells, dendritic cells, macrophages, natural killers, and granulocytes, by making therapeutic vaccines that rely on the activation of dendritic cells in the presence of predetermined immunogenic antigen [42]. One trial presented 10 out of 23 patients who lived more than one year, whereas others died after around seven months [45], and another one showed a 1-year progression-free survival of 70.6% [46]. Targeting the innate system, such as mast cells might, therefore, lead to a better outcome for sarcoma patients. And it could be further improved by assessing ATRX status before testing mast cell-enhancing therapies, as they have been successful in other solid tumors [47]. These therapies enhanced local mast cell degranulation by using IgE antibodies, as proposed by Singer and Jensen-Jarolim [48]. This strategy could be useful in ATRXWT tumors to enhance the anti-tumoral action of mast cells, and in ATRX-altered sarcomas, to enhance mast cell recruitment and activation [49].

5. Conclusions

In conclusion, ATRX altered sarcomas represent roughly ¼ of LMS and of poorly differentiated sarcomas. ATRX alterations are mostly truncating and have a direct impact on the protein present in the nucleus. When ATRX is absent from tumors, their transcriptomes are modified toward a lower expression of muscle-related genes in LMS and of immune-related genes in poorly differentiated sarcomas. In cell models of the latter group, ATRX low expression is linked to a higher aggressiveness of tumors and a lower presence of mast cells in tumors. This low percentage could be the first step to the decrease of immune-related genes. This effect of ATRX alteration on the immune system could be used to develop new effective immunotherapies.

Supplementary Materials

The following are available online at https://www.mdpi.com/article/10.3390/cancers13092151/s1, Figure S1: Multiple correspondence analysis, Figure S2: Example of ATRX staining by immunohistochemistry, Figure S3: ALT status determined by PML/TERF2 immunofluorescence analysis, Figure S4: Kaplan-Meier analysis in leiomyosarcomas (Cohort 1), according to ATRX status (wild-type vs. altered), ATRX expression (high vs. low), ATRX localization (nucleus vs. absent) and ALT mechanism phenotype (ALT− vs. ALT+), Figure S5: Clustering with differentially expressed genes according to ATRX status, Figure S6: Kaplan-Meier analyses, Figure S7: shRNA against ATRX effect on sarcoma cell lines, Table S1: ATRX mutations and structural variants in both cohorts, Table S2: ATRX breakpoints in cohort 1, Table S3: ATRX fusion transcripts in cohort 2, Table S4: Genomic DNA primers used for point mutations and breakpoint validation, Table S5: Primers used for ATRX cDNA screening and validation of mutations, Table S6: Combination of primers used to detect fusion transcript in cohort 2, Supplementary methods.

Author Contributions

Conceptualization, L.D. (Lucie Darmusey), G.P., N.T. and F.C.; Formal analysis, L.D. (Lucie Darmusey), G.P., N.T., S.L.G., N.D., L.G., L.D. (Lucile Delespaul), T.L., E.D., A.G.-B., E.R., J.B. and L.L.; Funding acquisition, J.-M.C., J.-Y.B. and F.C.; Investigation, L.D. (Lucie Darmusey), G.P. and F.C.; Methodology, L.D. (Lucie Darmusey), G.P., N.T. and F.C.; Project administration, F.C.; Resources, G.P. and F.C.; Supervision, F.C.; Validation, L.D. (Lucie Darmusey), G.P. and N.T.; Visualization, L.D. (Lucie Darmusey), G.P. and N.T.; Writing—original draft, L.D. (Lucie Darmusey), G.P., N.T. and F.C.; Writing—review & editing, L.D. (Lucie Darmusey), G.P., N.T. and F.C. Other (data, expertise, and guidance): The French Sarcoma Group and the International Cancer Genome Consortium. All authors have read and agreed to the published version of the manuscript.

Funding

This research was funded by the Instituts Thematiques Multiorganismes (ITMO) Cancer and the International Cancer Genome Consortium.

Institutional Review Board Statement

The study was conducted according to the guidelines of the Declaration of Helsinki, and approved by the Ethics Committee of Comité de Protection des Personnes du Sud-Ouest et des Outre Mer III (DC2014/47 bis approved on 30 April 2014).

Informed Consent Statement

Informed consent was obtained from all subjects involved in the study.

Data Availability Statement

Publicly available datasets were analyzed in this study. This data can be found here: https://dcc.icgc.org/projects/LMS-FR. The other data presented in this study are openly available in Gene Expression Omnibus, reference number GSE71121 (human data) or GSE157953 (mouse data).

Acknowledgments

The authors would like to thank the Centre Nacional d’Anàlisi Genòmica (CNAG, Barcelona, Spain) for WG and RNA sequencing services. We acknowledge the personnel of CREFRE US006 and Animal Facility A2 for their technical assistance. We thank Mickaël Michaud for his technical and theoretical advice and Michel Charbonneau and Nathalie Grandin for their work on ALT detection in cell lines. We acknowledge Françoise Redini for providing us MG63 and K7M2 cell lines.

Conflicts of Interest

The authors declare no potential conflict of interest.

References

  1. Blay, J.-Y.; Soibinet, P.; Penel, N.; Bompas, E.; Duffaud, F.; Stoeckle, E.; Mir, O.; Adam, J.; Chevreau, C.; Bonvalot, S.; et al. Improved survival using specialized multidisciplinary board in sarcoma patients. Ann. Oncol. 2017, 28, 2852–2859. [Google Scholar] [CrossRef]
  2. Serrano, C.; George, S. Leiomyosarcoma. Hematol. Oncol. Clin. N. Am. 2013, 27, 957–974. [Google Scholar] [CrossRef]
  3. Nicolas, M.M.; Tamboli, P.; Gomez, J.A.; Czerniak, B.A. Pleomorphic and dedifferentiated leiomyosarcoma: Clinicopathologic and immunohistochemical study of 41 cases. Hum. Pathol. 2010, 41, 663–671. [Google Scholar] [CrossRef]
  4. Oda, Y.; Miyajima, K.; Kawaguchi, K.-I.; Tamiya, S.; Oshiro, Y.; Hachitanda, Y.; Oya, M.; Iwamoto, Y.; Tsuneyoshi, M. Pleomorphic Leiomyosarcoma: Clinicopathologic and Immunohistochemical Study with Special Emphasis on Its Distinction from Ordinary Leiomyosarcoma and Malignant Fibrous Histiocytoma. Am. J. Surg. Pathol. 2001, 25, 1030–1038. [Google Scholar] [CrossRef]
  5. Darbo, E.; Pérot, G.; Darmusey, L.; Guellec, S.L.; Leroy, L.; Gaston, L.; Desplat, N.; Thébault, N.; Merle, C.; Rochaix, P.; et al. SRF-MYOCD Axis Is the Targetable Driver of a Well Differentiated Aggressive Subtype of Leiomyosarcomas. bioRxiv 2020. [Google Scholar] [CrossRef]
  6. The Cancer Genome Atlas Research Network; Abeshouse, A.; Adebamowo, C.; Adebamowo, S.N.; Akbani, R.; Akeredolu, T.; Ally, A.; Anderson, M.L.; Anur, P.; Appelbaum, E.L.; et al. Comprehensive and Integrated Genomic Characterization of Adult Soft Tissue Sarcomas. Cell 2017, 171, 950–965.e28. [Google Scholar] [CrossRef] [PubMed] [Green Version]
  7. Isfort, R.J.; Cody, D.B.; Lovell, G.J.; Gioeli, D.; Weissman, B.E.; Doersen, C.J. Analysis of oncogene, tumor suppressor gene, and chromosomal alterations in HeLa x osteosarcoma somatic cell hybrids. Mol. Carcinog. 1999, 25, 30–41. [Google Scholar] [CrossRef]
  8. Calo, E.; Quintero-Estades, J.A.; Danielian, P.S.; Nedelcu, S.; Berman, S.D.; Lees, J.A. Rb regulates fate choice and lineage commitment in vivo. Nat. Cell Biol. 2010, 466, 1110–1114. [Google Scholar] [CrossRef] [Green Version]
  9. Pérot, G.; Chibon, F.; Montero, A.; Lagarde, P.; de Thé, H.; Terrier, P.; Guillou, L.; Ranchère, D.; Coindre, J.-M.; Aurias, A. Constant p53 Pathway Inactivation in a Large Series of Soft Tissue Sarcomas with Complex Genetics. Am. J. Pathol. 2010, 177, 2080–2090. [Google Scholar] [CrossRef]
  10. Rubio, R.; García-Castro, J.; Gutiérrez-Aranda, I.; Paramio, J.; Santos, M.; Catalina, P.; Leone, P.E.; Menendez, P.; Rodríguez, R. Deficiency in p53 but not Retinoblastoma Induces the Transformation of Mesenchymal Stem Cells In vitro and Initiates Leiomyosarcoma In vivo. Cancer Res. 2010, 70, 4185–4194. [Google Scholar] [CrossRef] [Green Version]
  11. Gibbons, R.J.; Picketts, D.J.; Villard, L.; Higgs, D.R. Mutations in a putative global transcriptional regulator cause X-linked mental retardation with α-thalassemia (ATR-X syndrome). Cell 1995, 80, 837–845. [Google Scholar] [CrossRef] [Green Version]
  12. Heaphy, C.M.; De Wilde, R.F.; Jiao, Y.; Klein, A.P.; Edil, B.H.; Shi, C.; Bettegowda, C.; Rodriguez, F.J.; Eberhart, C.G.; Hebbar, S.; et al. Altered Telomeres in Tumors with ATRX and DAXX Mutations. Science 2011, 333, 425. [Google Scholar] [CrossRef] [PubMed] [Green Version]
  13. Marzec, P.; Armenise, C.; Pérot, G.; Roumelioti, F.-M.; Basyuk, E.; Gagos, S.; Chibon, F.; Déjardin, J. Nuclear-Receptor-Mediated Telomere Insertion Leads to Genome Instability in ALT Cancers. Cell 2015, 160, 913–927. [Google Scholar] [CrossRef] [PubMed] [Green Version]
  14. Liau, J.-Y.; Tsai, J.-H.; Jeng, Y.-M.; Lee, J.-C.; Hsu, H.-H.; Yang, C.-Y. Leiomyosarcoma With Alternative Lengthening of Telomeres Is Associated with Aggressive Histologic Features, Loss of ATRX Expression, and Poor Clinical Outcome. Am. J. Surg. Pathol. 2015, 39, 236–244. [Google Scholar] [CrossRef]
  15. Kovatcheva, M.; Liu, D.D.; Dickson, M.A.; Klein, M.E.; O’Connor, R.; Wilder, F.O.; Socci, N.D.; Tap, W.D.; Schwartz, G.K.; Singer, S.; et al. MDM2 turnover and expression of ATRX determine the choice between quiescence and senescence in response to CDK4 inhibition. Oncotarget 2015, 6, 8226–8243. [Google Scholar] [CrossRef] [PubMed] [Green Version]
  16. Han, M.; Napier, C.E.; Frölich, S.; Teber, E.; Wong, T.; Noble, J.R.; Choi, E.H.Y.; Everett, R.D.; Cesare, A.J.; Reddel, R.R. Synthetic lethality of cytolytic HSV-1 in cancer cells with ATRX and PML deficiency. J. Cell Sci. 2019, 132. [Google Scholar] [CrossRef] [PubMed] [Green Version]
  17. Lesluyes, T.; Pérot, G.; Largeau, M.R.; Brulard, C.; Lagarde, P.; Dapremont, V.; Lucchesi, C.; Neuville, A.; Terrier, P.; Vince-Ranchère, D.; et al. RNA sequencing validation of the Complexity INdex in SARComas prognostic signature. Eur. J. Cancer 2016, 57, 104–111. [Google Scholar] [CrossRef]
  18. Fletcher, C.; Bridge, J.A.; Hogendoorn, P.; Mertens, F. WHO Classification of Tumours of Soft Tissue and Bone, 4th ed.; IARC Press: Lyon, France, 2013; Volume 5, ISBN 978-92-832-2434-1. [Google Scholar]
  19. Lagarde, P.; Brulard, C.; Pérot, G.; Mauduit, O.; Delespaul, L.; Neuville, A.; Stoeckle, E.; Le Guellec, S.; Rochaix, P.; Coindre, J.-M.; et al. Stable Instability of Sarcoma Cell Lines Genome Despite Intra-Tumoral Heterogeneity: A Genomic and Transcriptomic Study of Sarcoma Cell Lines. Austin J. Genet. Genomic Res. 2015, 2, 1014. [Google Scholar]
  20. Dobin, A.; Davis, C.A.; Schlesinger, F.; Drenkow, J.; Zaleski, C.; Jha, S.; Batut, P.; Chaisson, M.; Gingeras, T.R. STAR: Ultrafast universal RNA-seq aligner. Bioinformatics 2013, 29, 15–21. [Google Scholar] [CrossRef]
  21. Li, H.; Handsaker, B.; Wysoker, A.; Fennell, T.; Ruan, J.; Homer, N.; Marth, G.; Abecasis, G.; Durbin, R. The Sequence Alignment/Map Format and SAMtools. Bioinformatics 2009, 25, 2078–2079. [Google Scholar] [CrossRef] [Green Version]
  22. Broad Institute. Picard Tools; Version 2.17.8; Broad Institute, GitHub Repository. Available online: http://broadinstitute.github.io/picard/ (accessed on 21 February 2018).
  23. Trapnell, C.; Williams, B.A.; Pertea, G.; Mortazavi, A.; Kwan, G.; Van Baren, M.J.; Salzberg, S.L.; Wold, B.J.; Pachter, L. Transcript assembly and quantification by RNA-Seq reveals unannotated transcripts and isoform switching during cell differentiation. Nat. Biotechnol. 2010, 28, 511–515. [Google Scholar] [CrossRef] [PubMed] [Green Version]
  24. Pruitt, K.D.; Tatusova, T.; Brown, G.R.; Maglott, D.R. NCBI Reference Sequences (RefSeq): Current status, new features and genome annotation policy. Nucleic Acids Res. 2011, 40, D130–D135. [Google Scholar] [CrossRef] [Green Version]
  25. Karolchik, D.; Hinrichs, A.S.; Furey, T.S.; Roskin, K.M.; Sugnet, C.W.; Haussler, D.; Kent, W.J. The UCSC Table Browser data retrieval tool. Nucleic Acids Res. 2004, 32, D493–D496. [Google Scholar] [CrossRef] [PubMed]
  26. Szklarczyk, D.; Gable, A.L.; Lyon, D.; Junge, A.; Wyder, S.; Huerta-Cepas, J.; Simonovic, M.; Doncheva, N.T.; Morris, J.H.; Bork, P.; et al. STRING v11: Protein–protein association networks with increased coverage, supporting functional discovery in genome-wide experimental datasets. Nucleic Acids Res. 2019, 47, D607–D613. [Google Scholar] [CrossRef] [PubMed] [Green Version]
  27. Clynes, D.; Jelinska, C.; Xella, B.; Ayyub, H.; Scott, C.; Mitson, M.; Taylor, S.S.; Higgs, D.R.; Gibbons, R.J. Suppression of the alternative lengthening of telomere pathway by the chromatin remodelling factor ATRX. Nat. Commun. 2015, 6, 7538. [Google Scholar] [CrossRef] [PubMed]
  28. Chudasama, P.; Mughal, S.S.; Sanders, M.A.; Hübschmann, D.; Chung, I.; Deeg, K.I.; Wong, S.-H.; Rabe, S.; Hlevnjak, M.; Zapatka, M.; et al. Integrative genomic and transcriptomic analysis of leiomyosarcoma. Nat. Commun. 2018, 9, 144. [Google Scholar] [CrossRef] [PubMed] [Green Version]
  29. Lee, P.J.; Yoo, N.S.; Hagemann, I.S.; Pfeifer, J.D.; Cottrell, C.E.; Abel, H.J.; Duncavage, E.J. Spectrum of mutations in leiomyosarcomas identified by clinical targeted next-generation sequencing. Exp. Mol. Pathol. 2017, 102, 156–161. [Google Scholar] [CrossRef]
  30. Watson, L.A.; Goldberg, H.; Bérubé, N.G. Emerging roles of ATRX in cancer. Epigenomics 2015, 7, 1365–1378. [Google Scholar] [CrossRef] [PubMed]
  31. Ren, X.; Tu, C.; Tang, Z.; Ma, R.; Li, Z. Alternative lengthening of telomeres phenotype and loss of ATRX expression in sarcomas (Review). Oncol. Lett. 2018, 15, 7489–7496. [Google Scholar] [CrossRef] [Green Version]
  32. Yang, C.-Y.; Liau, J.-Y.; Huang, W.-J.; Chang, Y.-T.; Chang, M.-C.; Lee, J.-C.; Tsai, J.-H.; Su, Y.-N.; Hung, C.-C.; Jeng, Y.-M. Targeted next-generation sequencing of cancer genes identified frequent TP53 and ATRX mutations in leiomyosarcoma. Am. J. Transl. Res. 2015, 7, 2072–2081. [Google Scholar]
  33. Chen, X.; Bahrami, A.; Pappo, A.; Easton, J.; Dalton, J.; Hedlund, E.; Ellison, D.; Shurtleff, S.; Wu, G.; Wei, L.; et al. Recurrent Somatic Structural Variations Contribute to Tumorigenesis in Pediatric Osteosarcoma. Cell Rep. 2014, 7, 104–112. [Google Scholar] [CrossRef] [PubMed] [Green Version]
  34. Slatter, T.L.; Hsia, H.; Samaranayaka, A.; Sykes, P.; Clow, W.; Devenish, C.J.; Sutton, T.; Royds, J.A.; Ip, P.P.C.; Cheung, A.N.; et al. Loss of ATRX and DAXX expression identifies poor prognosis for smooth muscle tumours of uncertain malignant potential and early stage uterine leiomyosarcoma. J. Pathol. Clin. Res. 2015, 1, 95–105. [Google Scholar] [CrossRef] [PubMed] [Green Version]
  35. Ahvenainen, T.V.; Mäkinen, N.M.; von Nandelstadh, P.; Vahteristo, M.E.A.; Pasanen, A.M.; Bützow, R.C.; Vahteristo, P.M. Loss of ATRX/DAXX expression and alternative lengthening of telomeres in uterine leiomyomas. Cancer 2018, 124, 4650–4656. [Google Scholar] [CrossRef] [PubMed] [Green Version]
  36. DeBerardinis, R.J.; Chandel, N.S. Fundamentals of cancer metabolism. Sci. Adv. 2016, 2, e1600200. [Google Scholar] [CrossRef] [Green Version]
  37. Komi, D.E.A.; Redegeld, F.A. Role of Mast Cells in Shaping the Tumor Microenvironment. Clin. Rev. Allergy Immunol. 2019, 58, 313–325. [Google Scholar] [CrossRef] [Green Version]
  38. Crawford, G.; Hayes, M.D.; Seoane, R.C.; Ward, S.; Dalessandri, T.; Lai, C.; Healy, E.; Kipling, D.; Proby, C.; Moyes, C.; et al. Epithelial damage and tissue γδ T cells promote a unique tumor-protective IgE response. Nat. Immunol. 2018, 19, 859–870. [Google Scholar] [CrossRef]
  39. Oldford, S.A.; Haidl, I.D.; Howatt, M.A.; Leiva, C.A.; Johnston, B.; Marshall, J.S. A Critical Role for Mast Cells and Mast Cell-Derived IL-6 in TLR2-Mediated Inhibition of Tumor Growth. J. Immunol. 2010, 185, 7067–7076. [Google Scholar] [CrossRef]
  40. Koelsche, C.; Renner, M.; Johann, P.; Leiss, I.; Sahm, F.; Schimmack, S.; Wardelmann, E.; Renker, E.-K.; Schirmacher, P.; Korshunov, A.; et al. Differential nuclear ATRX expression in sarcomas. Histopathology 2015, 68, 738–745. [Google Scholar] [CrossRef]
  41. Mitson, M.; Kelley, L.A.; Sternberg, M.J.E.; Higgs, D.R.; Gibbons, R.J. Functional significance of mutations in the Snf2 domain of ATRX. Hum. Mol. Genet. 2011, 20, 2603–2610. [Google Scholar] [CrossRef] [Green Version]
  42. Ayodele, O.; Razak, A.R.A. Immunotherapy in Soft-Tissue Sarcoma. Curr. Oncol. 2020, 27, 17–23. [Google Scholar] [CrossRef]
  43. D’Angelo, S.P.; Mahoney, M.R.; Van Tine, B.A.; Atkins, J.; Milhem, M.M.; Jahagirdar, B.N.; Antonescu, C.R.; Horvath, E.; Tap, W.D.; Schwartz, G.K.; et al. Nivolumab with or without ipilimumab treatment for metastatic sarcoma (Alliance A091401): Two open-label, non-comparative, randomised, phase 2 trials. Lancet Oncol. 2018, 19, 416–426. [Google Scholar] [CrossRef]
  44. Wilky, B.A.; Trucco, M.M.; Subhawong, T.K.; Florou, V.; Park, W.; Kwon, D.; Wieder, E.D.; Kolonias, D.; Rosenberg, A.E.; Kerr, D.A.; et al. Axitinib plus pembrolizumab in patients with advanced sarcomas including alveolar soft-part sarcoma: A single-centre, single-arm, phase 2 trial. Lancet Oncol. 2019, 20, 837–848. [Google Scholar] [CrossRef]
  45. Dillman, R.; Barth, N.; Selvan, S.; Beutel, L.; De Leon, C.; DePriest, C.; Peterson, C.; Nayak, S. Phase I/II Trial of Autologous Tumor Cell Line–Derived Vaccines for Recurrent or Metastatic Sarcomas. Cancer Biotherapy Radiopharm. 2004, 19, 581–588. [Google Scholar] [CrossRef]
  46. Finkelstein, S.E.; Iclozan, C.; Bui, M.M.; Cotter, M.J.; Ramakrishnan, R.; Ahmed, J.; Noyes, D.R.; Cheong, D.; Gonzalez, R.J.; Heysek, R.V.; et al. Combination of External Beam Radiotherapy (EBRT) With Intratumoral Injection of Dendritic Cells as Neo-Adjuvant Treatment of High-Risk Soft Tissue Sarcoma Patients. Int. J. Radiat. Oncol. 2012, 82, 924–932. [Google Scholar] [CrossRef] [PubMed] [Green Version]
  47. Oldford, S.A.; Marshall, J.S. Mast cells as targets for immunotherapy of solid tumors. Mol. Immunol. 2015, 63, 113–124. [Google Scholar] [CrossRef]
  48. Singer, J.; Jensen-Jarolim, E. IgE-based immunotherapy of cancer: Challenges and chances. Allergy 2013, 69, 137–149. [Google Scholar] [CrossRef]
  49. Teo, P.Z.; Utz, P.J.; Mollick, J.A. Using the allergic immune system to target cancer: Activity of IgE antibodies specific for human CD20 and MUC1. Cancer Immunol. Immunother. 2012, 61, 2295–2309. [Google Scholar] [CrossRef] [Green Version]
Figure 1. ATRX status and integrated representation in leiomyosarcomas. (A) ATRX alterations are color-coded according to their type (legend at the top). Numbers in bubbles represent tumor samples. Consequences of all point mutations on ATRX protein are annotated above a schematic representation of the protein, or below for two structural variants (LMS57 and LMS66). For the other three structural variants, annotations correspond to the break-point partner in genomic coordinates. (B) The integrated representation shows ATRX alterations, ATRX mRNA expression (by quartile), ATRX localization, ALT mechanism phenotype, tumor site, FNCLCC grade, presence or not of metastasis, and sex of each patient. Tumors are ordered by ATRX status, ALT phenotype, mRNA expression, and protein localization. (C) Association between ATRX alteration and its mRNA expression (log2 (FPKM + 1)) (left) or its protein localization (right). (D) Relation between ATRX status (left) or its protein localization (right) and ALT mechanism phenotype. For ATRX localization, the “absent” group means “not at the nucleus”, including all cases without expression and the case with a cytoplasmic localization (LMS16). p-values were calculated with Student test for (C)—left and with Fisher test for (C)—right and (D).
Cancers 13 02151 g001
Figure 2. Differential gene expression and Gene Ontology analyses according to ATRX alteration in leiomyosarcomas (Cohort 1). Differentially expressed genes according to (A) ATRX status (wild-type vs. altered) or (B) ATRX expression (nucleus vs. absent). Red dots indicate significant genes (p ≤ 0.05 and fold-change ≤−2 or ≥2). Gene Ontology (GO) analyses, represented on the left (under-expressed genes) and the right (over-expressed genes), identified 46 and 1 significant GO terms (p ≤ 0.05), respectively in (A) and 20 and 4 significant GO terms (p ≤ 0.05) in (B). On each side, the 20 most significant GO terms are represented and color-coded by mechanisms; light red, dark red, light blue, and black colors indicate “circulatory system process”, “muscle system process”, “ion transport” and general terms, respectively. For ATRX localization, the “absent” group means “not at the nucleus”, including all cases without expression and the case with a cytoplasmic localization (LMS16). All p-values were adjusted by Benjamini and Hochberg method.
Cancers 13 02151 g002
Figure 3. ATRX alterations and integrated representation in poorly differentiated pleomorphic sarcomas (cohort 2). (A) ATRX alterations are color-coded by their type, and shapes represent histotypes. Numbers in bubbles indicate a tumor sample (legend at the top). Translated consequences on ATRX protein is annotated above a protein schematic representation for mutations, or be-low for fusion transcripts. (B) Integrated representation shows ATRX alterations, mRNA expression (by quartile), ALT mechanism phenotype, histotypes, tumor site, FNCLCC grade, presence or not of metastasis and sex of each patient. Tumors are ordered by ATRX status, ALT phenotype, mRNA expression and histotypes. (C) Association between ATRX status and its mRNA expression (log2(FPKM+1)). (D) Relation between ATRX status and ALT phenotype.
Cancers 13 02151 g003
Figure 4. Differential gene expression and Gene Ontology analyses according to ATRX status (wild-type vs. altered) in poorly differentiated pleomorphic sarcomas (Cohort 2). Differentially expressed genes in ATRX-altered tumors are represented in red (p ≤ 0.05 and fold-change ≤−2 or ≥2). Gene Ontology (GO) analyses, represented on the left (under-expressed genes) and the right (over-expressed genes), identified 227 and five significant GO terms (p ≤ 0.05), respectively. On the left, the 20 most significant GO terms are represented and color-coded by mechanism; purple and black groups indicate “immunity system process” and general terms, respectively. All p-values were adjusted by Benjamini and Hochberg method.
Cancers 13 02151 g004
Figure 5. ATRX knock-down increases the aggressiveness of sarcoma cells. (A) ATRX knock-down by shRNA validation in western blot in K7M2, MG63, and IB106 cell lines. (B) Proliferation analysis by MTT after four days, comparing ATRXCT and ATRXKD cells in K7M2, MG63, and IB106 cell lines (mean ± s.d.; n = 3 independent experiments). (C) Soft agar assay analysis comparing ATRXCT and ATRXKD cells in K7M2, MG63, and IB106 cell lines (mean ± s.d.; n = four independent experiments). Images were taken after four weeks and crystal violet staining. (D) Tumor growth rate analysis of IB106 ATRXCT or IB106 ATRXKD cells sub-cutaneous xenografts on NSG mice (n = 10 in each group). The growth rate was calculated by segmental linear regression with GraphPad. * p ≤ 0.05, ** p ≤ 0.01, *** p ≤ 0.001, p-value was calculated with 2-way ANOVA for (A) and unpaired t-test for (BD).
Cancers 13 02151 g005
Figure 6. ATRX knock-down allows immune escape of sarcomas via non-recruitment of mast cells. (A) Tumor growth rate analysis of K7M2 ATRXCT or K7M2 ATRXKD cells xenografted under the skin of NSG or Balb/c mice (n = 15 in each group). (B) Tumor-free survival curves of K7M2 ATRXCT or ATRXKD tumors in immunodeficient NSG mice and immunocompetent Balb/c mice (n = 15 mice for each condition) using Kaplan-Meier method. (C) Comparison of RNA expression in log2 (FPKM + 1) of K7M2 ATRXKD tumors versus K7M2 ATRXCT tumors developed in immunocompetent mice (n = 4 each) showing 23 and 37 significantly up- and down-expressed genes in K7M2 ATRXKD tumors, respectively. (D) Links between down-expressed genes in K7M2 ATRXKD tumors found by the STRING Database showing one cluster with genes involved in mast cells via MCL clustering. (E) Immunostaining of mast cells by targeting tryptase in K7M2 ATRXCT and K7M2 ATRXKD tumor tissues with nucleus marked with DAPI. On the right, percent of mast cells in the two conditions. (F) TPSB2 mRNA expression in log2 (FPKM + 1) according to ATRX status in cohort 1. (G) TPSB2 mRNA expression in log2 (FPKM + 1) according to ATRX localization in cohort 1. * p ≤ 0.05, p-value was calculated with Mantel-Cox test for (B) and unpaired t-test for (EG).
Cancers 13 02151 g006
Table 1. Clinical characteristics in both cohorts, related to Figures 1 and 3. LMS, leiomyosarcoma; UPS, undifferentiated pleomorphic sarcoma; MFS, myxofibrosarcoma; DDLPS, dedifferentiated liposarcoma.
Cohort1 (n = 67)Cohort2 (n = 60)
Follow-up (years)
Median5.225.94
Range1.48–19.770.01–28.88
Age at diagnosis (years)
Mean62.9462.95
Median6464.5
Range22–8020–87
Gender
Female53 (78.46%)22 (36.67%)
Male14 (21.54%)38 (63.33%)
Tumor site
Internal trunk389
Uterine80
Member and Trunk wall2151
Tumor depth
Deep5642
Superficial75
Superficial and deep413
Tumor size (cm)
Median88
Range1.5–231–30
Histotype
LMS670
UPS030
MFS017
DDLPS013
FNCLCC Grade
I123
II2317
III3239
Unknown01
Resection status, margins
R04224
R11828
R212
Unknown66
Publisher’s Note: MDPI stays neutral with regard to jurisdictional claims in published maps and institutional affiliations.

