
A Single-Run Next-Generation Sequencing (NGS) Assay for the Simultaneous Detection of Both Gene Mutations and Large Chromosomal Abnormalities in Patients with Myelodysplastic Syndromes (MDS) and Related Myeloid Neoplasms

 , , , ,
  ,
,  ,
,  ,
,
Abstract
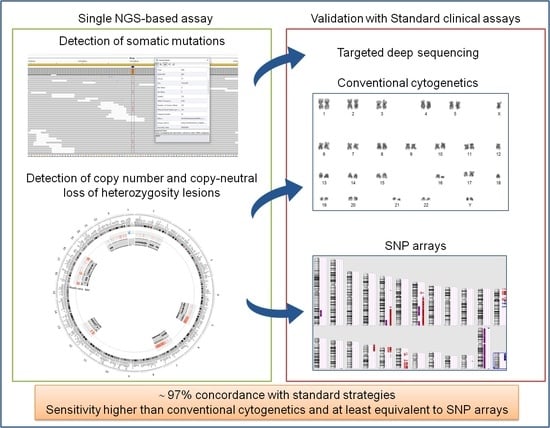
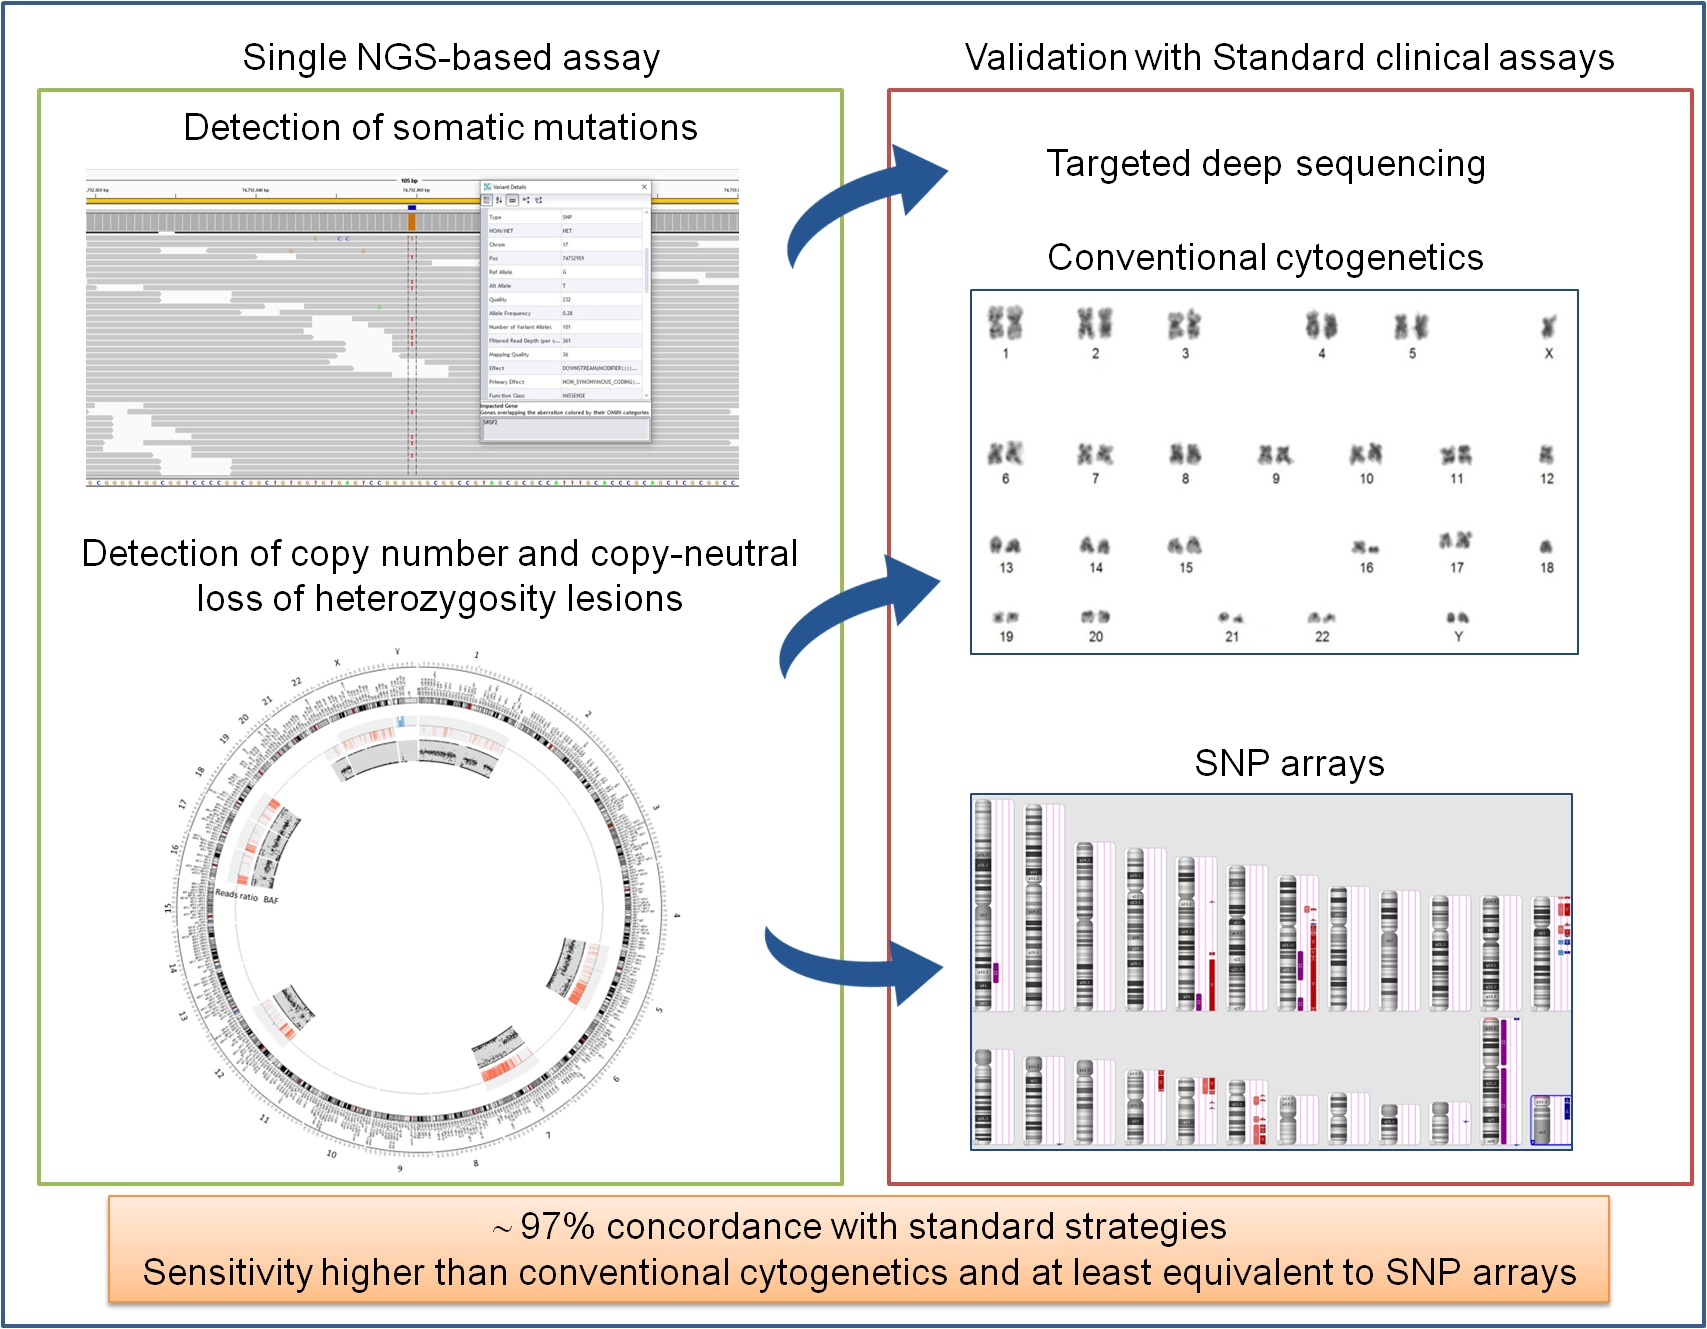
Simple Summary
Abstract
1. Introduction
2. Materials and Methods
2.1. Patients and Samples
2.2. Conventional Cytogenetics
2.3. Molecular Karyotyping
2.4. Library Preparation and Sequencing
2.5. Bioinformatic Data Analysis
2.5.1. Somatic Mutations
2.5.2. Copy Number Alterations
3. Results
3.1. Detection of Somatic Mutations
3.2. Detection of Copy Number Changes from Conventional Cytogenetics and SNP Arrays
3.3. Detection of Copy Number Changes from NGS Data
3.4. Detection of Copy-Neutral Loss of Heterozygosity Lesions from SNP Arrays and NGS Data
3.5. Correlation between CNAs and Mutations Detected by NGS
3.6. Clonality Studies and Breakpoint Definition of Del(5q), Del(7q), and Monosomy 7
3.7. Patient Classification after NGS Finding Integration
4. Discussion
5. Conclusions
Supplementary Materials
Author Contributions
Funding
Institutional Review Board Statement
Informed Consent Statement
Data Availability Statement
Conflicts of Interest
References
- Arber, D.A.; Orazi, A.; Hasserjian, R.; Thiele, J.; Borowitz, M.J.; Le Beau, M.M.; Bloomfield, C.D.; Cazzola, M.; Vardiman, J.W. The 2016 revision to the World Health Organization classification of myeloid neoplasms and acute leukemia. Blood 2016, 127, 2391–2405. [Google Scholar] [CrossRef]
- WHO Classification of Tumours of Haematopoietic and Lymphoid Tissues. In WHO Classification of Tumours, Revised 4th ed.; Swerdlow, S.H., Campo, E., Harris, N.L., Jaffe, E.S., Pileri, S.A., Stein, H.T.J., Eds.; International Agency for Research on Cancer: Lyon, France, 2017; Volume 2. [Google Scholar]
- Schanz, J.; Tüchler, H.; Solé, F.; Mallo, M.; Luño, E.; Cervera, J.; Granada, I.; Hildebrandt, B.; Slovak, M.L.; Ohyashiki, K.; et al. New comprehensive cytogenetic scoring system for primary myelodysplastic syndromes (MDS) and oligoblastic acute myeloid leukemia after MDS derived from an international database merge. J. Clin. Oncol. 2012, 30, 820–829. [Google Scholar] [CrossRef]
- Such, E.; Cervera, J.; Costa, D.; Solé, F.; Vallespí, T.; Luño, E.; Collado, R.; Calasanz, M.J.; Hernández-Rivas, J.M.; Cigudosa, J.C.; et al. Cytogenetic risk stratification in chronic myelomonocytic leukemia. Haematologica 2011, 96, 375–383. [Google Scholar] [CrossRef]
- Haase, D.; Germing, U.; Schanz, J.; Pfeilstöcker, M.; Nösslinger, T.; Hildebrandt, B.; Kundgen, A.; Lübbert, M.; Kunzmann, R.; Giagounidis, A.A.N.; et al. New insights into the prognostic impact of the karyotype in MDS and correlation with subtypes: Evidence from a core dataset of 2124 patients. Blood 2007, 110, 4385–4395. [Google Scholar] [CrossRef]
- Papaemmanuil, E.; Gerstung, M.; Malcovati, L.; Tauro, S.; Gundem, G.; Van Loo, P.; Yoon, C.J.; Ellis, P.; Wedge, D.C.; Pellagatti, A.; et al. Clinical and biological implications of driver mutations in myelodysplastic syndromes. Blood 2013, 122, 3616–3627, quiz 3699. [Google Scholar] [CrossRef]
- Haferlach, T.; Nagata, Y.; Grossmann, V.; Okuno, Y.; Bacher, U.; Nagae, G.; Schnittger, S.; Sanada, M.; Kon, A.; Alpermann, T.; et al. Landscape of genetic lesions in 944 patients with myelodysplastic syndromes. Leukemia 2014, 28, 241–247. [Google Scholar] [CrossRef] [PubMed]
- Elena, C.; Gallì, A.; Such, E.; Meggendorfer, M.; Germing, U.; Rizzo, E.; Cervera, J.; Molteni, E.; Fasan, A.; Schuler, E.; et al. Integrating clinical features and genetic lesions in the risk assessment of patients with chronic myelomonocytic leukemia. Blood 2016, 128, 1408–1417. [Google Scholar] [CrossRef] [PubMed]
- Patel, B.J.; Przychodzen, B.; Thota, S.; Radivoyevitch, T.; Visconte, V.; Kuzmanovic, T.; Clemente, M.; Hirsch, C.; Morawski, A.; Souaid, R.; et al. Genomic determinants of chronic myelomonocytic leukemia. Leukemia 2017, 31, 2815–2823. [Google Scholar] [CrossRef] [PubMed]
- Ogawa, S. Genetics of MDS. Blood 2019, 133, 1049–1059. [Google Scholar] [CrossRef] [PubMed]
- Bejar, R.; Stevenson, K.; Abdel-Wahab, O.; Galili, N.; Nilsson, B.; Garcia-Manero, G.; Kantarjian, H.; Raza, A.; Levine, R.L.; Neuberg, D.; et al. Clinical effect of point mutations in myelodysplastic syndromes. N. Engl. J. Med. 2011, 364, 2496–2506. [Google Scholar] [CrossRef] [PubMed]
- Greenberg, P.; Cox, C.; LeBeau, M.M.; Fenaux, P.; Morel, P.; Sanz, G.; Sanz, M.; Vallespi, T.; Hamblin, T.; Oscier, D.; et al. International scoring system for evaluating prognosis in myelodysplastic syndromes. Blood 1997, 89, 2079–2088. [Google Scholar] [CrossRef] [PubMed]
- Greenberg, P.P.L.; Tuechler, H.; Schanz, J.; Sanz, G.; Garcia-Manero, G.; Solé, F.; Bennett, J.M.; Bowen, D.; Fenaux, P.; Dreyfus, F.; et al. Revised international prognostic scoring system for myelodysplastic syndromes. Blood 2012, 120, 2454–2465. [Google Scholar] [CrossRef]
- Malcovati, L.; Germing, U.; Kuendgen, A.; Della Porta, M.G.; Pascutto, C.; Invernizzi, R.; Giagounidis, A.; Hildebrandt, B.; Bernasconi, P.; Knipp, S.; et al. Time-dependent prognostic scoring system for predicting survival and leukemic evolution in myelodysplastic syndromes. J. Clin. Oncol. 2007, 25, 3503–3510. [Google Scholar] [CrossRef]
- Kantarjian, H.; O’Brien, S.; Ravandi, F.; Cortes, J.; Shan, J.; Bennett, J.M.; List, A.; Fenaux, P.; Sanz, G.; Issa, J.P.; et al. Proposal for a new risk model in myelodysplastic syndrome that accounts for events not considered in the original International Prognostic Scoring System. Cancer 2008, 113, 1351–1361. [Google Scholar] [CrossRef]
- Such, E.; Germing, U.; Malcovati, L.; Cervera, J.; Kuendgen, A.; Della Porta, M.G.; Nomdedeu, B.; Arenillas, L.; Luño, E.; Xicoy, B.; et al. Development and validation of a prognostic scoring system for patients with chronic myelomonocytic leukemia. Blood 2013, 121, 3005–3015. [Google Scholar] [CrossRef] [PubMed]
- Nazha, A.; Narkhede, M.; Radivoyevitch, T.; Seastone, D.J.; Patel, B.J.; Gerds, A.T.; Mukherjee, S.; Kalaycio, M.; Advani, A.; Przychodzen, B.; et al. Incorporation of molecular data into the Revised International Prognostic Scoring System in treated patients with myelodysplastic syndromes. Leukemia 2016, 30, 2214–2220. [Google Scholar] [CrossRef] [PubMed]
- Palomo, L.; Ibáñez, M.; Abáigar, M.; Vázquez, I.; Álvarez, S.; Cabezón, M.; Tazón-Vega, B.; Rapado, I.; Fuster-Tormo, F.; Cervera, J.; et al. Spanish Guidelines for the use of targeted deep sequencing in myelodysplastic syndromes and chronic myelomonocytic leukaemia. Br. J. Haematol. 2019, in press. [Google Scholar] [CrossRef]
- Sanz, G.F.; Ibañez, M.; Mora, E. Are next-generation sequencing results knocking on Heaven’s door for transplantation planning in chronic myelomonocytic leukemia? Haematologica 2020, 105, 530–533. [Google Scholar] [CrossRef] [PubMed]
- Arenillas, L.; Mallo, M.; Ramos, F.; Guinta, K.; Barragán, E.; Lumbreras, E.; Larráyoz, M.-J.; De Paz, R.; Tormo, M.; Abáigar, M.; et al. Single nucleotide polymorphism array karyotyping: A diagnostic and prognostic tool in myelodysplastic syndromes with unsuccessful conventional cytogenetic testing. Genes. Chromosomes Cancer 2013, 52, 1167–1177. [Google Scholar] [CrossRef] [PubMed]
- Palomo, L.; Xicoy, B.; Garcia, O.; Mallo, M.; Ademà, V.; Cabezón, M.; Arnan, M.; Pomares, H.; José Larrayoz, M.; José Calasanz, M.; et al. Impact of SNP array karyotyping on the diagnosis and the outcome of chronic myelomonocytic leukemia with low risk cytogenetic features or no metaphases. Am. J. Hematol. 2016, 91, 185–192. [Google Scholar] [CrossRef]
- Tiu, R.V.; Gondek, L.P.; O’Keefe, C.L.; Elson, P.; Huh, J.; Mohamedali, A.; Kulasekararaj, A.; Advani, A.S.; Paquette, R.; List, A.F.; et al. Prognostic impact of SNP array karyotyping in myelodysplastic syndromes and related myeloid malignancies. Blood 2011, 117, 4552–4560. [Google Scholar] [CrossRef]
- Schoumans, J.; Suela, J.; Hastings, R.; Muehlematter, D.; Rack, K.; van den Berg, E.; Berna Beverloo, H.; Stevens-Kroef, M. Guidelines for genomic array analysis in acquired haematological neoplastic disorders. Genes. Chromosomes Cancer 2016, 55, 480–491. [Google Scholar] [CrossRef]
- Kanagal-Shamanna, R.; Hodge, J.C.; Tucker, T.; Shetty, S.; Yenamandra, A.; Dixon-McIver, A.; Bryke, C.; Huxley, E.; Lennon, P.A.; Raca, G.; et al. Assessing copy number aberrations and copy neutral loss of heterozygosity across the genome as best practice: An evidence based review of clinical utility from the cancer genomics consortium (CGC) working group for myelodysplastic syndrome, myelodysplastic/myeloproliferative and myeloproliferative neoplasms. Cancer Genet. 2018, 228–229, 197–217. [Google Scholar]
- Nazha, A.; Al-Issa, K.; Hamilton, B.K.; Radivoyevitch, T.; Gerds, A.T.; Mukherjee, S.; Adema, V.; Zarzour, A.; Abuhadra, N.; Patel, B.J.; et al. Adding molecular data to prognostic models can improve predictive power in treated patients with myelodysplastic syndromes. Leukemia 2017, 31, 2848–2850. [Google Scholar] [CrossRef]
- McGowan-Jordan, J.; Simons, A.; Schmid, M.; Standing, I.; Nomenclature, C. On H.C. ISCN: An International System for Human Cytogenomic Nomenclature (2016); Karger: Basel, Switzerland; New York, NY, USA, 2016. [Google Scholar]
- Bernasconi, P.; Cavigliano, P.M.; Boni, M.; Calatroni, S.; Klersy, C.; Giardini, I.; Rocca, B.; Crosetto, N.; Caresana, M.; Lazzarino, M.; et al. Is FISH a relevant prognostic tool in myelodysplastic syndromes with a normal chromosome pattern on conventional cytogenetics? A study on 57 patients. Leukemia 2003, 17, 2107–2112. [Google Scholar] [CrossRef] [PubMed][Green Version]
- Li, H.; Durbin, R. Fast and accurate short read alignment with Burrows-Wheeler transform. Bioinformatics 2009, 25, 1754–1760. [Google Scholar] [CrossRef] [PubMed]
- Li, H. Improving SNP discovery by base alignment quality. Bioinformatics 2011, 27, 1157–1158. [Google Scholar] [CrossRef] [PubMed]
- Auton, A.; Abecasis, G.R.; Altshuler, D.M.; Durbin, R.M.; Bentley, D.R.; Chakravarti, A.; Clark, A.G.; Donnelly, P.; Eichler, E.E.; Flicek, P.; et al. A global reference for human genetic variation. Nature 2015, 526, 68–74. [Google Scholar] [PubMed]
- Landrum, M.J.; Lee, J.M.; Riley, G.R.; Jang, W.; Rubinstein, W.S.; Church, D.M.; Maglott, D.R. ClinVar: Public archive of relationships among sequence variation and human phenotype. Nucleic Acids Res. 2014, 42, 980–985. [Google Scholar] [CrossRef]
- Fowler, A.; Mahamdallie, S.; Ruark, E.; Seal, S.; Ramsay, E.; Clarke, M.; Uddin, I.; Wylie, H.; Strydom, A.; Lunter, G.; et al. Accurate clinical detection of exon copy number variants in a targeted NGS panel using DECoN. Wellcome Open Res. 2016, 1, 20. [Google Scholar] [CrossRef] [PubMed]
- Garvin, T.; Aboukhalil, R.; Kendall, J.; Baslan, T.; Atwal, G.S.; Hicks, J.; Wigler, M.; Schatz, M.C. Interactive analysis and assessment of single-cell copy-number variations. Nat. Methods 2015, 12, 1058–1060. [Google Scholar] [CrossRef] [PubMed]
- Song, S.; Nones, K.; Miller, D.; Harliwong, I.; Kassahn, K.S.; Pinese, M.; Pajic, M.; Gill, A.J.; Johns, A.L.; Anderson, M.; et al. qpure: A tool to estimate tumor cellularity from genome-wide single-nucleotide polymorphism profiles. PLoS ONE 2012, 7, e45835. [Google Scholar] [CrossRef] [PubMed]
- Mohamed, S.; Latagliata, R.; Limongi, M.Z.; Nigro, S.; Sangiorgi, E.; Nanni, M.; Piccioni, A.; Campagna, A.; Spiriti, M.A.A.; Carmosino, I.; et al. Balanced and unbalanced chromosomal translocations in myelodysplastic syndromes: Clinical and prognostic significance. Leuk. Lymphoma 2020, 61, 1–8. [Google Scholar] [CrossRef]
- Costa, D.; Muñoz, C.; Carrió, A.; Nomdedeu, M.; Calvo, X.; Solé, F.; Luño, E.; Cervera, J.; Vallespí, T.; Berneaga, D.; et al. Reciprocal translocations in myelodysplastic syndromes and chronic myelomonocytic leukemias: Review of 5,654 patients with an evaluable karyotype. Genes. Chromosomes Cancer 2013, 52, 753–763. [Google Scholar] [CrossRef]
- McKerrell, T.; Moreno, T.; Ponstingl, H.; Bolli, N.; Dias, J.M.L.; Tischler, G.; Colonna, V.; Manasse, B.; Bench, A.; Bloxham, D.; et al. Development and validation of a comprehensive genomic diagnostic tool for myeloid malignancies. Blood 2016, 128, e1–e9. [Google Scholar] [CrossRef]
- Jiang, L.; Pallavajjala, A.; Huang, J.; Haley, L.; Morsberger, L.; Stinnett, V.; Hardy, M.; Park, R.; Ament, C.; Finch, A.; et al. Clinical Utility of Targeted Next-Generation Sequencing Assay to Detect Copy Number Variants Associated with Myelodysplastic Syndrome in Myeloid Malignancies. J. Mol. Diagn. 2021, 23, 467–483. [Google Scholar] [CrossRef]
- Mack, E.K.M.M.; Marquardt, A.; Langer, D.; Ross, P.; Ultsch, A.; Kiehl, M.G.; Mack, H.I.D.D.; Haferlach, T.; Neubauer, A.; Brendel, C. Comprehensive genetic diagnosis of acute myeloid leukemia by next-generation sequencing. Haematologica 2019, 104, 277–287. [Google Scholar] [CrossRef]
- Prieto-Conde, M.I.; Corchete, L.A.; García-Álvarez, M.; Jiménez, C.; Medina, A.; Balanzategui, A.; Hernández-Ruano, M.; Maldonado, R.; Sarasquete, M.E.; Alcoceba, M.; et al. A New Next-Generation Sequencing Strategy for the Simultaneous Analysis of Mutations and Chromosomal Rearrangements at DNA Level in Acute Myeloid Leukemia Patients. J. Mol. Diagn. 2020, 22, 60–71. [Google Scholar] [CrossRef] [PubMed]
- Yellapantula, V.; Hultcrantz, M.; Rustad, E.H.; Wasserman, E.; Londono, D.; Cimera, R.; Ciardiello, A.; Landau, H.; Akhlaghi, T.; Mailankody, S.; et al. Comprehensive detection of recurring genomic abnormalities: A targeted sequencing approach for multiple myeloma. Blood Cancer J. 2019, 9, 101. [Google Scholar] [CrossRef] [PubMed]
- Zemanova, Z.; Michalova, K.; Svobodova, K.; Brezinova, J.; Lhotska, H.; Lizcova, L.; Sarova, I.; Izakova, S.; Hodanova, L.; Vesela, D.; et al. Chromothripsis in High-Risk Myelodysplastic Syndromes: Incidence, Genetic Features, Clinical Implications, and Impact on Survival of Patients Treated with Azacytidine (Data from Czech MDS Group). Blood 2018, 132, 1815. [Google Scholar] [CrossRef]
- Abáigar, M.; Robledo, C.; Benito, R.; Ramos, F.; Díez-Campelo, M.; Hermosín, L.; Sánchez-Del-Real, J.; Alonso, J.M.; Cuello, R.; Megido, M.; et al. Chromothripsis Is a Recurrent Genomic Abnormality in High-Risk Myelodysplastic Syndromes. PLoS ONE 2016, 11, e0164370. [Google Scholar] [CrossRef]
- Makishima, H.; Rataul, M.; Gondek, L.P.; Huh, J.; Cook, J.R.; Theil, K.S.; Sekeres, M.A.; Kuczkowski, E.; O’Keefe, C.; Maciejewski, J.P. FISH and SNP-A karyotyping in myelodysplastic syndromes: Improving cytogenetic detection of del(5q), monosomy 7, del(7q), trisomy 8 and del(20q). Leuk. Res. 2010, 34, 447–453. [Google Scholar] [CrossRef]
- Rack, K.A.; van den Berg, E.; Haferlach, C.; Beverloo, H.B.; Costa, D.; Espinet, B.; Foot, N.; Jeffries, S.; Martin, K.; O’Connor, S.; et al. European recommendations and quality assurance for cytogenomic analysis of haematological neoplasms. Leukemia 2019, 33, 1851–1867. [Google Scholar] [CrossRef]
- Bernard, E.; Nannya, Y.; Hasserjian, R.P.; Devlin, S.M.; Tuechler, H.; Medina-martinez, J.S.; Yoshizato, T.; Shiozawa, Y.; Saiki, R.; Malcovati, L.; et al. Implications of TP53 allelic state for genome stability, clinical presentation and outcomes in myelodysplastic syndromes. Nat. Med. 2020. [Google Scholar] [CrossRef]
- Martinez-Høyer, S.; Deng, Y.; Parker, J.; Jiang, J.; Mo, A.; Docking, T.R.; Gharaee, N.; Li, J.; Umlandt, P.; Fuller, M.; et al. Loss of lenalidomide-induced megakaryocytic differentiation leads to therapy resistance in del(5q) myelodysplastic syndrome. Nat. Cell Biol. 2020, 22, 526–533. [Google Scholar] [CrossRef]
- Braulke, F.; Platzbecker, U.; Müller-Thomas, C.; Götze, K.; Germing, U.; Brümmendorf, T.H.; Nolte, F.; Hofmann, W.-K.; Giagounidis, A.A.N.; Lübbert, M.; et al. Validation of cytogenetic risk groups according to International Prognostic Scoring Systems by peripheral blood CD34+FISH: Results from a German diagnostic study in comparison with an international control group. Haematologica 2015, 100, 205–213. [Google Scholar] [CrossRef] [PubMed]
- Redon, R.; Ishikawa, S.; Fitch, K.R.; Feuk, L.; Perry, G.H.; Andrews, T.D.; Fiegler, H.; Shapero, M.H.; Carson, A.R.; Chen, W.; et al. Global variation in copy number in the human genome. Nature 2006, 444, 444–454. [Google Scholar] [CrossRef]


| Features | N. of Cases/Median | Range |
|---|---|---|
| Sex, male/female | 36/24 | |
| Age, median | 71.5 | 32–89 |
| BM blast %, median | 4 | 0–18 |
| Peripheral blood counts | Median | Range |
| Hemoglobin (g/dL) | 10 | 4–13.6 |
| Platelets (×109/L) | 120 | 7–652 |
| Absolute neutrophils count (×109/L) | 2.42 | 0.3–63.4 |
| 2016 WHO classification [1,2] | N. of cases | Frequency (%) |
| MDS with single lineage dysplasia (MDS-SLD) | 3 | 5 |
| MDS with multilineage dysplasia (MDS-MLD) | 7 | 11.7 |
| MDS-RS with single lineage dysplasia (MDS-RS-SLD) | 12 | 20 |
| MDS with isolated del(5q) | 4 | 6.7 |
| MDS with excess blasts (EB)-1 | 8 | 13.3 |
| MDS-EB-2 | 12 | 20 |
| MDS, unclassifiable (MDS-U) | 2 | 3.3 |
| Myelodysplastic/myeloproliferative neoplasms (MDS/MPN) | 2 | 3.3 |
| Chronic myelomonocytic leukemia (CMML) | 10 | 16.7 |
| Conventional cytogenetics | N. of cases | Frequency (%) |
| Normal karyotype | 37 | 61.7 |
| Altered Karyotype | 22 | 36.7 |
| NA | 1 | 1.6 |
| IPSS-R classification [13] | N. of cases | Risk score |
| Very Low | 12 | 1 |
| Low | 12 | 2–3 |
| Intermediate | 11 | 3.5–4 |
| High | 5 | 5–6 |
| Very High | 8 | 6.5–10 |
| NA | 2 | |
| CPSS classification [16] | Number of cases | Risk score |
| Low | 1 | 0 |
| Intermediate-1 | 2 | 1 |
| Intermediate-2 | 7 | 2–3 |
| High | 0 |
| CNAs and cnLOH events | Conventional Cytogenetics | SNP-Arrays | DECoN | Ginkgo | NGS-Combined | Uniquely by SNP Arrays | Uniquely by NGS |
|---|---|---|---|---|---|---|---|
| Normal karyotype | 37 | 28 | 30 | 31 | 29 | ||
| Clinically relevant CNAs | |||||||
| -Y | 1 | 1 | 1 | 1 | 1 | ||
| del(5q) | 8 | 11 | 11 | 9 | 11 | #151908, 63.8 Mb (only by DECoN); #144969, 5.6 Mb (only by DECoN) | |
| del(12p) | 1 | 5 | 3 | 3 | 3 | #163259, 8 Mb; #162250, 7.9 Mb * | |
| del(20q) | 1 | 3 | 1 | 1 | 1 | #140104, 16.7 Mb; #171224, 27.4 Mb | |
| monosomy 7 | 8 | 4 | 4 | 4 | 4 | ||
| del(7q) | 0 | 5 | 5 | 4 | 5 | #144206, 9.9 Mb(only by DECoN) | |
| trisomy 8 | 2 | 1 | 1 | 1 | 1 | ||
| trisomy 21 | 2 | 1 | 1 | 2 | 2 | #173419, 32.8 Mb (only by Ginkgo) | #144969, trisomy 21 |
| del(17p), i(17)(q10) | 3 | 4 | 3 | 2 | 3 | #144969, 21 Mb; #144304, 4.9 Mb (only by DECoN) | |
| 26 | 35 | 30 | 27 | 31 | |||
| Recurrent CNAs with unknown significance | |||||||
| del(1p) | 1 | 0 | 0 | 0 | 0 | ||
| dup(1p) | 0 | 1 | 1 | 0 | 1 | ||
| dup(2p) | 1 | 1 | 1 | 0 | 1 | ||
| monosomy 3 | 1 | 0 | 0 | 0 | 0 | ||
| del(3p) | 0 | 1 | 1 | 1 | 1 | ||
| del(5p) | 0 | 1 | 0 | 0 | 0 | #144304, 3.3 Mb | |
| dup(5p) | 0 | 1 | 0 | 0 | 0 | #160705, 5.6 Mb | |
| dup(5q) | 1 | 0 | 0 | 0 | 0 | ||
| del(6p) | 0 | 1 $ | 1 $ | 1 $ | 1 $ | ||
| dup(6p) | 0 | 1 $ | 1 $ | 1 $ | 1 $ | ||
| del(7p) | 0 | 2 | 1 | 1 | 1 | #160990, 7.8 Mb (mosaic loss) | |
| dup(7q) | 1 | 1 | 0 | 0 | 0 | #154667, 9.4 Mb | |
| dup(9p) | 0 | 0 | 0 | 1 | 1 | #161780, 5.4 Mb | |
| monosomy 10 | 1 | 0 | 0 | 0 | 0 | ||
| dup(10p) | 0 | 1 | 0 | 1 | 1 | #144969, 36.2 Mb (only by Ginkgo) | |
| del(10q) | 0 | 1 | 0 | 1 | 1 | #144969, 46 Mb (only by Ginkgo) | |
| dup(11q) | 0 | 1 | 1 | 1 | 1 | ||
| dup(12p) | 1 | 0 | 1 | 1 | 1 | #162250, 12.9 Mb * | |
| del(12q) | 0 | 2 $ | 1 $ | 1 $ | 1 $ | #151908, 9.8 Mb | |
| dup(13q) | 2 | 0 | 0 | 0 | 0 | ||
| dup(15p) | 1 | 1 | 0 | 0 | 0 | #151908, 7.6 Mb | |
| del(16p) | 2 | 3 | 3 | 3 | 3 | ||
| dup(16p) | 0 | 1 $ | 1 $ | 1 $ | 1 $ | ||
| dup(16q) | 1 | 0 | 0 | 0 | 0 | ||
| del(17q) | 1 | 1 | 0 | 0 | 0 | #160990, 0.6 Mb | |
| monosomy 18 | 2 | 0 | 0 | 0 | 0 | ||
| del(18q) | 0 | 2 $ | 1 $ | 2 $ | 2 $ | #144969, 10.3 Mb (only by Ginkgo) | |
| monosomy 19 | 1 | 0 | 0 | 0 | 0 | ||
| del(19p) | 0 | 2 | 0 | 0 | 0 | #144206, 6.5 Mb; #144969, 7.5 Mb | |
| dup(19p) | 0 | 2 | 1 | 0 | 1 | #151908, 10 Mb; #144969, 6 Mb (only by DECoN) | |
| dup(19q) | 0 | 1 $ | 1 $ | 0 | 1 $ | #151908, 26.7 Mb (only by DECoN) | |
| monosomy 20 | 1 | 0 | 0 | 0 | 0 | ||
| dup(20p) | 0 | 1 | 0 | 0 | 0 | #151908, 21.8 Mb | |
| del(21q) | 0 | 1 | 1 | 0 | 1 | #162103, 3.2 Mb (only by DECoN) | |
| dup(21q) | 0 | 2 $ | 0 | 0 | 0 | #151908, 8.5 Mb | #144969, trisomy 21 |
| +Y | 0 | 1 | 1 | 1 | 1 | ||
| 17 | 23 | 12 | 11 | 15 | |||
| Copy-neutral LOH | |||||||
| 1p cnLOH | NA | 1 | 1 | 1 | 1 | ||
| 1q cnLOH | NA | 1 | 1 | 1 | 1 | ||
| 2p cnLOH | NA | 1 | 1 | 1 | 1 | ||
| 3q cnLOH | NA | 1 | 1 | 1 | 1 | ||
| 4q cnLOH | NA | 2 | 2 | 2 | 2 | ||
| 7q cnLOH | NA | 4 | 4 | 4 | 4 | ||
| 13q cnLOH | NA | 1 | 1 | 1 | 1 | ||
| 17p cnLOH | NA | 1 | 1 | 1 | 1 | ||
| 20p cnLOH | NA | 1 | 1 | 1 | 1 | ||
| 20q cnLOH | NA | 1 | 1 | 1 | 1 | ||
| NA | 14 | 14 | 14 | 14 | |||
| TOTAL REPORTED LESIONS | 43 | 72 | 56 | 52 | 60 |
Publisher’s Note: MDPI stays neutral with regard to jurisdictional claims in published maps and institutional affiliations. |
© 2021 by the authors. Licensee MDPI, Basel, Switzerland. This article is an open access article distributed under the terms and conditions of the Creative Commons Attribution (CC BY) license (https://creativecommons.org/licenses/by/4.0/).
Share and Cite
Liquori, A.; Lesende, I.; Palomo, L.; Avetisyan, G.; Ibáñez, M.; González-Romero, E.; Boluda-Navarro, M.; Morote-Faubel, M.; Garcia-Ruiz, C.; Martinez-Valiente, C.; et al. A Single-Run Next-Generation Sequencing (NGS) Assay for the Simultaneous Detection of Both Gene Mutations and Large Chromosomal Abnormalities in Patients with Myelodysplastic Syndromes (MDS) and Related Myeloid Neoplasms. Cancers 2021, 13, 1947. https://doi.org/10.3390/cancers13081947
Liquori A, Lesende I, Palomo L, Avetisyan G, Ibáñez M, González-Romero E, Boluda-Navarro M, Morote-Faubel M, Garcia-Ruiz C, Martinez-Valiente C, et al. A Single-Run Next-Generation Sequencing (NGS) Assay for the Simultaneous Detection of Both Gene Mutations and Large Chromosomal Abnormalities in Patients with Myelodysplastic Syndromes (MDS) and Related Myeloid Neoplasms. Cancers. 2021; 13(8):1947. https://doi.org/10.3390/cancers13081947
Chicago/Turabian StyleLiquori, Alessandro, Iván Lesende, Laura Palomo, Gayane Avetisyan, Mariam Ibáñez, Elisa González-Romero, Mireia Boluda-Navarro, Mireya Morote-Faubel, Cristian Garcia-Ruiz, Cristina Martinez-Valiente, and et al. 2021. "A Single-Run Next-Generation Sequencing (NGS) Assay for the Simultaneous Detection of Both Gene Mutations and Large Chromosomal Abnormalities in Patients with Myelodysplastic Syndromes (MDS) and Related Myeloid Neoplasms" Cancers 13, no. 8: 1947. https://doi.org/10.3390/cancers13081947
APA StyleLiquori, A., Lesende, I., Palomo, L., Avetisyan, G., Ibáñez, M., González-Romero, E., Boluda-Navarro, M., Morote-Faubel, M., Garcia-Ruiz, C., Martinez-Valiente, C., Santiago-Balsera, M., Gomez-Seguí, I., Sanjuan-Pla, A., Sanz, M. A., Sanz, G., Solé, F., Such, E., & Cervera, J. (2021). A Single-Run Next-Generation Sequencing (NGS) Assay for the Simultaneous Detection of Both Gene Mutations and Large Chromosomal Abnormalities in Patients with Myelodysplastic Syndromes (MDS) and Related Myeloid Neoplasms. Cancers, 13(8), 1947. https://doi.org/10.3390/cancers13081947