
Genomic, Transcriptomic, and Functional Alterations in DNA Damage Response Pathways as Putative Biomarkers of Chemotherapy Response in Ovarian Cancer

 , , , and
Abstract
Simple Summary
Abstract
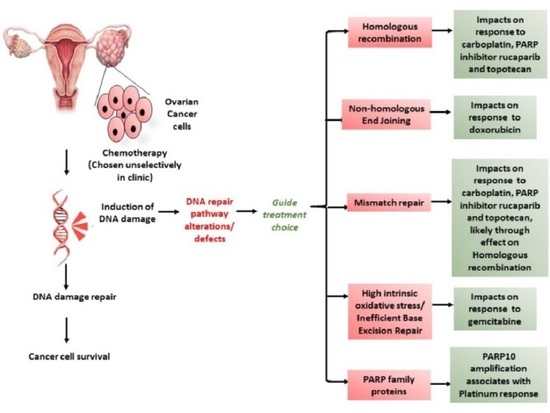
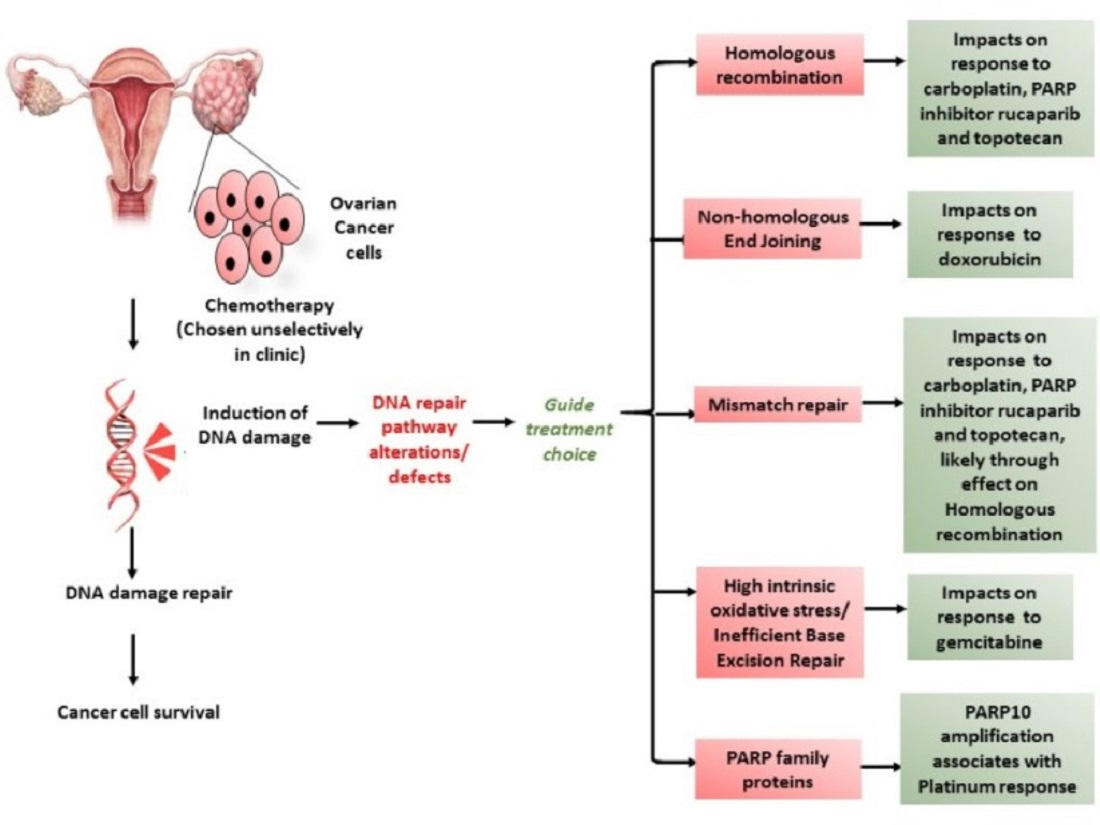
1. Introduction
2. Materials and Methods
2.1. Cell line and Culture Conditions
2.2. Ascites Primary Cultures
2.3. Chemicals and Reagents
2.4. Colony Formation Assay
2.5. Sulforhodamine B Assay (SRB)
2.6. Databases and Tools
2.7. Bioinformatics Analysis
2.8. HRR Function by Immunofluorescence Based γH2AX-RAD51 Assay
2.9. Non-Homologous End Joining (NHEJ) Plasmid Re-Joining Assay
2.10. Measurement of 8-OHdG Levels in the DNA
2.11. Statistical Analysis
3. Results
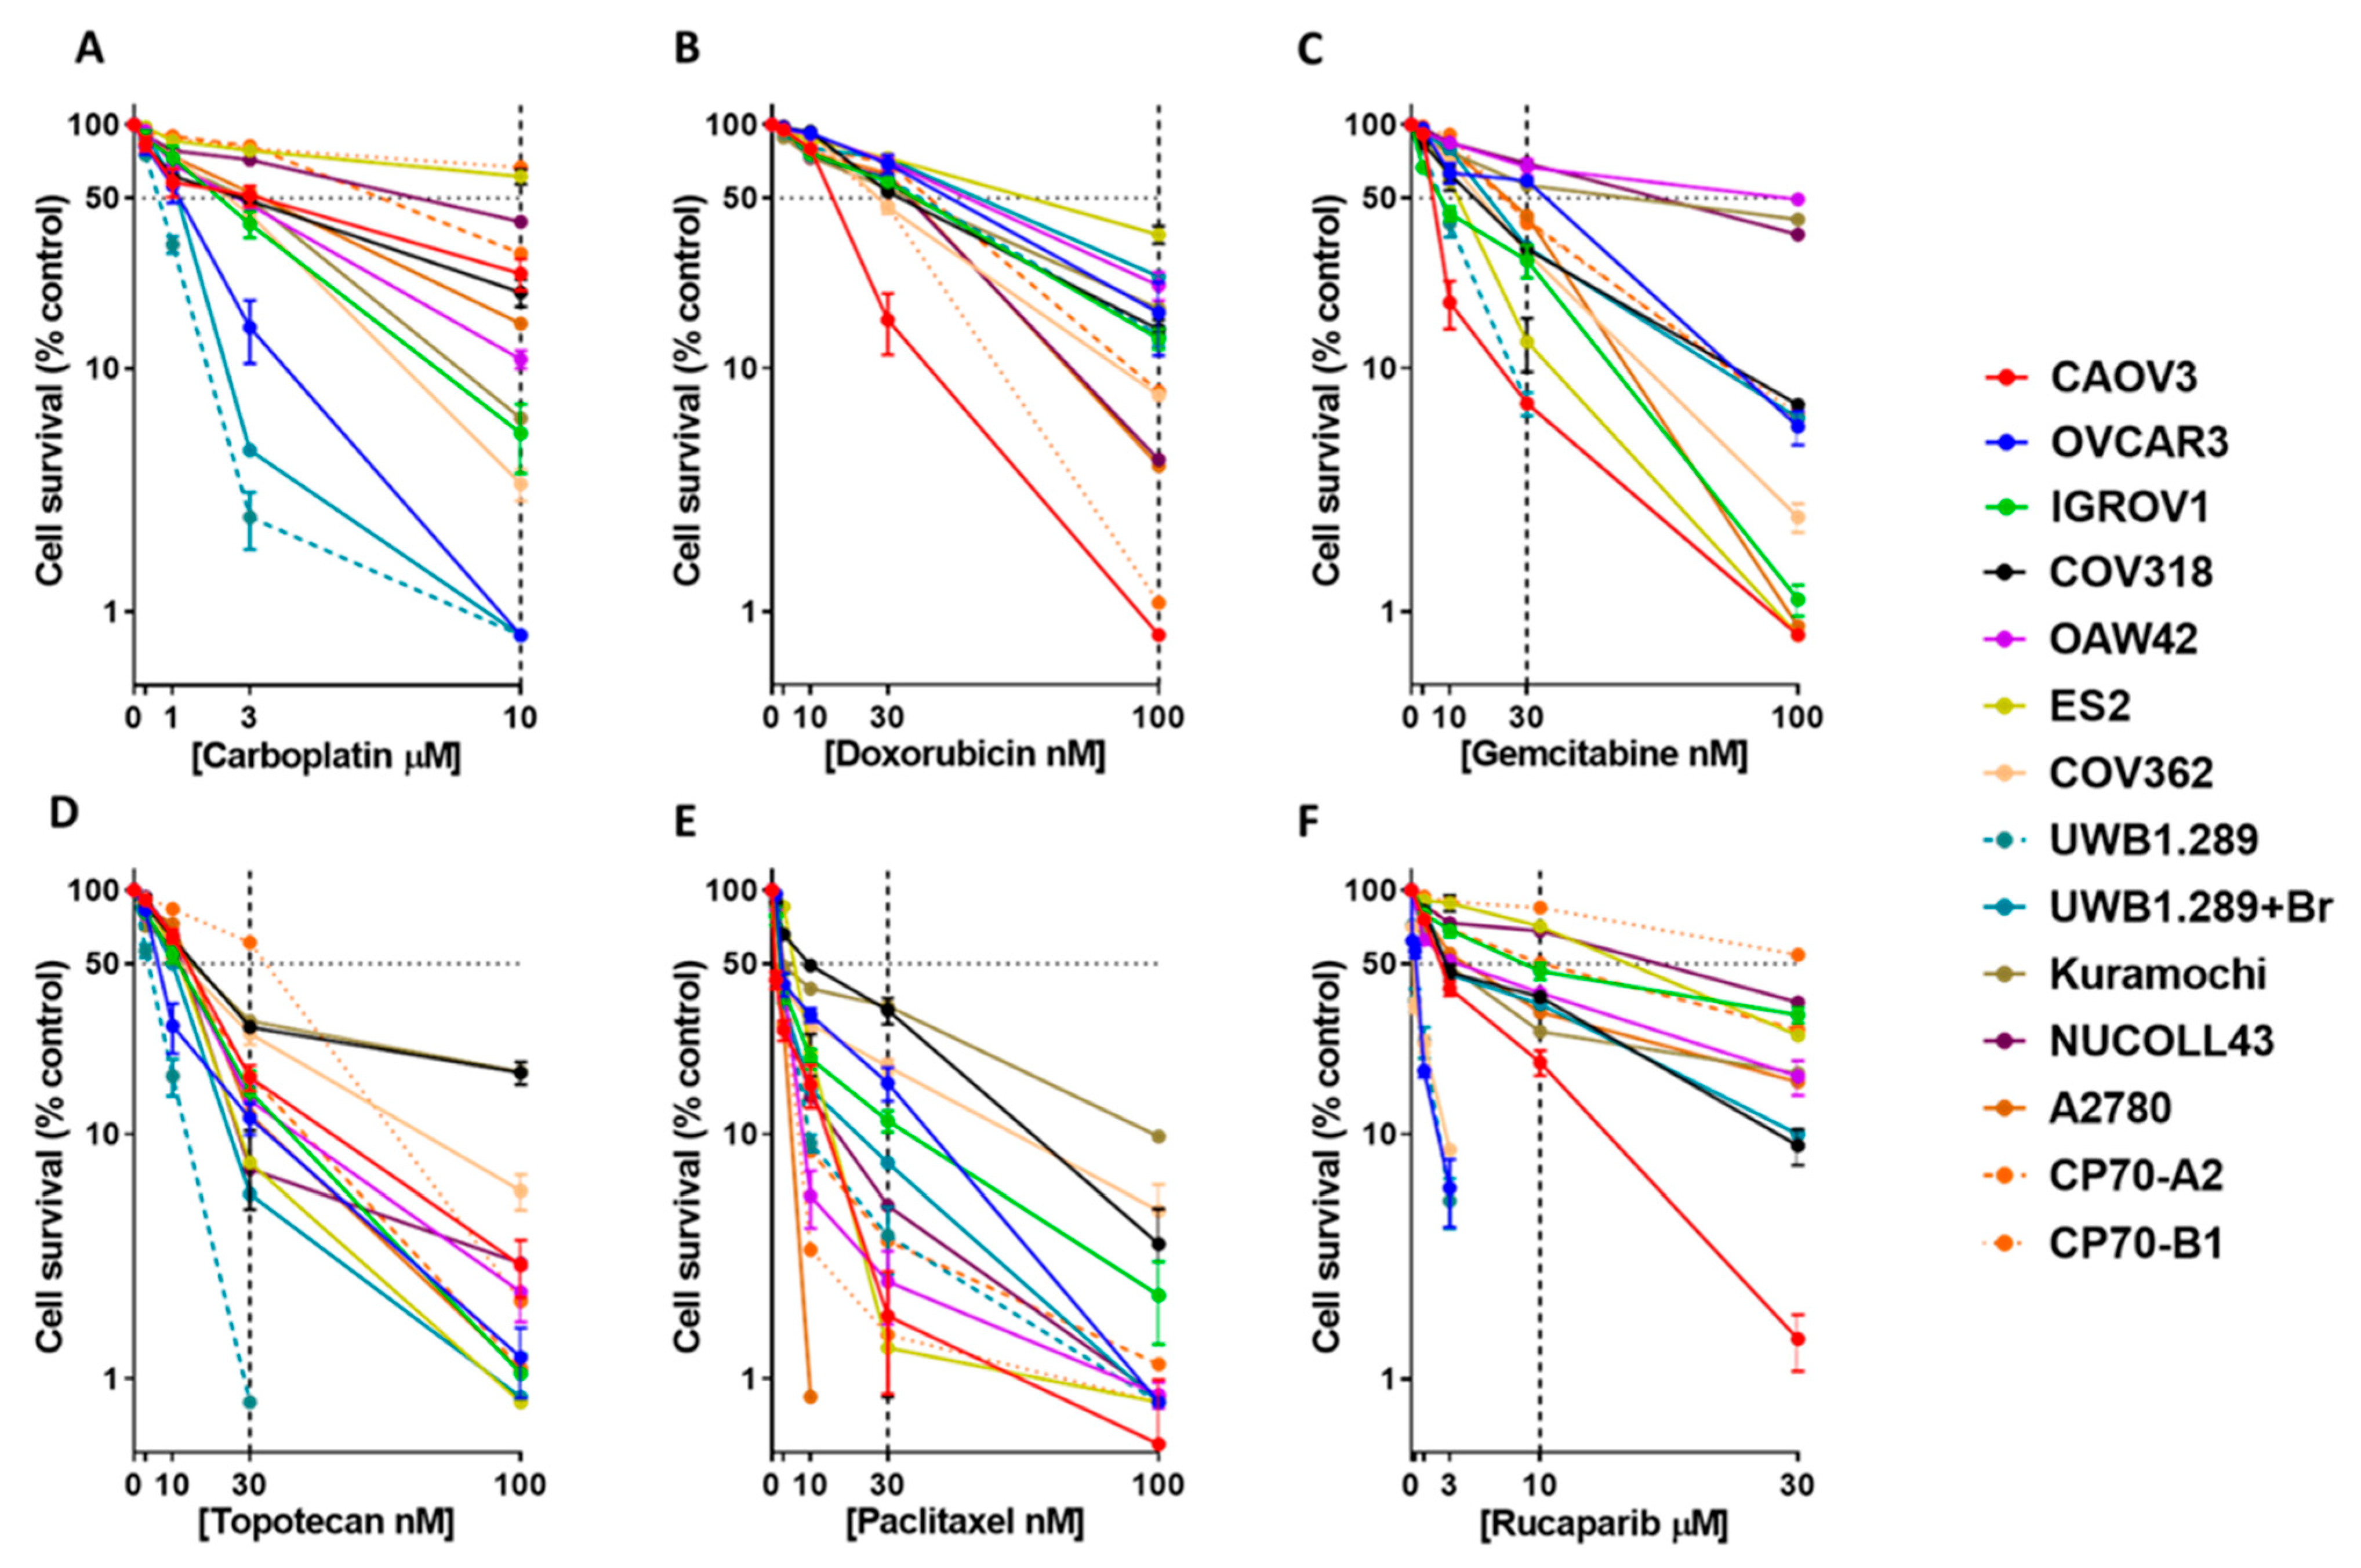
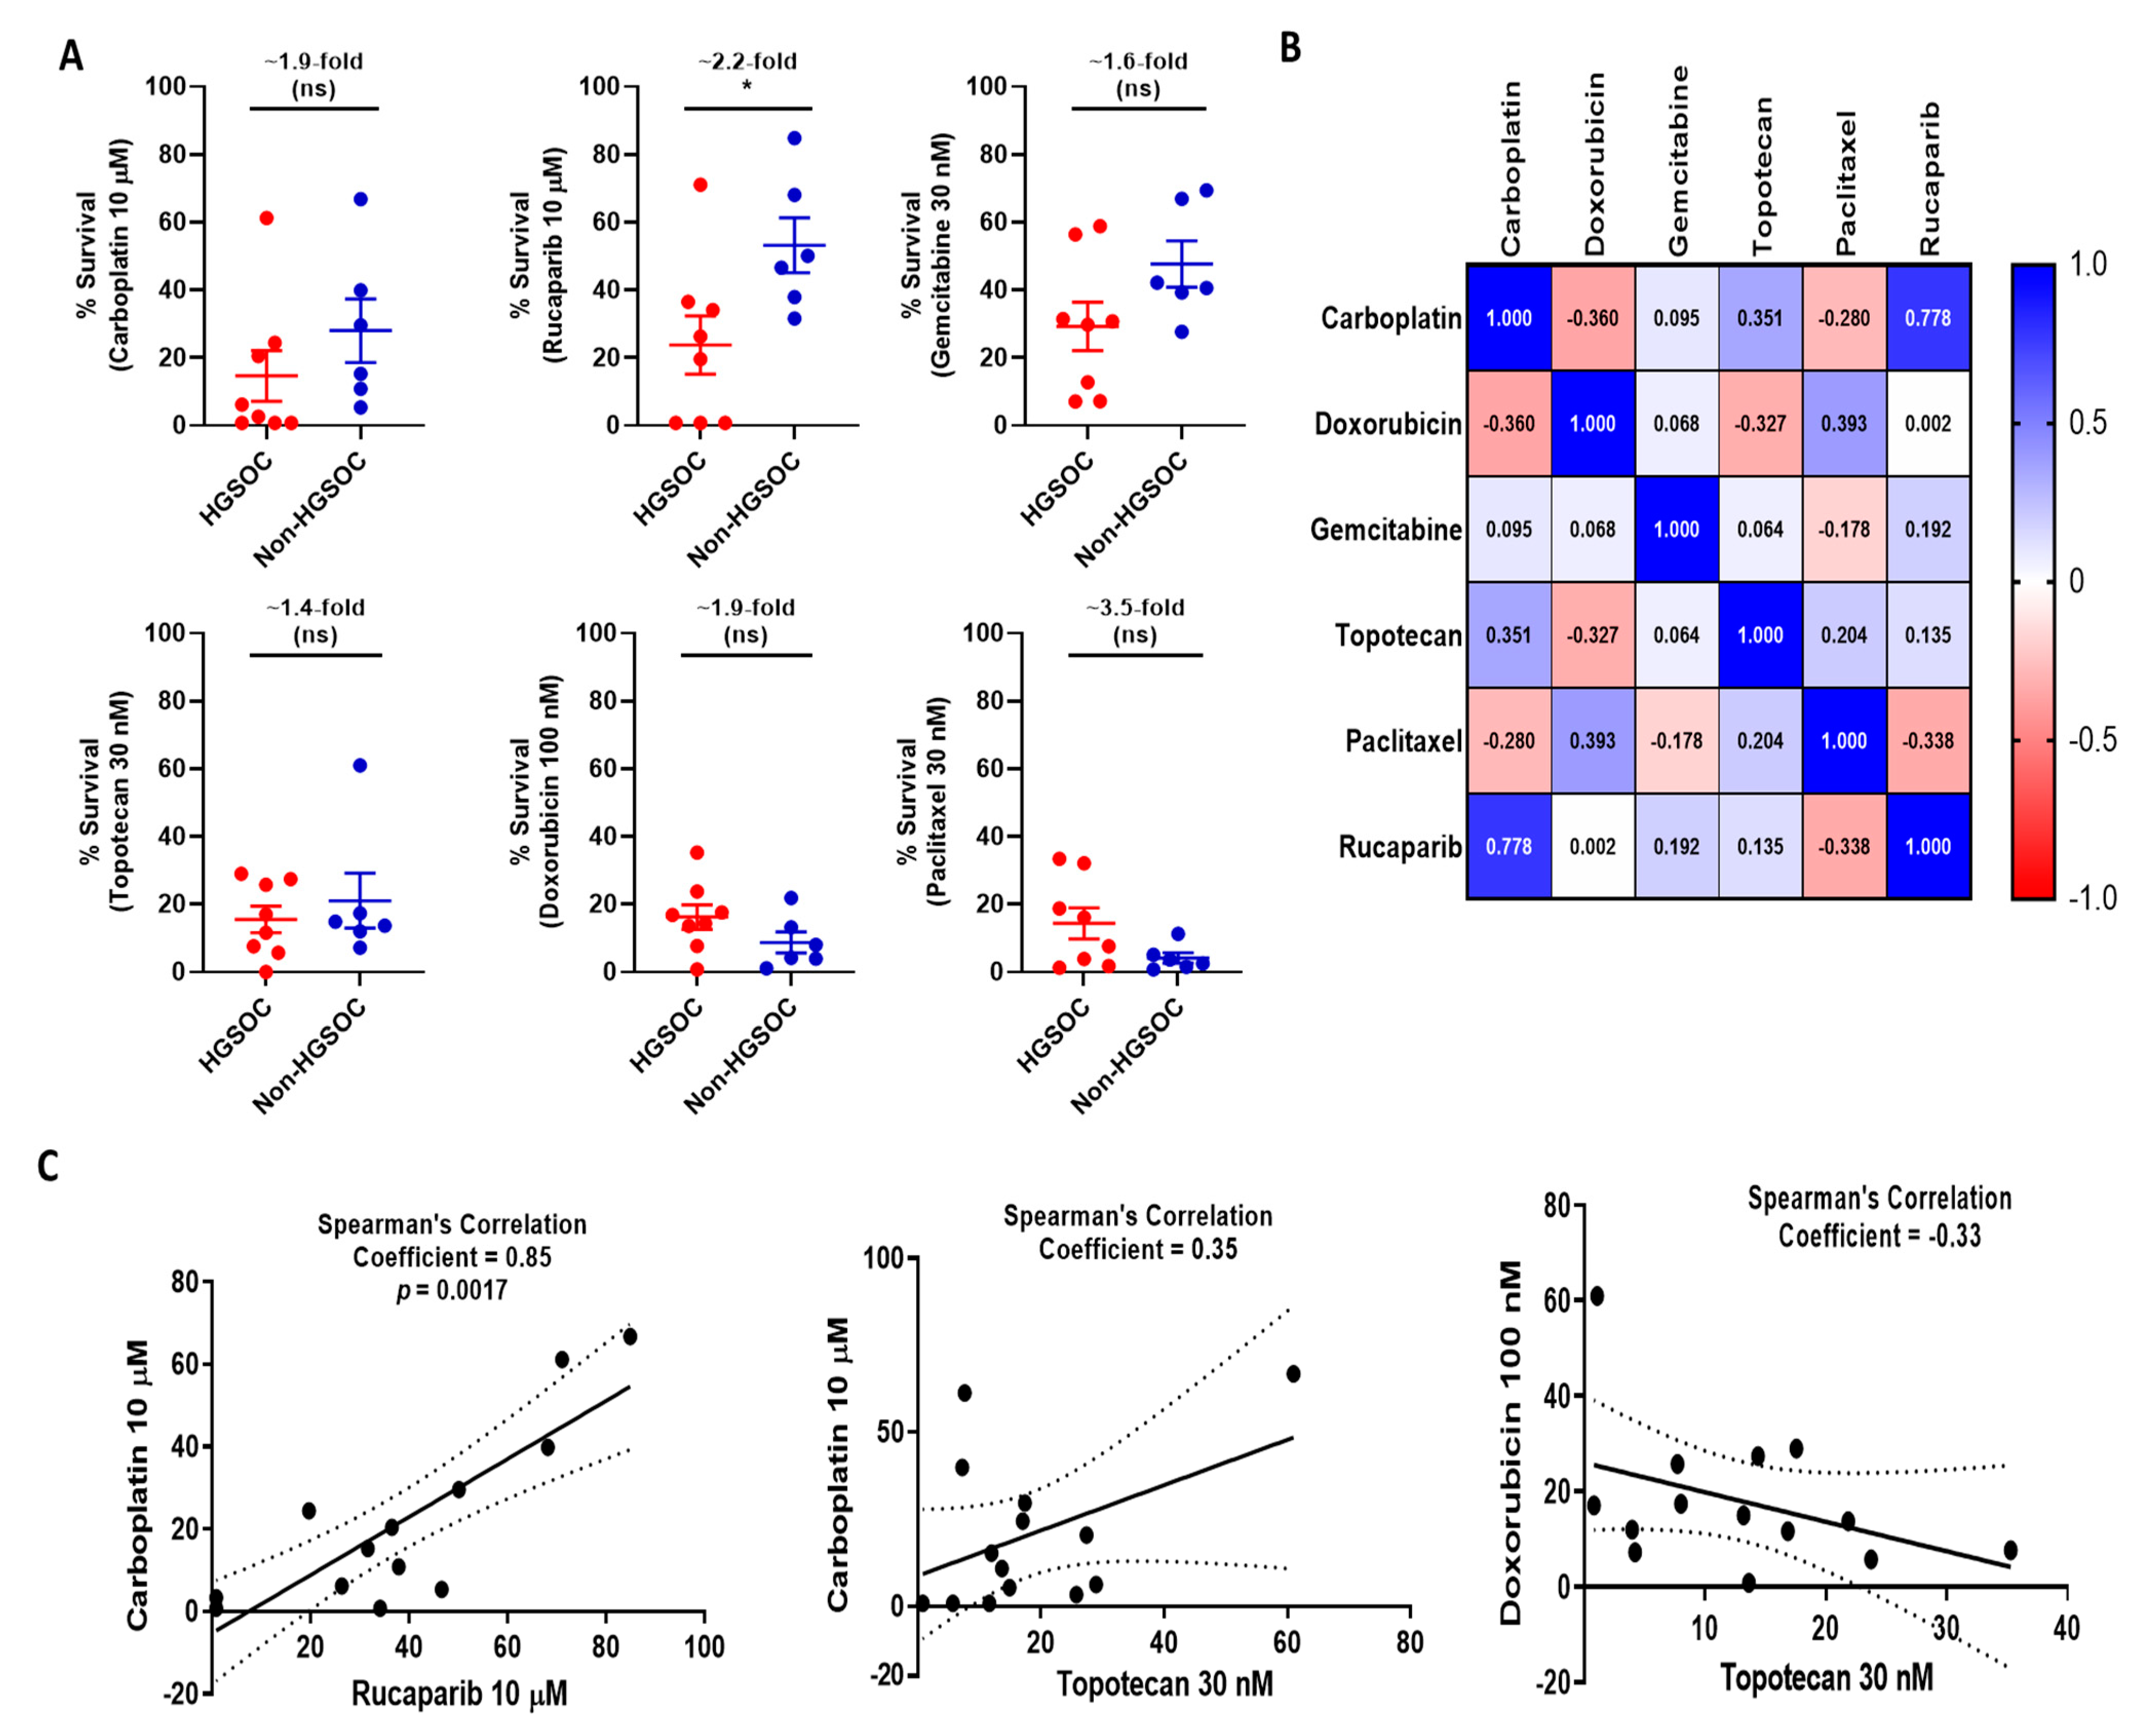
3.1. Colony Formation Cell Survival Assay Demonstrates a Range of Sensitivities to the Six Systemic Therapies across the Ovarian Cancer Cell Line Panel
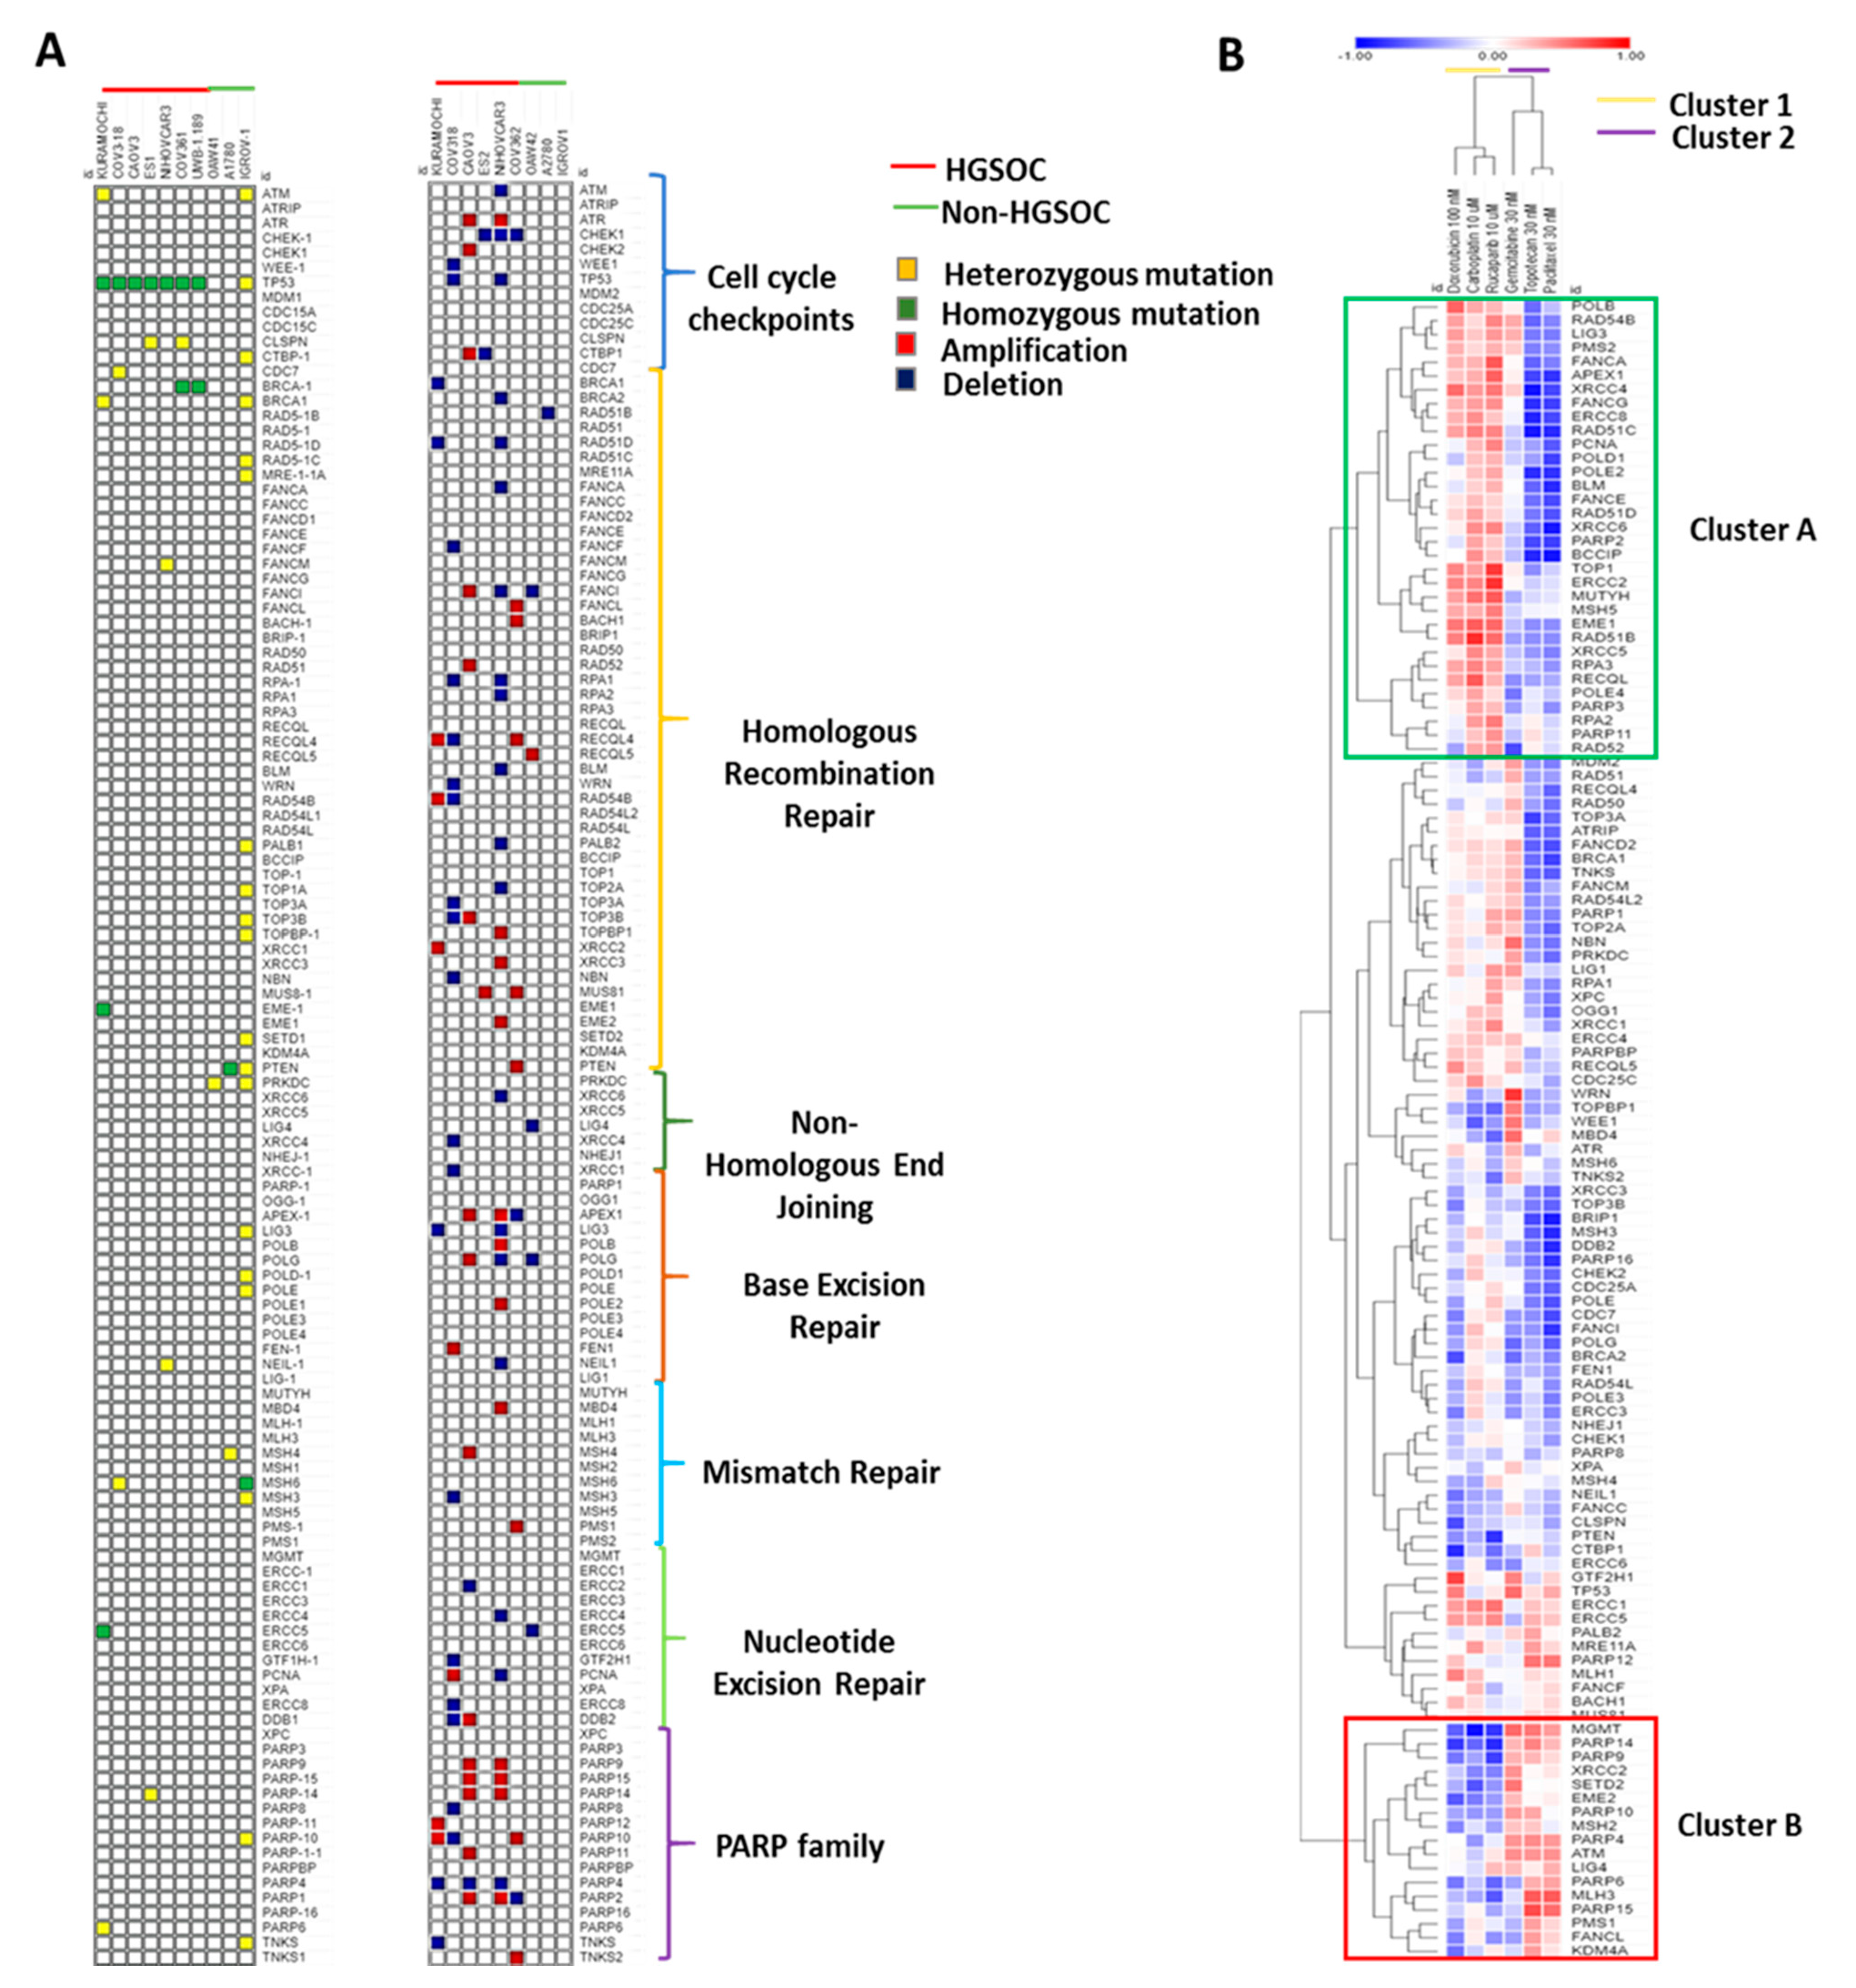
3.2. Key Genetic Alterations Associated with Response to Chemotherapies.
3.3. DDR Gene Expression Correlates with Sensitivity to the Different Chemotherapy Drugs in Cell Lines.
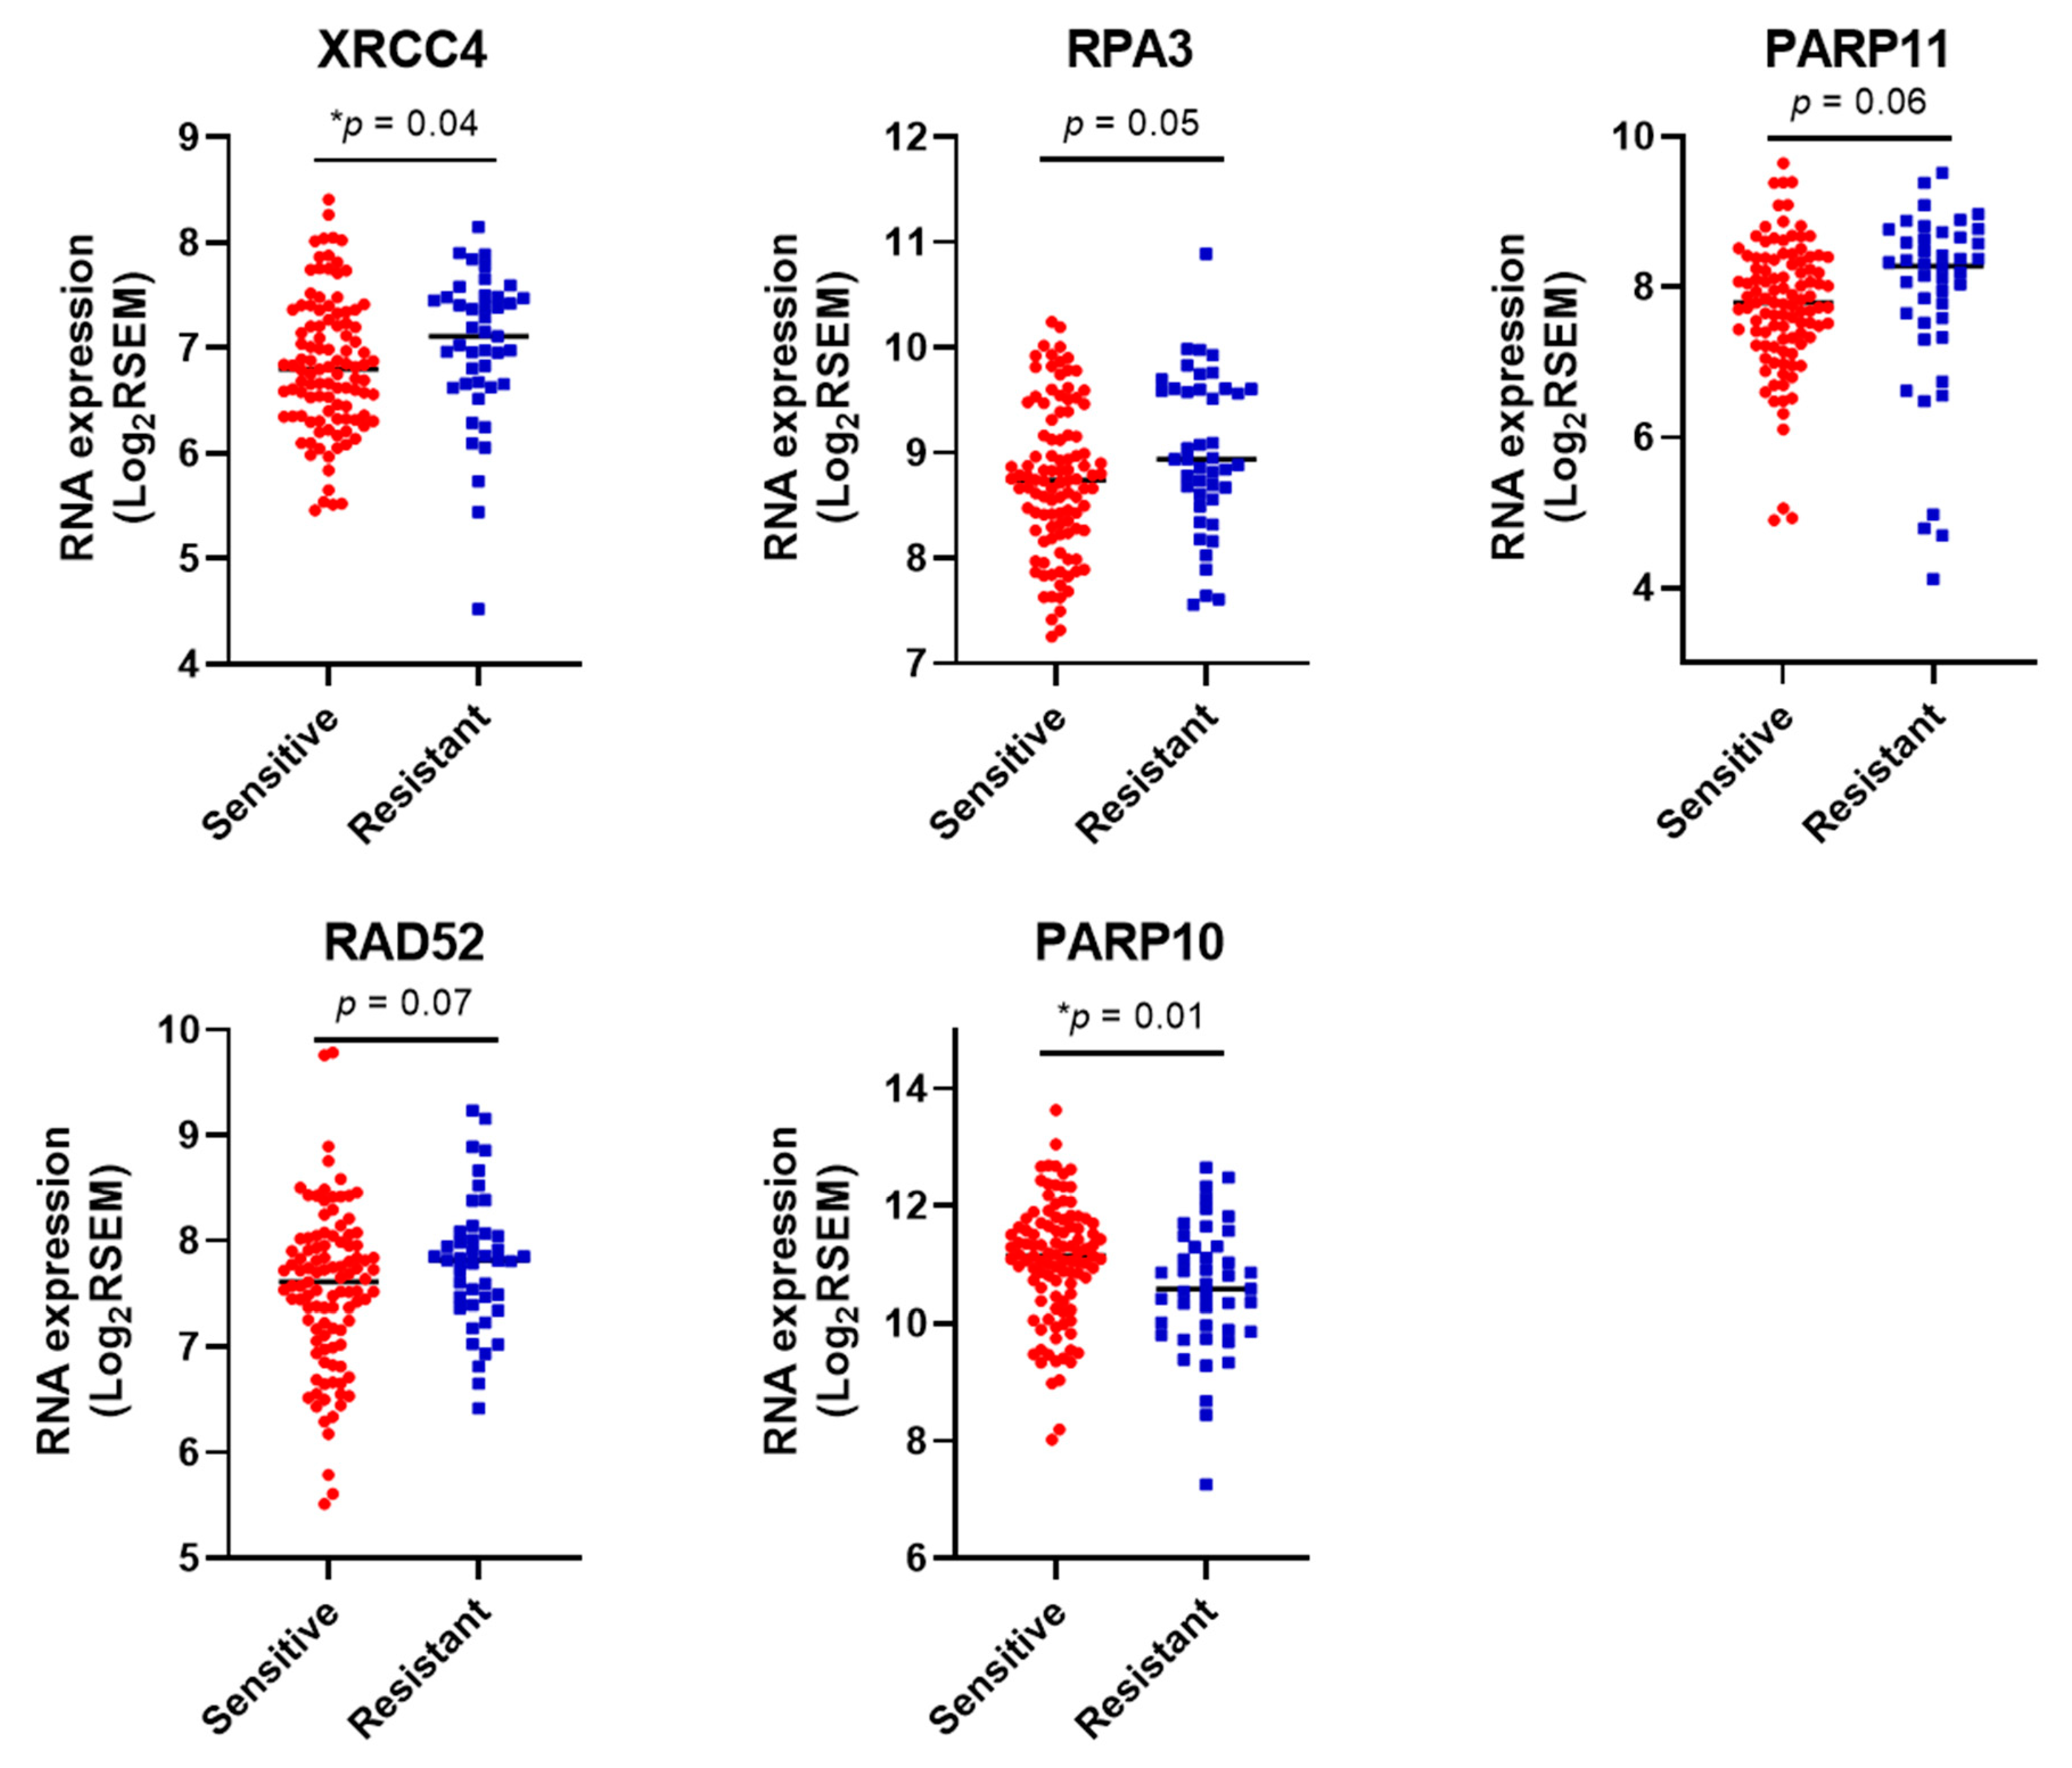
3.4. DDR Gene Expression Correlates with Sensitivity to Platinum Chemotherapy in HGSOCs in the TCGA Cohort.
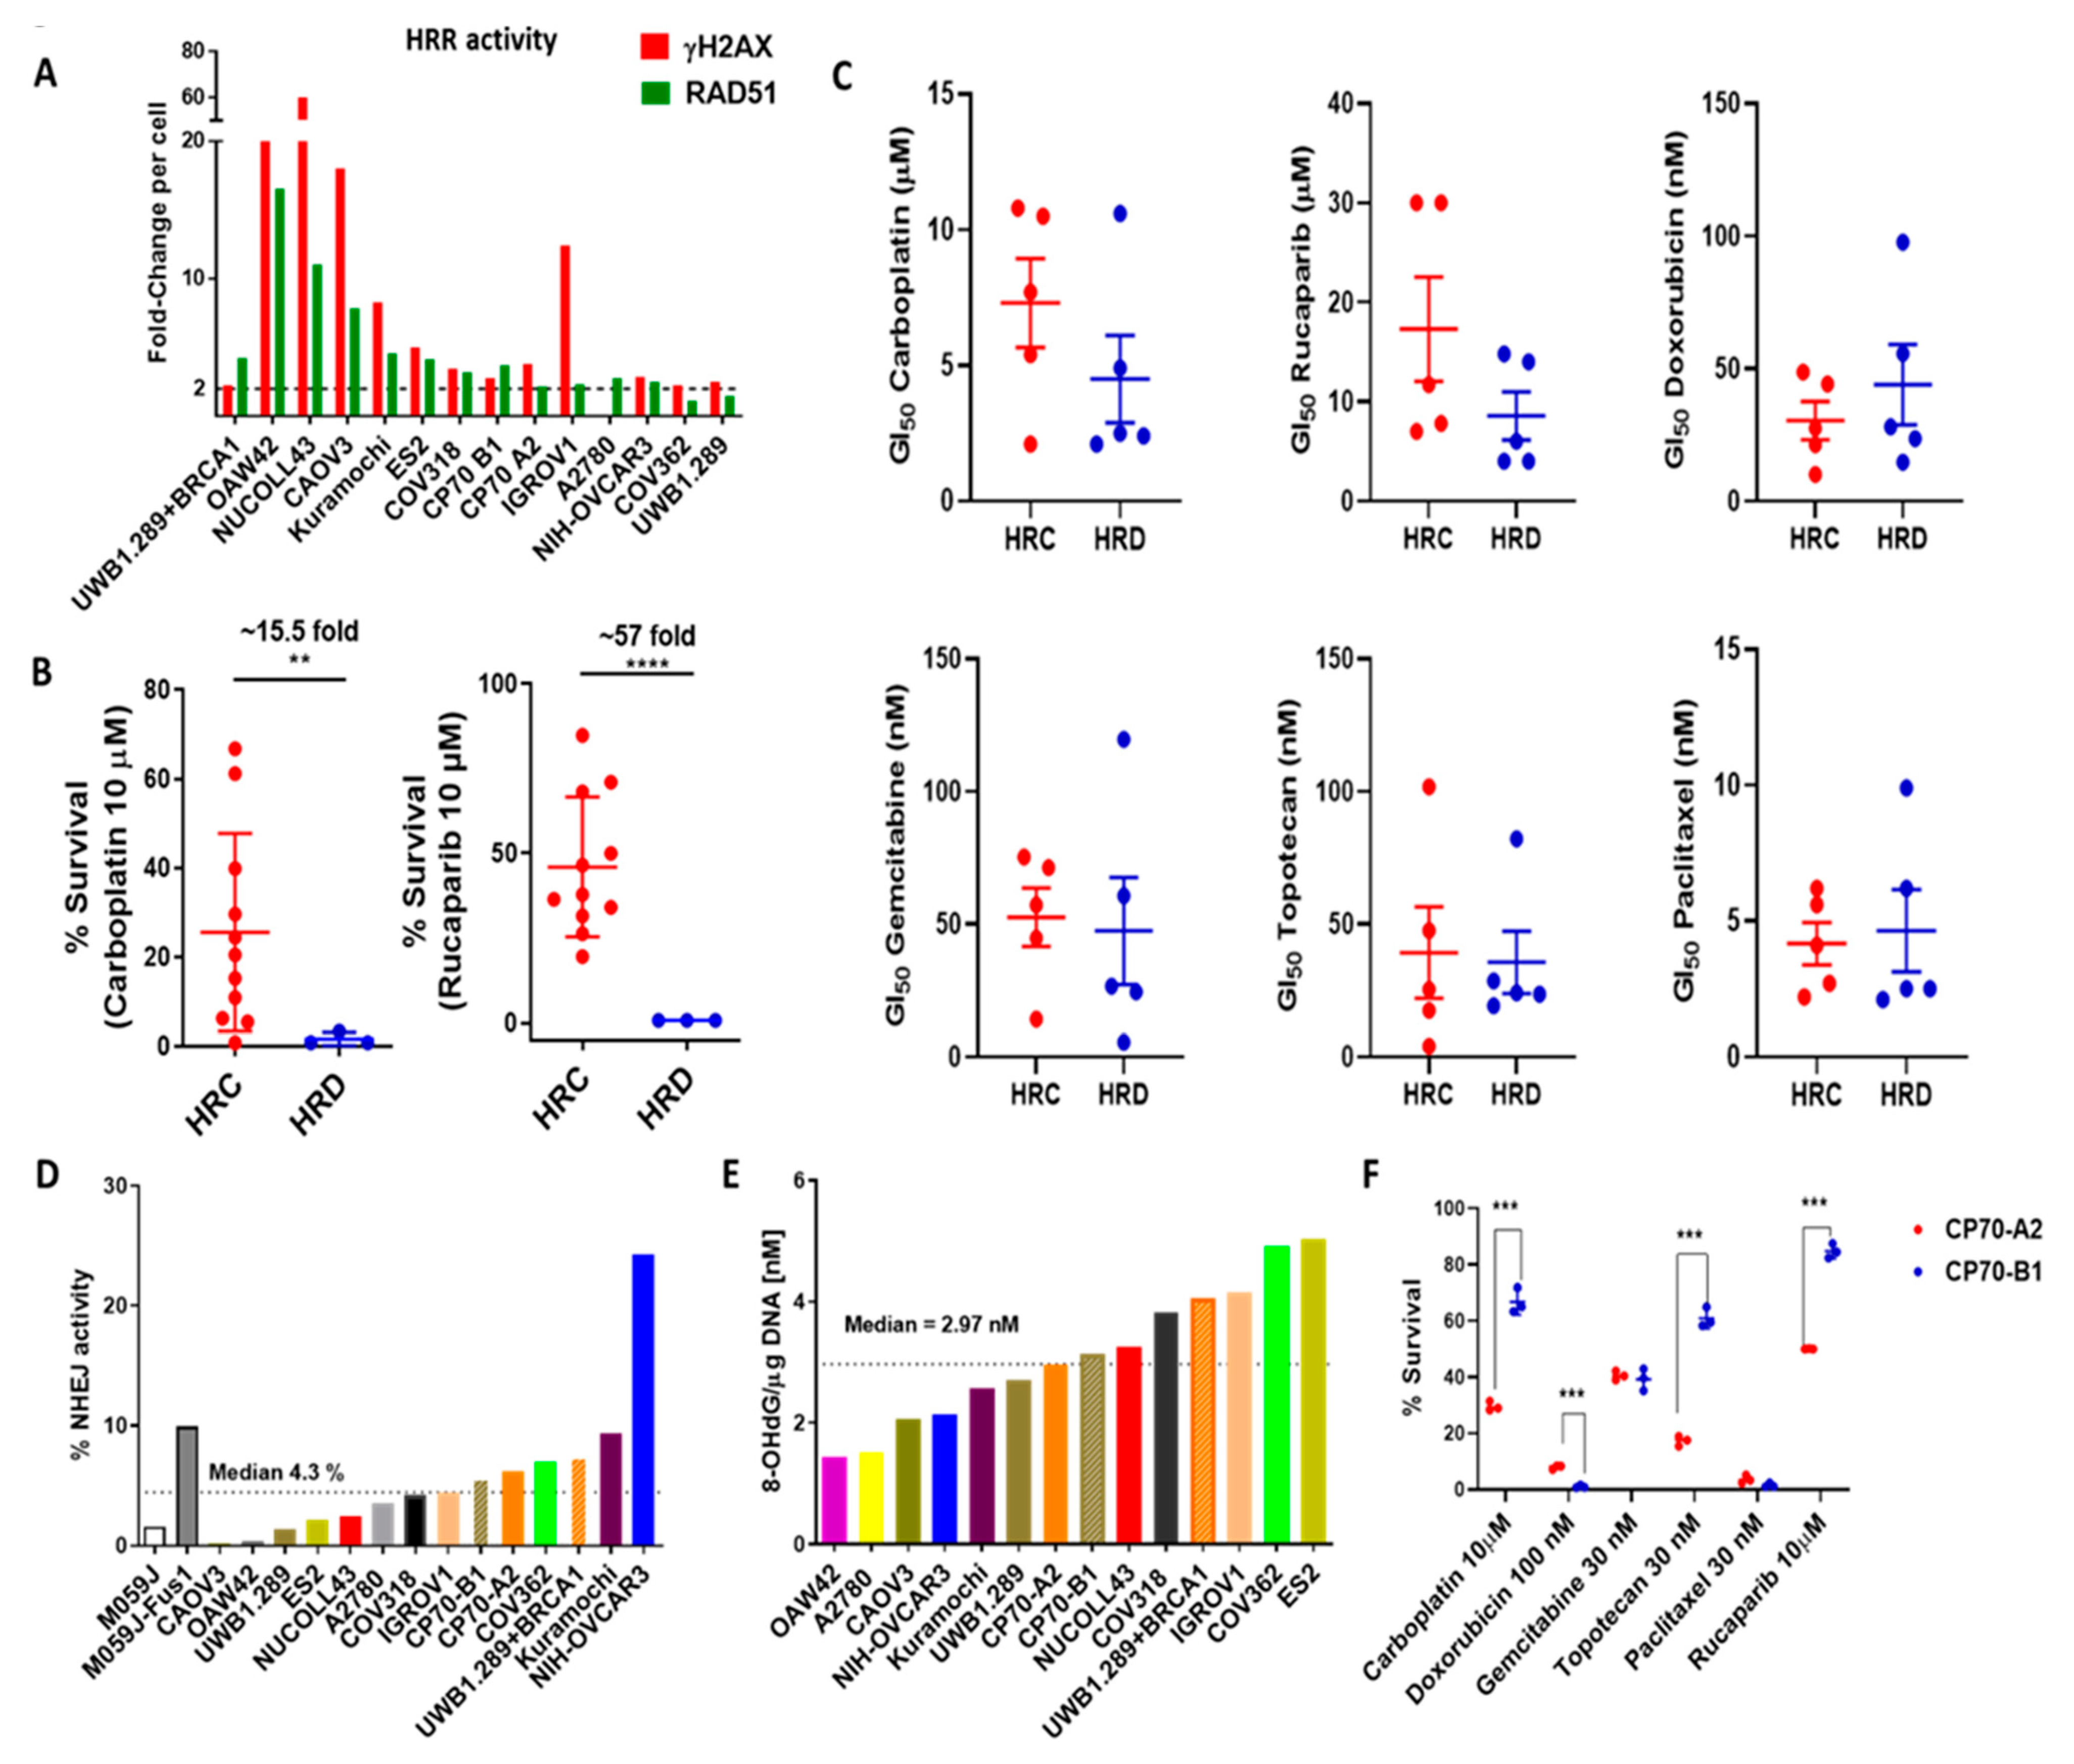
3.5. Functional Status of DDR Pathways Determine Response to Chemotherapy
4. Discussion
5. Conclusions
6. Patents
- Helleday T and Curtin NJ. Therapeutic Compounds (PARP inhibitors in homologous repair/BRCA defective cancer) WO 2005/012305 A2
- Boritzki TJ, Calvert AH, Curtin NJ, Dewji MR, Hostomsky Z, Jones C, Kaufman R, Klamerus KJ, Newell DR, Plummer ER, Reich SD, Steinfeldt HM, Stratford IJ, Thomas HR Williams KJ. Therapeutic Combinations Comprising PARP inhibitor WO/2006/033006
- Falcon S, Reaper P, Pollard J, Curtin NJ, Middleton FK and Chen T. Method for measuring ATR inhibition mediated increases in DNA damage. WO2014055756A1
Supplementary Materials
Author Contributions
Funding
Institutional Review Board Statement
Informed Consent Statement
Data Availability Statement
Acknowledgments
Conflicts of Interest
References
- Bray, F.; Ferlay, J.; Soerjomataram, I.; Siegel, R.L.; Torre, L.A.; Jemal, A. Global cancer statistics 2018: GLOBOCAN estimates of incidence and mortality worldwide for 36 cancers in 185 countries. CA A Cancer J. Clin. 2018, 68, 394–424. [Google Scholar] [CrossRef]
- McCluggage, W.G. Morphological subtypes of ovarian carcinoma: A review with emphasis on new developments and pathogenesis. Pathology 2011, 43, 420–432. [Google Scholar] [CrossRef]
- Colombo, N.; Sessa, C.; Bois, A.D.; Ledermann, J.; McCluggage, W.G.; McNeish, I.; Morice, P.; Pignata, S.; Ray-Coquard, I.; Vergote, I.; et al. ESMO-ESGO consensus conference recommendations on ovarian cancer: Pathology and molecular biology, early and advanced stages, borderline tumours and recurrent disease. Ann. Oncol. 2019, 30, 672–705. [Google Scholar] [CrossRef]
- Clamp, A.R.; James, E.C.; McNeish, I.A.; Dean, A.; Kim, J.W.; O’Donnell, D.M.; Hook, J.; Coyle, C.; Blagden, S.; Brenton, J.D.; et al. Weekly dose-dense chemotherapy in first-line epithelial ovarian, fallopian tube, or primary peritoneal carcinoma treatment (ICON8): Primary progression free survival analysis results from a GCIG phase 3 randomised controlled trial. Lancet 2019, 394, 2084–2095. [Google Scholar] [CrossRef]
- Lee, C.K.; Scott, C.; Lindeman, G.J.; Hamilton, A.; Lieschke, E.; Gibbs, E.; Asher, R.; Badger, H.; Paterson, R.; Macnab, L.; et al. Phase 1 trial of olaparib and oral cyclophosphamide in BRCA breast cancer, recurrent BRCA ovarian cancer, non-BRCA triple-negative breast cancer, and non-BRCA ovarian cancer. Br. J. Cancer 2019, 120, 279–285. [Google Scholar] [CrossRef]
- Gelmon, K.A.; Tischkowitz, M.; Mackay, H.; Swenerton, K.; Robidoux, A.; Tonkin, K.; Hirte, H.; Huntsman, D.; Clemons, M.; Gilks, B.; et al. Olaparib in patients with recurrent high-grade serous or poorly differentiated ovarian carcinoma or triple-negative breast cancer: A phase 2, multicentre, open-label, non-randomised study. Lancet Oncol. 2011, 12, 852–861. [Google Scholar] [CrossRef]
- Swisher, E.M.; Lin, K.K.; Oza, A.M.; Scott, C.L.; Giordano, H.; Sun, J.; Konecny, G.E.; Coleman, R.L.; Tinker, A.V.; O’Malley, D.M.; et al. Rucaparib in relapsed, platinum-sensitive high-grade ovarian carcinoma (ARIEL2 Part 1): An international, multicentre, open-label, phase 2 trial. Lancet Oncol. 2017, 18, 75–87. [Google Scholar] [CrossRef]
- Aghajanian, C.; Goff, B.; Nycum, L.R.; Wang, Y.V.; Husain, A.; Blank, S.V. Final overall survival and safety analysis of OCEANS, a phase 3 trial of chemotherapy with or without bevacizumab in patients with platinum-sensitive recurrent ovarian cancer. Gynecol. Oncol. 2015, 139, 10–16. [Google Scholar] [CrossRef] [PubMed]
- Bouberhan, S.; Pujade-Lauraine, E.; Cannistra, S.A. Advances in the Management of Platinum-Sensitive Relapsed Ovarian Cancer. J. Clin. Oncol. 2019, 37, 2424–2436. [Google Scholar] [CrossRef] [PubMed]
- Pennington, K.P.; Walsh, T.; Harrell, M.I.; Lee, M.K.; Pennil, C.C.; Rendi, M.H.; Thornton, A.; Norquist, B.M.; Casadei, S.; Nord, A.S.; et al. Germline and somatic mutations in homologous recombination genes predict platinum response and survival in ovarian, fallopian tube, and peritoneal carcinomas. Clin. Cancer Res. 2014, 20, 764–775. [Google Scholar] [CrossRef]
- Coleman, R.L.; Oza, A.M.; Lorusso, D.; Aghajanian, C.; Oaknin, A.; Dean, A.; Colombo, N.; Weberpals, J.I.; Clamp, A.; Scambia, G.; et al. Rucaparib maintenance treatment for recurrent ovarian carcinoma after response to platinum therapy (ARIEL3): A randomised, double-blind, placebo-controlled, phase 3 trial. Lancet 2017, 390, 1949–1961. [Google Scholar] [CrossRef]
- Domcke, S.; Sinha, R.; Levine, D.A.; Sander, C.; Schultz, N. Evaluating cell lines as tumour models by comparison of genomic profiles. Nat. Commun. 2013, 4, 2126. [Google Scholar] [CrossRef] [PubMed]
- Bradbury, A.; O’Donnell, R.; Drew, Y.; Curtin, N.J.; Sharma Saha, S. Characterisation of Ovarian Cancer Cell Line NIH-OVCAR3 and Implications of Genomic, Transcriptomic, Proteomic and Functional DNA Damage Response Biomarkers for Therapeutic Targeting. Cancers 2020, 12, 1939. [Google Scholar] [CrossRef]
- RL, O.D.; McCormick, A.; Mukhopadhyay, A.; Woodhouse, L.C.; Moat, M.; Grundy, A.; Dixon, M.; Kaufman, A.; Soohoo, S.; Elattar, A.; et al. The use of ovarian cancer cells from patients undergoing surgery to generate primary cultures capable of undergoing functional analysis. PLoS ONE 2014, 9, e90604. [Google Scholar]
- Drew, Y.; Mulligan, E.A.; Vong, W.T.; Thomas, H.D.; Kahn, S.; Kyle, S.; Mukhopadhyay, A.; Los, G.; Hostomsky, Z.; Plummer, E.R.; et al. Therapeutic potential of poly(ADP-ribose) polymerase inhibitor AG014699 in human cancers with mutated or methylated BRCA1 or BRCA2. J. Natl. Cancer Inst. 2011, 103, 334–346. [Google Scholar] [CrossRef]
- Bennardo, N.; Cheng, A.; Huang, N.; Stark, J.M. Alternative-NHEJ is a mechanistically distinct pathway of mammalian chromosome break repair. PLoS Genet. 2008, 4, e1000110. [Google Scholar] [CrossRef]
- Integrated genomic analyses of ovarian carcinoma. Nature 2011, 474, 609–615. [CrossRef]
- Mukhopadhyay, A.; Plummer, E.R.; Elattar, A.; Soohoo, S.; Uzir, B.; Quinn, J.E.; McCluggage, W.G.; Maxwell, P.; Aneke, H.; Curtin, N.J.; et al. Clinicopathological features of homologous recombination-deficient epithelial ovarian cancers: Sensitivity to PARP inhibitors, platinum, and survival. Cancer Res. 2012, 72, 5675–5682. [Google Scholar] [CrossRef]
- Jonsson, P.; Bandlamudi, C.; Cheng, M.L.; Srinivasan, P.; Chavan, S.S.; Friedman, N.D.; Rosen, E.Y.; Richards, A.L.; Bouvier, N.; Selcuklu, S.D.; et al. Tumour lineage shapes BRCA-mediated phenotypes. Nature 2019, 571, 576–579. [Google Scholar] [CrossRef] [PubMed]
- Hosoya, N.; Miyagawa, K. Targeting DNA damage response in cancer therapy. Cancer Sci. 2014, 105, 370–388. [Google Scholar] [CrossRef]
- O’Connor, M.J. Targeting the DNA Damage Response in Cancer. Mol. Cell 2015, 60, 547–560. [Google Scholar] [CrossRef]
- Anglesio, M.S.; Wiegand, K.C.; Melnyk, N.; Chow, C.; Salamanca, C.; Prentice, L.M.; Senz, J.; Yang, W.; Spillman, M.A.; Cochrane, D.R.; et al. Type-specific cell line models for type-specific ovarian cancer research. PLoS ONE 2013, 8, e72162. [Google Scholar] [CrossRef]
- Beaufort, C.M.; Helmijr, J.C.; Piskorz, A.M.; Hoogstraat, M.; Ruigrok-Ritstier, K.; Besselink, N.; Murtaza, M.; van IJcken, W.F.; Heine, A.A.; Smid, M.; et al. Ovarian cancer cell line panel (OCCP): Clinical importance of in vitro morphological subtypes. PLoS ONE 2014, 9, e103988. [Google Scholar] [CrossRef]
- Haibe-Kains, B.; El-Hachem, N.; Birkbak, N.J.; Jin, A.C.; Beck, A.H.; Aerts, H.J.; Quackenbush, J. Inconsistency in large pharmacogenomic studies. Nature 2013, 504, 389–393. [Google Scholar] [CrossRef] [PubMed]
- Schleicher, E.M.; Galvan, A.M.; Imamura-Kawasawa, Y.; Moldovan, G.L.; Nicolae, C.M. PARP10 promotes cellular proliferation and tumorigenesis by alleviating replication stress. Nucleic Acids Res. 2018, 46, 8908–8916. [Google Scholar] [CrossRef] [PubMed]
- Lu, H.; Shamanna, R.A.; Keijzers, G.; Anand, R.; Rasmussen, L.J.; Cejka, P.; Croteau, D.L.; Bohr, V.A. RECQL4 Promotes DNA End Resection in Repair of DNA Double-Strand Breaks. Cell Rep. 2016, 16, 161–173. [Google Scholar] [CrossRef]
- Lu, H.; Shamanna, R.A.; de Freitas, J.K.; Okur, M.; Khadka, P.; Kulikowicz, T.; Holland, P.P.; Tian, J.; Croteau, D.L.; Davis, A.J.; et al. Cell cycle-dependent phosphorylation regulates RECQL4 pathway choice and ubiquitination in DNA double-strand break repair. Nat. Commun. 2017, 8, 2039. [Google Scholar] [CrossRef]
- Patel, A.G.; Sarkaria, J.N.; Kaufmann, S.H. Nonhomologous end joining drives poly(ADP-ribose) polymerase (PARP) inhibitor lethality in homologous recombination-deficient cells. Proc. Natl. Acad. Sci. USA 2011, 108, 3406–3411. [Google Scholar] [CrossRef]
- Martin, L.P.; Hamilton, T.C.; Schilder, R.J. Platinum resistance: The role of DNA repair pathways. Clin. Cancer Res. 2008, 14, 1291–1295. [Google Scholar] [CrossRef]
- Mohindra, A.; Hays, L.E.; Phillips, E.N.; Preston, B.D.; Helleday, T.; Meuth, M. Defects in homologous recombination repair in mismatch-repair-deficient tumour cell lines. Hum. Mol. Genet. 2002, 11, 2189–2200. [Google Scholar] [CrossRef]
- Caldecott, K.; Banks, G.; Jeggo, P. DNA double-strand break repair pathways and cellular tolerance to inhibitors of topoisomerase II. Cancer Res. 1990, 50, 5778–5783. [Google Scholar]
- Jeggo, P.A.; Caldecott, K.; Pidsley, S.; Banks, G.R. Sensitivity of Chinese hamster ovary mutants defective in DNA double strand break repair to topoisomerase II inhibitors. Cancer Res. 1989, 49, 7057–7063. [Google Scholar] [PubMed]
- Munck, J.M.; Batey, M.A.; Zhao, Y.; Jenkins, H.; Richardson, C.J.; Cano, C.; Tavecchio, M.; Barbeau, J.; Bardos, J.; Cornell, L.; et al. Chemosensitization of cancer cells by KU-0060648, a dual inhibitor of DNA-PK and PI-3K. Mol. Cancer Ther. 2012, 11, 1789–1798. [Google Scholar] [CrossRef] [PubMed]
- Fok, J.H.L.; Ramos-Montoya, A.; Vazquez-Chantada, M.; Wijnhoven, P.W.G.; Follia, V.; James, N.; Farrington, P.M.; Karmokar, A.; Willis, S.E.; Cairns, J.; et al. AZD7648 is a potent and selective DNA-PK inhibitor that enhances radiation, chemotherapy and olaparib activity. Nat. Commun. 2019, 10, 5065. [Google Scholar] [CrossRef] [PubMed]
- Tavecchio, M.; Munck, J.M.; Cano, C.; Newell, D.R.; Curtin, N.J. Further characterisation of the cellular activity of the DNA-PK inhibitor, NU7441, reveals potential cross-talk with homologous recombination. Cancer Chemother. Pharmacol. 2012, 69, 155–164. [Google Scholar] [CrossRef] [PubMed]
- Parchment, R.E.; Pessina, A. Topoisomerase I inhibitors and drug resistance. Cytotechnology 1998, 27, 149–164. [Google Scholar] [CrossRef]
- Ju, H.Q.; Gocho, T.; Aguilar, M.; Wu, M.; Zhuang, Z.N.; Fu, J.; Yanaga, K.; Huang, P.; Chiao, P.J. Mechanisms of Overcoming Intrinsic Resistance to Gemcitabine in Pancreatic Ductal Adenocarcinoma through the Redox Modulation. Mol. Cancer Ther. 2015, 14, 788–798. [Google Scholar] [CrossRef]


| Cell Line | Carboplatin | Doxorubicin | Gemcitabine | Topotecan | Paclitaxel | Rucaparib | ||||||
|---|---|---|---|---|---|---|---|---|---|---|---|---|
| LC50 (µM) | % Survival (10 µM) | LC50 (nM) | % Survival (100 nM) | LC50 (nM) | % Survival (30 nM) | LC50 (nM) | % Survival (30 nM) | LC50 (nM) | % Survival (30 nM) | LC50 (µM) | % Survival (10 µM) | |
| Kuramochi | 2.9 ± 0.6 | 6.2 ± 3.1 | 38.8 ± 3.3 | 17.6 ± 1.3 | 58.9 ± 18.9 | 56.4 ± 4.6 | 16.3 ± 1.5 | 29 ± 3.7 | 3.7 ± 1.5 | 33.4 ± 3.3 | 3 ± 0.5 | 26.3 ± 7.5 |
| COV318 | 2.8 ± 0.2 | 20.5 ±2.6 | 35.3 ± 0.5 | 14.4 ± 0.8 | 17.8 ± 1.6 | 30.8 ± 0.7 | 17.5 ± 0.6 | 27.4 ± 1.5 | 9.7 ± 0.2 | 32.1 ± 4 | 2.8 ± 0.2 | 36.5 ± 2 |
| CAOV3 | 3.1 ± 1.7 | 24.4 ± 3.6 | 19.3 ± 0.7 | 0.8 ± 0.0 | 7 ± 0.2 | 7.1 ± 0.2 | 16.1 ± 1.4 | 17 ± 2 | 0.9 ± 0.1 | 1.8 ± 0.9 | 2.4 ± 0.1 | 19.6 ± 2.3 |
| ES2 | 17.3 ± 2.4 | 61.2 ± 4.3 | 72.7 ± 5.2 | 35.3 ± 1.7 | 13.6 ± 1.6 | 12.8 ± 3.2 | 13.6 ± 1.9 | 7.6 ±2.7 | 6.9 ± 0.2 | 1.3 ± 0.5 | 19.2 ± 0.9 | 71.1 ± 3.8 |
| OAW42 | 2.7 ± 0.2 | 10.9 ± 0.9 | 59.2 ± 4.9 | 21.9 ± 1.7 | 99.2 ± 8.9 | 66.9 ± 5.2 | 12.7 ± 1.3 | 13.7 ± 2.1 | 2.6 ± 0.04 | 2.5 ± 0.8 | 3.7 ± 0.8 | 37.9 ± 2 |
| A2780 | 3.5 ± 0.7 | 15.3 ± 4.3 | 45.3 ± 2.2 | 4 ± 1.5 | 26.1 ± 2.1 | 42.2 ± 4.6 | 17.5 ± 1.7 | 12 ± 5.4 | 2.3 ± 0.2 | 0.8 ± 0.00 | 4.4 ± 1.1 | 31.6 ± 2.6 |
| CP70-B1 | 22.1 ± 3.2 | 66.8 ± 4.5 | 27.9 ± 0.4 | 1.1 ± 0.3 | 25.9 ± 1.2 | 39.3 ± 3.9 | 42.9 ± 3.3 | 61 ± 3.6 | 2.5 ± 0.1 | 1.5 ± 0.7 | >30 | 84.8 ± 2.6 |
| CP70-A2 | 7.3 ± 0.04 | 29.6 ± 1.6 | 52.1 ± 2.6 | 8 ± 0.4 | 25.2 ± 0.9 | 40.6 ± 1.6 | 11.8 ± 2 | 17.4 ± 1.7 | 2.9 ± 0.1 | 3.7 ± 1.4 | 10 ± 0.1 | 50.1 ± 0.1 |
| IGROV1 | 2.3 ± 0.3 | 5.4 ± 1.7 | 42.7 ± 2.2 | 13.2 ± 0.7 | 8 ± 0.6 | 27.7 ± 4.2 | 12.5 ± 1.9 | 14.9 ± 3.1 | 2.5 ± 0.3 | 11.3 ± 1.1 | 8.9 ± 1.2 | 46.6 ± 3.7 |
| UWB1.289 + BRCA1 | 1.3 ± 0.1 | 0.8 ± 0.00 | 62.3 ± 2.5 | 23.8 ± 1.6 | 22.2 ± 0.3 | 31.4 ± 2.1 | 10.5 ± 0.1 | 5.7 ± 1.04 | 2.5 ± 0.02 | 7.6 ± 0.6 | 2.8 ± 0.1 | 34.1 ± 2.9 |
| NUCOLL43 | 7.8 ± 1 | 39.9 ± 4.2 | 43.5 ± 3 | 4.2 ± 0.3 | 71. ± 9.6 | 69.4 ± 0.8 | 15 ± 2.6 | 7.2 ± 2.2 | 2.5 ± 0.1 | 5.1 ± 1.3 | 20.8 ± 0.6 | 68.1 ± 1.6 |
| NIH-OVCAR3 | 1.3 ± 0.3 | 0.8 ± 0.00 | 55 ± 3.4 | 16.9 ± 3.2 | 41.6 ± 2.1 | 58.8 ± 2 | 7.2 ± 0.6 | 11.6 ± 1.7 | 2.7 ± 0.1 | 16.1 ± 2.5 | 0.4 ± 0.06 | 0.8 ± 0.00 |
| UWB1.289 | 0.7 ± 0.03 | 0.8 ± 0.00 | 44.9 ± 3.3 | 13.6 ± 0.7 | 8.2 ± 0.6 | 7.2 ± 0.8 | 4.1 ± 0.6 | 0.08 ± 0.0 | 2.6 ± 0.07 | 3.9 ± 1.2 | 0.2 ± 0.02 | 0.8 ± 0.00 |
| COV362 | 2.6 ± 0.1 | 3.4 ± 0.5 | 28.3 ± 1.2 | 7.7 ± 0.2 | 20 ± 1 | 29.8 ± 2.1 | 12.9 ± 0.6 | 25.8 ± 2.5 | 2.7 ± 0.06 | 18.8 ± 1.3 | 0.2± 0.01 | 0.8 ± 0.0 |
Publisher’s Note: MDPI stays neutral with regard to jurisdictional claims in published maps and institutional affiliations. |
© 2021 by the authors. Licensee MDPI, Basel, Switzerland. This article is an open access article distributed under the terms and conditions of the Creative Commons Attribution (CC BY) license (http://creativecommons.org/licenses/by/4.0/).
Share and Cite
Sharma Saha, S.; Gentles, L.; Bradbury, A.; Brecht, D.; Robinson, R.; O’Donnell, R.; Curtin, N.J.; Drew, Y. Genomic, Transcriptomic, and Functional Alterations in DNA Damage Response Pathways as Putative Biomarkers of Chemotherapy Response in Ovarian Cancer. Cancers 2021, 13, 1420. https://doi.org/10.3390/cancers13061420
Sharma Saha S, Gentles L, Bradbury A, Brecht D, Robinson R, O’Donnell R, Curtin NJ, Drew Y. Genomic, Transcriptomic, and Functional Alterations in DNA Damage Response Pathways as Putative Biomarkers of Chemotherapy Response in Ovarian Cancer. Cancers. 2021; 13(6):1420. https://doi.org/10.3390/cancers13061420
Chicago/Turabian StyleSharma Saha, Sweta, Lucy Gentles, Alice Bradbury, Dominik Brecht, Rebecca Robinson, Rachel O’Donnell, Nicola J. Curtin, and Yvette Drew. 2021. "Genomic, Transcriptomic, and Functional Alterations in DNA Damage Response Pathways as Putative Biomarkers of Chemotherapy Response in Ovarian Cancer" Cancers 13, no. 6: 1420. https://doi.org/10.3390/cancers13061420
APA StyleSharma Saha, S., Gentles, L., Bradbury, A., Brecht, D., Robinson, R., O’Donnell, R., Curtin, N. J., & Drew, Y. (2021). Genomic, Transcriptomic, and Functional Alterations in DNA Damage Response Pathways as Putative Biomarkers of Chemotherapy Response in Ovarian Cancer. Cancers, 13(6), 1420. https://doi.org/10.3390/cancers13061420