
Quantitative FDG PET Assessment for Oncology Therapy


Abstract
Simple Summary
Abstract
1. Introduction
2. Basic Concepts for Quantitative FDG PET Assessment
2.1. Qualitative Vs. Quantitative Assessment
2.2. Type of Quantitative Assessment
2.3. Volumetric Indices
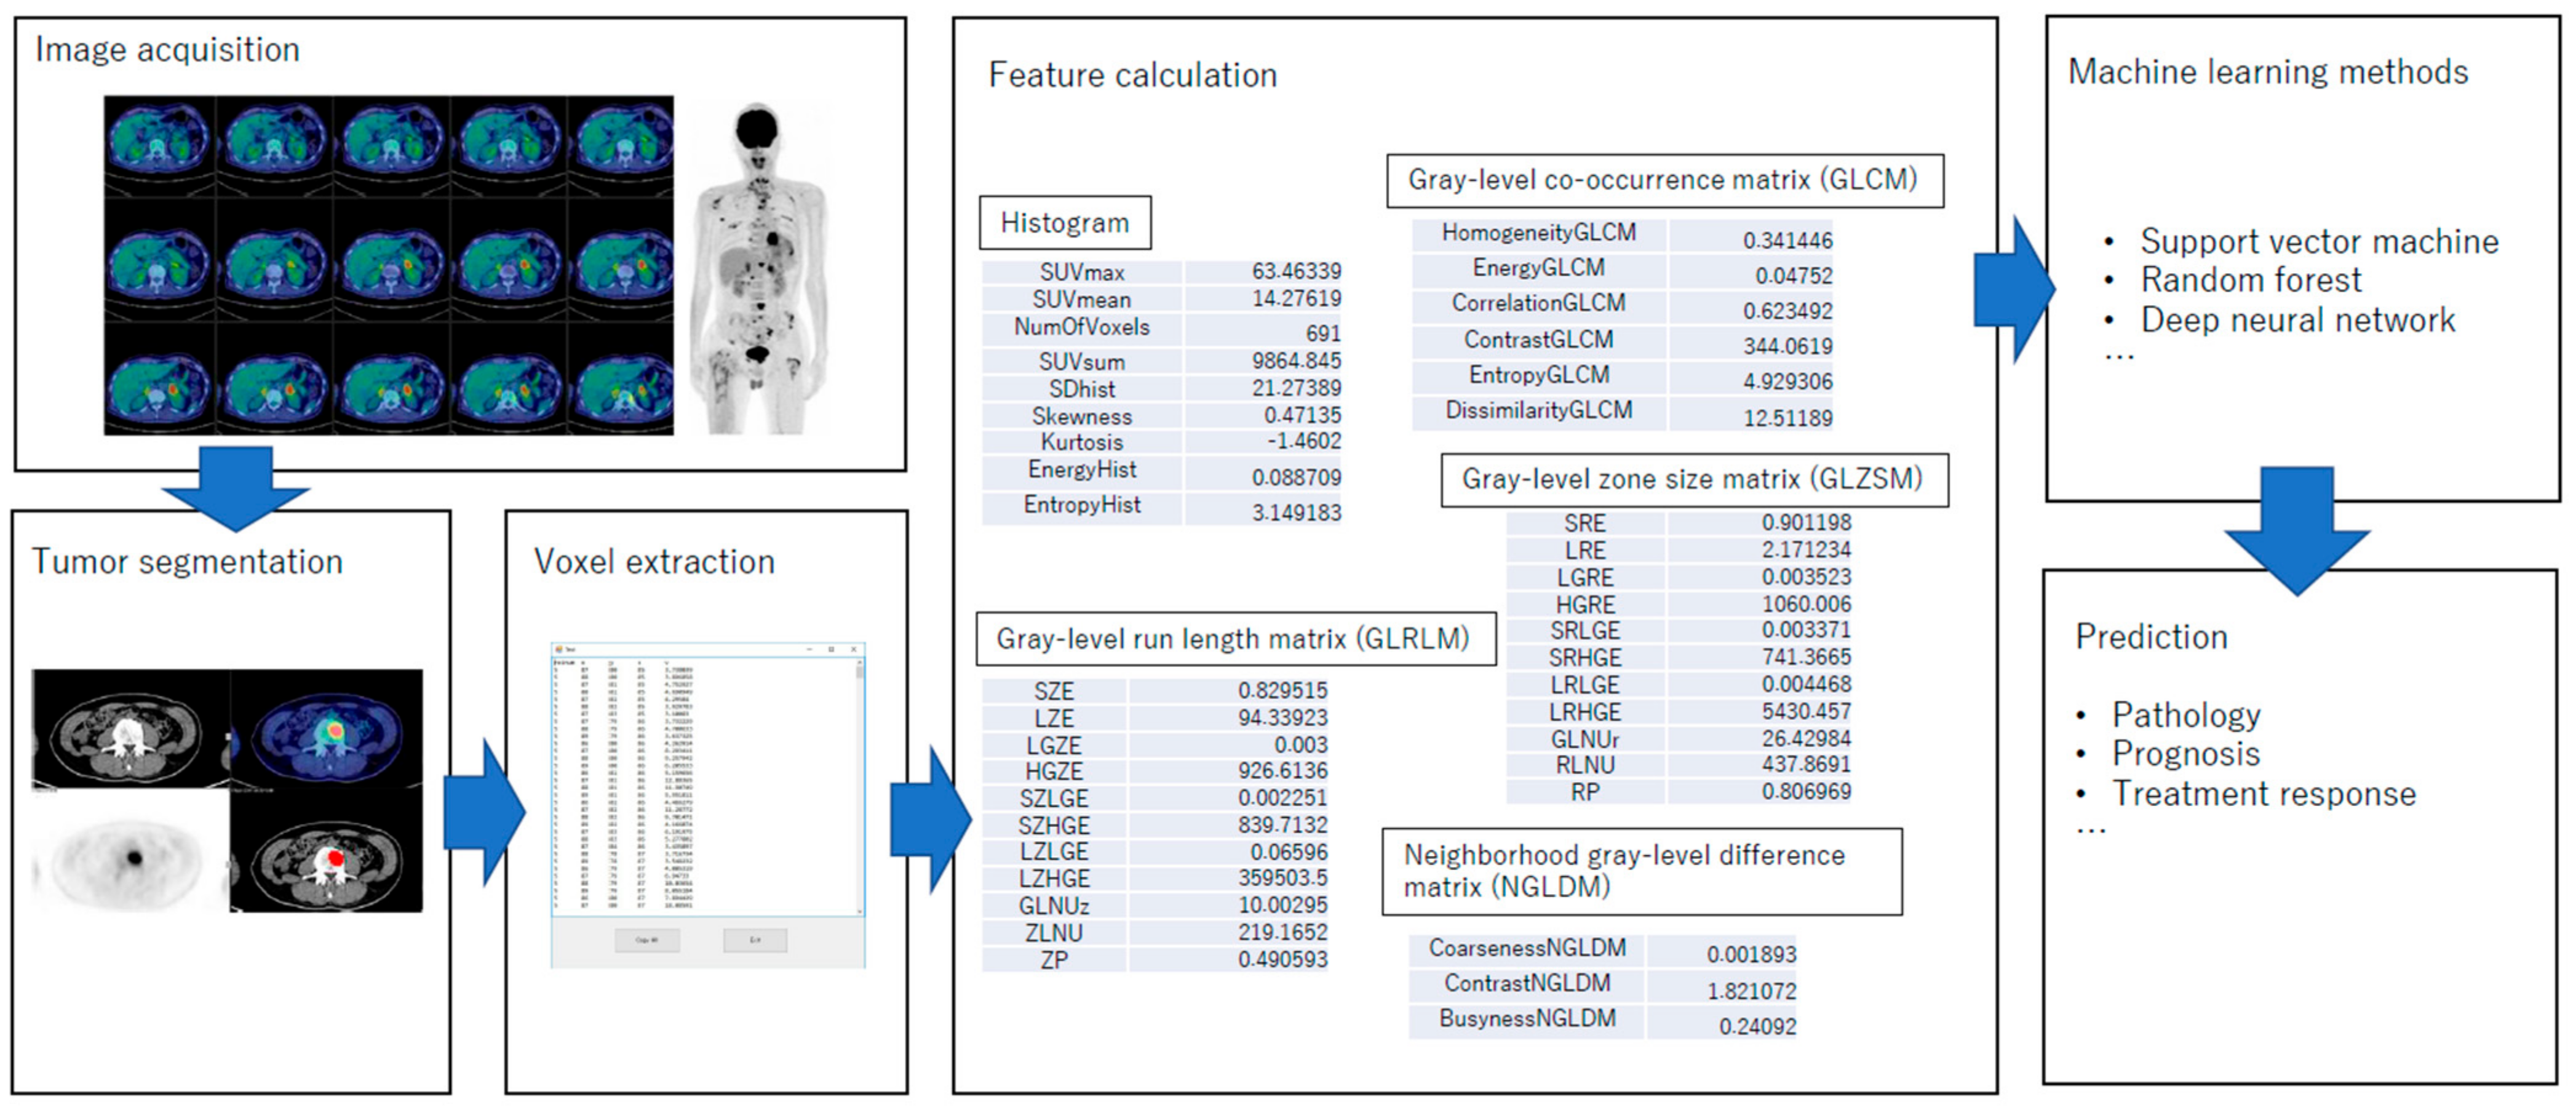
2.4. Radiomics
3. Clinical Applications of FDG PET
3.1. Tumour Characterization
3.2. Optimal Assessment of Treatment Effect and Outcome
4. Conclusions
Funding
Data Availability Statement
Conflicts of Interest
References
- Lang, D.; Wahl, G.; Poier, N.; Graf, S.; Kiesl, D.; Lamprecht, B.; Gabriel, M. Impact of PET/CT for Assessing Response to Immunotherapy-A Clinical Perspective. J. Clin. Med. 2020, 9, 3483. [Google Scholar] [CrossRef]
- Lammertsma, A.A. Forward to the Past: The Case for Quantitative PET Imaging. J. Nucl. Med. 2017, 58, 1019–1024. [Google Scholar] [CrossRef] [PubMed]
- Cho, S.Y.; Huff, D.T.; Jeraj, R.; Albertini, M. FDG PET/CT for Assessment of Immune Therapy: Opportunities and Understanding Pitfalls. Semin. Nucl. Med. 2020, 50, 518–531. [Google Scholar] [CrossRef] [PubMed]
- Fletcher, J.W.; Djulbegovic, B.; Soares, H.P.; Siegel, B.A.; Lowe, V.J.; Lyman, G.H.; Coleman, R.E.; Wahl, R.; Paschold, J.C. Recommendations on the use of 18F-FDG PET in oncology. J. Nucl. Med. 2008, 49, 480–508. [Google Scholar] [CrossRef] [PubMed]
- El-Galaly, T.C.; Gormsen, L.C.; Hutchings, M. PET/CT for Staging; Past, Present, and Future. Semin. Nucl. Med. 2018, 48, 4–16. [Google Scholar] [CrossRef]
- Shen, G.; Lan, Y.; Zhank, G.; Ren, P.; Jia, Z. Comparison of 18F-FDG PET/CT and DWI for detection of mediastinal nodal metastasis in non-small cell lung cancer: A meta-analysis. PLoS ONE 2017, 12, e0173104. [Google Scholar]
- Cheson, B.D.; Fisher, R.I.; Barrington, S.F.; Cavalli, F.; Schwartz, L.H.; Zucca, E.; Lister, T.A.; Lliance, Australasian Leukaemia and Lymphoma Group; Eastern Cooperative Oncology Group; European Mantle Cell Lymphoma Consortium; et al. Recommendations for initial evaluation, staging, and response assessment of Hodgkin and non-Hodgkin lymphoma: The Lugano classification. J. Clin. Oncol. 2014, 32, 3059–3068. [Google Scholar] [CrossRef] [PubMed]
- Wahl, R.L.; Jacene, H.; Kasamon, Y.; Lodge, M.A. From RECIST to PERCIST: Evolving Considerations for PET response criteria in solid tumors. J. Nucl. Med. 2009, 50, 122S–150S. [Google Scholar] [CrossRef]
- Kessler, L.G.; Barnhart, H.X.; Buckler, A.J.; Choudhury, K.R.; Kondratovich, M.V.; Toledano, A.; Guimaraes, A.R.; Filice, R.; Zhang, Z.; Sullivan, D.C.; et al. The emerging science of quantitative imaging biomarkers terminology and definitions for scientific studies and regulatory submissions. Stat. Methods Med. Res. 2015, 24, 9–26. [Google Scholar] [CrossRef]
- Mu, W.; Jiang, L.; Zhang, J.; Shi, Y.; Gray, J.E.; Tunali, I.; Gao, C.; Sun, Y.; Tian, J.; Zhao, X.; et al. Non-invasive decision support for NSCLC treatment using PET/CT radiomics. Nat. Commun. 2020, 11, 5228. [Google Scholar] [CrossRef]
- Greco, C.; Rosenzweig, K.; Cascini, G.L.; Tamburrini, O. Current status of PET/CT for tumour volume definition in radiotherapy treatment planning for non-small cell lung cancer (NSCLC). Lung Cancer 2007, 57, 125–134. [Google Scholar] [CrossRef]
- Troost, E.G.; Thorwarth, D.; Oyen, W.J. Imaging-Based Treatment Adaptation in Radiation Oncology. J. Nucl. Med. 2015, 56, 1922–1929. [Google Scholar] [CrossRef]
- Panje, C.; Panje, T.; Putora, P.M.; Kim, S.K.; Haile, S.; Aebersold, D.M.; Plasswilm, L. Guidance of treatment decisions in risk-adapted primary radiotherapy for prostate cancer using multiparametric magnetic resonance imaging: A single center experience. Radiat. Oncol. 2015, 10, 47. [Google Scholar] [CrossRef]
- Jaffray, D.A. Image-guided radiotherapy: From current concept to future perspectives. Nat. Rev. Clin. Oncol. 2012, 9, 688–699. [Google Scholar] [CrossRef]
- Michaelidou, A.; Adjogatse, D.; Suh, Y.; Pike, L.; Thomas, C.; Woodley, O.; Rackely, T.; Palaniappan, N.; Jayaprakasam, V.; Sanchez-Nieto, B.; et al. 18F-FDG-PET in Guided Dose-Painting with Intensity Modulated Radiotherapy in Oropharyngeal Tumours: A Phase I Study (FiGaRO). Radiother. Oncol. 2021, 155, 261–268. [Google Scholar] [CrossRef]
- Chen, D.L.; Ballout, S.; Chen, L.; Cheriyan, J.; Choudhury, G.; Denis-Bacelar, A.M.; Emond, E.; Erlandsson, K.; Fisk, M.; Fraioli, F.; et al. Consensus Recommendations on the Use of (18)F-FDG PET/CT in Lung Disease. J. Nucl. Med. 2020, 61, 1701–1707. [Google Scholar] [CrossRef] [PubMed]
- Cook, G.J.R.; Goh, V. A Role for FDG PET Radiomics in Personalized Medicine? Semin. Nucl. Med. 2020, 50, 532–540. [Google Scholar] [CrossRef] [PubMed]
- Manabe, O.; Naya, M.; Aikawa, T.; Tamaki, N. Recent advances in cardiac positron emission tomography for quantitative perfusion analyses and molecular imaging. Ann. Nucl. Med. 2020. 34, 697–706. [CrossRef]
- Gillies, R.J.; Kinahan, P.E.; Hricak, H. Radiomics: Images Are More than Pictures, They Are Data. Radiology 2016, 278, 563–577. [Google Scholar] [CrossRef]
- Alavi, A.; Dann, R.; Chawluk, J.; Alavi, J.; Kushner, M.; Reivich, M. Positron emission tomography imaging of regional cerebral glucose metabolism. Semin. Nucl. Med. 1986, 16, 2–34. [Google Scholar] [CrossRef]
- Traub-Weidinger, T.; Muzik, O.; Sundar, L.K.S.; Aull-Watschinger, S.; Beyer, T.; Hacker, M.; Hahn, A.; Kasprian, G.; Klebermass, E.M.; Lanzenberger, R.; et al. Utility of Absolute Quantification in Non-lesional Extratemporal Lobe Epilepsy Using FDG PET/MR Imaging. Front. Neurol. 2020, 11, 54. [Google Scholar] [CrossRef] [PubMed]
- Kim, S.K.; Allen-Auerbach, M.; Goldin, J.; Fueger, B.J.; Dahlbom, M.; Brown, M.; Czernin, J.; Schiepers, C. Accuracy of PET/CT in characterization of solitary pulmonary lesions. J. Nucl. Med. 2007, 48, 214–220. [Google Scholar]
- Ziai, P.; Hayeri, M.R.; Salei, A.; Salavati, A.; Houshmand, S.; Alavi, A.; Teytelboym, O.M. Role of Optimal Quantification of FDG PET Imaging in the Clinical Practice of Radiology. Radiographics 2016, 36, 481–496. [Google Scholar] [CrossRef]
- Tan, H.; Sui, X.; Yin, H.; Yu, H.; Gu, Y.; Chen, S.; Hu, P.; Mao, W.; Shi, H. Total-body PET/CT using half-dose FDG and compared with conventional PET/CT using full-dose FDG in lung cancer. Eur. J. Nucl. Med. Mol. Imaging 2020. Epub ahead of print. [Google Scholar] [CrossRef]
- Yamaguchi, S.; Hirata, K.; Kobayashi, H.; Shiga, T.; Manabe, O.; Kobayashi, K.; Motegi, H.; Terasaka, S.; Houkin, K. The diagnostic role of (18)F-FDG PET for primary central nervous system lymphoma. Ann. Nucl. Med. 2014, 28, 603–609. [Google Scholar] [CrossRef] [PubMed]
- Furuya, S.; Manabe, O.; Ohira, H.; Hirata, K.; Aikawa, T.; Naya, M.; Tsujino, I.; Koyanagawa, K.; Anzai, T.; Oyama-Manabe, N.; et al. Which is the proper reference tissue for measuring the change in FDG PET metabolic volume of cardiac sarcoidosis before and after steroid therapy? EJNMMI Res. 2018, 8, 94. [Google Scholar] [CrossRef] [PubMed]
- Zasadny, K.R.; Wahl, R.L. Standardized uptake values of normal tissues at PET with 2-[fluorine-18]-fluoro-2-deoxy-D-glucose: Variations with body weight and a method for correction. Radiology 1993, 189, 847–850. [Google Scholar] [CrossRef] [PubMed]
- Sprinz, C.; Altmayer, S.; Zanon, M.; Watte, G.; Irion, K.; Marchiori, E.; Hochhegger, B. Effects of blood glucose level on 18F-FDG uptake for PET/CT in normal organs: A systematic review. PLoS ONE 2018, 13, e0193140. [Google Scholar] [CrossRef] [PubMed]
- Nozawa, A.; Rivandi, A.H.; Kasari, S.; Hoh, C.K. Glucose corrected standardized uptake value (SUVgluc) in the evaluation of brain lesions with 18F-FDG PET. Eur. J. Nucl. Med. Mol. Imaging 2013, 40, 997–1004. [Google Scholar] [CrossRef]
- Nozawa, A.; Rivandi, A.H.; Kanematsu, M.; Hoshi, H.; Piccioni, D.; Kesari, S.; Hoh, C.K. Glucose-corrected standardized uptake value in the differentiation of high-grade glioma versus post-treatment changes. Nucl. Med. Commun. 2015, 36, 573–581. [Google Scholar] [CrossRef][Green Version]
- Im, H.J.; Pak, K.; Cheon, G.J.; Kang, K.W.; Kim, S.J.; Kim, I.J.; Chung, J.K.; Kim, E.E.; Lee, D.S. Prognostic value of volumetric parameters of (18)F-FDG PET in non-small-cell lung cancer: A meta-analysis. Eur. J. Nucl. Med. Mol. Imaging 2015, 42, 241–251. [Google Scholar] [CrossRef]
- Liao, S.; Penney, B.C.; Wroblewski, K.; Zhang, H.; Simon, C.A.; Kampalath, R.; Shih, M.C.; Shimada, N.; Chen, S.; Salgia, R.; et al. Prognostic value of metabolic tumor burden on 18F-FDG PET in nonsurgical patients with non-small cell lung cancer. Eur. J. Nucl. Med. Mol. Imaging 2012, 39, 27–38. [Google Scholar] [CrossRef]
- Kitao, T.; Hirata, K.; Shima, K.; Hayashi, T.; Sekizawa, M.; Takei, T.; Ichimura, W.; Harada, M.; Kondo, K.; Tamaki, N. Reproducibility and uptake time dependency of volume-based parameters on FDG-PET for lung cancer. BMC Cancer 2016, 16, 576. [Google Scholar] [CrossRef]
- Pak, K.; Cheon, G.J.; Nam, H.Y.; Kim, S.J.; Kang, K.W.; Chung, J.K.; Kim, E.E.; Lee, D.S. Prognostic value of metabolic tumor volume and total lesion glycolysis in head and neck cancer: A systematic review and meta-analysis. J. Nucl. Med. 2014, 55, 884–890. [Google Scholar] [CrossRef] [PubMed]
- Kitao, T.; Shiga, T.; Hirata, K.; Sekizawa, M.; Takei, T.; Yamashiro, K.; Tamaki, N. Volume-based parameters on FDG PET may predict the proliferative potential of soft-tissue sarcomas. Ann. Nucl. Med. 2019, 33, 22–31. [Google Scholar] [CrossRef] [PubMed]
- Senjo, H.; Kanaya, M.; Izumiyama, K.; Minauchi, K.; Hirata, K.; Mori, A.; Saito, M.; Tanaka, M.; Iijima, H.; Tsukamoto, E.; et al. Serum level of soluble interleukin-2 receptor is positively correlated with metabolic tumor volume on (18) F-FDG PET/CT in newly diagnosed patients with diffuse large B-cell lymphoma. Cancer Med. 2019, 8, 953–962. [Google Scholar] [CrossRef]
- Hirata, K.; Kobayashi, K.; Wong, K.P.; Manabe, O.; Surmak, A.; Tamaki, N.; Huang, S.C. A semi-automated technique determining the liver standardized uptake value reference for tumor delineation in FDG PET-CT. PLoS ONE 2014, 9, e105682. [Google Scholar] [CrossRef] [PubMed]
- Mayerhoefer, M.E.; Materka, A.; Langs, G.; Häggström, I.; Szczypiński, P.; Gibbs, P.; Cook, G. Introduction to Radiomics. J. Nucl. Med. 2020, 61, 488–495. [Google Scholar] [CrossRef]
- Bartoli, M.; Barat, M.; Dohan, A.; Gaujoux, S.; Coriat, R.; Hoeffel, C.; Cassinotto, C.; Chassagnon, G.; Soyer, P. CT and MRI of pancreatic tumors: An update in the era of radiomics. Jpn. J. Radiol. 2020, 38, 1111–1124. [Google Scholar] [CrossRef]
- El Naqa, I.; Grigsby, P.; Apte, A.; Kidd, E.; Donnelly, E.; Khullar, D.; Chaudhari, S.; Yang, D.; Schmitt, M.; Laforest, R.; et al. Exploring feature-based approaches in PET images for predicting cancer treatment outcomes. Pattern Recognit. 2009, 42, 1162–1171. [Google Scholar] [CrossRef]
- Suzuki, H.; Aoki, K.; Chiba, K.; Sato, Y.; Shiozawa, Y.; Shiraishi, Y.; Shimamura, T.; Niida, A.; Motomura, K.; Ohka, F.; et al. Mutational landscape and clonal architecture in grade II and III gliomas. Nat. Genet. 2015, 47, 458–468. [Google Scholar] [CrossRef]
- Toyonaga, T.; Hirata, K.; Shiga, T.; Tamaki, N. Players of ‘hypoxia orchestra’—What is the role of FMISO? Eur. J. Nucl. Med. Mol. Imaging 2017, 44, 1679–1681. [Google Scholar] [CrossRef]
- Toyonaga, T.; Yamaguchi, S.; Hirata, K.; Kobayashi, K.; Manabe, O.; Watanabe, S.; Terasaka, S.; Kobayashi, H.; Hattori, N.; Shiga, T.; et al. Hypoxic glucose metabolism in glioblastoma as a potential prognostic factor. Eur. J. Nucl. Med. Mol. Imaging 2017, 44, 611–619. [Google Scholar] [CrossRef] [PubMed]
- Toyonaga, T.; Hirata, K.; Yamaguchi, S.; Hatanaka, K.C.; Yuzawa, S.; Manabe, O.; Kobayashi, K.; Watanabe, S.; Shiga, T.; Terasaka, S.; et al. (18)F-fluoromisonidazole positron emission tomography can predict pathological necrosis of brain tumors. Eur. J. Nucl. Med. Mol. Imaging 2016, 43, 1469–1476. [Google Scholar] [CrossRef]
- Hirata, K.; Terasaka, S.; Shiga, T.; Hattori, N.; Magota, K.; Kobayashi, H.; Yamaguchi, S.; Houkin, K.; Tanaka, S.; Kuge, Y.; et al. (18)F-Fluoromisonidazole positron emission tomography may differentiate glioblastoma multiforme from less malignant gliomas. Eur. J. Nucl. Med. Mol. Imaging 2012, 39, 760–770. [Google Scholar] [CrossRef]
- Hirata, K.; Yamaguchi, S.; Shiga, T.; Kuge, Y.; Tamaki, N. The Roles of Hypoxia Imaging Using (18)F-Fluoromisonidazole Positron Emission Tomography in Glioma Treatment. J. Clin. Med. 2019, 8, 1088. [Google Scholar] [CrossRef] [PubMed]
- Orlhac, F.; Soussan, M.; Maisonobe, J.A.; Garcia, C.A.; Vanderlinden, B.; Buvat, I. Tumor texture analysis in 18F-FDG PET: Relationships between texture parameters, histogram indices, standardized uptake values, metabolic volumes, and total lesion glycolysis. J. Nucl. Med. 2014, 55, 414–422. [Google Scholar] [CrossRef] [PubMed]
- Nakajo, M.; Jinguji, M.; Aoki, M.; Tani, A.; Sato, M.; Yoshiura, T. The clinical value of texture analysis of dual-time-point 18F-FDG-PET/CT imaging to differentiate between 18 F-FDG-avid benign and malignant pulmonary lesions. Eur. Radiol. 2020, 30, 1759–1769. [Google Scholar] [CrossRef] [PubMed]
- Noortman, W.A.; Vriens, D.; Slump, C.H.; Bussink, J.; Meijer, T.W.H.; de Geus-Oei, L.F.; van Velden, F.H.P. Adding the temporal domain to PET radiomic features. PLoS ONE 2020, 15, e0239438. [Google Scholar] [CrossRef]
- Senjo, H.; Hirata, K.; Izumiyama, K.; Minauchi, K.; Tsukamoto, E.; Itoh, K.; Kanaya, M.; Mori, A.; Ota, S.; Hashimoto, D.; et al. High metabolic heterogeneity on baseline 18FDG-PET/CT scan as a poor prognostic factor for newly diagnosed diffuse large B-cell lymphoma. Blood Adv. 2020, 4, 2286–2296. [Google Scholar] [CrossRef] [PubMed]
- Nioche, C.; Orlhac, F.; Boughdad, S.; Reuzé, S.; Goya-Outi, J.; Robert, C.; Pellot-Barakat, C.; Soussan, M.; Frouin, F.; Buvat, I. LIFEx: A Freeware for Radiomic Feature Calculation in Multimodality Imaging to Accelerate Advances in the Characterization of Tumor Heterogeneity. Cancer Res. 2018, 78, 4786–4789. [Google Scholar] [CrossRef] [PubMed]
- Ceriani, L.; Milan, L.; Virili, C.; Cascione, L.; Paone, G.; Trimboli, P.; Giovanella, L. Radiomics Analysis of [(18)F]-Fluorodeoxyglucose-Avid Thyroid Incidentalomas Improves Risk Stratification and Selection for Clinical Assessment. Thyroid 2021, 31, 88–95. [Google Scholar] [CrossRef]
- Van Griethuysen, J.J.M.; Fedorov, A.; Parmar, C.; Hosny, A.; Aucoin, N.; Narayan, V.; Beets-Tan, R.G.H.; Fillion-Robin, J.C.; Pieper, S.; Aerts, H.J.W.L. Computational Radiomics System to Decode the Radiographic Phenotype. Cancer Res. 2017, 77, e104–e107. [Google Scholar] [CrossRef]
- Fang, Y.H.; Lin, C.Y.; Shih, M.J.; Wang, H.M.; Ho, T.Y.; Liao, C.T.; Yen, T.C. Development and evaluation of an open-source software package “CGITA” for quantifying tumor heterogeneity with molecular images. Biomed. Res. Int. 2014, 2014, 248505. [Google Scholar] [CrossRef]
- Barucci, A.; Neri, E. Adversarial radiomics: The rising of potential risks in medical imaging from adversarial learning. Eur. J. Nucl. Med. Mol. Imaging 2020, 47, 2941–2943. [Google Scholar] [CrossRef]
- Kawauchi, K.; Hirata, K.; Katoh, C.; Ichikawa, S.; Manabe, O.; Kobayashi, K.; Watanabe, S.; Furuya, S.; Shiga, T. A convolutional neural network-based system to prevent patient misidentification in FDG-PET examinations. Sci. Rep. 2019, 9, 7192. [Google Scholar] [CrossRef]
- Kawauchi, K.; Furuya, S.; Hirata, K.; Katoh, C.; Manabe, O.; Kobayashi, K.; Watanabe, S.; Shiga, T. A convolutional neural network-based system to classify patients using FDG PET/CT examinations. BMC Cancer 2020, 20, 227. [Google Scholar] [CrossRef] [PubMed]
- Kaseda, K. Recent and Current Advances in FDG-PET Imaging within the Field of Clinical Oncology in NSCLC: A Review of the Literature. Diagnostics 2020, 10, 561. [Google Scholar] [CrossRef]
- Liu, S.; Cheng, H.; Yao, S.; Wang, C.; Han, G.; Li, X.; Liu, C. The clinical application value of PET/CT in adenocarcinoma with bronchioloalveolar carcinoma features. Ann. Nucl. Med. 2010, 24, 541–547. [Google Scholar] [CrossRef]
- Collins, G.S.; Reitsma, J.B.; Altman, D.G.; Moons, K.G.M.; Members of the TRIPOD group. Transparent Reporting of a Multivariable Prediction Model for Individual Prognosis or Diagnosis (TRIPOD): The TRIPOD Statement. Eur. Urol. 2015, 67, 1142–1151. [Google Scholar] [CrossRef]
- Bianconi, F.; Palumbo, I.; Fravolini, M.L.; Chiari, R.; Minestrini, M.; Brunese, L.; Palumbo, B. Texture Analysis on [(18)F]FDG PET/CT in Non-Small-Cell Lung Cancer: Correlations Between PET Features, CT Features, and Histological Types. Mol. Imaging Biol. 2019, 21, 1200–1209. [Google Scholar] [CrossRef]
- Dissaux, G.; Visvikis, D.; Da-Ano, R.; Pradier, O.; Chajon, E.; Barillot, I.; Duvergé, L.; Masson, I.; Abgral, R.; Santiago Ribeiro, M.J.; et al. Pretreatment (18)F-FDG PET/CT Radiomics Predict Local Recurrence in Patients Treated with Stereotactic Body Radiotherapy for Early-Stage Non-Small Cell Lung Cancer: A Multicentric Study. J. Nucl. Med. 2020, 61, 814–820. [Google Scholar] [CrossRef]
- Sanduleanu, S.; Jochems, A.; Upadhaya, T.; Even, A.J.G.; Leijenaar, R.T.H.; Dankers, F.J.W.M.; Klaassen, R.; Woodruff, H.C.; Hatt, M.; Kaanders, H.J.A.M.; et al. Non-invasive imaging prediction of tumor hypoxia: A novel developed and externally validated CT and FDG-PET-based radiomic signatures. Radiother. Oncol. 2020, 153, 97–105. [Google Scholar] [CrossRef]
- Orlhac, F.; Nioche, C.; Soussan, M.; Buvat, I. Understanding Changes in tumor texture indices in PET: A comparison between visual assessment and index values in simulated and patient data. J. Nucl. Med. 2017, 58, 387–392. [Google Scholar] [CrossRef]
- Boellaard, R.; Delgado-Bolton, R.; Oyen, W.J.; Giammarile, F.; Tatsch, K.; Eschner, W.; Verzijlbergen, F.J.; Barrington, S.F.; Pike, L.C.; Weber, W.A.; et al. FDG PET/CT: EANM procedure guidelines for tumour imaging: Version 2.0. Eur. J. Nucl. Med. Mol. Imaging 2015, 42, 328–354. [Google Scholar] [CrossRef]
- Fornacon-Wood, I.; Mistry, H.; Sckermann, C.J.; Blackhall, F.; McPartlin, A.; Faivre-Finn, C.; Price, G.J.; O’Connor, J.P.B. Reliability and prognostic value of radiomic features are highly dependent on choice of feature extraction platform. Eur. Radiol. 2020, 30, 6241–6250. [Google Scholar] [CrossRef]
- Mikhaeel, N.G.; Smith, D.; Dunn, J.T.; Phillips, M.; Møller, H.; Fields, P.A.; Wrench, D.; Barrington, S.F. Combination of baseline metabolic tumour volume and early response on PET/CT improves progression-free survival prediction in DLBCL. Eur. J. Nucl. Med. Mol. Imaging 2016, 43, 1209–1219. [Google Scholar] [CrossRef]
- Cottereau, A.S.; Lanic, H.; Mareschal, S.; Meignan, M.; Vera, P.; Tilly, H.; Jardin, F.; Becker, S. Molecular profile and FDG-PET/CT total metabolic tumor volume improve risk classification at diagnosis for patients with diffuse large B-cell lymphoma. Clin. Cancer Res. 2016, 22, 3801–3809. [Google Scholar] [CrossRef]
- Vitolo, U.; Trněný, M.; Belada, D.; Burke, J.M.; Carella, A.M.; Chua, N.; Abrisqueta, P.; Demeter, J.; Flinn, I.; Hong, X.; et al. Obinutuzumab or rituximab plus cyclophosphamide, doxorubicin, vincristine, and prednisone in previously untreated diffuse large B-cell lymphoma. J. Clin. Oncol. 2017, 35, 3529–3537. [Google Scholar] [CrossRef]
- Kim, H.R.; Kim, D.J.; Lee, W.W.; Jheon, S.; Sung, S.W. The significance of maximum standardized uptake values in patients with stage I pulmonary adenocarcinoma. Eur. J. Cardiothorac Surg. 2009, 35, 712–716. [Google Scholar] [CrossRef]
- Hoang, J.K.; Hoagland, L.F.; Coleman, R.E.; Coan, A.D.; Herndon, J.E., 2nd; Patz, E.F., Jr. Prognostic value of fluorine-18 fluorodeoxyglucose positron emission tomography imaging in patients with advanced-stage non-small-cell lung carcinoma. J. Clin. Oncol. 2008, 26, 1459–1464. [Google Scholar] [CrossRef]
- Lambin, P.; Rios-Velazquez, E.; Leijenaar, R.; Carvalho, S.; van Stiphout, R.G.; Granton, P.; Zegers, C.M.; Gillies, R.; Boellard, R.; Dekker, A.; et al. Radiomics: Extracting more information from medical images using advanced feature analysis. Eur. J. Cancer 2012, 48, 441–446. [Google Scholar] [CrossRef]
- Yang, B.; Zhong, J.; Zhong, J.; Ma, L.; Li, A.; Ji, H.; Zhou, C.; Duan, S.; Wang, Q.; Zhu, C.; et al. Development and validation of a radiomics nomogram based on 18F-Fluorodeoxyglucose positron emission tomography/computed tomography and clinicopathological factors to predict the survival outcomes of patients with non-small cell lung cancer. Front. Oncol. 2020, 10, 1042. [Google Scholar] [CrossRef] [PubMed]
- Cochet, A.; Dygai-Cochet, I.; Riedinger, J.M.; Humbert, O.; Berriolo-Riedinger, A.; Toubeau, M.; Guiu, S.; Coutant, C.; Coudert, B.; Fumoleau, P.; et al. 18F-FDG PET/CT provides powerful prognostic stratification in the primary staging of large breast cancer when compared with conventional explorations. Eur. J. Nucl. Med. Mol. Imaging 2014, 41, 428–437. [Google Scholar] [CrossRef] [PubMed]
- Groheux, D.; Giacchetti, S.; Delord, M.; Hindié, E.; Vercellino, L.; Cuvier, C.; Toubert, M.E.; Merlet, P.; Hennequin, C.; Espié, M. 18F-FDG PET/CT in staging patients with locally advanced or inflammatory breast cancer: Comparison to conventional staging. J. Nucl. Med. 2013, 54, 5–11. [Google Scholar] [CrossRef] [PubMed]
- Andrade, W.P.; Lima, E.N.; Osório, C.A.; do Socorro Maciel, M.; Baiocchi, G.; Bitencourt, A.G.; Fanelli, M.F.; Damascena, A.S.; Soares, F.A. Can FDG-PET/CT predict early response to neoadjuvant chemotherapy in breast cancer? Eur. J. Surg. Oncol. 2013, 39, 1358–1363. [Google Scholar] [CrossRef]
- Gebhart, G.; Gámez, C.; Holmes, E.; Robles, J.; Garcia, C.; Cortés, M.; de Azambuja, E.; Fauria, K.; Van Dooren, V.; Aktan, G.; et al. 18F-FDG PET/CT for early prediction of response to neoadjuvant lapatinib, trastuzumab, and their combination in HER2-positive breast cancer: Results from Neo-ALTTO. J. Nucl. Med. 2013, 54, 1862–1868. [Google Scholar] [CrossRef]
- Jacene, H.A.; Youn, T.; DiPiro, P.J.; Hu, J.; Cheng, S.C.; Franchetti, Y.; Shah, H.; Bellon, J.R.; Warren, L.; Schlosnagle, E.; et al. Metabolic characterization of inflammatory breast cancer with baseline FDG-PET/CT: Relationship with pathologic response after neoadjuvant chemotherapy, receptor status, and tumor grade. Clin. Breast Cancer. 2019, 19, 146–155. [Google Scholar] [CrossRef]
- Therasse, P.; Arbuck, S.G.; Eisenhauer, E.A.; Wanders, J.; Kaplan, R.S.; Rubinstein, L.; Verweij, J.; Van Glabbeke, M.; van Oosterom, A.T.; Christian, M.C.; et al. New guidelines to evaluate the response to treatment in solid tumors. European Organization for Research and Treatment of Cancer, National Cancer Institute of the United States, National Cancer Institute of Canada. J. Natl. Cancer Inst. 2000, 92, 205–216. [Google Scholar] [CrossRef]
- Eisenhauer, E.A.; Therasse, P.; Bogaerts, J.; Schwartz, L.H.; Sargent, D.; Ford, R.; Dancey, J.; Arbuck, S.; Gwyther, S.; Mooney, M.; et al. New response evaluation criteria in solid tumours: Revised RECIST guideline (version 1.1). Eur. J. Cancer 2009, 45, 228–247. [Google Scholar] [CrossRef]
- Cheson, B.D.; Pfistner, B.; Juweid, M.E.; Gascoyne, R.D.; Specht, L.; Horning, S.J.; Coiffier, B.; Fisher, R.I.; Hagenbeek, A.; Zucca, E.; et al. Revised response criteria for malignant lymphoma. J. Clin. Oncol. 2007, 25, 579–586. [Google Scholar] [CrossRef] [PubMed]
- Gurney-Champion, O.J.; Mahmood, F.; van Schie, M.; Julian, R.; George, B.; Philippens, M.E.P.; van der Heide, U.A.; Thorwarth, D.; Redalen, K.R. Quantitative imaging for radiotherapy purposes. Radiother. Oncol. 2020, 146, 66–75. [Google Scholar] [CrossRef] [PubMed]
- Creff, G.; Devillers, A.; Depeursinge, A.; Palard-Novello, X.; Acosta, O.; Jegoux, F.; Castelli, J. Evaluation of the prognostic value of FDG PET/CT parameters for patients with surgically treated head and Neck cancer: A systematic review. JAMA Otolaryngol. Head Neck Surg. 2020, 146, 471–479. [Google Scholar] [CrossRef]
- Martucci, F.; Pascale, M.; Valli, M.C.; Pesce, G.A.; Froesch, P.; Giovanella, L.; Richetti, A.; Treglia, G. Impact of 18F-FDG PET/CT in staging patients with small cell lung Cancer: A Systematic review and meta-analysis. Front. Med. 2020, 6, 336. [Google Scholar] [CrossRef]
- Kim, Y.J.; Han, S.; Kim, Y.S.; Nam, J.H. Prognostic value of post-treatment 18F-fluorodeoxyglucose positron emission tomography in uterine cervical cancer patients treated with radiotherapy: A systematic review and meta-analysis. J. Gynecol. Oncol. 2019, 30, e66. [Google Scholar] [CrossRef] [PubMed]
- Barrington, S.F.; Mikhaeel, N.G.; Kostakoglu, L.; Meignan, M.; Hutchings, M.; Müeller, S.P.; Schwartz, L.H.; Zucca, E.; Fisher, R.I.; Trotman, J.; et al. Role of imaging in the staging and response assessment of lymphoma: Consensus of the International Conference on Malignant Lymphomas Imaging Working Group. J. Clin. Oncol. 2014, 32, 3048–3058. [Google Scholar] [CrossRef] [PubMed]
- Barrington, S.F.; Phillips, E.H.; Counsell, N.; Hancock, B.; Pettengell, R.; Johnson, P.; Townsend, W.; Culligan, D.; Popova, B.; Clifton-Hadley, L.; et al. Positron emission tomography score has greater prognostic significance than pretreatment risk stratification in early-stage Hodgkin lymphoma in the UK RAPID Study. J. Clin. Oncol. 2019, 37, 1732–1741. [Google Scholar] [CrossRef]
- Meignan, M.; Cottereau, A.S.; Versari, A.; Chartier, L.; Dupuis, J.; Boussetta, S.; Grassi, I.; Casasnovas, R.O.; Haioun, C.; Tilly, H.; et al. Baseline metabolic tumor volume predicts outcome in high-tumor-burden follicular lymphoma: A pooled analysis of three multicenter studies. J. Clin. Oncol. 2016, 34, 3618–3626. [Google Scholar] [CrossRef]
- Casasnovas, R.O.; Kanoun, S.; Tal, I.; Cottereau, A.S.; Edeline, V.; Brice, P.; Bouabdallah, R.; Salles, G.A.; Stamatoullas, A.; Dupuis, J.; et al. Baseline total metabolic volume (TMTV) to predict the outcome of patients with advanced Hodgkin lymphoma (HL) enrolled in the AHL2011 LYSA trial [abstract]. J. Clin. Oncol. 2016, 34, 7509. [Google Scholar] [CrossRef]
- Toledano, M.N.; Desbordes, P.; Banjar, A.; Gardin, I.; Vera, P.; Ruminy, P.; Jardin, F.; Tilly, H.; Becker, S. Combination of baseline FDG PET/CT total metabolic tumour volume and gene expression profile have a robust predictive value in patients with diffuse large B-cell lymphoma. Eur. J. Nucl. Med. Mol. Imaging 2018, 45, 680–688. [Google Scholar] [CrossRef]
- Vercellino, L.Z.; Cottereau, A.S.; Casasnovas, O.; Tilly, H.; Feugier, P.; Chartier, L.; Fruchart, C.; Roulin, L.; Oberic, L.; Pica, G.M.; et al. High total metabolic tumor volume at baseline predicts survival independent of response to therapy. Blood 2020, 135, 1396–1405. [Google Scholar] [CrossRef] [PubMed]


| Category | Example | Clinical Evidence | Pros | Cons |
|---|---|---|---|---|
| Direct quantification of glucose metabolism | Metabolic rate of glucose (mol /100 g tissue/min) | Little |
|
|
| Semi-quantitative measurements | Lesion-to-normal (L/N) ratio | Medium |
|
|
| Semi-quantitative measurements | Standardized uptake value (SUV), especially SUVmax | Largest |
|
|
| Volumetric indices | Metabolic tumour volume (MTV) Total lesion glycolysis (TLG) | Large |
|
|
| Radiomics | Shape indices (e.g., sphericity) Textural features (e.g., entropy) Deep radiomics | Increasing |
|
|
| Response Classification | EORTC 1999 | PERCIST 2009 |
|---|---|---|
| PMD Progressive metabolic disease | Increase in SUV of greater than 25% - Or- Increase of the longest diameter by 20% - Or- new FDG avid lesion(s) | SUL increase by at least 30% and increase in by at least 0.8 SUL units of the target lesion - Or- Development of at least one new lesion - Or- Increase in target lesion size by 30% - Or- Unequivocal progression of nontarget lesions |
| SMD Stable metabolic disease | Increase of SUV by < 25% or decrease less than 15% - And- no increase in longest diameter > 20% | Increase or decrease of SUL by less than 30% |
| PMR Partial metabolic response | Decrease of SUV by 15–25% after one cycle of chemotherapy and > 25% after more than one treatment cycle | Decrease of SUL by ≥ 30% and at least 0.8 SUL units difference - And- No new FDG-avid lesions, - And- No increase in size > 30% of the target lesion - And- No increase in SUL or size of non-target lesion |
| CMR Complete metabolic response | Resolution of FDG uptake (indistinguishable from surrounding normal tissue) | FDG uptake indistinguishable from surrounding background - And- SUL less than liver |
Publisher’s Note: MDPI stays neutral with regard to jurisdictional claims in published maps and institutional affiliations. |
© 2021 by the authors. Licensee MDPI, Basel, Switzerland. This article is an open access article distributed under the terms and conditions of the Creative Commons Attribution (CC BY) license (http://creativecommons.org/licenses/by/4.0/).
Share and Cite
Hirata, K.; Tamaki, N. Quantitative FDG PET Assessment for Oncology Therapy. Cancers 2021, 13, 869. https://doi.org/10.3390/cancers13040869
Hirata K, Tamaki N. Quantitative FDG PET Assessment for Oncology Therapy. Cancers. 2021; 13(4):869. https://doi.org/10.3390/cancers13040869
Chicago/Turabian StyleHirata, Kenji, and Nagara Tamaki. 2021. "Quantitative FDG PET Assessment for Oncology Therapy" Cancers 13, no. 4: 869. https://doi.org/10.3390/cancers13040869
APA StyleHirata, K., & Tamaki, N. (2021). Quantitative FDG PET Assessment for Oncology Therapy. Cancers, 13(4), 869. https://doi.org/10.3390/cancers13040869