
Mitochondrial Plasticity Promotes Resistance to Sorafenib and Vulnerability to STAT3 Inhibition in Human Hepatocellular Carcinoma

 ,
,  and
and
Abstract
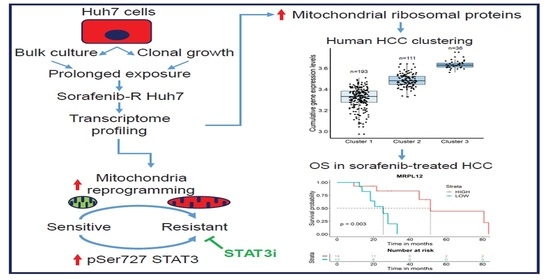
:Simple Summary
Abstract
1. Introduction
2. Materials and Methods
2.1. Cell Lines
2.2. Gene Expression Profiling
3. Results
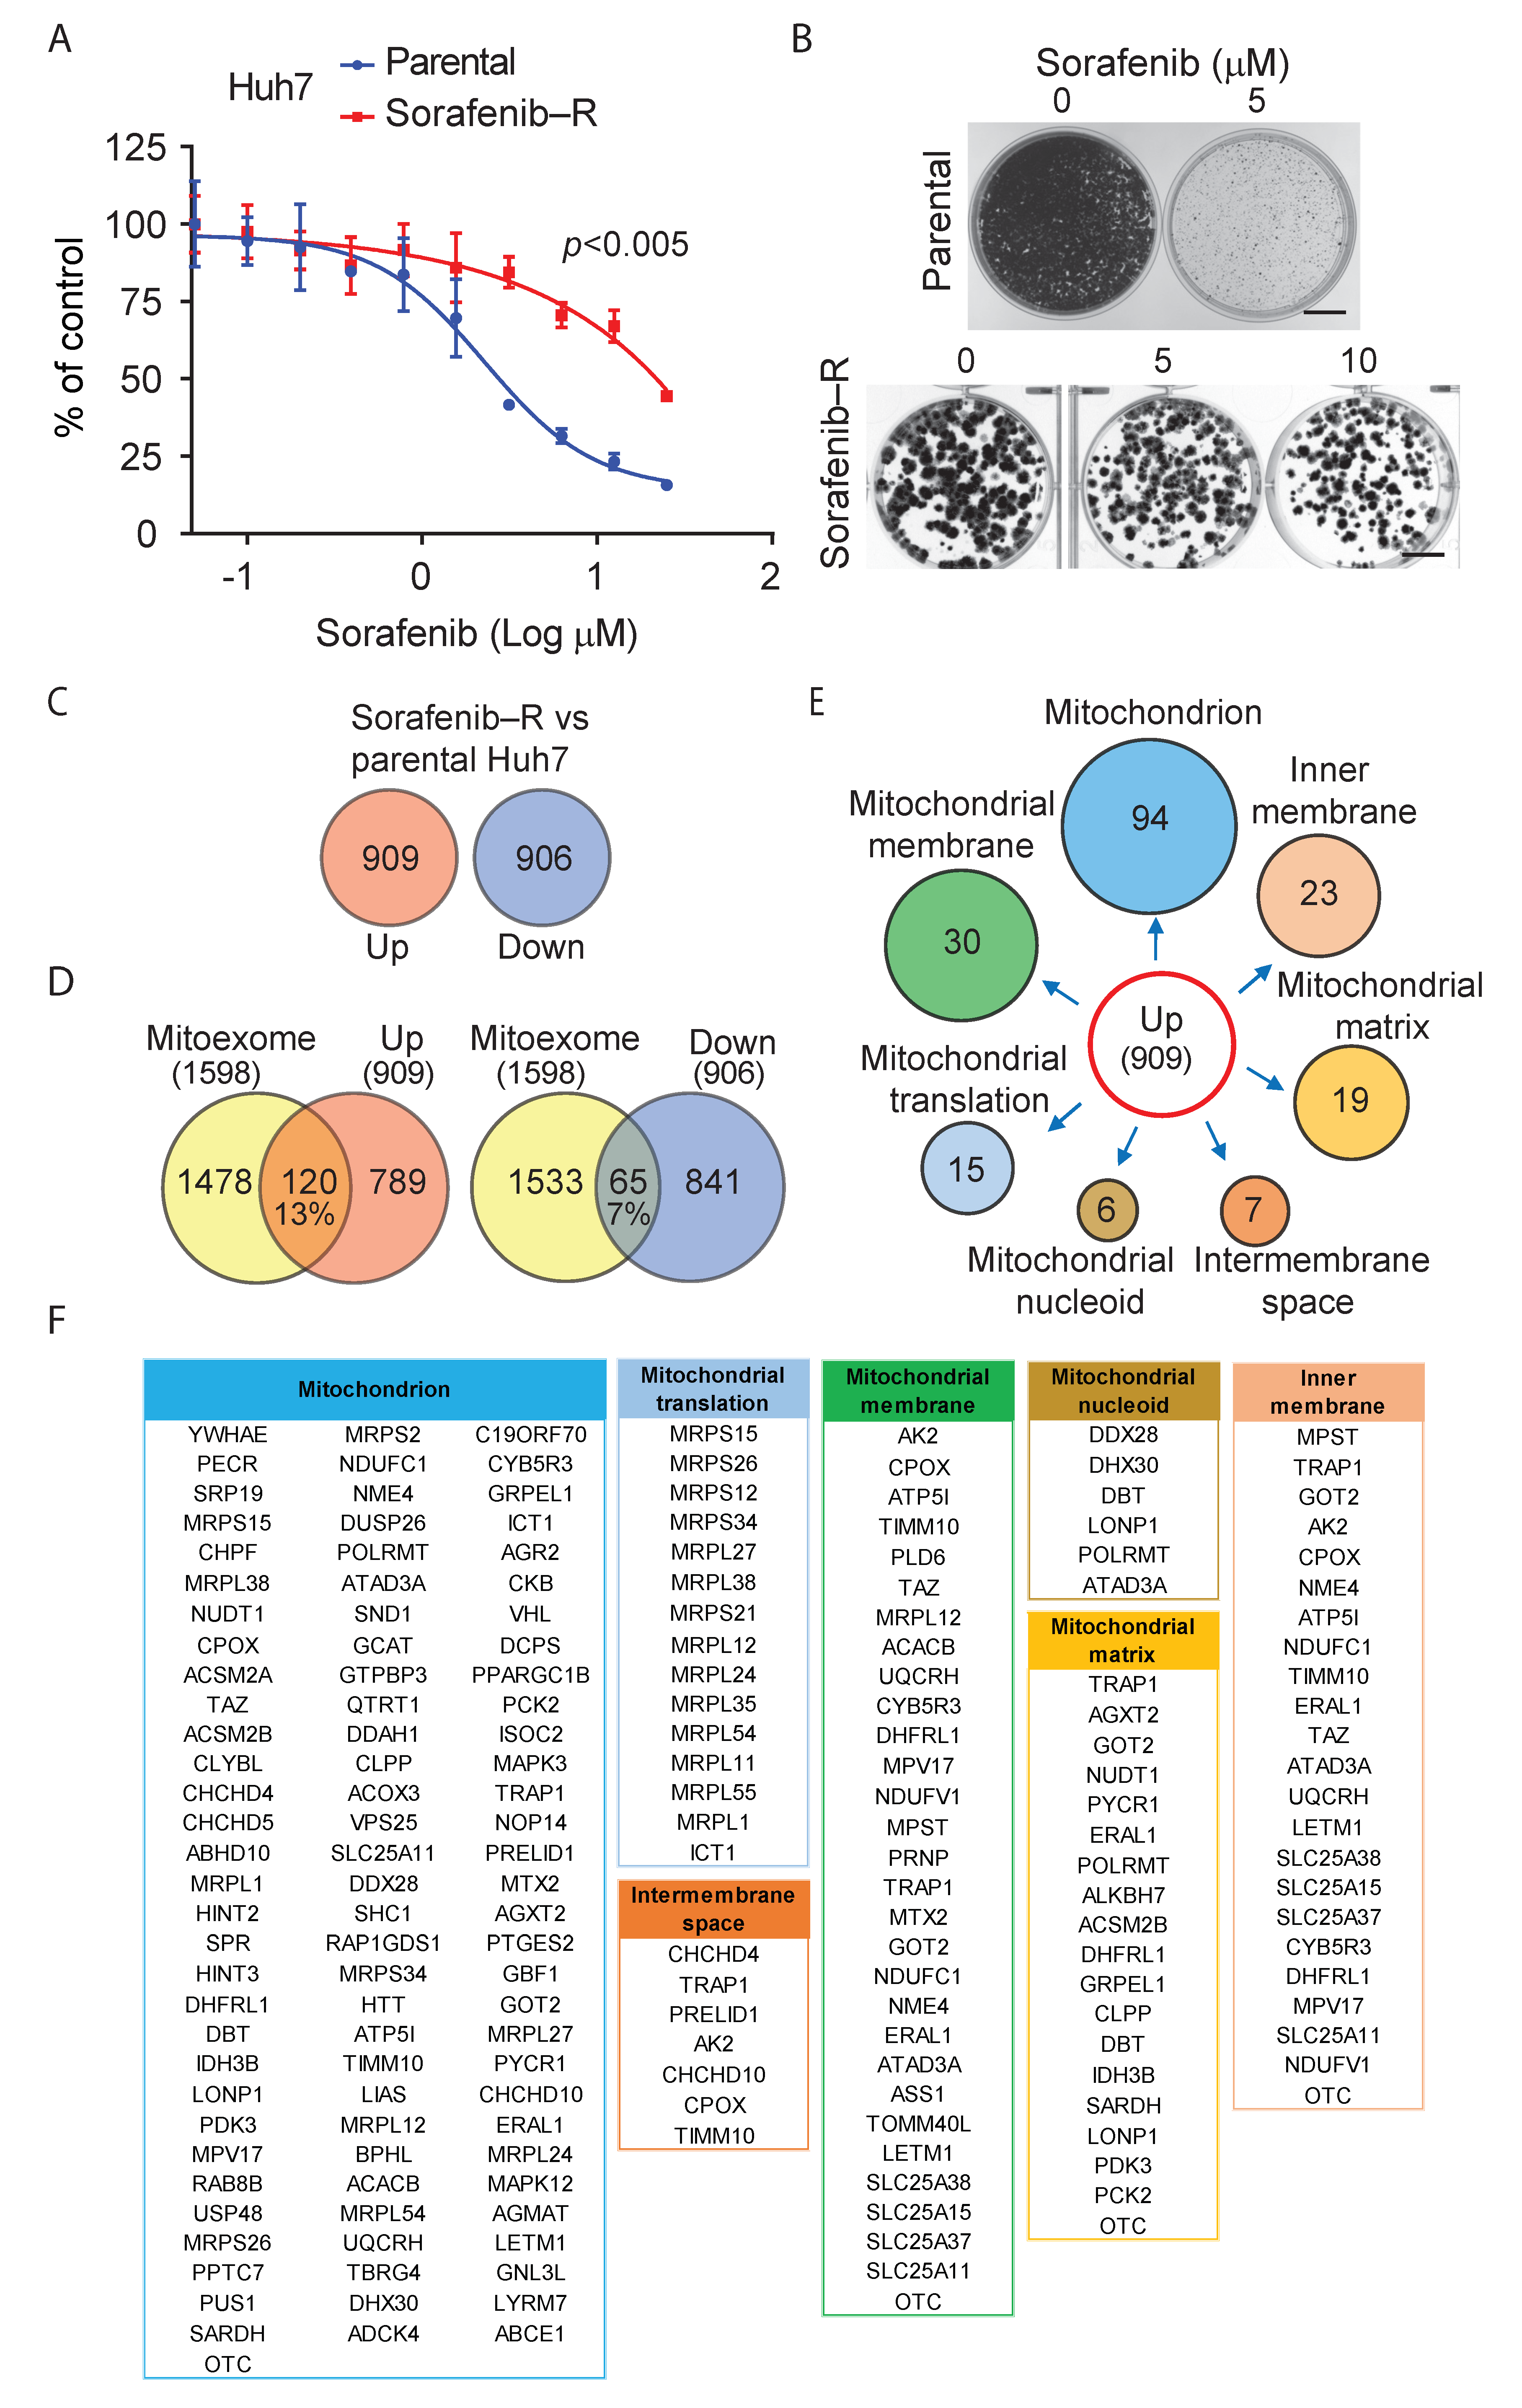
3.1. Adaptation of HCC Cells to Chronic Exposure to Sorafenib
3.2. Deregulation of Mitochondrial Protein Translation and Import in Sorafenib-Adapted Huh7 Cells
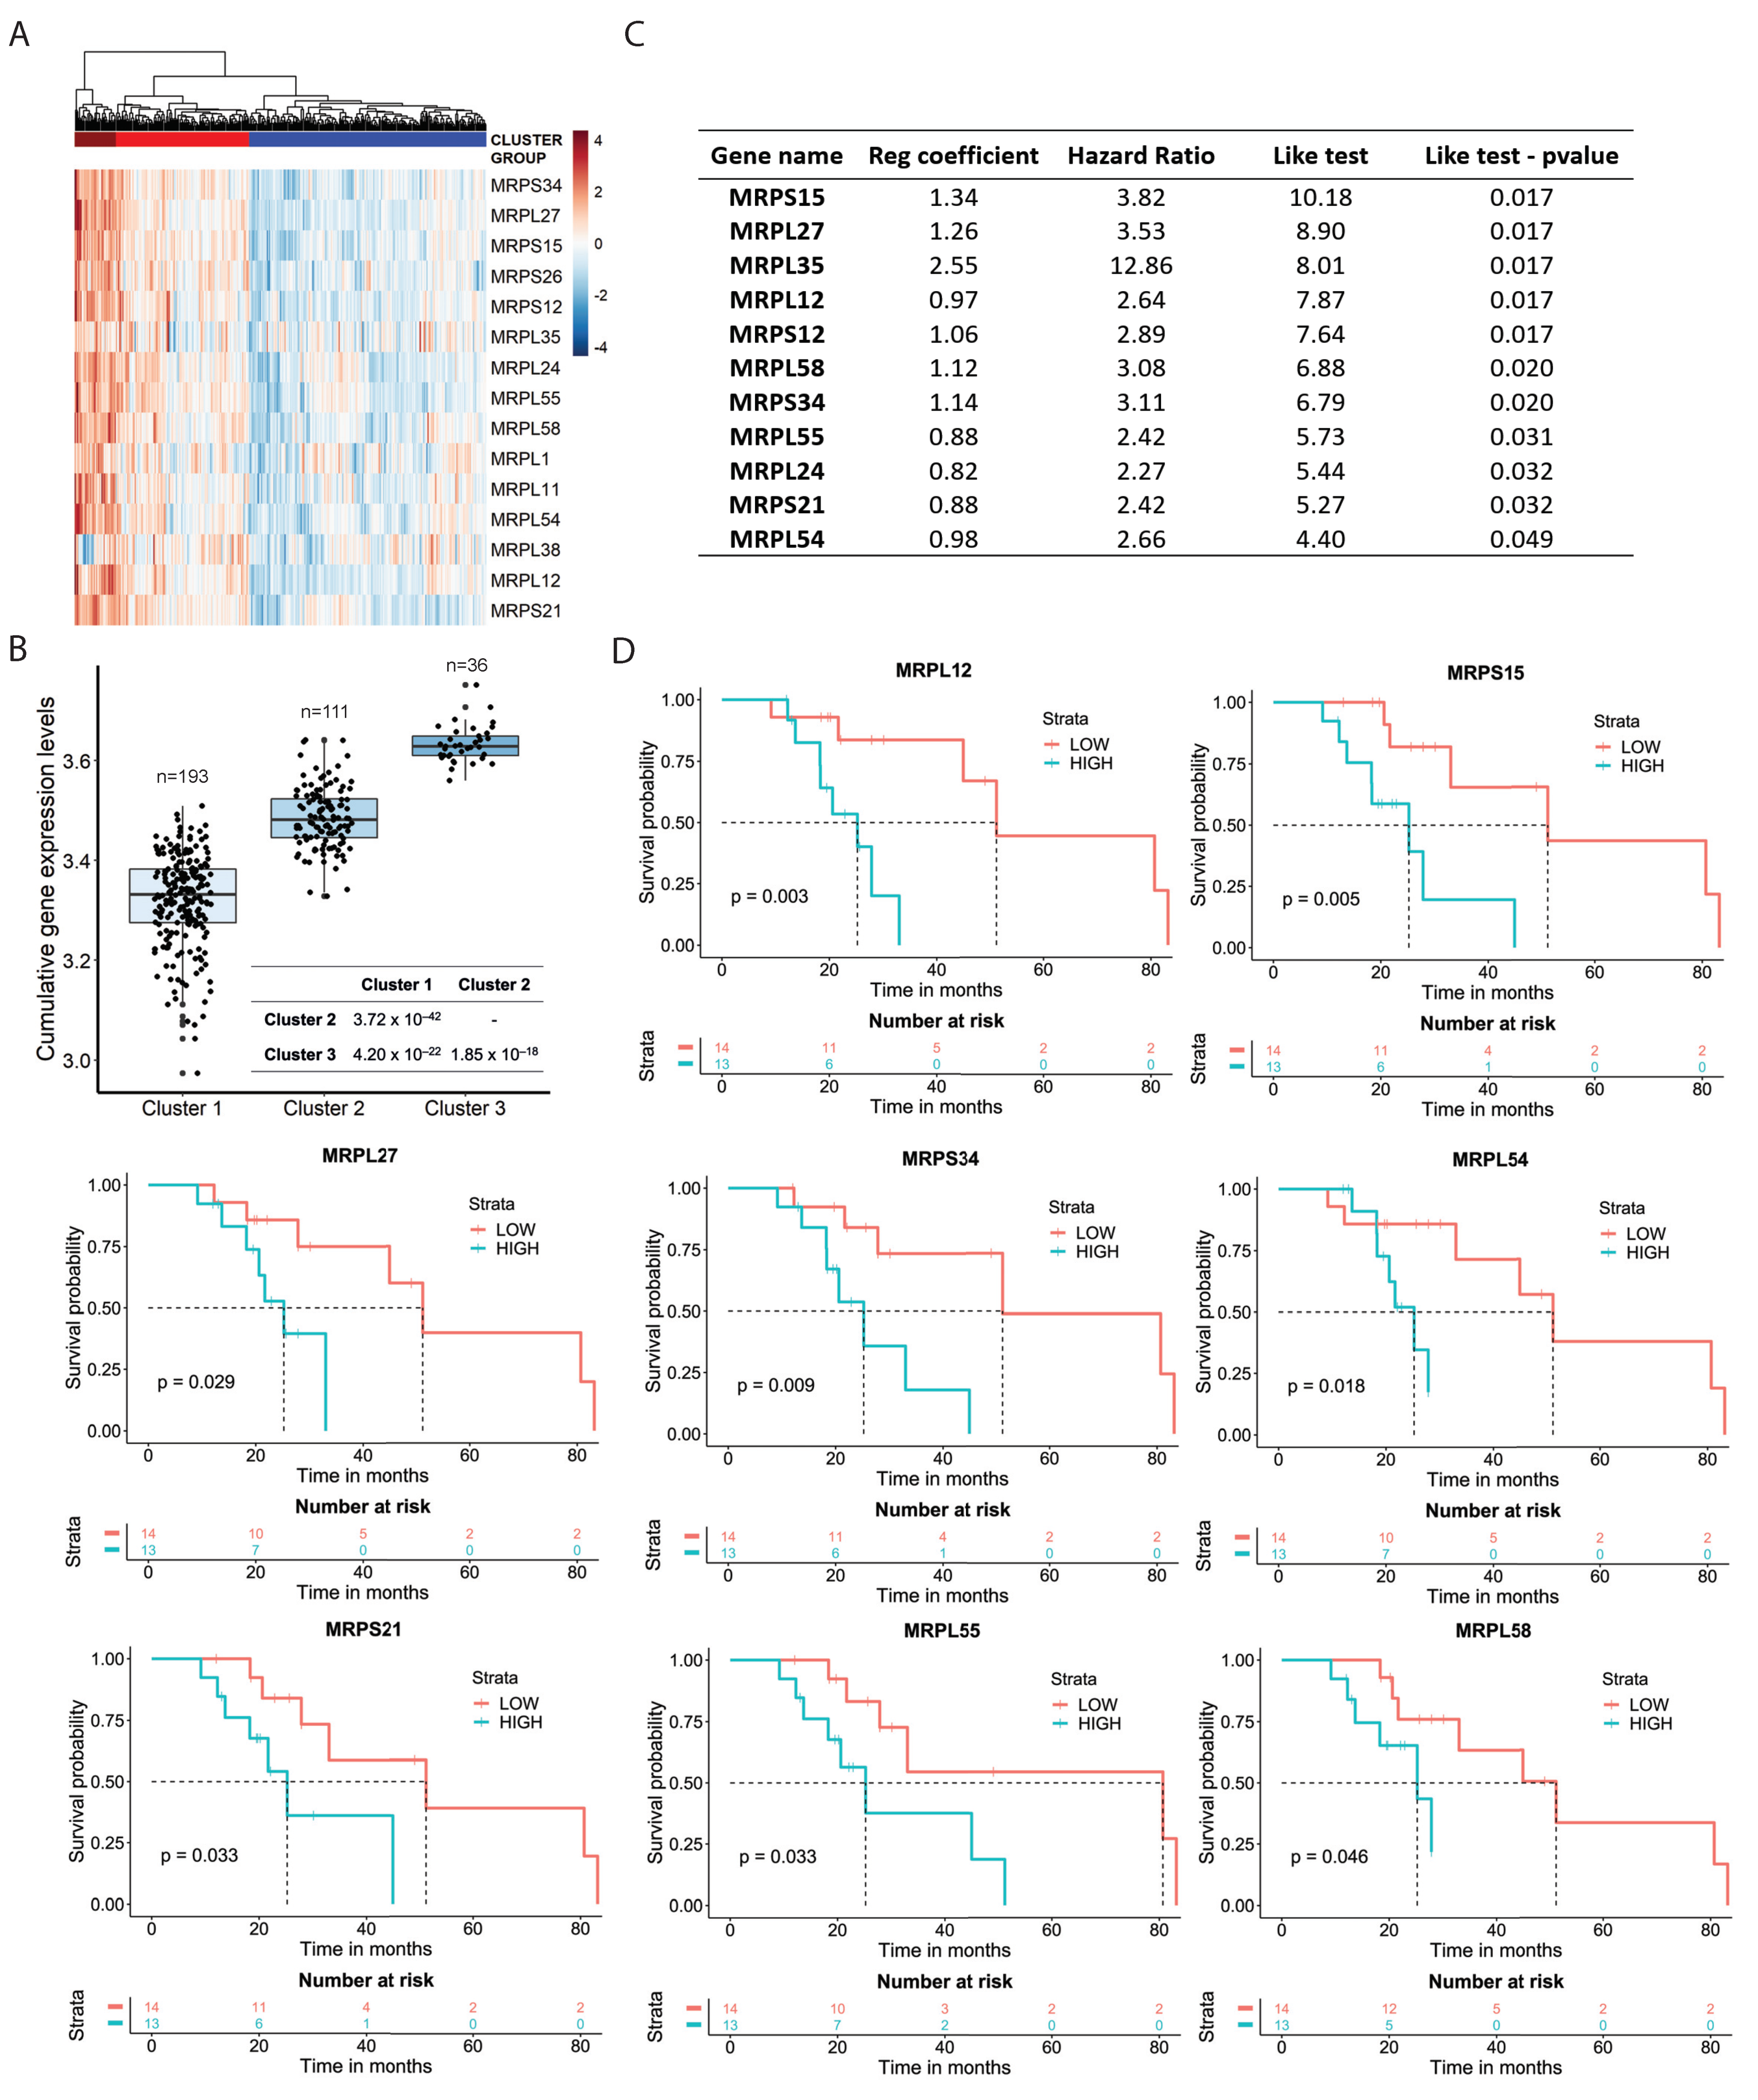
3.3. Mitochondrial Ribosomal Protein Expression and Response to Sorafenib in HCC Patients
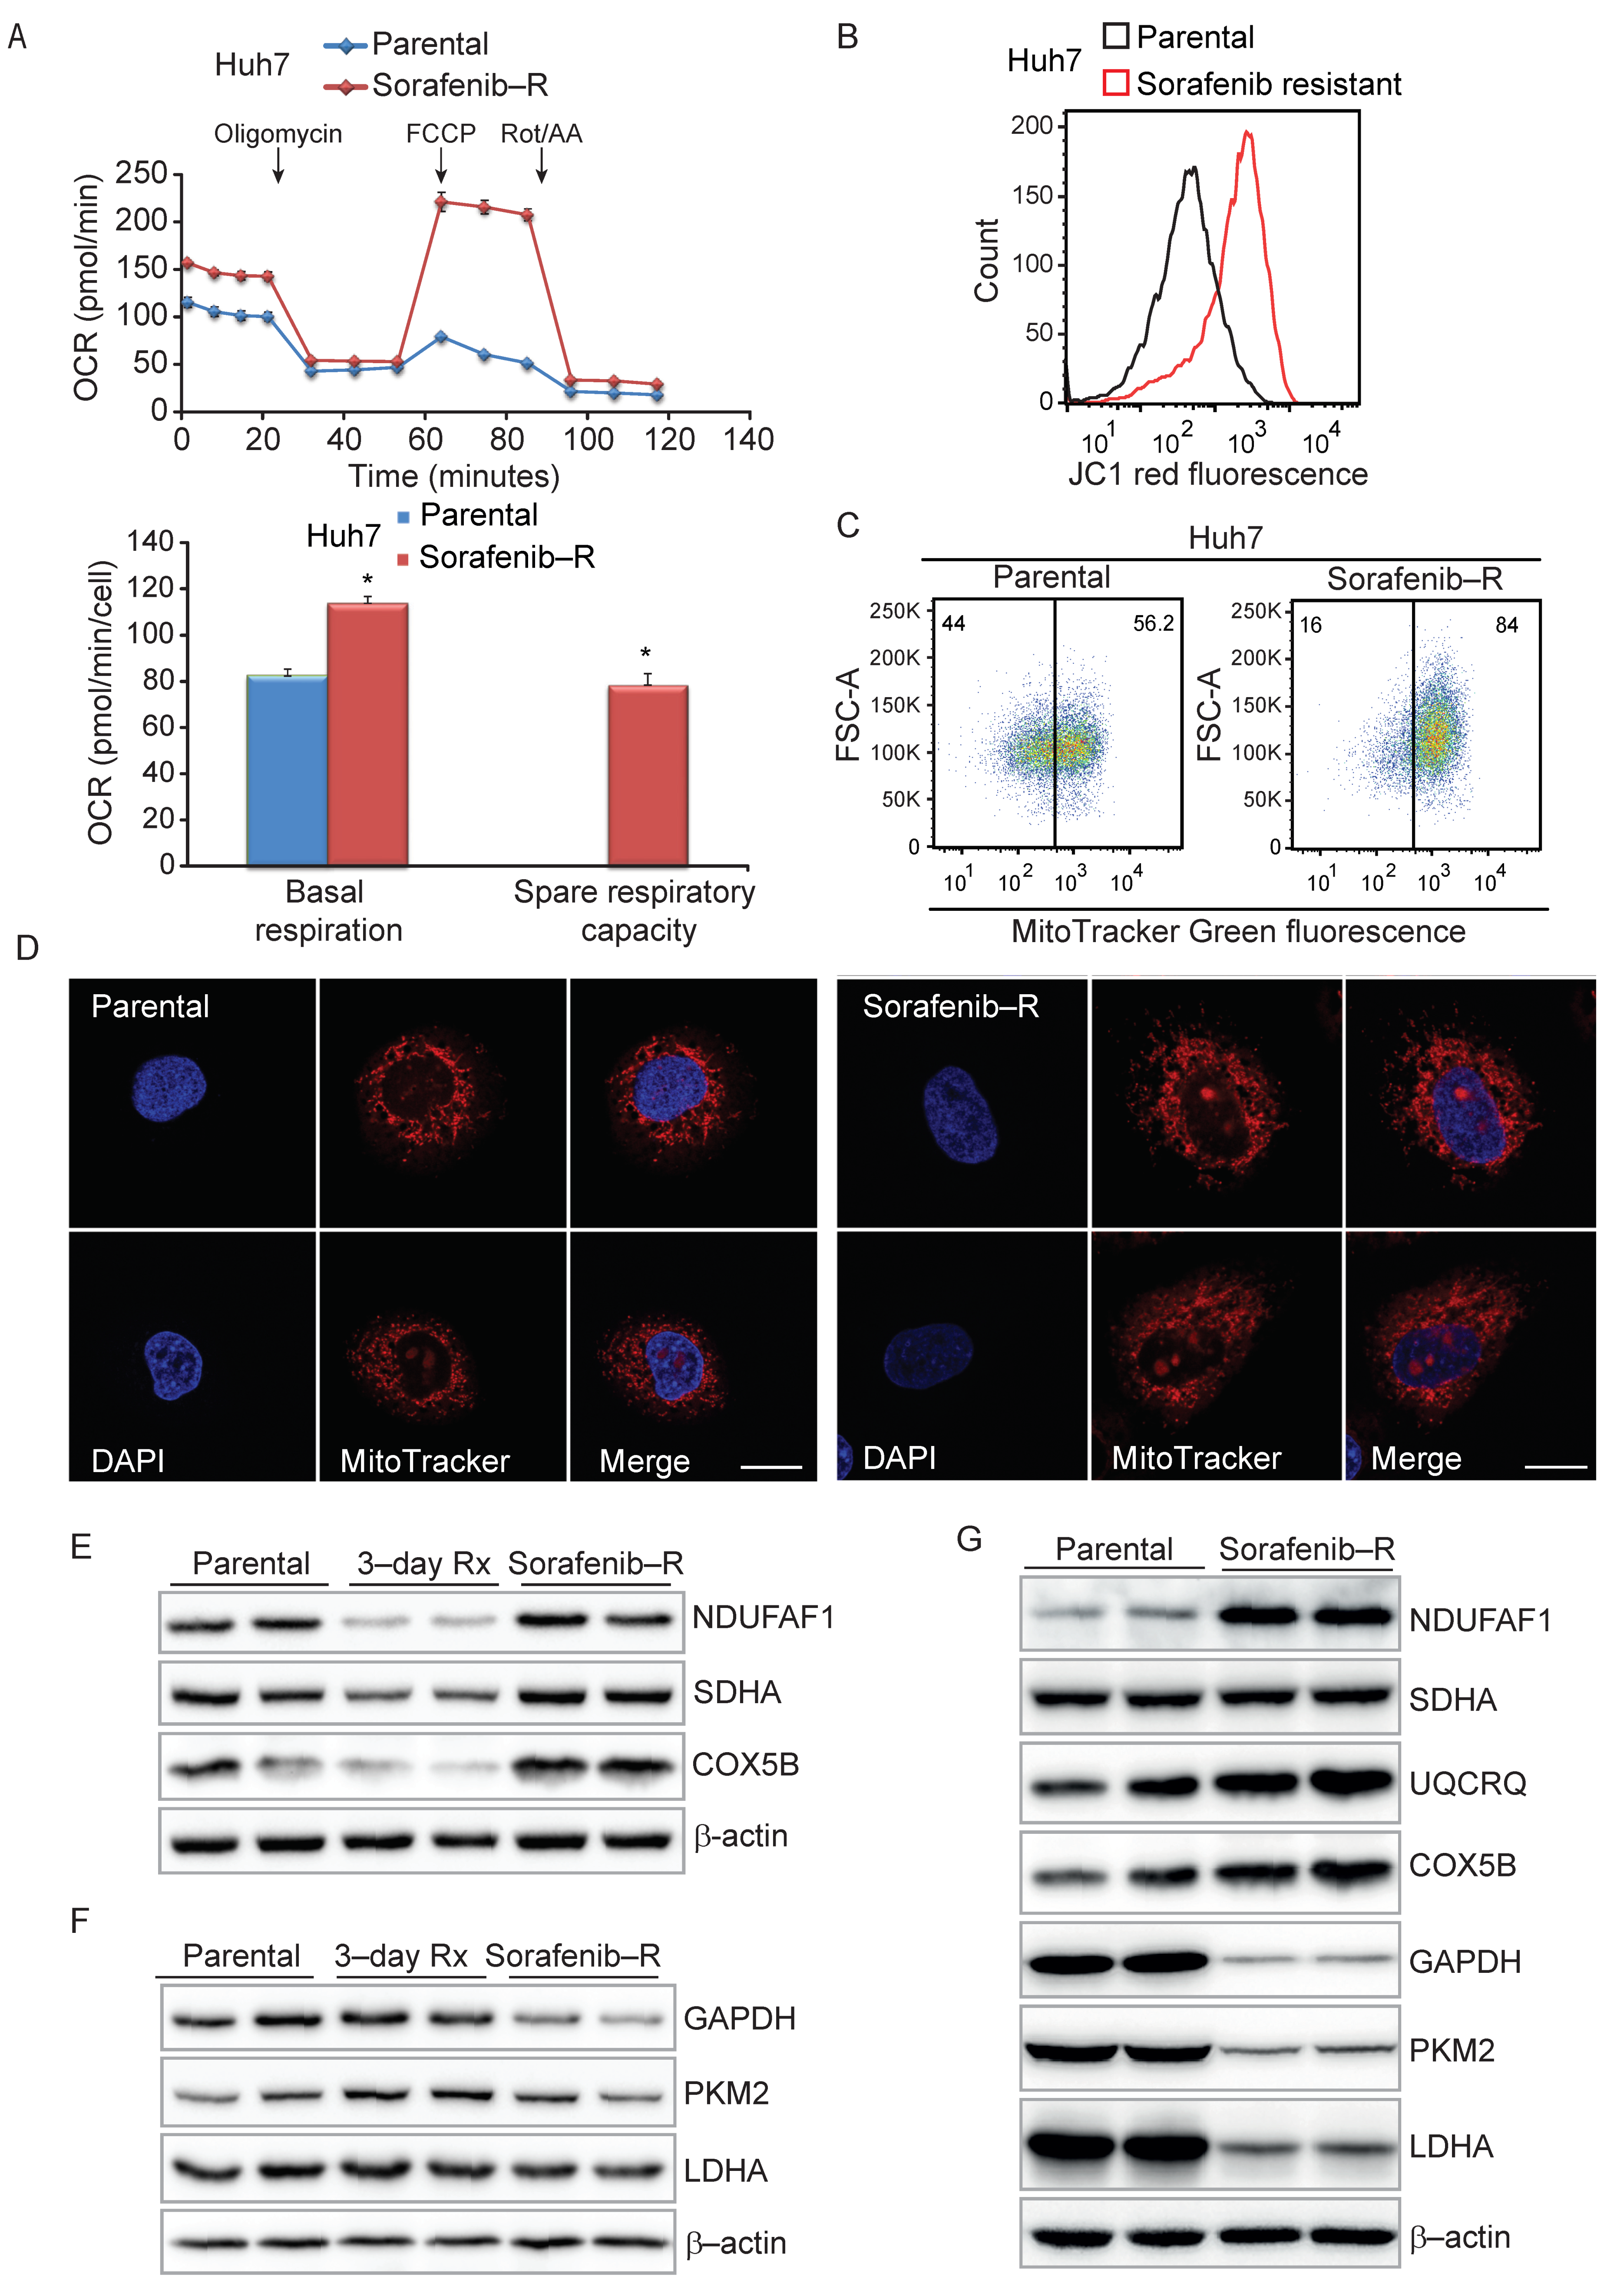
3.4. Enhanced Mitochondrial Biogenesis in HCC Cells Resistant to Sorafenib
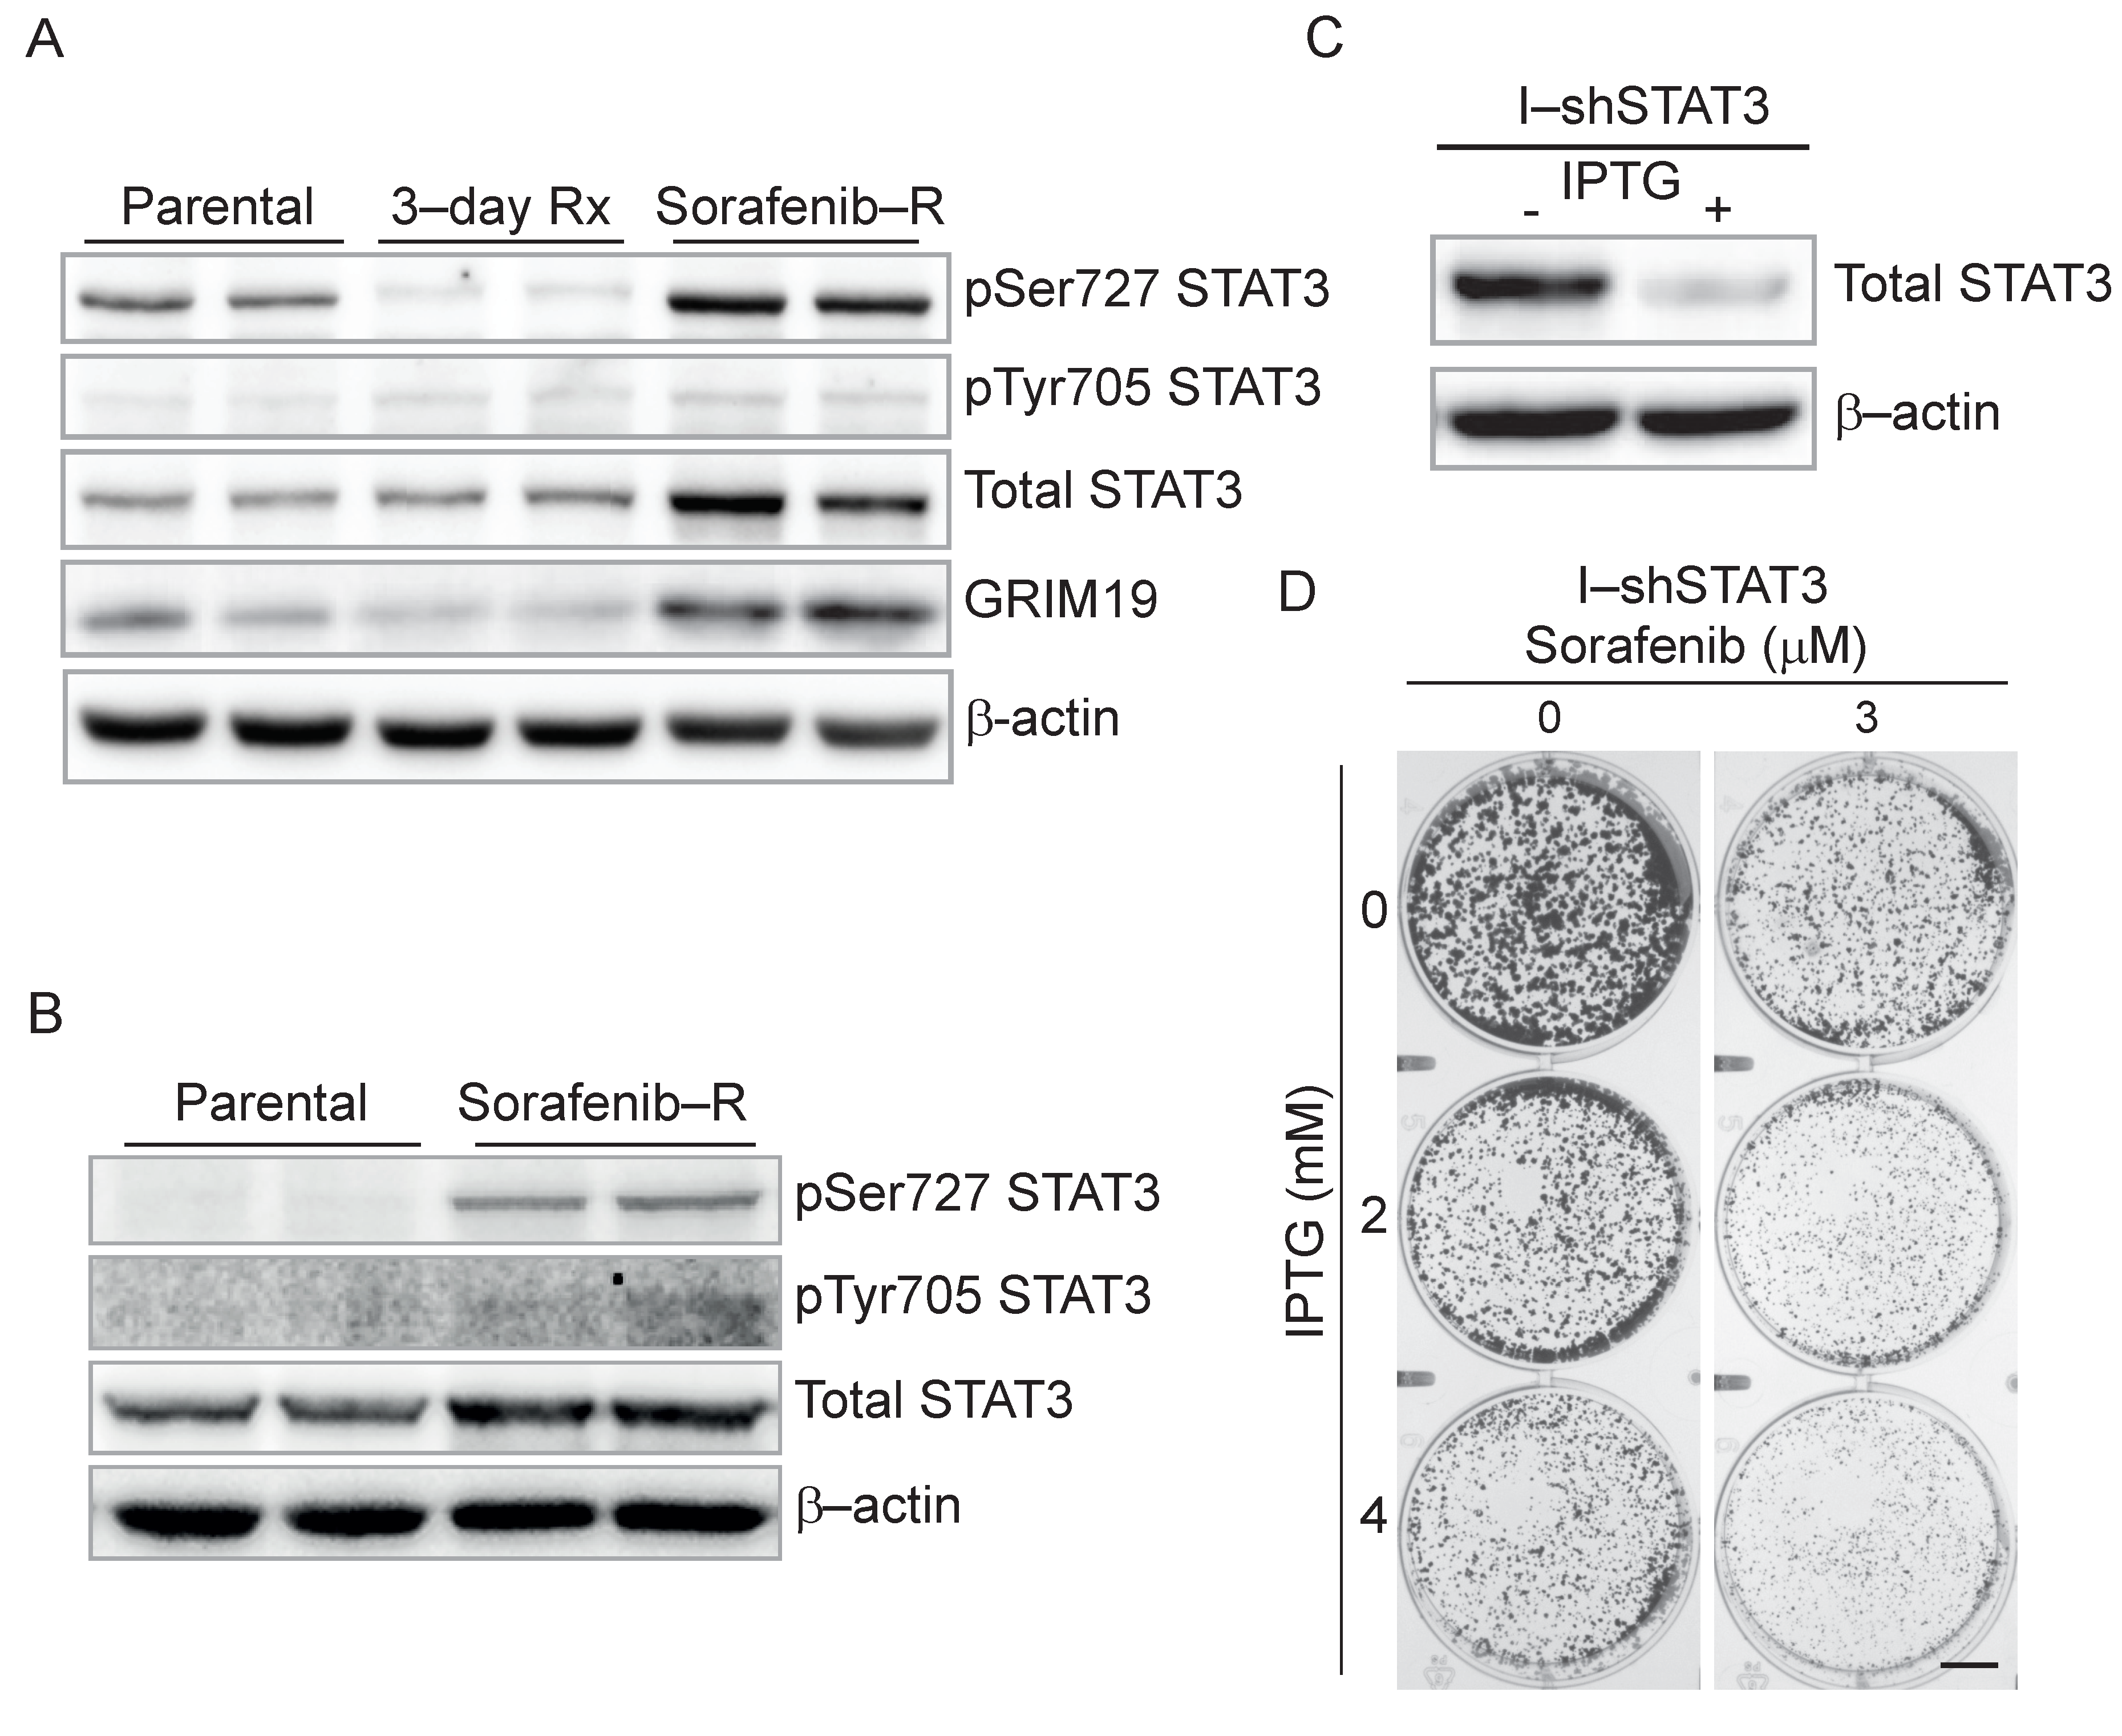
3.5. Genetic and Pharmacological Inhibition of STAT3 Sensitizes Resistant Cells to Sorafenib
4. Discussion
5. Conclusions
Supplementary Materials
Author Contributions
Funding
Institutional Review Board Statement
Informed Consent Statement
Data Availability Statement
Conflicts of Interest
References
- Forner, A.; Reig, M.; Bruix, J. Hepatocellular carcinoma. Lancet 2018, 391, 1301–1314. [Google Scholar] [CrossRef]
- Llovet, J.M.; Zucman-Rossi, J.; Pikarsky, E.; Sangro, B.; Schwartz, M.; Sherman, M.; Gores, G. Hepatocellular carcinoma. Nat. Rev. Dis. Primers 2016, 2, 16018. [Google Scholar] [CrossRef] [PubMed]
- Llovet, J.M.; Montal, R.; Sia, D.; Finn, R.S. Molecular therapies and precision medicine for hepatocellular carcinoma. Nat. Rev. Clin. Oncol. 2018, 15, 599–616. [Google Scholar] [CrossRef] [PubMed]
- Llovet, J.M.; Ricci, S.; Mazzaferro, V.; Hilgard, P.; Gane, E.; Blanc, J.F.; de Oliveira, A.C.; Santoro, A.; Raoul, J.L.; Forner, A.; et al. Sorafenib in advanced hepatocellular carcinoma. N. Engl. J. Med. 2008, 359, 378–390. [Google Scholar] [CrossRef] [PubMed]
- Finn, R.S.; Ryoo, B.Y.; Merle, P.; Kudo, M.; Bouattour, M.; Lim, H.Y.; Breder, V.; Edeline, J.; Chao, Y.; Ogasawara, S.; et al. Pembrolizumab As Second-Line Therapy in Patients With Advanced Hepatocellular Carcinoma in KEYNOTE-240: A Randomized, Double-Blind, Phase III Trial. J. Clin. Oncol. 2020, 38, 193–202. [Google Scholar] [CrossRef]
- Finn, R.S.; Qin, S.; Ikeda, M.; Galle, P.R.; Ducreux, M.; Kim, T.Y.; Kudo, M.; Breder, V.; Merle, P.; Kaseb, A.O.; et al. Atezolizumab plus Bevacizumab in Unresectable Hepatocellular Carcinoma. N. Engl. J. Med. 2020, 382, 1894–1905. [Google Scholar] [CrossRef] [PubMed]
- Wilhelm, S.; Carter, C.; Lynch, M.; Lowinger, T.; Dumas, J.; Smith, R.A.; Schwartz, B.; Simantov, R.; Kelley, S. Discovery and development of sorafenib: A multikinase inhibitor for treating cancer. Nat. Rev. Drug Discov. 2006, 5, 835–844. [Google Scholar] [CrossRef]
- Niu, L.; Liu, L.; Yang, S.; Ren, J.; Lai, P.B.S.; Chen, G.G. New insights into sorafenib resistance in hepatocellular carcinoma: Responsible mechanisms and promising strategies. Biochim. Biophys. Acta Rev. Cancer 2017, 1868, 564–570. [Google Scholar] [CrossRef] [PubMed]
- Rudalska, R.; Dauch, D.; Longerich, T.; McJunkin, K.; Wuestefeld, T.; Kang, T.W.; Hohmeyer, A.; Pesic, M.; Leibold, J.; von Thun, A.; et al. In vivo RNAi screening identifies a mechanism of sorafenib resistance in liver cancer. Nat. Med. 2014, 20, 1138–1146. [Google Scholar] [CrossRef] [Green Version]
- Dong, J.; Zhai, B.; Sun, W.; Hu, F.; Cheng, H.; Xu, J. Activation of phosphatidylinositol 3-kinase/AKT/snail signaling pathway contributes to epithelial-mesenchymal transition-induced multi-drug resistance to sorafenib in hepatocellular carcinoma cells. PLoS ONE 2017, 12, e0185088. [Google Scholar] [CrossRef] [Green Version]
- Tovar, V.; Cornella, H.; Moeini, A.; Vidal, S.; Hoshida, Y.; Sia, D.; Peix, J.; Cabellos, L.; Alsinet, C.; Torrecilla, S.; et al. Tumour initiating cells and IGF/FGF signalling contribute to sorafenib resistance in hepatocellular carcinoma. Gut 2017, 66, 530–540. [Google Scholar] [CrossRef]
- Easwaran, H.; Tsai, H.C.; Baylin, S.B. Cancer epigenetics: Tumor heterogeneity, plasticity of stem-like states, and drug resistance. Mol. Cell 2014, 54, 716–727. [Google Scholar] [CrossRef] [Green Version]
- Sharma, S.V.; Lee, D.Y.; Li, B.; Quinlan, M.P.; Takahashi, F.; Maheswaran, S.; McDermott, U.; Azizian, N.; Zou, L.; Fischbach, M.A.; et al. A chromatin-mediated reversible drug-tolerant state in cancer cell subpopulations. Cell 2010, 141, 69–80. [Google Scholar] [CrossRef] [PubMed] [Green Version]
- Singh, A.; Settleman, J. EMT, cancer stem cells and drug resistance: An emerging axis of evil in the war on cancer. Oncogene 2010, 29, 4741–4751. [Google Scholar] [CrossRef] [Green Version]
- Pavlova, N.N.; Thompson, C.B. The Emerging Hallmarks of Cancer Metabolism. Cell Metab. 2016, 23, 27–47. [Google Scholar] [CrossRef] [PubMed] [Green Version]
- Vyas, S.; Zaganjor, E.; Haigis, M.C. Mitochondria and Cancer. Cell 2016, 166, 555–566. [Google Scholar] [CrossRef] [PubMed]
- Civenni, G.; Bosotti, R.; Timpanaro, A.; Vazquez, R.; Merulla, J.; Pandit, S.; Rossi, S.; Albino, D.; Allegrini, S.; Mitra, A.; et al. Epigenetic Control of Mitochondrial Fission Enables Self-Renewal of Stem-like Tumor Cells in Human Prostate Cancer. Cell Metab. 2019, 30, 303–318.e306. [Google Scholar] [CrossRef] [PubMed]
- Thomson, T.M.; Balcells, C.; Cascante, M. Metabolic Plasticity and Epithelial-Mesenchymal Transition. J. Clin. Med. 2019, 8, 967. [Google Scholar] [CrossRef] [PubMed] [Green Version]
- Vazquez, F.; Lim, J.H.; Chim, H.; Bhalla, K.; Girnun, G.; Pierce, K.; Clish, C.B.; Granter, S.R.; Widlund, H.R.; Spiegelman, B.M.; et al. PGC1alpha expression defines a subset of human melanoma tumors with increased mitochondrial capacity and resistance to oxidative stress. Cancer Cell 2013, 23, 287–301. [Google Scholar] [CrossRef] [Green Version]
- Haq, R.; Shoag, J.; Andreu-Perez, P.; Yokoyama, S.; Edelman, H.; Rowe, G.C.; Frederick, D.T.; Hurley, A.D.; Nellore, A.; Kung, A.L.; et al. Oncogenic BRAF regulates oxidative metabolism via PGC1alpha and MITF. Cancer Cell 2013, 23, 302–315. [Google Scholar] [CrossRef] [PubMed] [Green Version]
- Sancho, P.; Burgos-Ramos, E.; Tavera, A.; Bou Kheir, T.; Jagust, P.; Schoenhals, M.; Barneda, D.; Sellers, K.; Campos-Olivas, R.; Grana, O.; et al. MYC/PGC-1alpha Balance Determines the Metabolic Phenotype and Plasticity of Pancreatic Cancer Stem Cells. Cell Metab. 2015, 22, 590–605. [Google Scholar] [CrossRef] [PubMed] [Green Version]
- Deribe, Y.L.; Sun, Y.; Terranova, C.; Khan, F.; Martinez-Ledesma, J.; Gay, J.; Gao, G.; Mullinax, R.A.; Khor, T.; Feng, N.; et al. Mutations in the SWI/SNF complex induce a targetable dependence on oxidative phosphorylation in lung cancer. Nat. Med. 2018, 24, 1047–1057. [Google Scholar] [CrossRef] [PubMed]
- Molina, J.R.; Sun, Y.; Protopopova, M.; Gera, S.; Bandi, M.; Bristow, C.; McAfoos, T.; Morlacchi, P.; Ackroyd, J.; Agip, A.A.; et al. An inhibitor of oxidative phosphorylation exploits cancer vulnerability. Nat. Med. 2018, 24, 1036–1046. [Google Scholar] [CrossRef] [Green Version]
- Lee, C.; Cheung, S.T. STAT3: An Emerging Therapeutic Target for Hepatocellular Carcinoma. Cancers 2019, 11, 1646. [Google Scholar] [CrossRef] [PubMed] [Green Version]
- Yu, H.; Lee, H.; Herrmann, A.; Buettner, R.; Jove, R. Revisiting STAT3 signalling in cancer: New and unexpected biological functions. Nat. Rev. Cancer 2014, 14, 736–746. [Google Scholar] [CrossRef] [PubMed]
- Lee, H.J.; Zhuang, G.; Cao, Y.; Du, P.; Kim, H.J.; Settleman, J. Drug resistance via feedback activation of Stat3 in oncogene-addicted cancer cells. Cancer Cell 2014, 26, 207–221. [Google Scholar] [CrossRef] [PubMed] [Green Version]
- Gough, D.J.; Corlett, A.; Schlessinger, K.; Wegrzyn, J.; Larner, A.C.; Levy, D.E. Mitochondrial STAT3 supports Ras-dependent oncogenic transformation. Science 2009, 324, 1713–1716. [Google Scholar] [CrossRef] [PubMed] [Green Version]
- Wegrzyn, J.; Potla, R.; Chwae, Y.J.; Sepuri, N.B.; Zhang, Q.; Koeck, T.; Derecka, M.; Szczepanek, K.; Szelag, M.; Gornicka, A.; et al. Function of mitochondrial Stat3 in cellular respiration. Science 2009, 323, 793–797. [Google Scholar] [CrossRef] [PubMed] [Green Version]
- Kuleshov, M.V.; Jones, M.R.; Rouillard, A.D.; Fernandez, N.F.; Duan, Q.; Wang, Z.; Koplev, S.; Jenkins, S.L.; Jagodnik, K.M.; Lachmann, A.; et al. Enrichr: A comprehensive gene set enrichment analysis web server 2016 update. Nucleic Acids Res. 2016, 44, W90–W97. [Google Scholar] [CrossRef] [Green Version]
- Lieber, D.S.; Calvo, S.E.; Shanahan, K.; Slate, N.G.; Liu, S.; Hershman, S.G.; Gold, N.B.; Chapman, B.A.; Thorburn, D.R.; Berry, G.T.; et al. Targeted exome sequencing of suspected mitochondrial disorders. Neurology 2013, 80, 1762–1770. [Google Scholar] [CrossRef] [Green Version]
- Stine, Z.E.; Walton, Z.E.; Altman, B.J.; Hsieh, A.L.; Dang, C.V. MYC, Metabolism, and Cancer. Cancer Discov. 2015, 5, 1024–1039. [Google Scholar] [CrossRef] [PubMed] [Green Version]
- Dennerlein, S.; Wang, C.; Rehling, P. Plasticity of Mitochondrial Translation. Trends Cell Biol. 2017, 27, 712–721. [Google Scholar] [CrossRef] [PubMed]
- Modjtahedi, N.; Tokatlidis, K.; Dessen, P.; Kroemer, G. Mitochondrial Proteins Containing Coiled-Coil-Helix-Coiled-Coil-Helix (CHCH) Domains in Health and Disease. Trends Biochem. Sci. 2016, 41, 245–260. [Google Scholar] [CrossRef] [PubMed] [Green Version]
- Cancer Genome Atlas Research Network. Comprehensive and Integrative Genomic Characterization of Hepatocellular Carcinoma. Cell 2017, 169, 1327–1341.e23 . [Google Scholar] [CrossRef] [Green Version]
- Tammineni, P.; Anugula, C.; Mohammed, F.; Anjaneyulu, M.; Larner, A.C.; Sepuri, N.B. The import of the transcription factor STAT3 into mitochondria depends on GRIM-19, a component of the electron transport chain. J. Biol. Chem. 2013, 288, 4723–4732. [Google Scholar] [CrossRef] [PubMed] [Green Version]
- Brambilla, L.; Genini, D.; Laurini, E.; Merulla, J.; Perez, L.; Fermeglia, M.; Carbone, G.M.; Pricl, S.; Catapano, C.V. Hitting the right spot: Mechanism of action of OPB-31121, a novel and potent inhibitor of the Signal Transducer and Activator of Transcription 3 (STAT3). Mol. Oncol. 2015, 9, 1194–1206. [Google Scholar] [CrossRef] [PubMed] [Green Version]
- Genini, D.; Brambilla, L.; Laurini, E.; Merulla, J.; Civenni, G.; Pandit, S.; D’Antuono, R.; Perez, L.; Levy, D.E.; Pricl, S.; et al. Mitochondrial dysfunction induced by a SH2 domain-targeting STAT3 inhibitor leads to metabolic synthetic lethality in cancer cells. Proc. Natl. Acad. Sci. USA 2017, 114, E4924–E4933. [Google Scholar] [CrossRef] [PubMed] [Green Version]
- Tolcher, A.; Flaherty, K.; Shapiro, G.I.; Berlin, J.; Witzig, T.; Habermann, T.; Bullock, A.; Rock, E.; Elekes, A.; Lin, C.; et al. A First-in-Human Phase I Study of OPB-111077, a Small-Molecule STAT3 and Oxidative Phosphorylation Inhibitor, in Patients with Advanced Cancers. Oncologist 2018, 23, e658–e672. [Google Scholar] [CrossRef] [Green Version]
- Yoo, C.; Kang, J.; Lim, H.Y.; Kim, J.H.; Lee, M.A.; Lee, K.H.; Kim, T.Y.; Ryoo, B.Y. Phase I Dose-Finding Study of OPB-111077, a Novel STAT3 Inhibitor, in Patients with Advanced Hepatocellular Carcinoma. Cancer Res. Treat. 2019, 51, 510–518. [Google Scholar] [CrossRef] [PubMed] [Green Version]
- Wheaton, W.W.; Weinberg, S.E.; Hamanaka, R.B.; Soberanes, S.; Sullivan, L.B.; Anso, E.; Glasauer, A.; Dufour, E.; Mutlu, G.M.; Budigner, G.S.; et al. Metformin inhibits mitochondrial complex I of cancer cells to reduce tumorigenesis. eLife 2014, 3, e02242. [Google Scholar] [CrossRef] [PubMed]
- Xia, S.; Pan, Y.; Liang, Y.; Xu, J.; Cai, X. The microenvironmental and metabolic aspects of sorafenib resistance in hepatocellular carcinoma. EBioMedicine 2020, 51, 102610. [Google Scholar] [CrossRef] [Green Version]
- Ward, P.S.; Thompson, C.B. Metabolic reprogramming: A cancer hallmark even warburg did not anticipate. Cancer Cell 2012, 21, 297–308. [Google Scholar] [CrossRef] [PubMed] [Green Version]
- Viale, A.; Pettazzoni, P.; Lyssiotis, C.A.; Ying, H.; Sanchez, N.; Marchesini, M.; Carugo, A.; Green, T.; Seth, S.; Giuliani, V.; et al. Oncogene ablation-resistant pancreatic cancer cells depend on mitochondrial function. Nature 2014, 514, 628–632. [Google Scholar] [CrossRef] [PubMed] [Green Version]
- Zhang, G.; Frederick, D.T.; Wu, L.; Wei, Z.; Krepler, C.; Srinivasan, S.; Chae, Y.C.; Xu, X.; Choi, H.; Dimwamwa, E.; et al. Targeting mitochondrial biogenesis to overcome drug resistance to MAPK inhibitors. J. Clin. Investig. 2016, 126, 1834–1856. [Google Scholar] [CrossRef] [PubMed]
- Chen, C.L.; Uthaya Kumar, D.B.; Punj, V.; Xu, J.; Sher, L.; Tahara, S.M.; Hess, S.; Machida, K. NANOG Metabolically Reprograms Tumor-Initiating Stem-like Cells through Tumorigenic Changes in Oxidative Phosphorylation and Fatty Acid Metabolism. Cell Metab. 2016, 23, 206–219. [Google Scholar] [CrossRef] [PubMed] [Green Version]
- Senni, N.; Savall, M.; Cabrerizo Granados, D.; Alves-Guerra, M.C.; Sartor, C.; Lagoutte, I.; Gougelet, A.; Terris, B.; Gilgenkrantz, H.; Perret, C.; et al. beta-catenin-activated hepatocellular carcinomas are addicted to fatty acids. Gut 2019, 68, 322–334. [Google Scholar] [CrossRef]
- Jones, R.A.; Robinson, T.J.; Liu, J.C.; Shrestha, M.; Voisin, V.; Ju, Y.; Chung, P.E.; Pellecchia, G.; Fell, V.L.; Bae, S.; et al. RB1 deficiency in triple-negative breast cancer induces mitochondrial protein translation. J. Clin. Investig. 2016, 126, 3739–3757. [Google Scholar] [CrossRef] [Green Version]
- Martin, T.D.; Cook, D.R.; Choi, M.Y.; Li, M.Z.; Haigis, K.M.; Elledge, S.J. A Role for Mitochondrial Translation in Promotion of Viability in K-Ras Mutant Cells. Cell Rep. 2017, 20, 427–438. [Google Scholar] [CrossRef] [PubMed] [Green Version]
- Baechler, S.A.; Factor, V.M.; Dalla Rosa, I.; Ravji, A.; Becker, D.; Khiati, S.; Miller Jenkins, L.M.; Lang, M.; Sourbier, C.; Michaels, S.A.; et al. The mitochondrial type IB topoisomerase drives mitochondrial translation and carcinogenesis. Nat. Commun. 2019, 10, 83. [Google Scholar] [CrossRef] [PubMed]
- Wei, Z.; Jia, J.; Heng, G.; Xu, H.; Shan, J.; Wang, G.; Liu, C.; Xia, J.; Zhou, H.; Wu, M.; et al. Sirtuin-1/Mitochondrial Ribosomal Protein S5 Axis Enhances the Metabolic Flexibility of Liver Cancer Stem Cells. Hepatology 2019, 70, 1197–1213. [Google Scholar] [CrossRef] [PubMed]
- Mottis, A.; Herzig, S.; Auwerx, J. Mitocellular communication: Shaping health and disease. Science 2019, 366, 827–832. [Google Scholar] [CrossRef] [PubMed]
- Houtkooper, R.H.; Mouchiroud, L.; Ryu, D.; Moullan, N.; Katsyuba, E.; Knott, G.; Williams, R.W.; Auwerx, J. Mitonuclear protein imbalance as a conserved longevity mechanism. Nature 2013, 497, 451–457. [Google Scholar] [CrossRef] [PubMed] [Green Version]
- Cunningham, J.T.; Rodgers, J.T.; Arlow, D.H.; Vazquez, F.; Mootha, V.K.; Puigserver, P. mTOR controls mitochondrial oxidative function through a YY1-PGC-1alpha transcriptional complex. Nature 2007, 450, 736–740. [Google Scholar] [CrossRef] [PubMed]
- Carbognin, E.; Betto, R.M.; Soriano, M.E.; Smith, A.G.; Martello, G. Stat3 promotes mitochondrial transcription and oxidative respiration during maintenance and induction of naive pluripotency. EMBO J. 2016, 35, 618–634. [Google Scholar] [CrossRef]
- Tomas-Loba, A.; Manieri, E.; Gonzalez-Teran, B.; Mora, A.; Leiva-Vega, L.; Santamans, A.M.; Romero-Becerra, R.; Rodriguez, E.; Pintor-Chocano, A.; Feixas, F.; et al. p38gamma is essential for cell cycle progression and liver tumorigenesis. Nature 2019, 568, 557–560. [Google Scholar] [CrossRef] [PubMed] [Green Version]
- Pogozelski, A.R.; Geng, T.; Li, P.; Yin, X.; Lira, V.A.; Zhang, M.; Chi, J.T.; Yan, Z. p38gamma mitogen-activated protein kinase is a key regulator in skeletal muscle metabolic adaptation in mice. PLoS ONE 2009, 4, e7934. [Google Scholar] [CrossRef] [PubMed] [Green Version]


| Index | Name | p-Value | Adjusted p-Value 3 | Z-Score | Combined Score |
|---|---|---|---|---|---|
| Upregulated Genes 1 | |||||
| 1 | rRNA processing | 2.2 × 10⁻⁶ | 1.3 × 10⁻³ | −2.03 | 26.39 |
| 2 | Mitochondrial translation elongation | 5.0 × 10⁻⁶ | 1.3 × 10⁻³ | −2.07 | 25.26 |
| 3 | Mitochondrial translation termination | 5.0 × 10⁻⁶ | 1.3 × 10⁻³ | −2.06 | 25.18 |
| 4 | Mitochondrial translation initiation | 5.0 × 10⁻⁶ | 1.3 × 10⁻³ | −2.04 | 24.84 |
| 5 | Major pathway of rRNA processing in the nucleolus | 6.4 × 10⁻⁶ | 1.3 × 10⁻³ | −2.01 | 24.07 |
| 6 | Mitochondrial translation | 1.2 × 10⁻⁵ | 2.0 × 10⁻³ | −2.07 | 23.39 |
| Downregulated Genes 2 | |||||
| 1 | Platelet degranulation | 1.1 × 10⁻⁶ | 1.0 × 10⁻³ | −1.92 | 26.47 |
| 2 | Response to elevated platelet cytosolic Ca2+ | 2.1 × 10⁻⁶ | 1.1 × 10⁻³ | −1.90 | 24.77 |
| 3 | Biological oxidations | 1.2 × 10⁻⁵ | 2.4 × 10⁻³ | −2.02 | 22.86 |
| 4 | Phase II conjugation | 1.0 × 10⁻⁵ | 2.4 × 10⁻³ | −1.91 | 21.95 |
| 5 | Amyloid fiber formation | 9.6 × 10⁻⁶ | 2.4 × 10⁻³ | −1.89 | 21.80 |
| Index | Name | p-Value | Adjusted p-Value 3 | Z-Score | Combined Score |
|---|---|---|---|---|---|
| Upregulated Genes 1 | |||||
| 1 | MYC_ENCODE | 1.7 × 10⁻¹³ | 1.7 × 10⁻¹¹ | −1.62 | 47.63 |
| 2 | MAX_ENCODE | 3.9 × 10⁻⁹ | 2.0 × 10⁻⁷ | −1.60 | 31.06 |
| 3 | MYC_CHEA | 5.9 × 10⁻⁸ | 2.0 × 10⁻⁶ | −1.66 | 27.66 |
| 4 | ZBTB7A_ENCODE | 2.2 × 10⁻⁶ | 5.8 × 10⁻⁵ | −1.55 | 20.16 |
| 5 | KAT2A_ENCODE | 5.2 × 10⁻⁵ | 1.1 × 10⁻³ | −1.67 | 16.46 |
| Downregulated Genes 2 | |||||
| 1 | SOX2_CHEA | 3.0 × 10⁻⁷ | 3.1 × 10⁻⁵ | −1.75 | 26.37 |
| 2 | NFE2L2_CHEA | 2.6 × 10⁻⁶ | 1.2 × 10⁻⁴ | −1.60 | 20.82 |
| 3 | UBTF_ENCODE | 3.8 × 10⁻⁵ | 1.3 × 10⁻³ | −1.60 | 16.29 |
| 4 | ESR1_CHEA | 7.1 × 10⁻⁵ | 1.7 × 10⁻³ | −1.67 | 15.99 |
| 5 | FOSL2_ENCODE | 8.4 × 10⁻⁵ | 1.7 × 10⁻³ | −1.63 | 15.33 |
| 6 | TRIM28_CHEA | 2.3 × 10⁻⁴ | 4.0 × 10⁻³ | −1.56 | 13.04 |
Publisher’s Note: MDPI stays neutral with regard to jurisdictional claims in published maps and institutional affiliations. |
© 2021 by the authors. Licensee MDPI, Basel, Switzerland. This article is an open access article distributed under the terms and conditions of the Creative Commons Attribution (CC BY) license (https://creativecommons.org/licenses/by/4.0/).
Share and Cite
Pandit, S.K.; Sandrini, G.; Merulla, J.; Nobili, V.; Wang, X.; Zangari, A.; Rinaldi, A.; Shinde, D.; Carbone, G.M.; Catapano, C.V. Mitochondrial Plasticity Promotes Resistance to Sorafenib and Vulnerability to STAT3 Inhibition in Human Hepatocellular Carcinoma. Cancers 2021, 13, 6029. https://doi.org/10.3390/cancers13236029
Pandit SK, Sandrini G, Merulla J, Nobili V, Wang X, Zangari A, Rinaldi A, Shinde D, Carbone GM, Catapano CV. Mitochondrial Plasticity Promotes Resistance to Sorafenib and Vulnerability to STAT3 Inhibition in Human Hepatocellular Carcinoma. Cancers. 2021; 13(23):6029. https://doi.org/10.3390/cancers13236029
Chicago/Turabian StylePandit, Shusil K., Giada Sandrini, Jessica Merulla, Valentina Nobili, Xin Wang, Alessia Zangari, Andrea Rinaldi, Dheeraj Shinde, Giuseppina M. Carbone, and Carlo V. Catapano. 2021. "Mitochondrial Plasticity Promotes Resistance to Sorafenib and Vulnerability to STAT3 Inhibition in Human Hepatocellular Carcinoma" Cancers 13, no. 23: 6029. https://doi.org/10.3390/cancers13236029
APA StylePandit, S. K., Sandrini, G., Merulla, J., Nobili, V., Wang, X., Zangari, A., Rinaldi, A., Shinde, D., Carbone, G. M., & Catapano, C. V. (2021). Mitochondrial Plasticity Promotes Resistance to Sorafenib and Vulnerability to STAT3 Inhibition in Human Hepatocellular Carcinoma. Cancers, 13(23), 6029. https://doi.org/10.3390/cancers13236029