
Differential Kat3 Usage Orchestrates the Integration of Cellular Metabolism with Differentiation

 , , , and
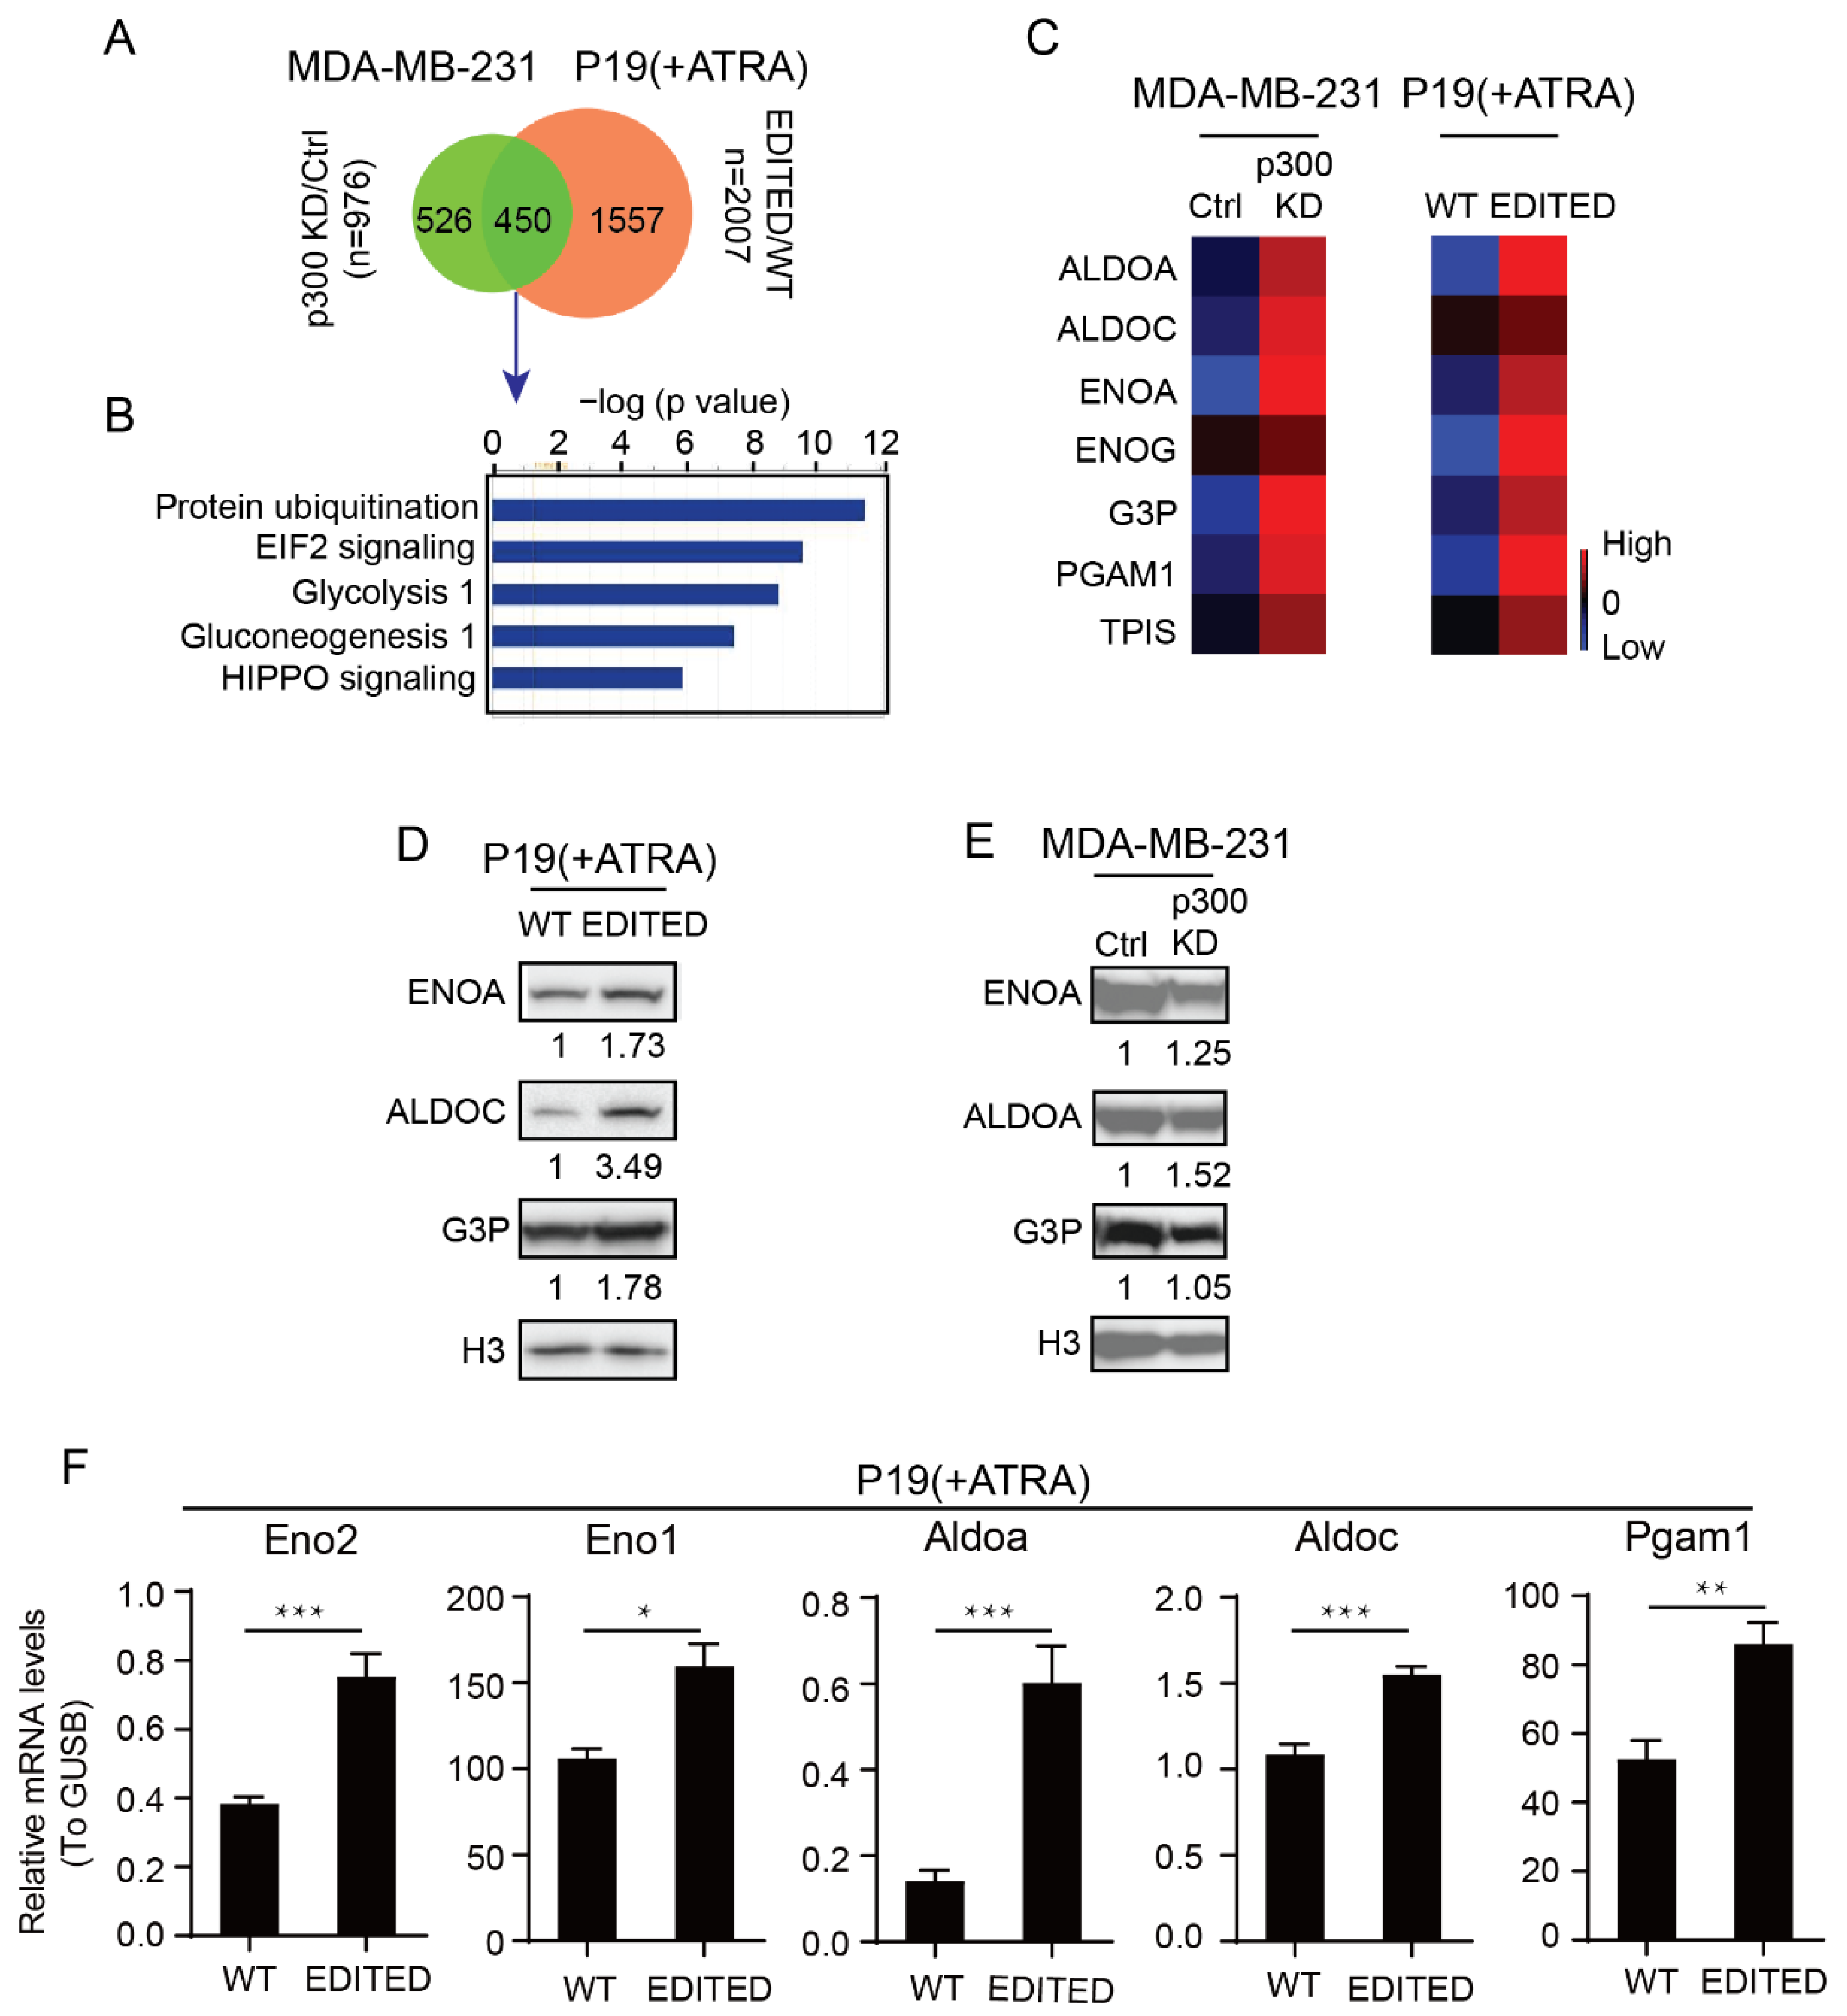
Abstract
Simple Summary
Abstract
1. Introduction
2. Materials and Methods
2.1. Cell Culture
2.2. Proteomic Sample Preparation and Mass Spec Analysis
2.3. Western Blot Analysis
2.4. Quantitative RT-PCR Analysis
2.5. Seahorse Analysis of Glycolysis and Mitochondrial Metabolism
2.6. Immunofluorescence
2.7. Transmission Electron Microscopy (TEM)
2.8. Mitochondrial Activity and Mass Testing by MitoTracker
2.9. Relative Mitochondrial DNA Content Testing
2.10. P19 p300 S89A Cell Line Generation by CRISPR/Cas9 Editing System
2.11. Generation of MDA-MB-231 p300 Knockdown Cells and MDA-MB-231 CBP Knockdown Cells
2.12. Statistics
3. Results
3.1. Differential Roles of the Kat3 Coactivators in Glycolysis
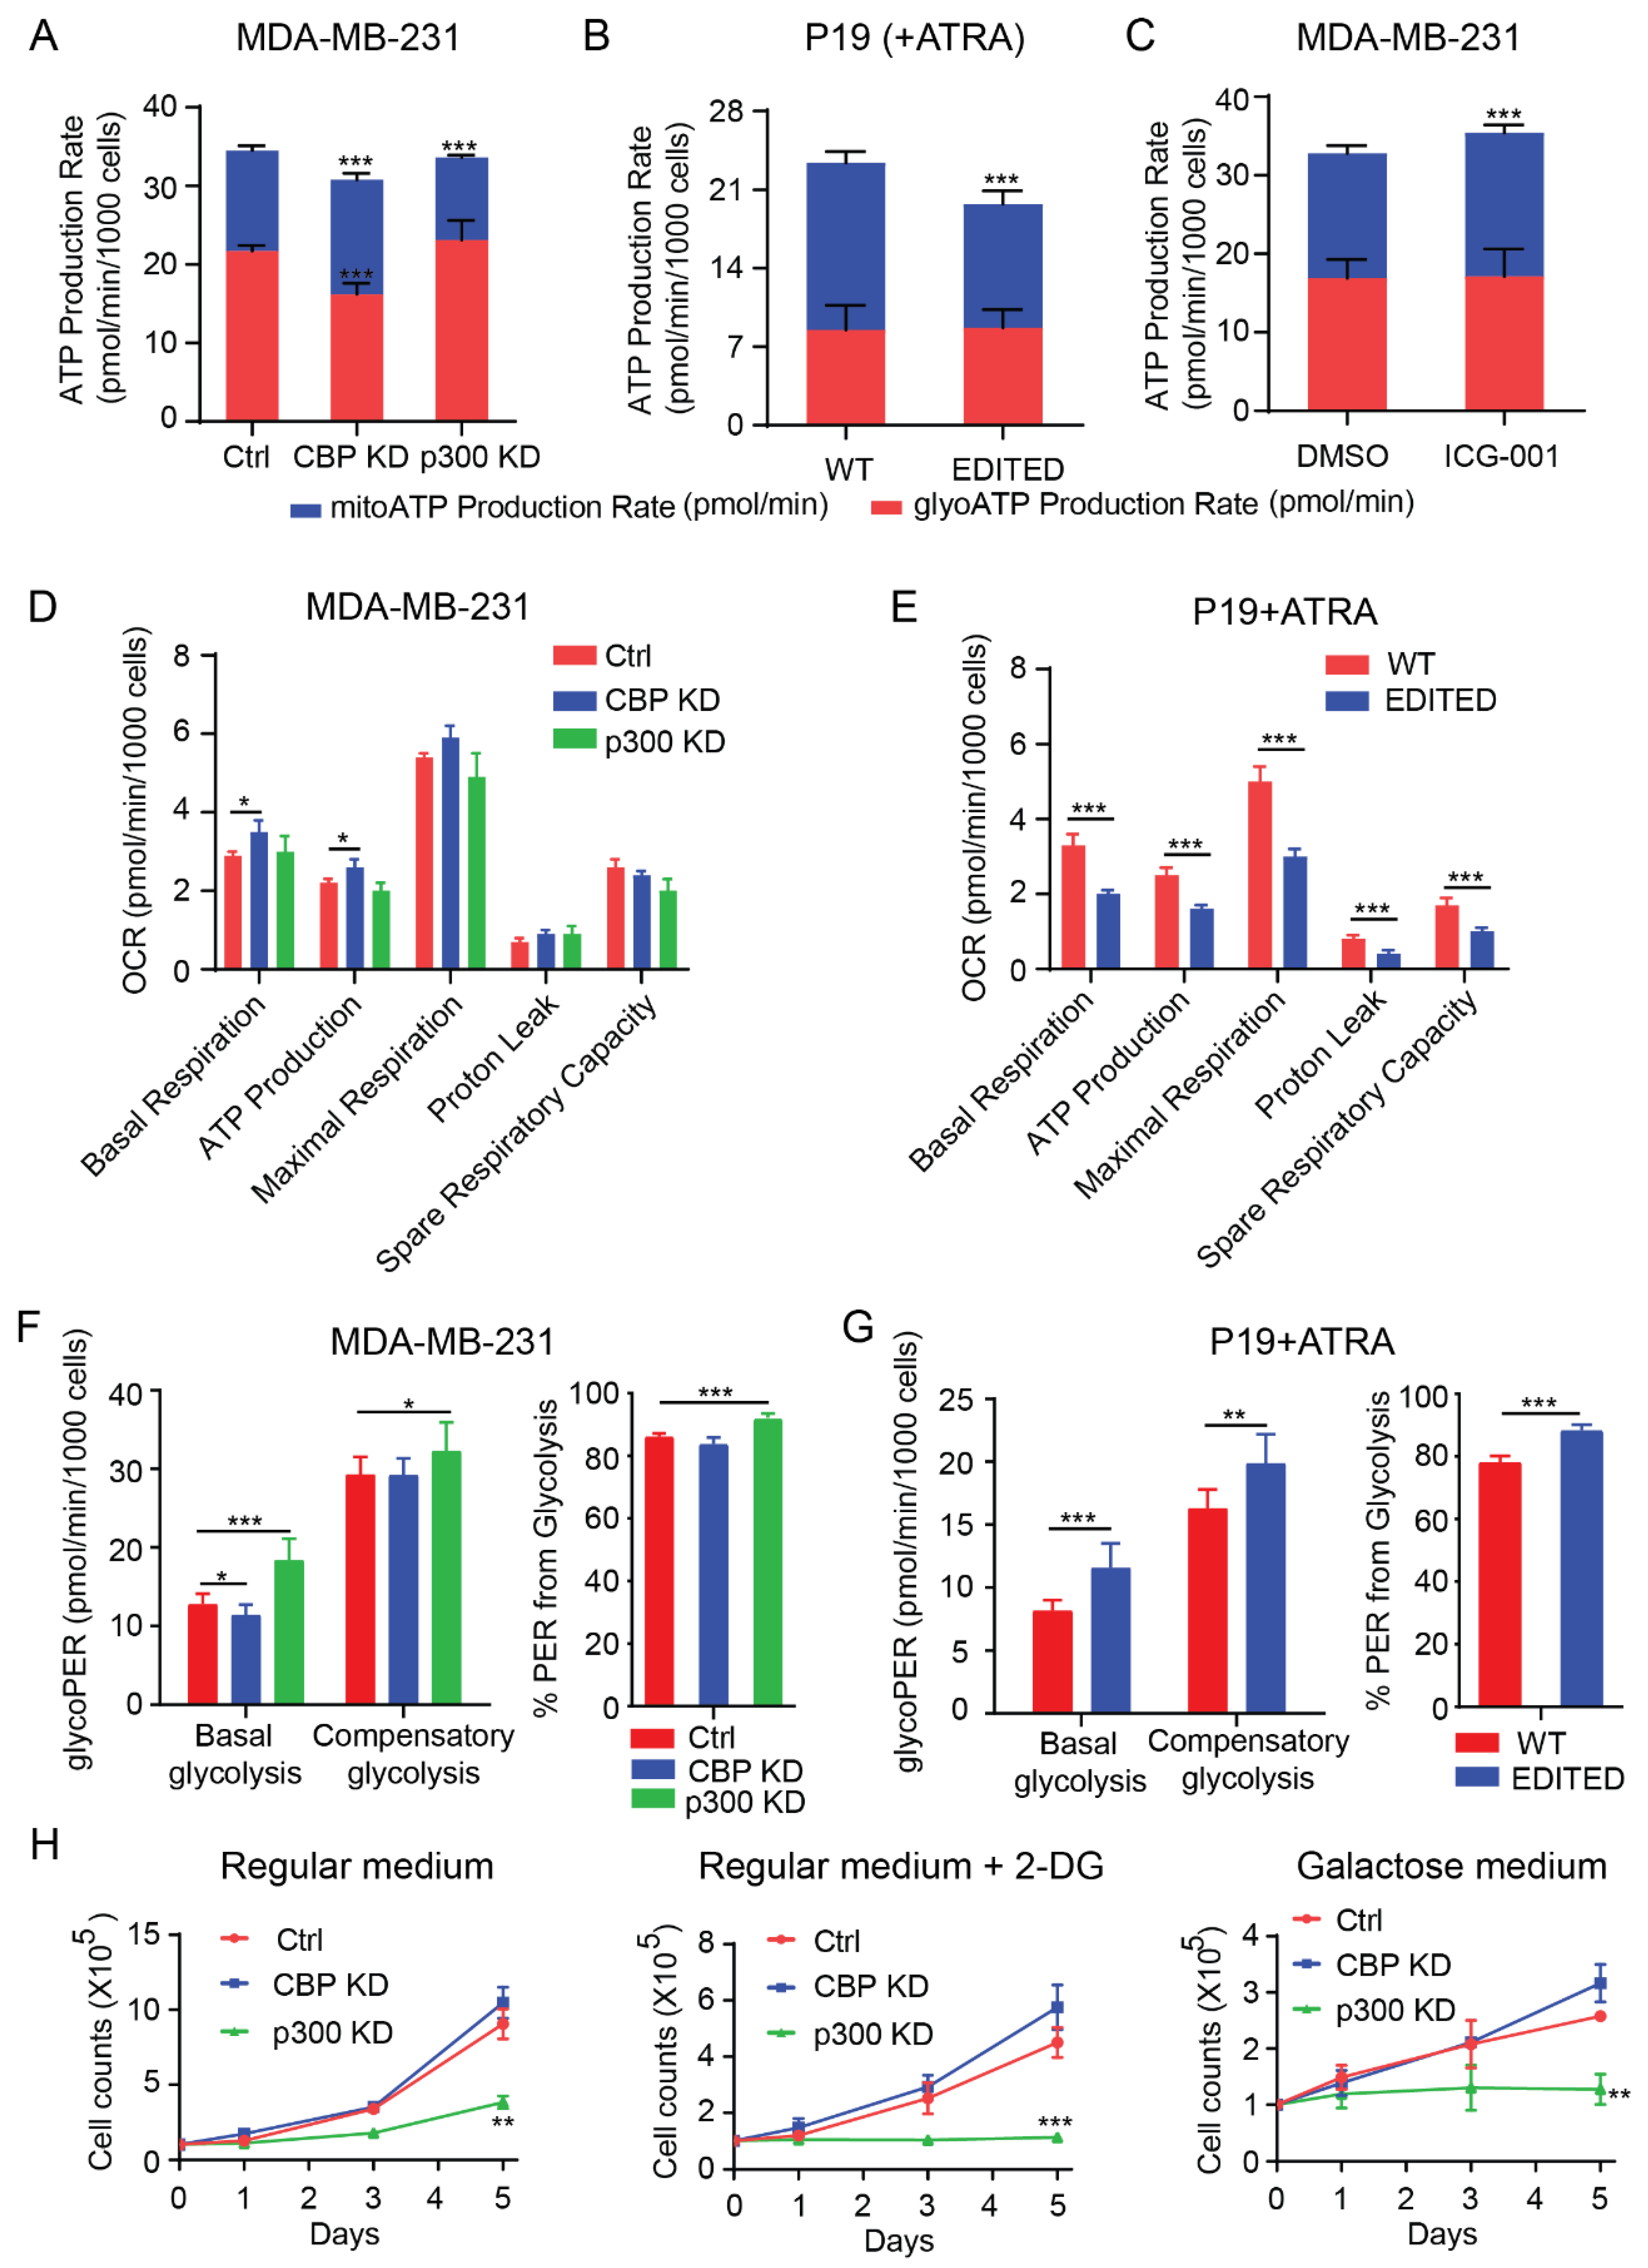
3.2. Dichotomous Roles of CBP and p300 in Mitochondrial Function, Cellular Energetics and Metabolism
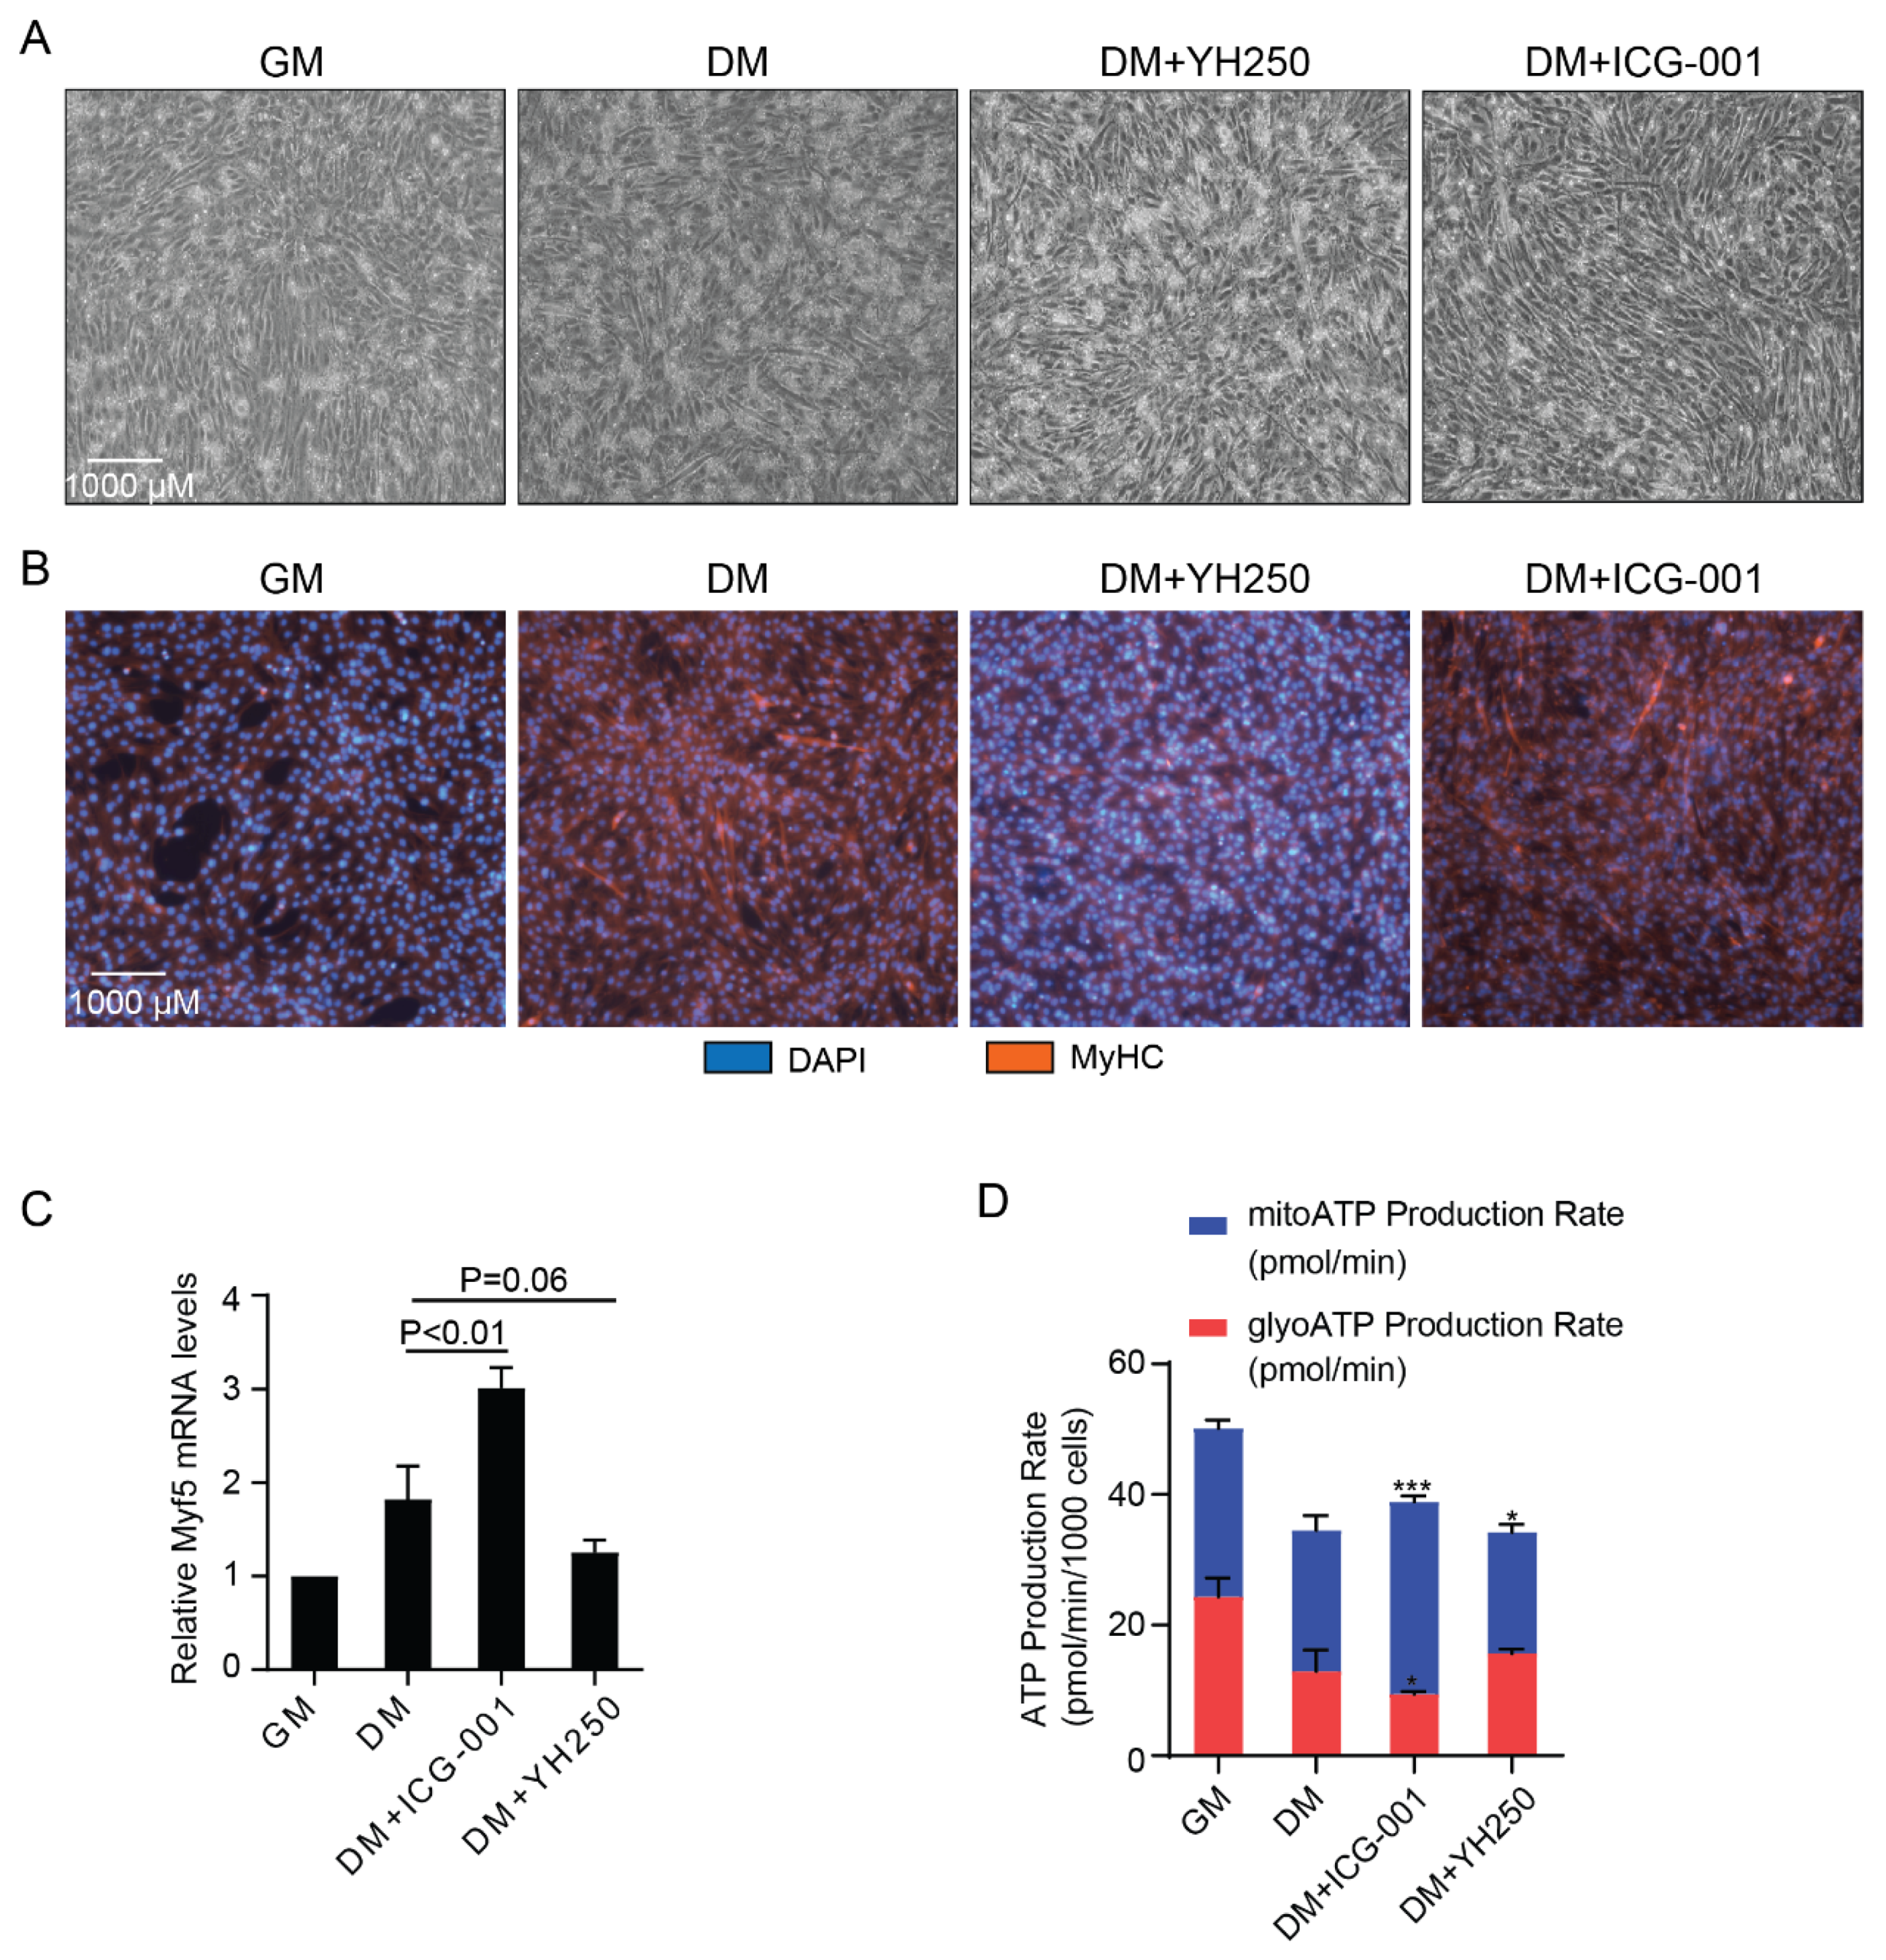
3.3. CBP and p300 Differentially Regulate Cellular Energetics during Cell Differentiation
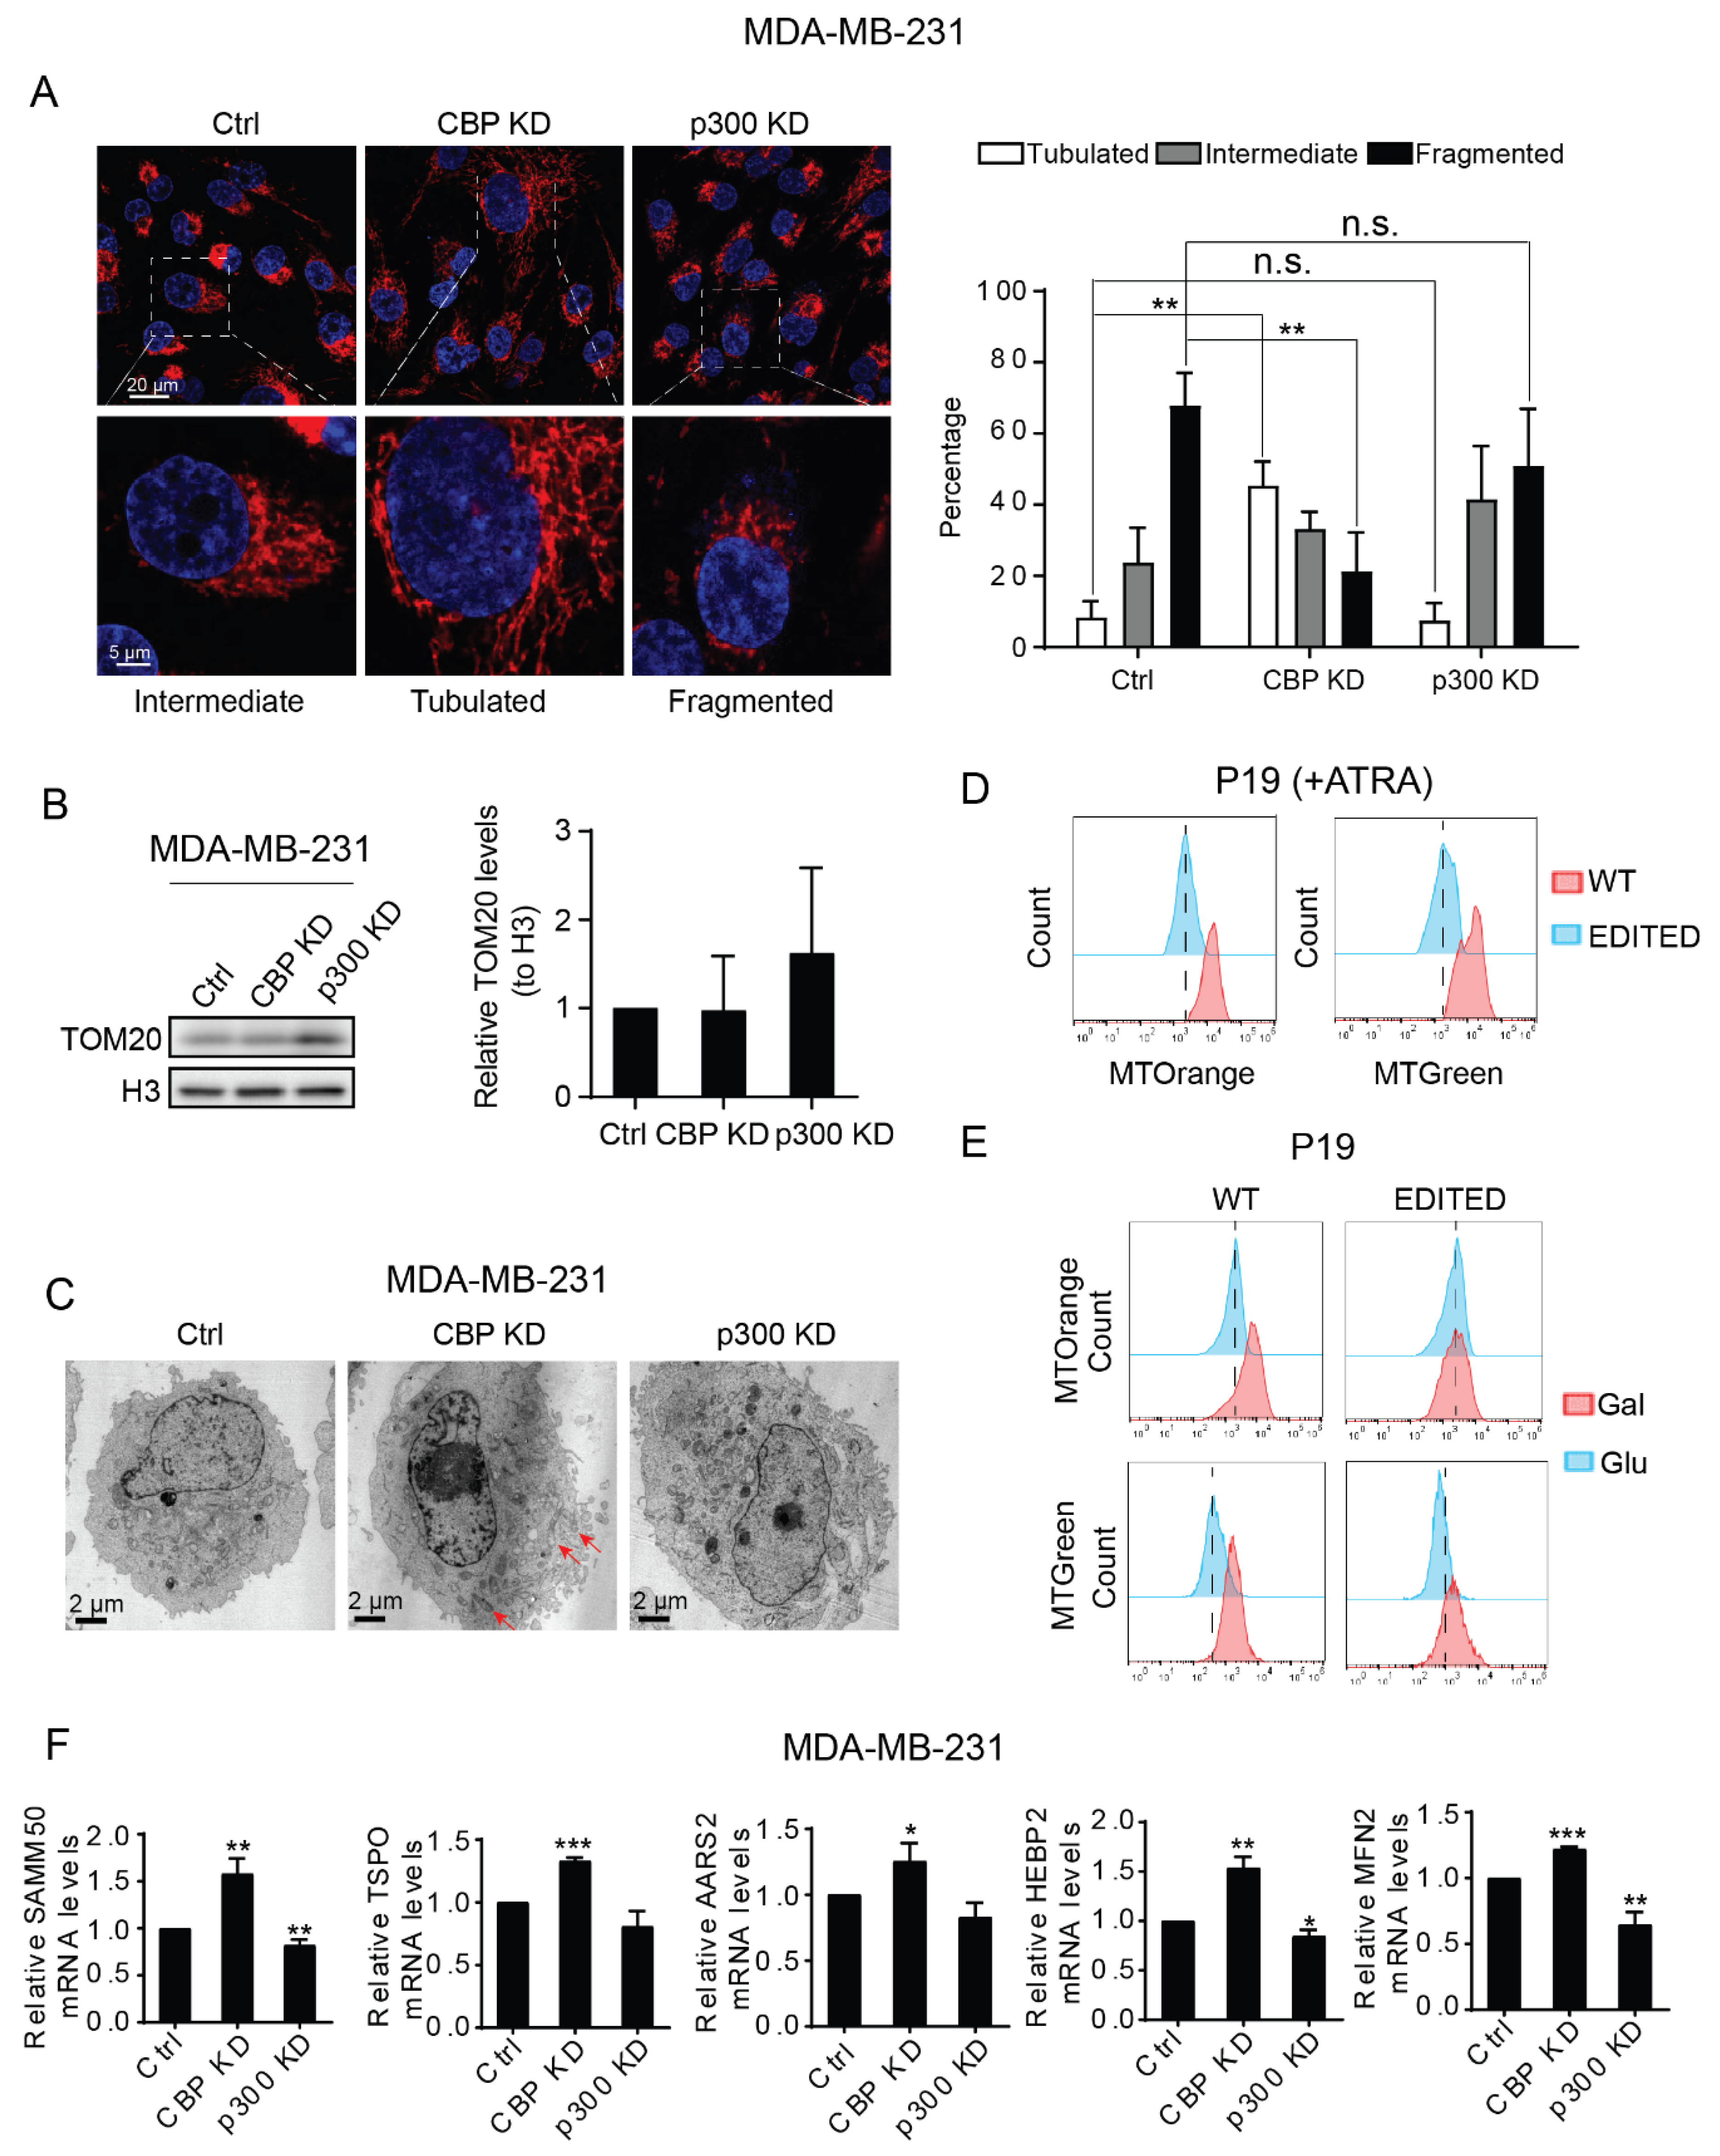
3.4. CBP and p300 Play Differential Roles in Mitochondrial Biogenesis and Mitochondrial Activity
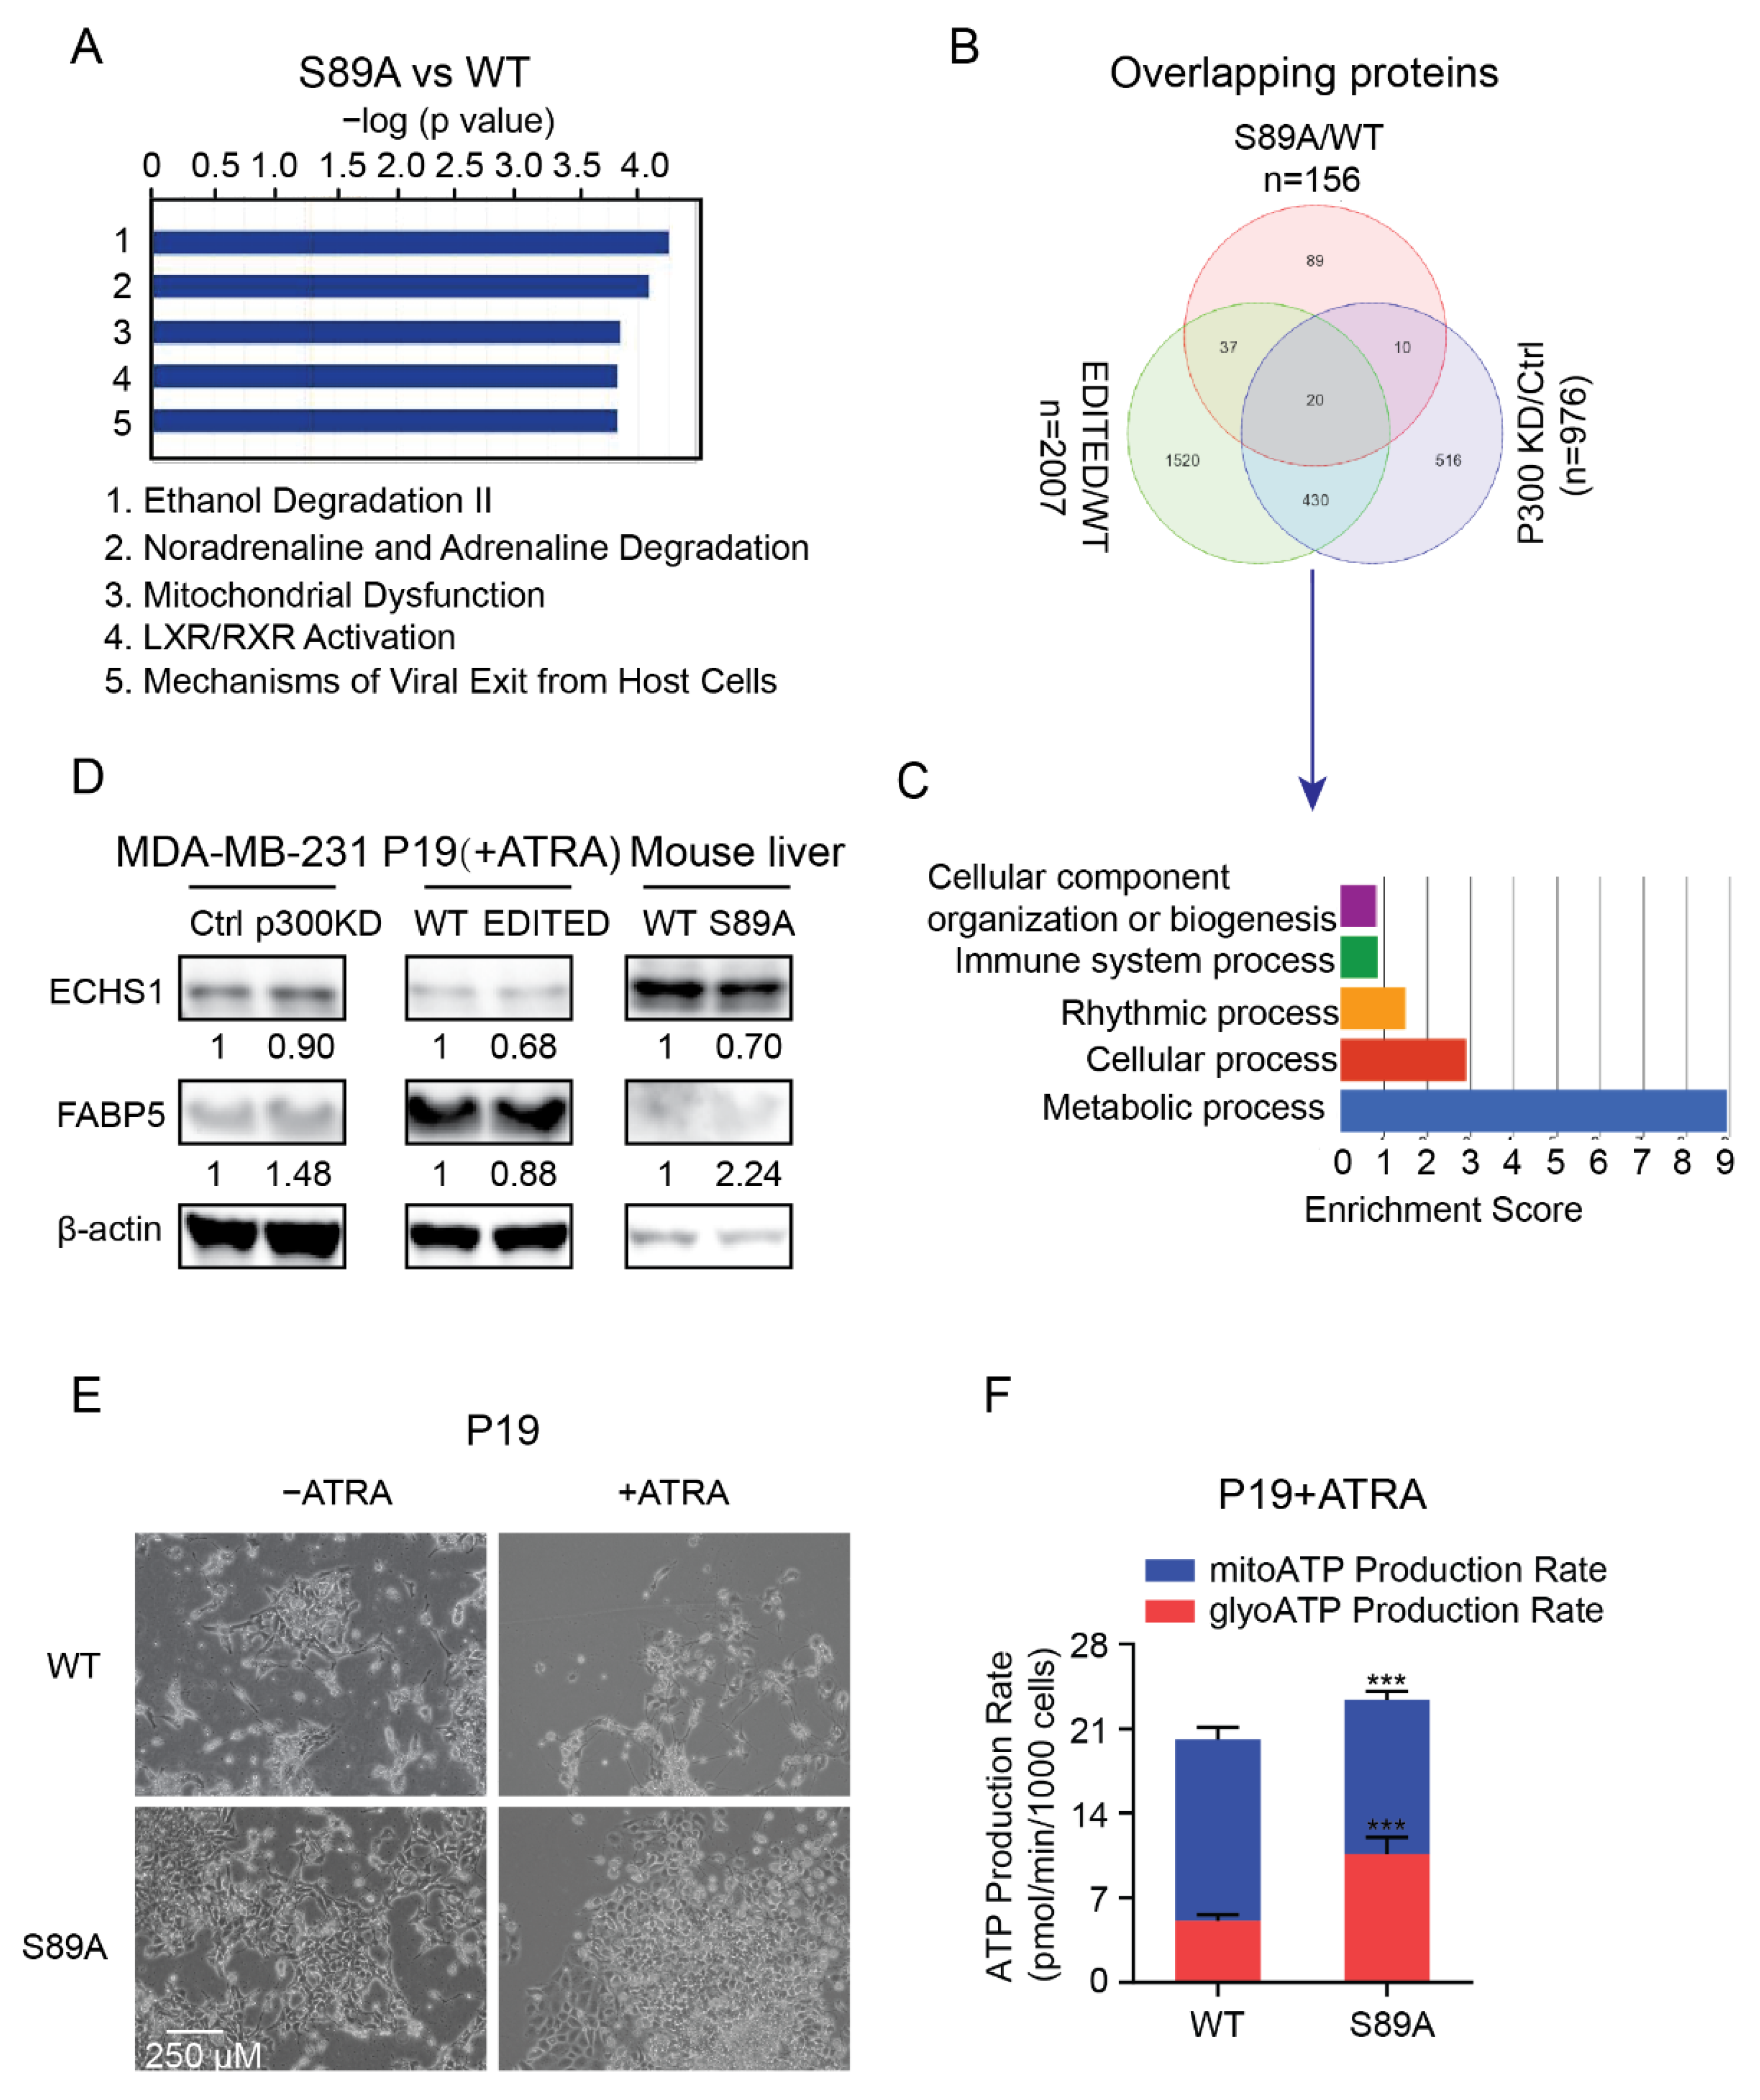
3.5. P300 S89, a Critical Signaling Nexus Integrating Cellular Differentiation and Metabolism
4. Discussion
5. Conclusions
Supplementary Materials
Author Contributions
Funding
Institutional Review Board Statement
Informed Consent Statement
Data Availability Statement
Acknowledgments
Conflicts of Interest
References
- Carthew, R.W. Gene regulation and cellular metabolism: An essential partnership. Trends Genet. 2021, 37, 389–400. [Google Scholar] [CrossRef] [PubMed]
- Buck, M.D.; Sowell, R.T.; Kaech, S.M.; Pearce, E.L. Metabolic instruction of immunity. Cell 2017, 169, 570–586. [Google Scholar] [CrossRef]
- Wei, P.; Dove, K.K.; Bensard, C.; Schell, J.C.; Rutter, J. the force is strong with this one: Metabolism (over)powers Stem Cell Fate. Trends Cell Biol. 2018, 28, 551–559. [Google Scholar] [CrossRef]
- Thomas, P.D.; Kahn, M. Kat3 coactivators in somatic stem cells and cancer stem cells: Biological roles, evolution, and pharmacologic manipulation. Cell Biol. Toxicol. 2016, 32, 61–81. [Google Scholar] [CrossRef] [PubMed]
- MacDougall, M.S.; Clarke, R.; Merrill, B.J. Intracellular Ca(2+) Homeostasis and nuclear export mediate exit from naive pluripotency. Cell Stem Cell 2019, 25, 210–224.e216. [Google Scholar] [CrossRef] [PubMed]
- Reya, T.; Clevers, H. Wnt signalling in stem cells and cancer. Nature 2005, 434, 843–850. [Google Scholar] [CrossRef]
- Abou Ziki, M.D.; Mani, A. The interplay of canonical and noncanonical Wnt signaling in metabolic syndrome. Nutr. Res. 2019, 70, 18–25. [Google Scholar] [CrossRef]
- Yoon, J.C.; Ng, A.; Kim, B.H.; Bianco, A.; Xavier, R.J.; Elledge, S.J. Wnt signaling regulates mitochondrial physiology and insulin sensitivity. Genes Dev. 2010, 24, 1507–1518. [Google Scholar] [CrossRef]
- Jeong, Y.; Mangelsdorf, D.J. Nuclear receptor regulation of stemness and stem cell differentiation. Exp. Mol. Med. 2009, 41, 525–537. [Google Scholar] [CrossRef]
- Preidis, G.A.; Kim, K.H.; Moore, D.D. Nutrient-sensing nuclear receptors PPARα and FXR control liver energy balance. J. Clin. Invest. 2017, 127, 1193–1201. [Google Scholar] [CrossRef]
- Dhillon, P.; Park, J.; Hurtado Del Pozo, C.; Li, L.; Doke, T.; Huang, S.; Zhao, J.; Kang, H.M.; Shrestra, R.; Balzer, M.S.; et al. The nuclear receptor ESRRA protects from kidney disease by coupling metabolism and differentiation. Cell Metab. 2021, 33, 379–394.e378. [Google Scholar] [CrossRef]
- Shrestha, A.; Che, R.C.; Zhang, A.H. Role of aldosterone in renal fibrosis. Adv. Exp. Med. Biol. 2019, 1165, 325–346. [Google Scholar] [CrossRef] [PubMed]
- Liu, B.C.; Lan, H.Y.; Lv, L.L. (Eds.) Renal Fibrosis: Mechanisms and Therapies; Springer: Singapore, 2019; Volume 1165. [Google Scholar]
- Kato, H.; Gruenwald, A.; Suh, J.H.; Miner, J.H.; Barisoni-Thomas, L.; Taketo, M.M.; Faul, C.; Millar, S.E.; Holzman, L.B.; Susztak, K. Wnt/β-catenin pathway in podocytes integrates cell adhesion, differentiation, and survival. J. Biol. Chem. 2011, 286, 26003–26015. [Google Scholar] [CrossRef] [PubMed]
- He, W.; Dai, C.; Li, Y.; Zeng, G.; Monga, S.P.; Liu, Y. Wnt/beta-catenin signaling promotes renal interstitial fibrosis. J. Am. Soc. Nephrol. 2009, 20, 765–776. [Google Scholar] [CrossRef] [PubMed]
- Ivashkiv, L.B. IFNγ: Signalling, epigenetics and roles in immunity, metabolism, disease and cancer immunotherapy. Nat. Rev. Immunol. 2018, 18, 545–558. [Google Scholar] [CrossRef]
- Vu, T.N.; Chen, X.; Foda, H.D.; Smaldone, G.C.; Hasaneen, N.A. Interferon-γ enhances the antifibrotic effects of pirfenidone by attenuating IPF lung fibroblast activation and differentiation. Respir. Res. 2019, 20, 206. [Google Scholar] [CrossRef] [PubMed]
- Law, B.M.P.; Wilkinson, R.; Wang, X.; Kildey, K.; Lindner, M.; Rist, M.J.; Beagley, K.; Healy, H.; Kassianos, A.J. Interferon-γ production by tubulointerstitial human CD56(bright) natural killer cells contributes to renal fibrosis and chronic kidney disease progression. Kidney Int. 2017, 92, 79–88. [Google Scholar] [CrossRef]
- Mi, H.; Muruganujan, A.; Thomas, P.D. PANTHER in 2013: Modeling the evolution of gene function, and other gene attributes, in the context of phylogenetic trees. Nucleic Acids Res. 2013, 41, D377–D386. [Google Scholar] [CrossRef]
- Arany, Z.; Sellers, W.R.; Livingston, D.M.; Eckner, R. E1A-associated p300 and CREB-associated CBP belong to a conserved family of coactivators. Cell 1994, 77, 799–800. [Google Scholar] [CrossRef]
- Eckner, R.; Ewen, M.E.; Newsome, D.; Gerdes, M.; DeCaprio, J.A.; Lawrence, J.B.; Livingston, D.M. Molecular cloning and functional analysis of the adenovirus E1A-associated 300-kD protein (p300) reveals a protein with properties of a transcriptional adaptor. Genes Dev. 1994, 8, 869–884. [Google Scholar] [CrossRef] [PubMed]
- Kung, A.L.; Rebel, V.I.; Bronson, R.T.; Ch’ng, L.E.; Sieff, C.A.; Livingston, D.M.; Yao, T.P. Gene dose-dependent control of hematopoiesis and hematologic tumor suppression by CBP. Genes Dev. 2000, 14, 272–277. [Google Scholar] [CrossRef]
- Yamauchi, T.; Kamon, J.; Minokoshi, Y.; Ito, Y.; Waki, H.; Uchida, S.; Yamashita, S.; Noda, M.; Kita, S.; Ueki, K.; et al. Adiponectin stimulates glucose utilization and fatty-acid oxidation by activating AMP-activated protein kinase. Nat. Med. 2002, 8, 1288–1295. [Google Scholar] [CrossRef] [PubMed]
- Fauquier, L.; Azzag, K.; Parra, M.A.M.; Quillien, A.; Boulet, M.; Diouf, S.; Carnac, G.; Waltzer, L.; Gronemeyer, H.; Vandel, L. CBP and P300 regulate distinct gene networks required for human primary myoblast differentiation and muscle integrity. Sci. Rep. 2018, 8, 12629. [Google Scholar] [CrossRef] [PubMed]
- Roth, J.F.; Shikama, N.; Henzen, C.; Desbaillets, I.; Lutz, W.; Marino, S.; Wittwer, J.; Schorle, H.; Gassmann, M.; Eckner, R. Differential role of p300 and CBP acetyltransferase during myogenesis: p300 acts upstream of MyoD and Myf5. Embo J. 2003, 22, 5186–5196. [Google Scholar] [CrossRef]
- Zhang, J.J.; Vinkemeier, U.; Gu, W.; Chakravarti, D.; Horvath, C.M.; Darnell, J.E., Jr. Two contact regions between Stat1 and CBP/p300 in interferon gamma signaling. Proc. Natl. Acad. Sci. USA 1996, 93, 15092–15096. [Google Scholar] [CrossRef] [PubMed]
- Van de Velde, S.; Wiater, E.; Tran, M.; Hwang, Y.; Cole, P.A.; Montminy, M. CREB Promotes beta cell gene expression by targeting its coactivators to tissue-specific enhancers. Mol. Cell Biol. 2019, 39, e00200-19. [Google Scholar] [CrossRef] [PubMed]
- Martire, S.; Nguyen, J.; Sundaresan, A.; Banaszynski, L.A. Differential contribution of p300 and CBP to regulatory element acetylation in mESCs. BMC Mol. Cell. Biol. 2020, 21, 55. [Google Scholar] [CrossRef]
- Trosko, J.E.; Kang, K.S. Evolution of energy metabolism, stem cells and cancer stem cells: How the warburg and barker hypotheses might be linked. Int. J. Stem. Cells 2012, 5, 39–56. [Google Scholar] [CrossRef]
- Ono, M.; Lai, K.K.Y.; Wu, K.; Nguyen, C.; Lin, D.P.; Murali, R.; Kahn, M. Nuclear receptor/Wnt beta-catenin interactions are regulated via differential CBP/p300 coactivator usage. PLoS ONE 2018, 13, e0200714. [Google Scholar] [CrossRef]
- Bricambert, J.; Miranda, J.; Benhamed, F.; Girard, J.; Postic, C.; Dentin, R. Salt-inducible kinase 2 links transcriptional coactivator p300 phosphorylation to the prevention of ChREBP-dependent hepatic steatosis in mice. J. Clin. Invest. 2010, 120, 4316–4331. [Google Scholar] [CrossRef]
- Yuan, L.W.; Soh, J.W.; Weinstein, I.B. Inhibition of histone acetyltransferase function of p300 by PKCdelta. Biochim. Biophys. Acta 2002, 1592, 205–211. [Google Scholar] [CrossRef]
- Yuan, L.W.; Gambee, J.E. Phosphorylation of p300 at serine 89 by protein kinase C. J. Biol. Chem. 2000, 275, 40946–40951. [Google Scholar] [CrossRef] [PubMed]
- Yang, W.; Hong, Y.H.; Shen, X.Q.; Frankowski, C.; Camp, H.S.; Leff, T. Regulation of transcription by AMP-activated protein kinase: Phosphorylation of p300 blocks its interaction with nuclear receptors. J. Biol. Chem. 2001, 276, 38341–38344. [Google Scholar] [CrossRef]
- Rieger, M.E.; Zhou, B.; Solomon, N.; Sunohara, M.; Li, C.; Nguyen, C.; Liu, Y.; Pan, J.H.; Minoo, P.; Crandall, E.D.; et al. p300/β-catenin interactions regulate adult progenitor cell differentiation downstream of WNT5a/Protein kinase C (PKC). J. Biol. Chem. 2016, 291, 6569–6582. [Google Scholar] [CrossRef] [PubMed]
- Liu, Y.; Dentin, R.; Chen, D.; Hedrick, S.; Ravnskjaer, K.; Schenk, S.; Milne, J.; Meyers, D.J.; Cole, P.; Yates, J., 3rd; et al. A fasting inducible switch modulates gluconeogenesis via activator/coactivator exchange. Nature 2008, 456, 269–273. [Google Scholar] [CrossRef]
- Gusterson, R.J.; Yuan, L.W.; Latchman, D.S. Distinct serine residues in CBP and p300 are necessary for their activation by phenylephrine. Int. J. Biochem. Cell Biol. 2004, 36, 893–899. [Google Scholar] [CrossRef]
- Miyabayashi, T.; Teo, J.L.; Yamamoto, M.; McMillan, M.; Nguyen, C.; Kahn, M. Wnt/beta-catenin/CBP signaling maintains long-term murine embryonic stem cell pluripotency. Proc. Natl. Acad. Sci. USA 2007, 104, 5668–5673. [Google Scholar] [CrossRef]
- Lai, K.K.Y.; Hu, X.; Chosa, K.; Nguyen, C.; Lin, D.P.; Lai, K.K.; Kato, N.; Higuchi, Y.; Highlander, S.K.; Melendez, E.; et al. p300 Serine 89: A critical signaling integrator and its effects on intestinal homeostasis and repair. Cancers 2021, 13, 1288. [Google Scholar] [CrossRef]
- Tavallaie, M.; Voshtani, R.; Deng, X.; Qiao, Y.; Jiang, F.; Collman, J.P.; Fu, L. Moderation of mitochondrial respiration mitigates metabolic syndrome of aging. Proc. Natl. Acad. Sci. USA 2020, 117, 9840–9850. [Google Scholar] [CrossRef]
- Jia, D.; Park, J.H.; Kaur, H.; Jung, K.H.; Yang, S.; Tripathi, S.; Galbraith, M.; Deng, Y.; Jolly, M.K.; Kaipparettu, B.A.; et al. Towards decoding the coupled decision-making of metabolism and epithelial-to-mesenchymal transition in cancer. Br. J. Cancer 2021, 124, 1902–1911. [Google Scholar] [CrossRef]
- Emami, K.H.; Nguyen, C.; Ma, H.; Kim, D.H.; Jeong, K.W.; Eguchi, M.; Moon, R.T.; Teo, J.L.; Kim, H.Y.; Moon, S.H.; et al. A small molecule inhibitor of beta-catenin/CREB-binding protein transcription [corrected]. Proc. Natl. Acad. Sci. USA 2004, 101, 12682–12687. [Google Scholar] [CrossRef] [PubMed]
- Vega-Naredo, I.; Loureiro, R.; Mesquita, K.A.; Barbosa, I.A.; Tavares, L.C.; Branco, A.F.; Erickson, J.R.; Holy, J.; Perkins, E.L.; Carvalho, R.A.; et al. Mitochondrial metabolism directs stemness and differentiation in P19 embryonal carcinoma stem cells. Cell Death Differ. 2014, 21, 1560–1574. [Google Scholar] [CrossRef]
- Choi, H.W.; Kim, J.H.; Chung, M.K.; Hong, Y.J.; Jang, H.S.; Seo, B.J.; Jung, T.H.; Kim, J.S.; Chung, H.M.; Byun, S.J.; et al. Mitochondrial and metabolic remodeling during reprogramming and differentiation of the reprogrammed cells. Stem Cells Dev. 2015, 24, 1366–1373. [Google Scholar] [CrossRef] [PubMed]
- Mathieu, J.; Ruohola-Baker, H. Metabolic remodeling during the loss and acquisition of pluripotency. Development 2017, 144, 541–551. [Google Scholar] [CrossRef]
- Higuchi, Y.; Sumiyoshi, T.; Ito, T.; Suzuki, M. Perospirone normalized P300 and cognitive function in a case of early psychosis. J. Clin. Psychopharmacol. 2013, 33, 263–266. [Google Scholar] [CrossRef]
- Zhao, Y.; Wu, K.; Nguyen, C.; Smbatyan, G.; Melendez, E.; Higuchi, Y.; Chen, Y.; Kahn, M. Small molecule p300/catenin antagonist enhances hematopoietic recovery after radiation. PLoS ONE 2017, 12, e0177245. [Google Scholar] [CrossRef]
- Teo, J.L.; Ma, H.; Nguyen, C.; Lam, C.; Kahn, M. Specific inhibition of CBP/beta-catenin interaction rescues defects in neuronal differentiation caused by a presenilin-1 mutation. Proc. Natl. Acad. Sci. USA 2005, 102, 12171–12176. [Google Scholar] [CrossRef] [PubMed]
- Tajbakhsh, S.; Borello, U.; Vivarelli, E.; Kelly, R.; Papkoff, J.; Duprez, D.; Buckingham, M.; Cossu, G. Differential activation of Myf5 and MyoD by different Wnts in explants of mouse paraxial mesoderm and the later activation of myogenesis in the absence of Myf5. Development 1998, 125, 4155–4162. [Google Scholar] [CrossRef]
- Lisowski, P.; Kannan, P.; Mlody, B.; Prigione, A. Mitochondria and the dynamic control of stem cell homeostasis. EMBO Rep. 2018, 19, e45432. [Google Scholar] [CrossRef]
- Gatie, M.I.; Kelly, G.M. Metabolic profile and differentiation potential of extraembryonic endoderm-like cells. Cell Death Discov. 2018, 4, 42. [Google Scholar] [CrossRef] [PubMed]
- Shin, B.; Benavides, G.A.; Geng, J.; Koralov, S.B.; Hu, H.; Darley-Usmar, V.M.; Harrington, L.E. Mitochondrial oxidative phosphorylation regulates the fate decision between pathogenic Th17 and regulatory T cells. Cell Rep. 2020, 30, 1898–1909.e1894. [Google Scholar] [CrossRef]
- Chan, D.C. Mitochondrial dynamics and its involvement in disease. Annu. Rev. Pathol. 2020, 15, 235–259. [Google Scholar] [CrossRef] [PubMed]
- Wai, T.; Langer, T. Mitochondrial dynamics and metabolic regulation. Trends Endocrinol. Metab. 2016, 27, 105–117. [Google Scholar] [CrossRef] [PubMed]
- Agnello, M.; Morici, G.; Rinaldi, A.M. A method for measuring mitochondrial mass and activity. Cytotechnology 2008, 56, 145–149. [Google Scholar] [CrossRef]
- Ganetzky, R.; Stojinski, C. Mitochondrial short-chain Enoyl-CoA hydratase 1 deficiency. In GeneReviews(®); Adam, M.P., Ardinger, H.H., Pagon, R.A., Wallace, S.E., Bean, L.J.H., Mirzaa, G., Amemiya, A., Eds.; University of Washington: Seattle, WA, USA, 1993. [Google Scholar]
- Kaczocha, M.; Vivieca, S.; Sun, J.; Glaser, S.T.; Deutsch, D.G. Fatty acid-binding proteins transport N-acylethanolamines to nuclear receptors and are targets of endocannabinoid transport inhibitors. J. Biol. Chem. 2012, 287, 3415–3424. [Google Scholar] [CrossRef] [PubMed]
- Mitchell, R.W.; On, N.H.; Del Bigio, M.R.; Miller, D.W.; Hatch, G.M. Fatty acid transport protein expression in human brain and potential role in fatty acid transport across human brain microvessel endothelial cells. J. Neurochem. 2011, 117, 735–746. [Google Scholar] [CrossRef] [PubMed]
- Penkov, S.; Kaptan, D.; Erkut, C.; Sarov, M.; Mende, F.; Kurzchalia, T.V. Integration of carbohydrate metabolism and redox state controls dauer larva formation in Caenorhabditis elegans. Nat. Commun. 2015, 6, 8060. [Google Scholar] [CrossRef]
- Mohamed Haroon, M.; Lakshmanan, V.; Sarkar, S.R.; Lei, K.; Vemula, P.K.; Palakodeti, D. Mitochondrial state determines functionally divergent stem cell population in planaria. Stem Cell Rep. 2021, 16, 1302–1316. [Google Scholar] [CrossRef]
- Wend, P.; Fang, L.; Zhu, Q.; Schipper, J.H.; Loddenkemper, C.; Kosel, F.; Brinkmann, V.; Eckert, K.; Hindersin, S.; Holland, J.D.; et al. Wnt/β-catenin signalling induces MLL to create epigenetic changes in salivary gland tumours. Embo J. 2013, 32, 1977–1989. [Google Scholar] [CrossRef]
- Lukaszewicz, A.I.; Nguyen, C.; Melendez, E.; Lin, D.P.; Teo, J.L.; Lai, K.K.Y.; Huttner, W.B.; Shi, S.H.; Kahn, M. The mode of stem cell division is dependent on the differential interaction of β-Catenin with the Kat3 coactivators CBP or p300. Cancers 2019, 11, 962. [Google Scholar] [CrossRef]
- Hnisz, D.; Abraham, B.J.; Lee, T.I.; Lau, A.; Saint-André, V.; Sigova, A.A.; Hoke, H.A.; Young, R.A. Super-enhancers in the control of cell identity and disease. Cell 2013, 155, 934–947. [Google Scholar] [CrossRef]
- Rada-Iglesias, A.; Bajpai, R.; Swigut, T.; Brugmann, S.A.; Flynn, R.A.; Wysocka, J. A unique chromatin signature uncovers early developmental enhancers in humans. Nature 2011, 470, 279–283. [Google Scholar] [CrossRef]
- Calo, E.; Wysocka, J. Modification of enhancer chromatin: What, how, and why? Mol. Cell 2013, 49, 825–837. [Google Scholar] [CrossRef]
- Sen, P.; Lan, Y.; Li, C.Y.; Sidoli, S.; Donahue, G.; Dou, Z.; Frederick, B.; Chen, Q.; Luense, L.J.; Garcia, B.A.; et al. Histone acetyltransferase p300 induces de novo super-enhancers to drive cellular senescence. Mol. Cell 2019, 73, 684–698.e688. [Google Scholar] [CrossRef] [PubMed]
- Vahedi, G.; Kanno, Y.; Furumoto, Y.; Jiang, K.; Parker, S.C.; Erdos, M.R.; Davis, S.R.; Roychoudhuri, R.; Restifo, N.P.; Gadina, M.; et al. Super-enhancers delineate disease-associated regulatory nodes in T cells. Nature 2015, 520, 558–562. [Google Scholar] [CrossRef]
- Kasper, L.H.; Qu, C.; Obenauer, J.C.; McGoldrick, D.J.; Brindle, P.K. Genome-wide and single-cell analyses reveal a context dependent relationship between CBP recruitment and gene expression. Nucleic Acids Res. 2014, 42, 11363–11382. [Google Scholar] [CrossRef] [PubMed]
- Moreno-Fernandez, M.E.; Giles, D.A.; Oates, J.R.; Chan, C.C.; Damen, M.; Doll, J.R.; Stankiewicz, T.E.; Chen, X.; Chetal, K.; Karns, R.; et al. PKM2-dependent metabolic skewing of hepatic Th17 cells regulates pathogenesis of non-alcoholic fatty liver disease. Cell Metab. 2021, 33, 1187–1204.e1189. [Google Scholar] [CrossRef] [PubMed]
- Cascone, T.; McKenzie, J.A.; Mbofung, R.M.; Punt, S.; Wang, Z.; Xu, C.; Williams, L.J.; Wang, Z.; Bristow, C.A.; Carugo, A.; et al. Increased tumor glycolysis characterizes immune resistance to adoptive T cell therapy. Cell Metab. 2018, 27, 977–987.e974. [Google Scholar] [CrossRef]
- Ring, A.; Kaur, P.; Lang, J.E. EP300 knockdown reduces cancer stem cell phenotype, tumor growth and metastasis in triple negative breast cancer. BMC Cancer 2020, 20, 1076. [Google Scholar] [CrossRef]
- Davis, R.T.; Blake, K.; Ma, D.; Gabra, M.B.I.; Hernandez, G.A.; Phung, A.T.; Yang, Y.; Maurer, D.; Lefebvre, A.; Alshetaiwi, H.; et al. Transcriptional diversity and bioenergetic shift in human breast cancer metastasis revealed by single-cell RNA sequencing. Nat. Cell Biol. 2020, 22, 310–320. [Google Scholar] [CrossRef]
- Bergers, G.; Fendt, S.M. The metabolism of cancer cells during metastasis. Nat. Rev. Cancer 2021, 21, 162–180. [Google Scholar] [CrossRef]
- Zhao, Y.; Wu, K.; Wu, Y.; Melendez, E.; Smbatyan, G.; Massiello, D.; Kahn, M. Characterization of imatinib resistant CML leukemic stem/initiating cells and their sensitivity to CBP/catenin antagonists. Curr. Mol. Pharmacol. 2018, 11, 113–121. [Google Scholar] [CrossRef]
- Zhao, Y.; Masiello, D.; McMillian, M.; Nguyen, C.; Wu, Y.; Melendez, E.; Smbatyan, G.; Kida, A.; He, Y.; Teo, J.L.; et al. CBP/catenin antagonist safely eliminates drug-resistant leukemia-initiating cells. Oncogene 2016, 35, 3705–3717. [Google Scholar] [CrossRef] [PubMed]
- Salazar-Roa, M.; Malumbres, M. Fueling the cell division cycle. Trends Cell Biol. 2017, 27, 69–81. [Google Scholar] [CrossRef]
- Wang, Z.; Fan, M.; Candas, D.; Zhang, T.Q.; Qin, L.; Eldridge, A.; Wachsmann-Hogiu, S.; Ahmed, K.M.; Chromy, B.A.; Nantajit, D.; et al. Cyclin B1/Cdk1 coordinates mitochondrial respiration for cell-cycle G2/M progression. Dev. Cell 2014, 29, 217–232. [Google Scholar] [CrossRef] [PubMed]
- Acebron, S.P.; Karaulanov, E.; Berger, B.S.; Huang, Y.L.; Niehrs, C. Mitotic wnt signaling promotes protein stabilization and regulates cell size. Mol. Cell 2014, 54, 663–674. [Google Scholar] [CrossRef] [PubMed]
- Huang, Y.L.; Anvarian, Z.; Döderlein, G.; Acebron, S.P.; Niehrs, C. Maternal Wnt/STOP signaling promotes cell division during early Xenopus embryogenesis. Proc. Natl. Acad. Sci. USA 2015, 112, 5732–5737. [Google Scholar] [CrossRef]
- Ertych, N.; Stolz, A.; Stenzinger, A.; Weichert, W.; Kaulfuß, S.; Burfeind, P.; Aigner, A.; Wordeman, L.; Bastians, H. Increased microtubule assembly rates influence chromosomal instability in colorectal cancer cells. Nat. Cell Biol. 2014, 16, 779–791. [Google Scholar] [CrossRef] [PubMed]
- Kim, H.; Vick, P.; Hedtke, J.; Ploper, D.; De Robertis, E.M. Wnt signaling translocates Lys48-linked polyubiquitinated proteins to the lysosomal pathway. Cell Rep. 2015, 11, 1151–1159. [Google Scholar] [CrossRef] [PubMed][Green Version]
- Da Silva, F.; Zhang, K.; Pinson, A.; Fatti, E.; Wilsch-Bräuninger, M.; Herbst, J.; Vidal, V.; Schedl, A.; Huttner, W.B.; Niehrs, C. Mitotic WNT signalling orchestrates neurogenesis in the developing neocortex. EMBO J. 2021, 40, e108041. [Google Scholar] [CrossRef]
- Lai, K.K.Y.; Nguyen, C.; Lee, K.S.; Lee, A.; Lin, D.P.; Teo, J.L.; Kahn, M. Convergence of canonical and non-canonical Wnt signal: Differential Kat3 coactivator usage. Curr. Mol Pharmacol. 2019, 12, 167. [Google Scholar] [CrossRef] [PubMed]
- MacNee, W.; Rabinovich, R.A.; Choudhury, G. Ageing and the border between health and disease. Eur. Respir. J. 2014, 44, 1332–1352. [Google Scholar] [CrossRef] [PubMed]
- Sharpless, N.E.; DePinho, R.A. How stem cells age and why this makes us grow old. Nat. Rev. Mol. Cell Biol. 2007, 8, 703–713. [Google Scholar] [CrossRef] [PubMed]
- Miki, T.; Yasuda, S.Y.; Kahn, M. Wnt/β-catenin signaling in embryonic stem cell self-renewal and somatic cell reprogramming. Stem Cell Rev. Rep. 2011, 7, 836–846. [Google Scholar] [CrossRef]
- Tomasetti, C.; Vogelstein, B. Cancer etiology. Variation in cancer risk among tissues can be explained by the number of stem cell divisions. Science 2015, 347, 78–81. [Google Scholar] [CrossRef]
- Lesnefsky, E.J.; Hoppel, C.L. Oxidative phosphorylation and aging. Ageing Res. Rev. 2006, 5, 402–433. [Google Scholar] [CrossRef] [PubMed]
- Sebastián, D.; Palacín, M.; Zorzano, A. Mitochondrial dynamics: Coupling mitochondrial fitness with healthy aging. Trends Mol. Med. 2017, 23, 201–215. [Google Scholar] [CrossRef]


Publisher’s Note: MDPI stays neutral with regard to jurisdictional claims in published maps and institutional affiliations. |
© 2021 by the authors. Licensee MDPI, Basel, Switzerland. This article is an open access article distributed under the terms and conditions of the Creative Commons Attribution (CC BY) license (https://creativecommons.org/licenses/by/4.0/).
Share and Cite
Hu, X.; Ono, M.; Chimge, N.-O.; Chosa, K.; Nguyen, C.; Melendez, E.; Lou, C.-H.; Lim, P.; Termini, J.; Lai, K.K.Y.; et al. Differential Kat3 Usage Orchestrates the Integration of Cellular Metabolism with Differentiation. Cancers 2021, 13, 5884. https://doi.org/10.3390/cancers13235884
Hu X, Ono M, Chimge N-O, Chosa K, Nguyen C, Melendez E, Lou C-H, Lim P, Termini J, Lai KKY, et al. Differential Kat3 Usage Orchestrates the Integration of Cellular Metabolism with Differentiation. Cancers. 2021; 13(23):5884. https://doi.org/10.3390/cancers13235884
Chicago/Turabian StyleHu, Xiaohui, Masaya Ono, Nyam-Osor Chimge, Keisuke Chosa, Cu Nguyen, Elizabeth Melendez, Chih-Hong Lou, Punnajit Lim, John Termini, Keane K. Y. Lai, and et al. 2021. "Differential Kat3 Usage Orchestrates the Integration of Cellular Metabolism with Differentiation" Cancers 13, no. 23: 5884. https://doi.org/10.3390/cancers13235884
APA StyleHu, X., Ono, M., Chimge, N.-O., Chosa, K., Nguyen, C., Melendez, E., Lou, C.-H., Lim, P., Termini, J., Lai, K. K. Y., Fueger, P. T., Teo, J.-L., Higuchi, Y., & Kahn, M. (2021). Differential Kat3 Usage Orchestrates the Integration of Cellular Metabolism with Differentiation. Cancers, 13(23), 5884. https://doi.org/10.3390/cancers13235884