
Relationship between Tumor Mutational Burden, PD-L1, Patient Characteristics, and Response to Immune Checkpoint Inhibitors in Head and Neck Squamous Cell Carcinoma


 , , ,
, , ,
Abstract
:Simple Summary
Abstract
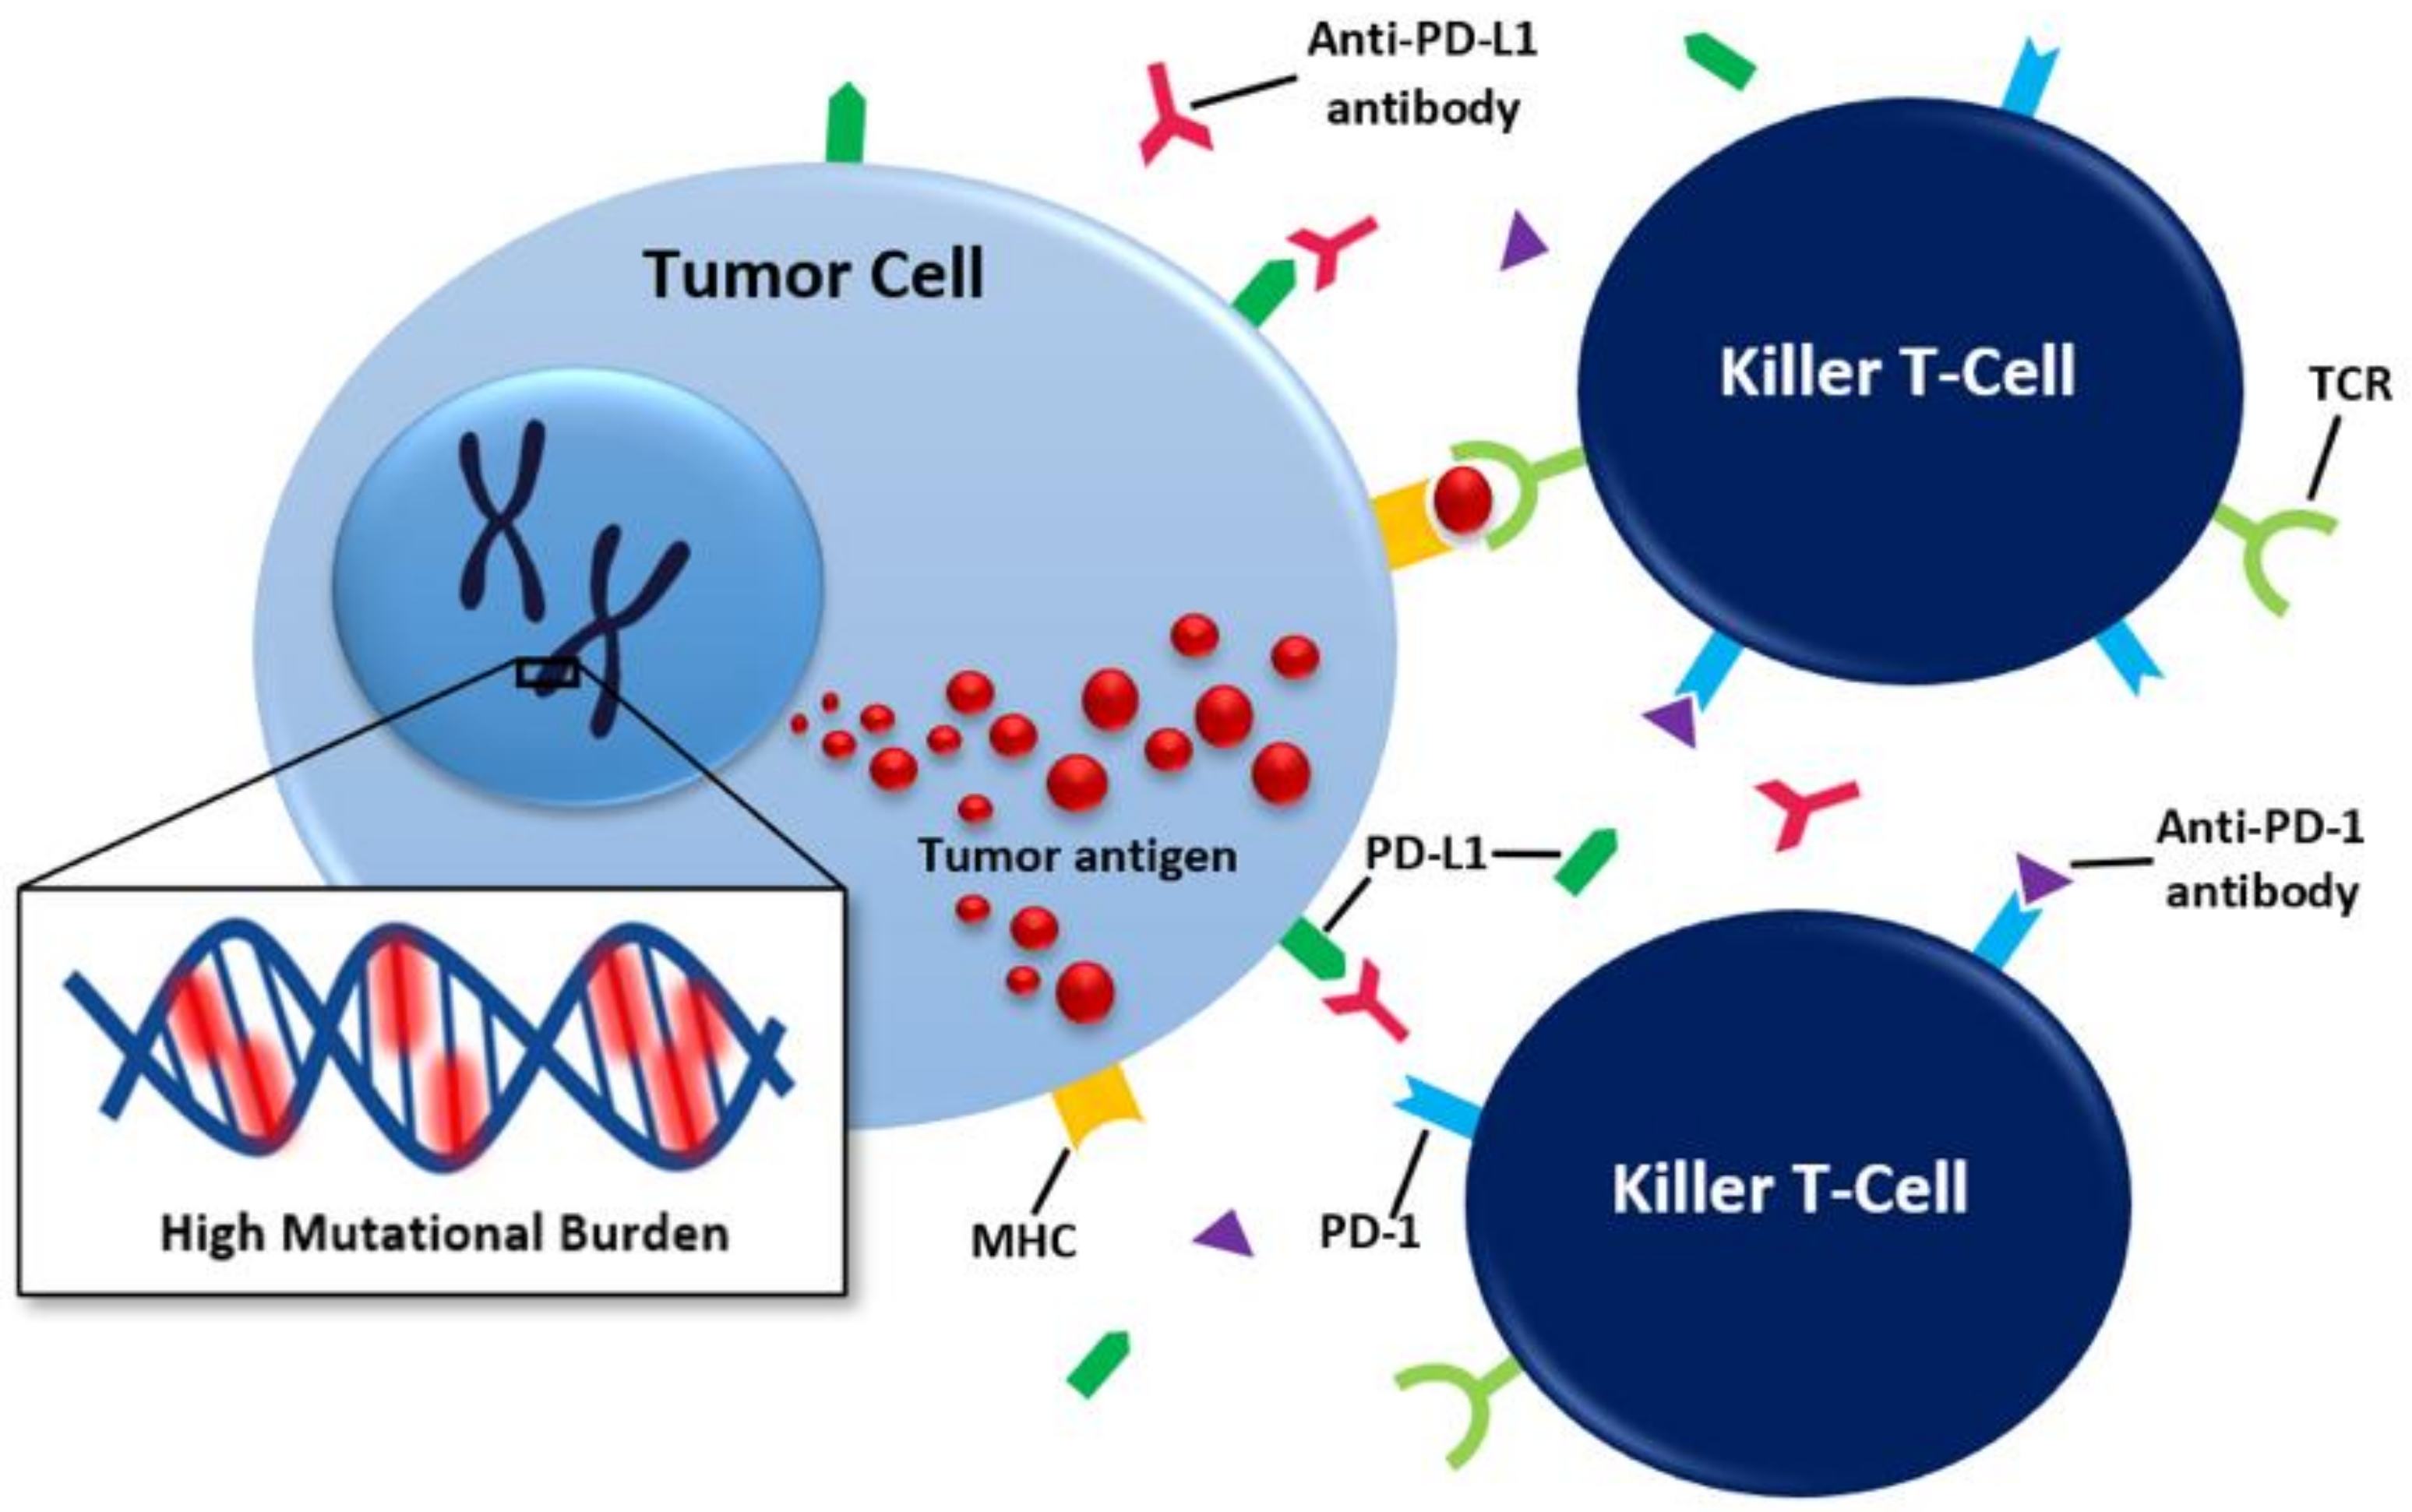
1. Introduction
2. Materials and Methods
Statistical Analysis
3. Results
3.1. Patient Characteristics
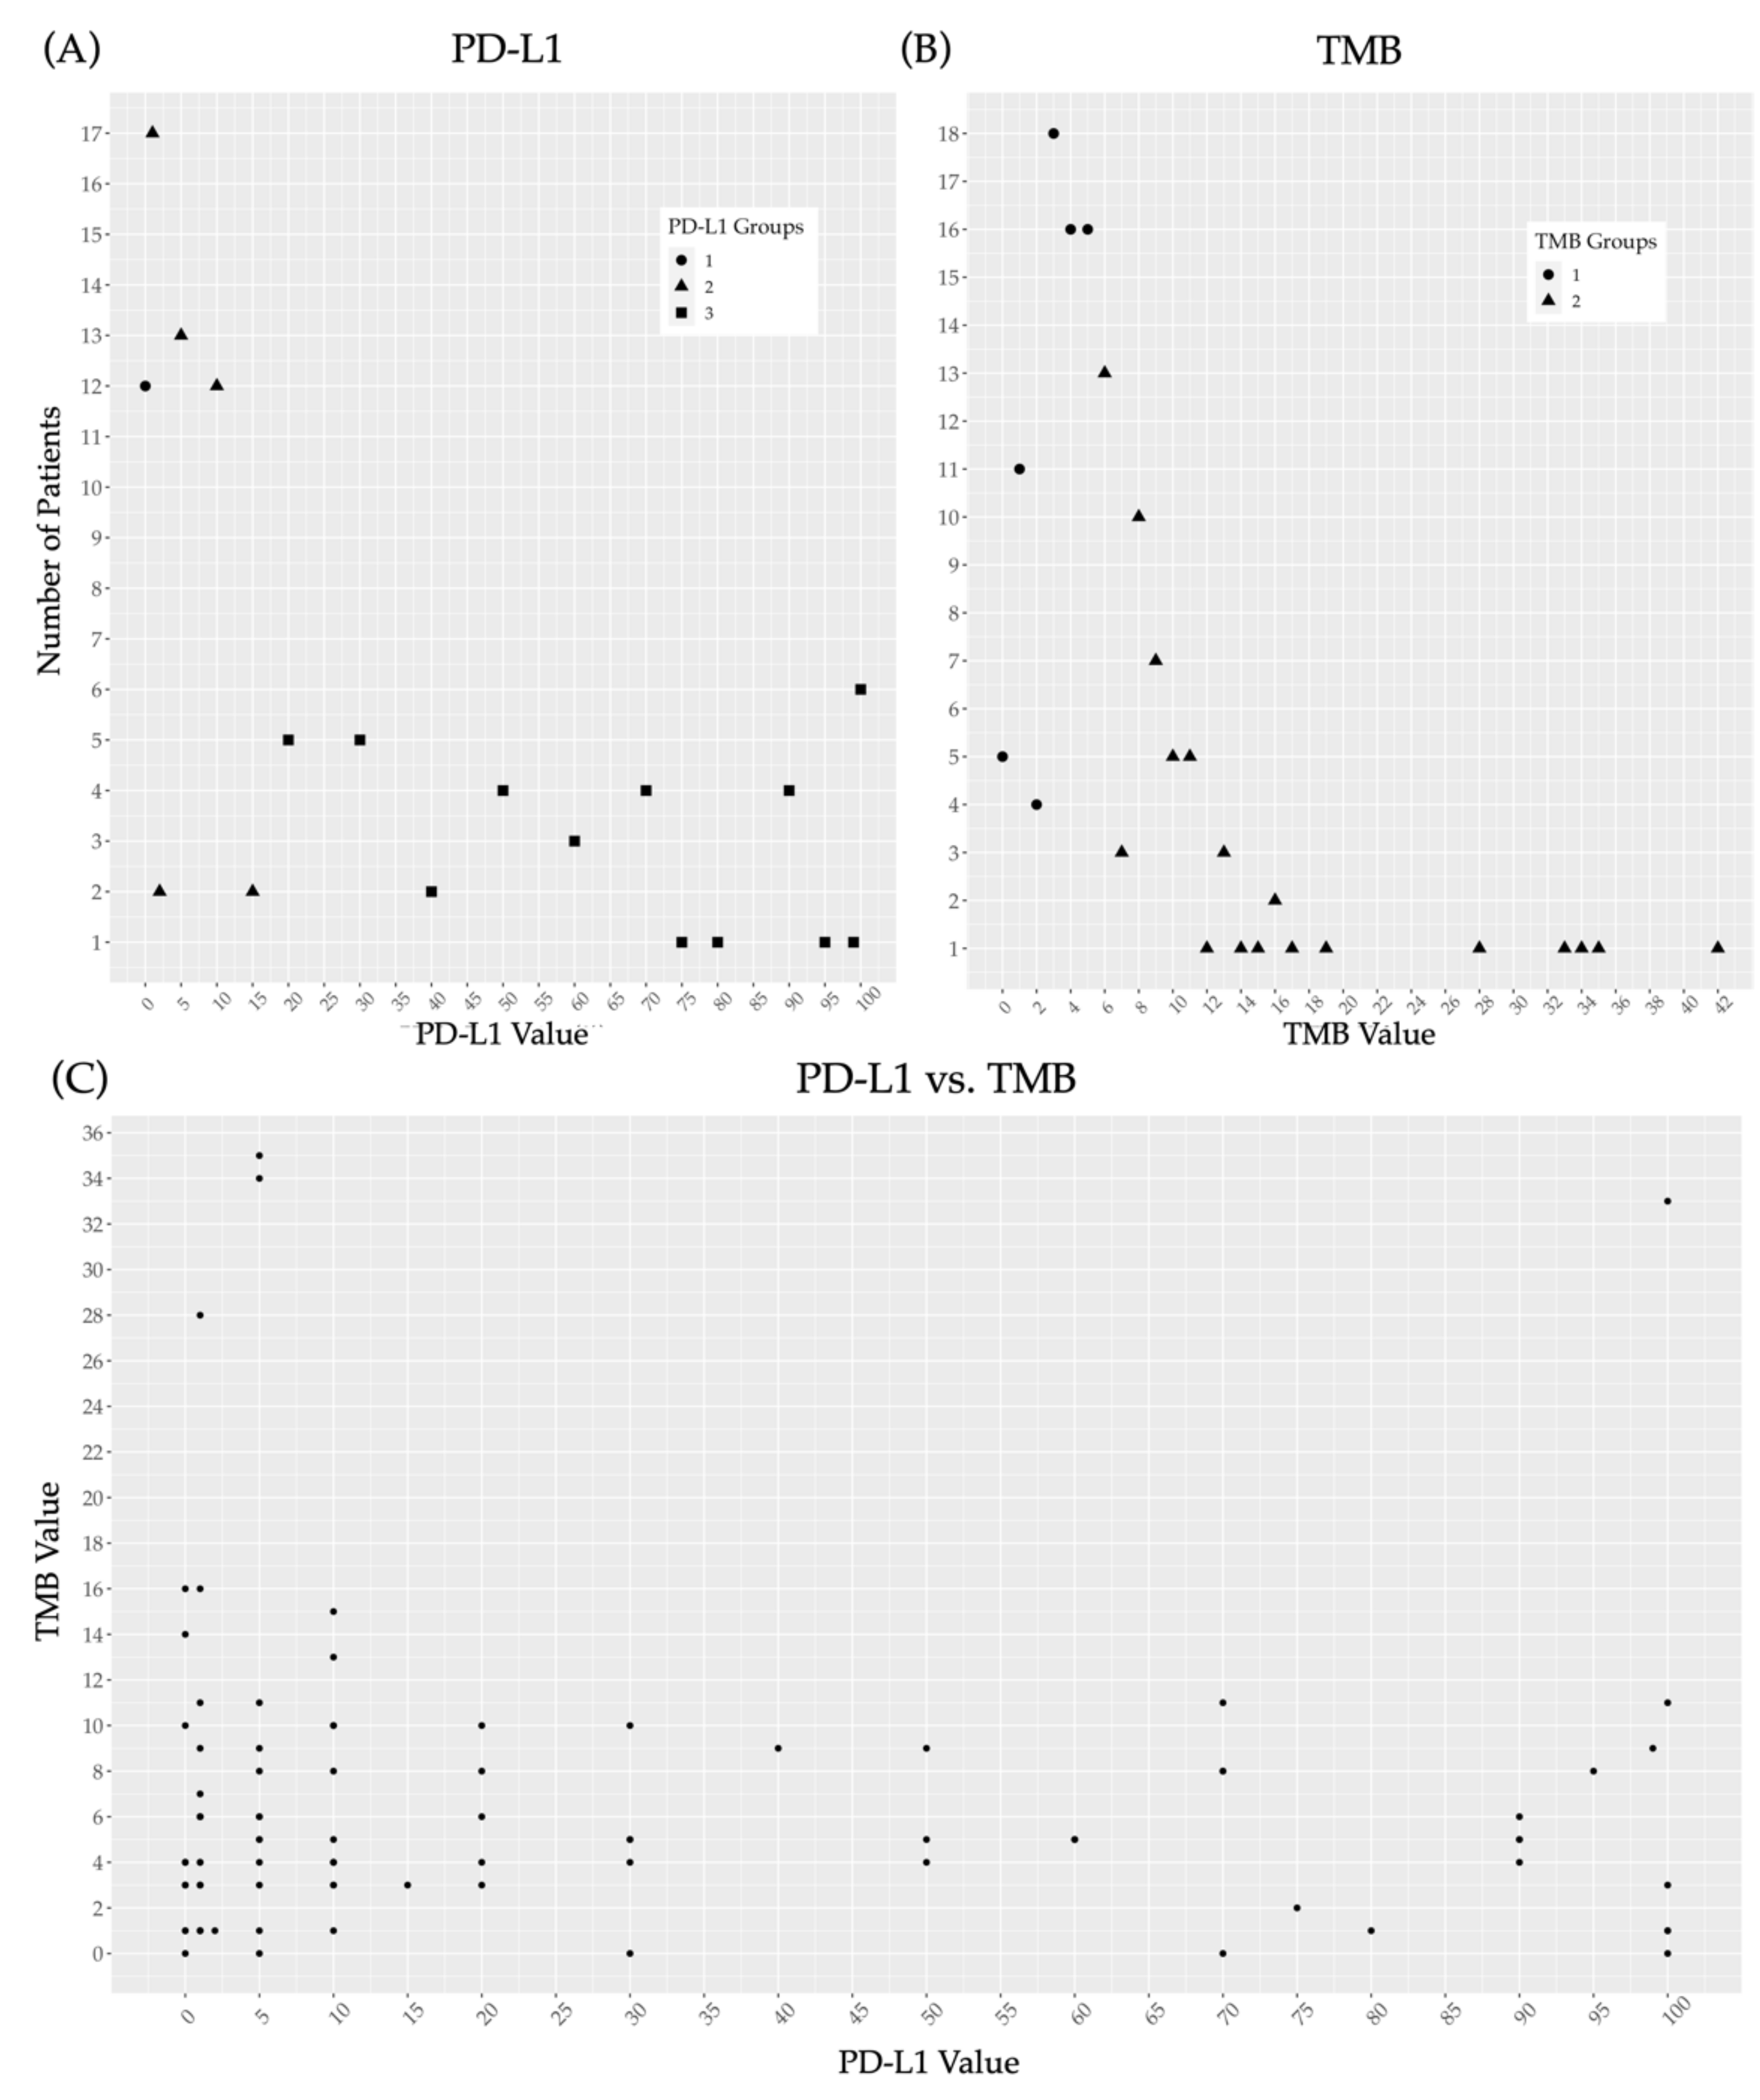
3.2. Prevalence of PD-L1 and TMB within the Study Population and Correlation between the Two Variables
3.3. Correlation between PD-L1 Expression and Patient Characteristics
3.4. Correlation between TMB and Patient Characteristics
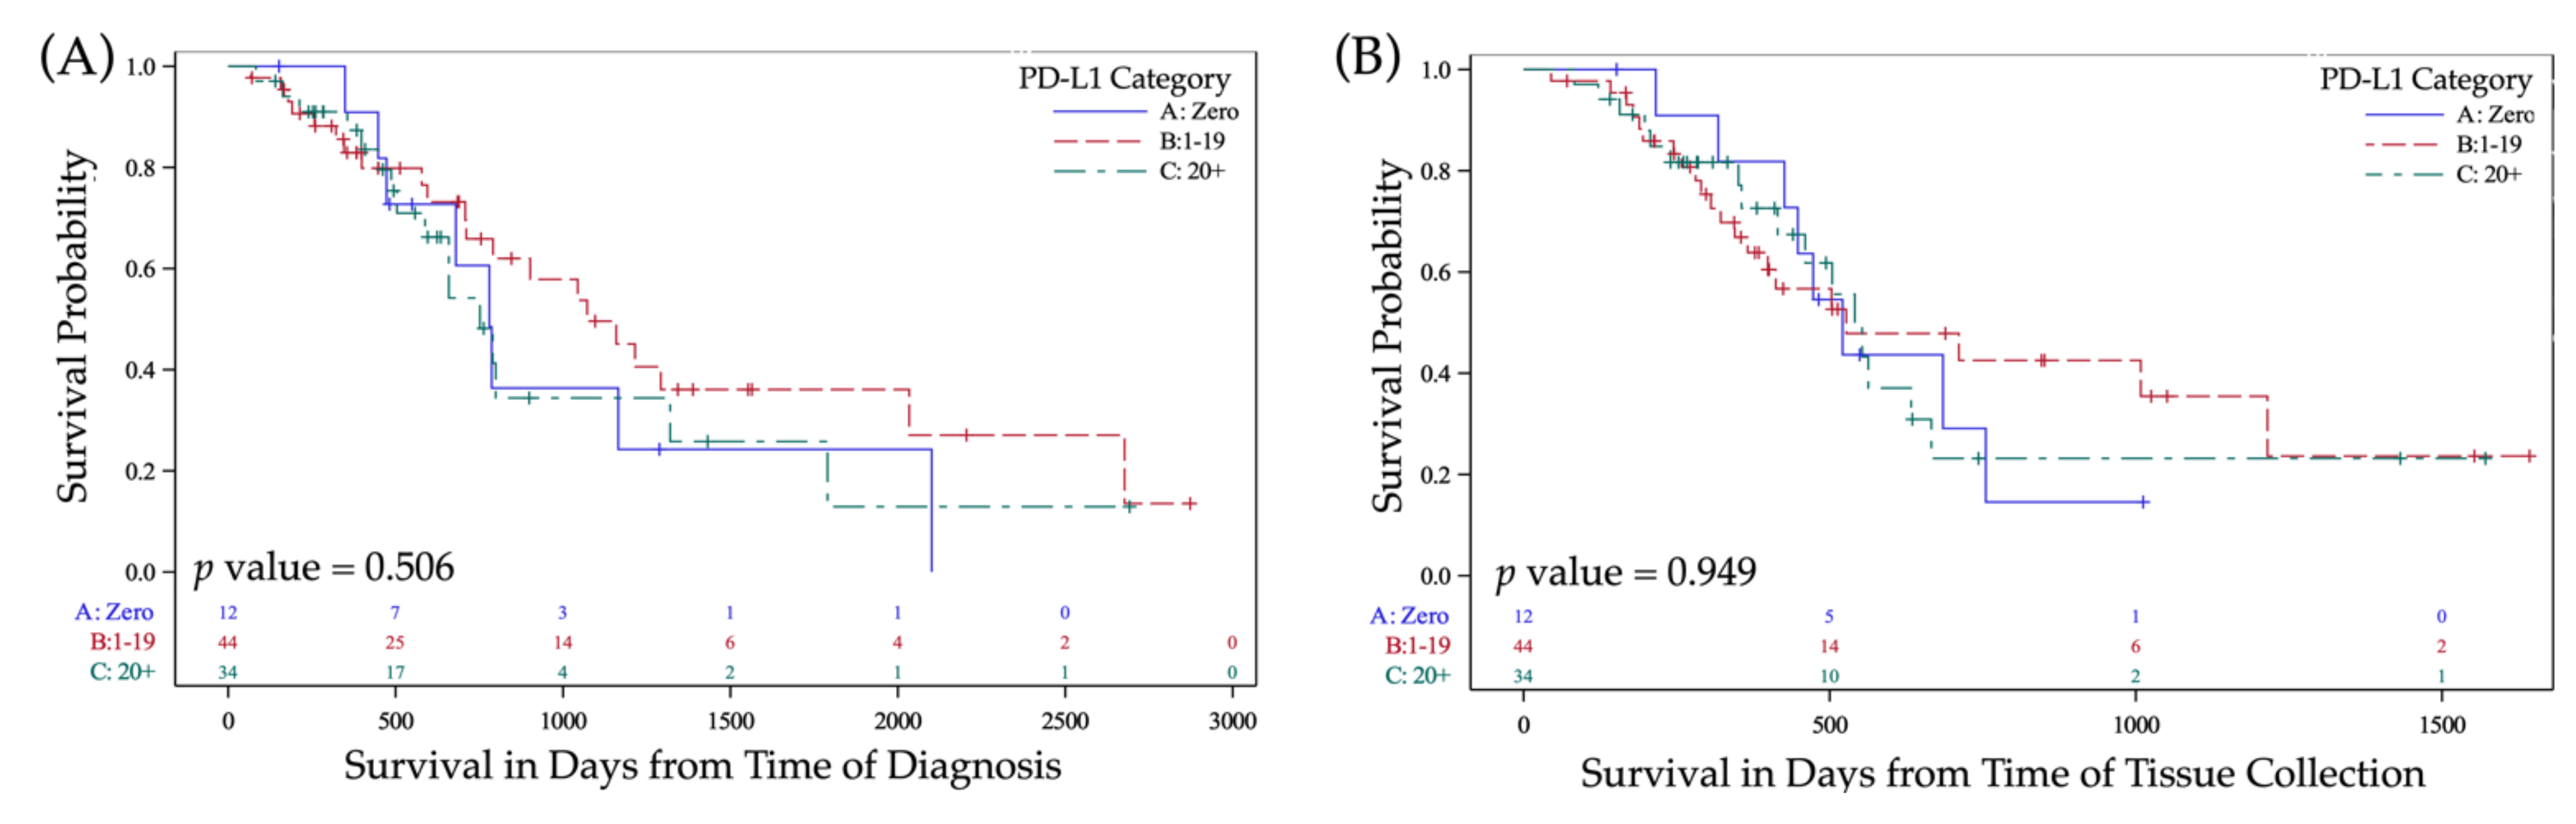
3.5. Prognostic Value of PD-L1 Expression
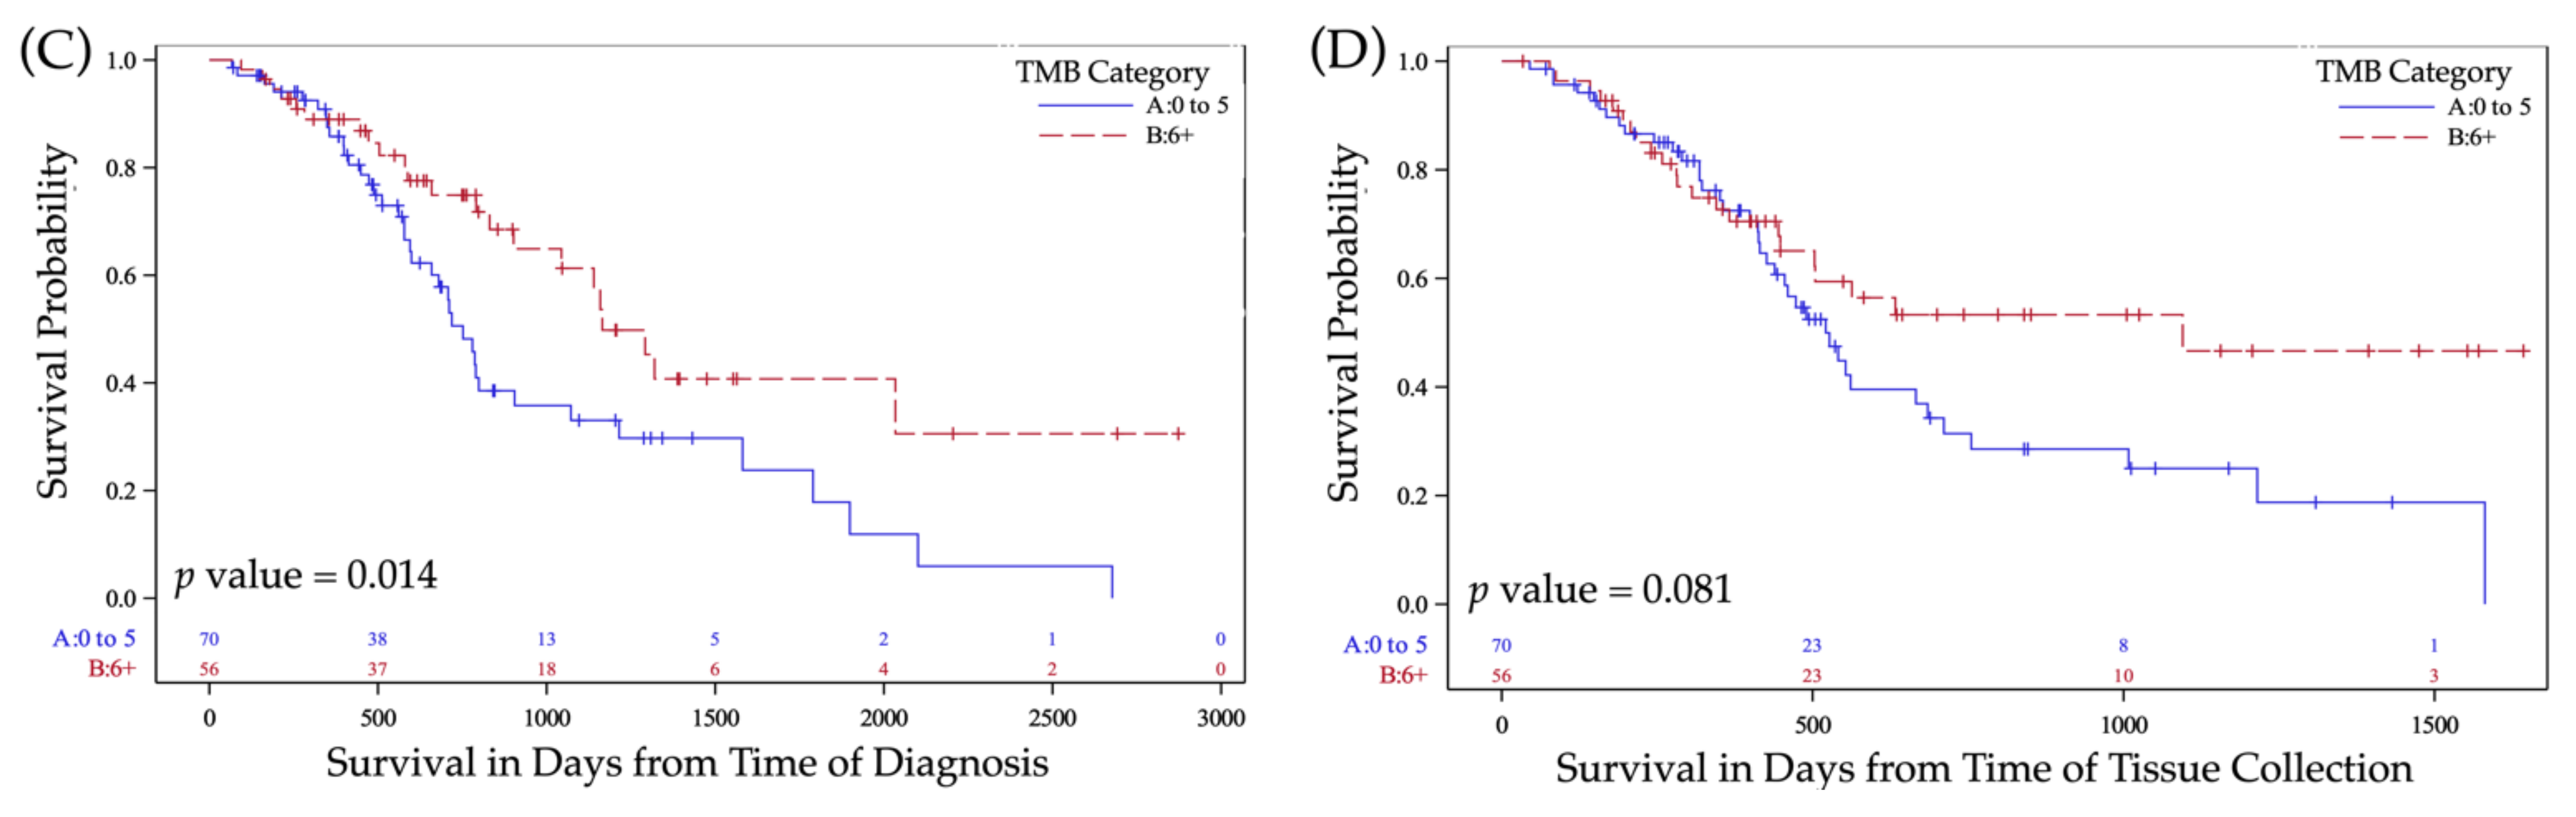
3.6. Prognostic Value of TMB
3.7. Treatment with PD-L1/PD-1 Inhibitors and Correlation with PD-L1 and TMB
4. Discussion
Future Directions
5. Conclusions
Supplementary Materials
Author Contributions
Funding
Institutional Review Board Statement
Informed Consent Statement
Data Availability Statement
Conflicts of Interest
References
- Ferris, R.L. Immunology and immunotherapy of head and neck cancer. J. Clin. Oncol. 2015, 33, 3293. [Google Scholar] [CrossRef]
- Mandal, R.; Şenbabaoğlu, Y.; Desrichard, A.; Havel, J.J.; Dalin, M.G.; Riaz, N.; Lee, K.-W.; Ganly, I.; Hakimi, A.A.; Chan, T.A.; et al. The head and neck cancer immune landscape and its immunotherapeutic implications. JCI Insight 2016, 1, e89829. [Google Scholar] [CrossRef] [PubMed] [Green Version]
- Perri, F.; Ionna, F.; Longo, F.; Scarpati, G.D.V.; De Angelis, C.; Ottaiano, A.; Botti, G.; Caponigro, F. Immune response against head and neck cancer: Biological mechanisms and implication on therapy. Transl. Oncol. 2020, 13, 262–274. [Google Scholar] [CrossRef]
- Seiwert, T.Y.; Burtness, B.; Mehra, R.; Weiss, J.; Berger, R.; Eder, J.P.; Heath, K.; McClanahan, T.; Lunceford, J.; Gause, C. Safety and clinical activity of pembrolizumab for treatment of recurrent or metastatic squamous cell carcinoma of the head and neck (KEYNOTE-012): An open-label, multicentre, phase 1b trial. Lancet Oncol. 2016, 17, 956–965. [Google Scholar] [CrossRef]
- Ferris, R.L.; Blumenschein Jr, G.; Fayette, J.; Guigay, J.; Colevas, A.D.; Licitra, L.; Harrington, K.; Kasper, S.; Vokes, E.E.; Even, C. Nivolumab for recurrent squamous-cell carcinoma of the head and neck. N. Engl. J. Med. 2016, 375, 1856–1867. [Google Scholar] [CrossRef]
- Chow, L.Q.M.; Haddad, R.; Gupta, S.; Mahipal, A.; Mehra, R.; Tahara, M.; Berger, R.; Eder, J.P.; Burtness, B.; Lee, S.-H. Antitumor activity of pembrolizumab in biomarker-unselected patients with recurrent and/or metastatic head and neck squamous cell carcinoma: Results from the phase Ib KEYNOTE-012 expansion cohort. J. Clin. Oncol. 2016, 34, 3838. [Google Scholar] [CrossRef] [PubMed]
- Soulieres, D.; Cohen, E.; Le Tourneau, C.; Dinis, J.; Licitra, L.; Ahn, M.-J.; Soria, A.; Machiels, J.-P.; Mach, N.; Mehra, R. Abstract CT115: Updated survival results of the KEYNOTE-040 study of pembrolizumab vs standard-of-care chemotherapy for recurrent or metastatic head and neck squamous cell carcinoma 2018. In Proceedings of the AACR Annual Meeting 2018, Chicago, IL, USA, 14–18 April 2018. [Google Scholar]
- Larkins, E.; Blumenthal, G.M.; Yuan, W.; He, K.; Sridhara, R.; Subramaniam, S.; Zhao, H.; Liu, C.; Yu, J.; Goldberg, K.B. FDA approval summary: Pembrolizumab for the treatment of recurrent or metastatic head and neck squamous cell carcinoma with disease progression on or after platinum-containing chemotherapy. Oncologist 2017, 22, 873. [Google Scholar] [CrossRef] [Green Version]
- Oliva, M.; Spreafico, A.; Taberna, M.; Alemany, L.; Coburn, B.; Mesia, R.; Siu, L.L. Immune biomarkers of response to immune-checkpoint inhibitors in head and neck squamous cell carcinoma. Ann. Oncol. 2019, 30, 57–67. [Google Scholar] [CrossRef]
- Bauml, J.; Seiwert, T.Y.; Pfister, D.G. Pembrolizumab for platinum- and cetuximab-refractory head and neck cancer: Results from a single-arm, phase II study. J. Clin. Oncol. 2017, 35, 1542–1549. [Google Scholar] [CrossRef]
- Le, X.; Ferrarotto, R.; Wise-Draper, T.; Gillison, M. Evolving Role of Immunotherapy in Recurrent Metastatic Head and Neck Cancer. J. Natl. Compr. Cancer Netw. 2020, 18, 899–906. [Google Scholar] [CrossRef]
- Ulrich, B.C.; Guibert, N. Non-invasive assessment of tumor PD-L1 status with circulating tumor cells. Ann. Transl. Med. 2018, 6, S48. [Google Scholar] [CrossRef] [PubMed]
- Campesato, L.F.; Barroso-Sousa, R.; Jimenez, L.; Correa, B.R.; Sabbaga, J.; Hoff, P.M.; Reis, L.F.L.; Galante, P.A.F.; Camargo, A.A. Comprehensive cancer-gene panels can be used to estimate mutational load and predict clinical benefit to PD-1 blockade in clinical practice. Oncotarget 2015, 6, 34221. [Google Scholar] [CrossRef] [Green Version]
- Johnson, D.B.; Frampton, G.M.; Rioth, M.J.; Yusko, E.; Xu, Y.; Guo, X.; Ennis, R.C.; Fabrizio, D.; Chalmers, Z.R.; Greenbowe, J. Targeted next generation sequencing identifies markers of response to PD-1 blockade. Cancer Immunol. Res. 2016, 4, 959–967. [Google Scholar] [CrossRef] [Green Version]
- George, T.J.; Frampton, G.M.; Sun, J.; Gowen, K.; Kennedy, M.; Greenbowe, J.R.; Schrock, A.B.; Ali, S.M.; Klempner, S.J.; Hezel, A.F. Tumor mutational burden as a potential biomarker for PD1/PD-L1 therapy in colorectal cancer. J. Clin. Oncol. 2016, 34, 3587. [Google Scholar] [CrossRef]
- Alexandrov, L.B.; Nik-Zainal, S.; Wedge, D.C.; Aparicio, S.A.J.R.; Behjati, S.; Biankin, A.V.; Bignell, G.R.; Bolli, N.; Borg, A.; Børresen-Dale, A.-L. Signatures of mutational processes in human cancer. Nature 2013, 500, 415–421. [Google Scholar] [CrossRef] [PubMed] [Green Version]
- Kowanetz, M.; Zou, W.; Shames, D.S.; Cummings, C.; Rizvi, N.; Spira, A.I.; Frampton, G.M.; Leveque, V.; Flynn, S.; Mocci, S. Tumor mutation load assessed by FoundationOne (FM1) is associated with improved efficacy of atezolizumab (atezo) in patients with advanced NSCLC. Ann. Oncol. 2016, 27, vi23. [Google Scholar] [CrossRef]
- Rosenberg, J.E.; Hoffman-Censits, J.; Powles, T.; Van Der Heijden, M.S.; Balar, A.V.; Necchi, A.; Dawson, N.; O’Donnell, P.H.; Balmanoukian, A.; Loriot, Y. Atezolizumab in patients with locally advanced and metastatic urothelial carcinoma who have progressed following treatment with platinum-based chemotherapy: A single-arm, multicentre, phase 2 trial. Lancet 2016, 387, 1909–1920. [Google Scholar] [CrossRef] [Green Version]
- Rosenberg, J.E.; Petrylak, D.P.; Van Der Heijden, M.S.; Necchi, A.; O’Donnell, P.H.; Loriot, Y.; Retz, M.; Perez-Gracia, J.L.; Bellmunt, J.; Grivas, P. PD-L1 expression, Cancer Genome Atlas (TCGA) subtype, and mutational load as independent predictors of response to atezolizumab (atezo) in metastatic urothelial carcinoma (mUC.; IMvigor210). J. Clin. Oncol. 2016, 34, 104. [Google Scholar] [CrossRef]
- Hellmann, M.D.; Ciuleanu, T.-E.; Pluzanski, A.; Lee, J.S.; Otterson, G.A.; Audigier-Valette, C.; Minenza, E.; Linardou, H.; Burgers, S.; Salman, P. Nivolumab plus ipilimumab in lung cancer with a high tumor mutational burden. N. Engl. J. Med. 2018, 378, 2093–2104. [Google Scholar] [CrossRef]
- Legrand, F.A.; Gandara, D.R.; Mariathasan, S.; Powles, T.; He, X.; Zhang, W.; Jhunjhunwala, S.; Nickles, D.; Bourgon, R.; Schleifman, E.; et al. Association of High Tissue TMB and Atezolizumab Efficacy across Multiple Tumor Types. J. Clin. Oncol. 2018, 36, 12000. [Google Scholar] [CrossRef]
- Snyder, A.; Makarov, V.; Merghoub, T.; Yuan, J.; Zaretsky, J.M.; Desrichard, A.; Walsh, L.A.; Postow, M.A.; Wong, P.; Ho, T.S. Genetic basis for clinical response to CTLA-4 blockade in melanoma. N. Engl. J. Med. 2014, 371, 2189–2199. [Google Scholar] [CrossRef] [PubMed] [Green Version]
- Rizvi, N.A.; Hellmann, M.D.; Snyder, A.; Kvistborg, P.; Makarov, V.; Havel, J.J.; Lee, W.; Yuan, J.; Wong, P.; Ho, T.S. Mutational landscape determines sensitivity to PD-1 blockade in non–small cell lung cancer. Science 2015, 348, 124–128. [Google Scholar] [CrossRef] [Green Version]
- Cristescu, R.; Mogg, R.; Ayers, M.; Albright, A.; Murphy, E.; Yearley, J.; Sher, X.; Liu, X.Q.; Lu, H.; Nebozhyn, M.; et al. Pan-tumor genomic biomarkers for PD-1 checkpoint blockade–based immunotherapy. Science 2018, 362, eaar3593. [Google Scholar] [CrossRef] [PubMed] [Green Version]
- McGrail, D.J.; Pilié, P.G.; Rashid, N.U.; Voorwerk, L.; Slagter, M.; Kok, M.; Jonasch, E.; Khasraw, M.; Heimberger, A.B.; Lim, B.; et al. High tumor mutation burden fails to predict immune checkpoint blockade response across all cancer types. Ann. Oncol. 2021, 32, 661–672. [Google Scholar] [CrossRef] [PubMed]
- Goodman, A.M.; Kato, S.; Bazhenova, L.; Patel, S.P.; Frampton, G.M.; Miller, V.; Stephens, P.J.; Daniels, G.A.; Kurzrock, R. Tumor mutational burden as an independent predictor of response to immunotherapy in diverse cancers. Mol. Cancer Ther. 2017, 16, 2598–2608. [Google Scholar] [CrossRef] [PubMed] [Green Version]
- Seiwert, T.Y.; Haddad, R.; Bauml, J.; Weiss, J.; Pfister, D.G.; Gupta, S.; Mehra, R.; Gluck, I.; Kang, H.; Worden, F.; et al. Abstract LB-339: Biomarkers predictive of response to pembrolizumab in head and neck cancer (HNSCC). Cancer Res. 2018, 78, LB-339. [Google Scholar] [CrossRef]
- Hanna, G.J.; Lizotte, P.; Cavanaugh, M.; Kuo, F.C.; Shivdasani, P.; Frieden, A.; Chau, N.G.; Schoenfeld, J.D.; Lorch, J.H.; Uppaluri, R. Frameshift events predict anti–PD-1/L1 response in head and neck cancer. JCI Insight 2018, 3, e98811. [Google Scholar] [CrossRef] [Green Version]
- Haddad, R.I.; Seiwert, T.Y.; Chow, L.Q.M.; Gupta, S.; Weiss, J.; Gluck, I.; Eder, J.P.; Burtness, B.; Tahara, M.; Keam, B.; et al. Genomic Determinants of Response to Pembrolizumab in Head and Neck Squamous Cell Carcinoma (HNSCC). J. Clin. Oncol. 2017, 35, 6009. [Google Scholar] [CrossRef]
- Li, W.; Wildsmith, S.; Ye, J.; Si, H.; Morsli, N.; He, P.; Shetty, J.; Yovine, A.J.; Holoweckyj, N.; Raja, R. Plasma-based tumor mutational burden (bTMB) as predictor for survival in phase III EAGLE study: Durvalumab (D)± tremelimumab (T) versus chemotherapy (CT) in recurrent/metastatic head and neck squamous cell carcinoma (R/M HNSCC) after platinum failure. J. Clin. Oncol. 2020, 38, 6511. [Google Scholar] [CrossRef]
- Wang, Z.; Duan, J.; Cai, S.; Han, M.; Dong, H.; Zhao, J.; Zhu, B.; Wang, S.; Zhuo, M.; Sun, J.; et al. Assessment of Blood Tumor Mutational Burden as a Potential Biomarker for Immunotherapy in Patients with Non–Small Cell Lung Cancer with Use of a Next-Generation Sequencing Cancer Gene Panel. JAMA Oncol. 2019, 5, 696–702. [Google Scholar] [CrossRef]
- Burtness, B.; Harrington, K.J.; Greil, R.; Soulières, D.; Tahara, M.; de Castro, G., Jr.; Psyrri, A.; Basté, N.; Neupane, P.; Bratland, Å. Pembrolizumab alone or with chemotherapy versus cetuximab with chemotherapy for recurrent or metastatic squamous cell carcinoma of the head and neck (KEYNOTE-048): A randomised, open-label, phase 3 study. Lancet 2019, 394, 1915–1928. [Google Scholar] [CrossRef]
- Chalmers, Z.R.; Connelly, C.F.; Fabrizio, D.; Gay, L.; Ali, S.M.; Ennis, R.; Schrock, A.; Campbell, B.; Shlien, A.; Chmielecki, J. Analysis of 100,000 human cancer genomes reveals the landscape of tumor mutational burden. Genome Med. 2017, 9, 34. [Google Scholar] [CrossRef]
- Kumar, G.; South, A.P.; Curry, J.M.; Linnenbach, A.; Harshyne, L.A.; Ertel, A.; Fortina, P.; Luginbuhl, A. Multimodal genomic markers predict immunotherapy response in the head and neck squamous cell carcinoma. bioRxiv 2021. [Google Scholar] [CrossRef]
- Zhang, Y.; Lin, A.; Li, Y.; Ding, W.; Meng, H.; Luo, P.; Zhang, J. Age and mutations as predictors of the response to immunotherapy in head and neck squamous cell cancer. Front. Cell Dev. Biol. 2020, 8, 608969. [Google Scholar] [CrossRef]
- Lenouvel, D.; González-Moles, M.Á.; Ruiz-Ávila, I.; Gonzalez-Ruiz, L.; Gonzalez-Ruiz, I.; Ramos-García, P. Prognostic and clinicopathological significance of PD-L1 overexpression in oral squamous cell carcinoma: A systematic review and comprehensive meta-analysis. Oral. Oncol. 2020, 106, 104722. [Google Scholar] [CrossRef] [PubMed]
- Lin, Y.-M.; Sung, W.-W.; Hsieh, M.-J.; Tsai, S.-C.; Lai, H.-W.; Yang, S.-M.; Shen, K.-H.; Chen, M.-K.; Lee, H.; Yeh, K.-T. High PD-L1 expression correlates with metastasis and poor prognosis in oral squamous cell carcinoma. PLoS ONE 2015, 10, e0142656. [Google Scholar] [CrossRef] [Green Version]
- Kim, H.S.; Lee, J.Y.; Lim, S.H.; Park, K.; Sun, J.-M.; Ko, Y.H.; Baek, C.-H.; Son, Y.; Jeong, H.S.; Ahn, Y.C.; et al. Association Between PD-L1 and HPV Status and the Prognostic Value of PD-L1 in Oropharyngeal Squamous Cell Carcinoma. Cancer Res. Treat. 2016, 48, 527–536. [Google Scholar] [CrossRef] [PubMed] [Green Version]
- Lenouvel, D.; González-Moles, M.Á.; Ruiz-Ávila, I.; Chamorro-Santos, C.; González-Ruiz, L.; González-Ruiz, I.; Ramos-García, P. Clinicopathological and prognostic significance of PD-L1 in oral cancer: A preliminary retrospective immunohistochemistry study. Oral. Dis. 2021, 27, 173–182. [Google Scholar] [CrossRef]
- Balermpas, P.; Rödel, F.; Krause, M.; Linge, A.; Lohaus, F.; Baumann, M.; Tinhofer, I.; Budach, V.; Sak, A.; Stuschke, M. The PD-1/PD-L1 axis and human papilloma virus in patients with head and neck cancer after adjuvant chemoradiotherapy: A multicentre study of the German Cancer Consortium Radiation Oncology Group (DKTK-ROG). Int. J. Cancer 2017, 141, 594–603. [Google Scholar] [CrossRef] [PubMed]
- Steuer, C.E.; Griffith, C.C.; Nannapaneni, S.; Patel, M.R.; Liu, Y.; Magliocca, K.R.; El-Deiry, M.W.; Cohen, C.; Owonikoko, T.K.; Shin, D.M. A correlative analysis of PD-L1, PD-1, PD-L2, EGFR, HER2, and HER3 expression in oropharyngeal squamous cell carcinoma. Mol. Cancer Ther. 2018, 17, 710–716. [Google Scholar] [CrossRef] [Green Version]
- Zhang, L.; Li, B.; Peng, Y.; Wu, F.; Li, Q.; Lin, Z.; Xie, S.; Xiao, L.; Lin, X.; Ou, Z.; et al. The prognostic value of TMB and the relationship between TMB and immune infiltration in head and neck squamous cell carcinoma: A gene expression-based study. Oral. Oncol. 2020, 110, 104943. [Google Scholar] [CrossRef]
- Cortellini, A.; Bersanelli, M.; Buti, S.; Cannita, K.; Santini, D.; Perrone, F.; Giusti, R.; Tiseo, M.; Michiara, M.; Di Marino, P.; et al. A multicenter study of body mass index in cancer patients treated with anti-PD-1/PD-L1 immune checkpoint inhibitors: When overweight becomes favorable. J. Immunother. Cancer 2019, 7, 57. [Google Scholar] [CrossRef]
- Cui, J.; Wang, D.; Nie, D.; Liu, W.; Sun, M.; Pei, F.; Han, F. Difference in tumor mutation burden between squamous cell carcinoma in the oral cavity and larynx. Oral. Oncol. 2021, 114, 105142. [Google Scholar] [CrossRef]
- Maruse, Y.; Kawano, S.; Jinno, T.; Matsubara, R.; Goto, Y.; Kaneko, N.; Sakamoto, T.; Hashiguchi, Y.; Moriyama, M.; Toyoshima, T. Significant association of increased PD-L1 and PD-1 expression with nodal metastasis and a poor prognosis in oral squamous cell carcinoma. Int. J. Oral. Maxillofac. Surg. 2018, 47, 836–845. [Google Scholar] [CrossRef] [PubMed] [Green Version]
- Yang, W.; Wong, M.C.M.; Thomson, P.J.; Li, K.-Y.; Su, Y. The prognostic role of PD-L1 expression for survival in head and neck squamous cell carcinoma: A systematic review and meta-analysis. Oral. Oncol. 2018, 86, 81–90. [Google Scholar] [CrossRef] [PubMed]
- Chen, S.-W.; Li, S.-H.; Shi, D.-B.; Jiang, W.-M.; Song, M.; Yang, A.-K.; Li, Y.-D.; Bei, J.-X.; Chen, W.-K.; Zhang, Q. Expression of PD-1/PD-L1 in head and neck squamous cell carcinoma and its clinical significance. Int. J. Biol. Markers 2019, 34, 398–405. [Google Scholar] [CrossRef] [PubMed] [Green Version]
- Müller, T.; Braun, M.; Dietrich, D.; Aktekin, S.; Höft, S.; Kristiansen, G.; Göke, F.; Schröck, A.; Brägelmann, J.; Held, S.A.E. PD-L1: A novel prognostic biomarker in head and neck squamous cell carcinoma. Oncotarget 2017, 8, 52889. [Google Scholar] [CrossRef] [Green Version]
- Hanna, G.J.; Woo, S.-B.; Li, Y.Y.; Barletta, J.A.; Hammerman, P.S.; Lorch, J.H. Tumor PD-L1 expression is associated with improved survival and lower recurrence risk in young women with oral cavity squamous cell carcinoma. Int. J. Oral. Maxillofac. Surg. 2018, 47, 568–577. [Google Scholar] [CrossRef]
- Moreira, A.; Poulet, A.; Masliah-Planchon, J.; Lecerf, C.; Vacher, S.; Chérif, L.L.; Dupain, C.; Marret, G.; Girard, E.; Syx, L. Prognostic value of tumor mutational burden in patients with oral cavity squamous cell carcinoma treated with upfront surgery. ESMO Open 2021, 6, 100178. [Google Scholar] [CrossRef] [PubMed]
- Eder, T.; Hess, A.K.; Konschak, R.; Stromberger, C.; Jöhrens, K.; Fleischer, V.; Hummel, M.; Balermpas, P.; Von Der Grün, J.; Linge, A. Interference of tumour mutational burden with outcome of patients with head and neck cancer treated with definitive chemoradiation: A multicentre retrospective study of the German Cancer Consortium Radiation Oncology Group. Eur. J. Cancer 2019, 116, 67–76. [Google Scholar] [CrossRef] [PubMed]
- Mehra, R.; Seiwert, T.Y.; Gupta, S.; Weiss, J.; Gluck, I.; Eder, J.P.; Burtness, B.; Tahara, M.; Keam, B.; Kang, H.; et al. Efficacy and safety of pembrolizumab in recurrent/metastatic head and neck squamous cell carcinoma: Pooled analyses after long-term follow-up in KEYNOTE-012. Br. J. Cancer 2018, 119, 153–159. [Google Scholar] [CrossRef] [PubMed]
- Cohen, E.E.W.; Soulières, D.; Le Tourneau, C.; Dinis, J.; Licitra, L.; Ahn, M.-J.; Soria, A.; Machiels, J.-P.; Mach, N.; Mehra, R. Pembrolizumab versus methotrexate, docetaxel, or cetuximab for recurrent or metastatic head-and-neck squamous cell carcinoma (KEYNOTE-040): A randomised, open-label, phase 3 study. Lancet 2019, 393, 156–167. [Google Scholar] [CrossRef]

| Characteristics | TMB Patients | PD-L1 Patients | Characteristics | TMB Patients | PD-L1 Patients |
|---|---|---|---|---|---|
| No. (%) | No. (%) | No. (%) | No. (%) | ||
| Age at Diagnosis (Years) | Primary Tumor Location | ||||
| Median | 60 | 61 | Nasopharynx | 8 (6.2) | 7 (7.4) |
| ≥60 | 64 (50) | 50 (52.6) | Oropharynx | 50 (39.1) | 37 (38.9) |
| <60 | 64 (50) | 45 (47.4) | Oral Cavity | 33 (25.8) | 23 (24.2) |
| Hypopharynx | 7 (5.5) | 5 (5.3) | |||
| Gender | Larynx | 22 (17.2) | 16 (16.8) | ||
| Male | 89 (69.5) | 68 (71.6) | Sino-Nasal | 5 (3.9) | 4 (4.2) |
| Female | 39 (30.4) | 27 (28.4) | Unknown | 3 (2.3) | 3 (3.2) |
| Race | Disease Stage at Time of Diagnosis | ||||
| Caucasian | 108 (84.4) | 79 (83.2) | |||
| African American | 13 (10.2) | 13 (13.7) | |||
| Other | 7 (5.4) | 3 (3.1) | Cancer Stage | ||
| I | 19 (14.8) | 17 (17.9) | |||
| ETOH Status | II | 21 (16.4) | 18 (18.9) | ||
| Never | 63 (49.2) | 46 (48.4) | III | 29 (22.7) | 15 (15.8) |
| Former | 28 (21.9) | 22 (23.2) | IV | 59 (46.1) | 45 (47.4) |
| Active | 37 (28.9 | 27 (28.4) | |||
| Cancer Stage IV | |||||
| Smoking Status | IVA | 39 (66.1) | 29 (64.4) | ||
| Never | 37 (28.9) | 29 (30.5) | IVB | 14 (23.7) | 11 (24.4) |
| Former | 39 (30.5) | 30 (31.6) | IVC | 6 (10.2) | 5 (11.2) |
| Active | 52 (40.6) | 36 (37.9) | |||
| N Stage | |||||
| HPV and/or p16 | N0 | 37 (28.9) | 27 (28.4) | ||
| Negative | 56 (43.8) | 43 (45.3) | N1 | 29 (22.7) | 20 (21.1) |
| Positive | 40 (31.2) | 29 (30.5) | N2 | 49 (38.3) | 37 (38.9) |
| Not Tested | 32 (25) | 23 (24.2) | N3 | 13 (10.1) | 11 (11.6) |
| BMI | Tissue | ||||
| Source | |||||
| <18.5 | 19 (14.7) | 11 (11.9) | Primary Tumor | 83 (65.4) | 55 (60.4) |
| 18.5–24.9 | 42 (32.6) | 33 (35.9) | Regional Node | 11 (8.7) | 10 (11.0) |
| 25–29.9 | 39 (30.2) | 30 (32.6) | Metastatic Lesion | 11 (8.7) | 9 (9.9) |
| ≥30 | 29 (22.5) | 18 (19.6) | Recurrence | 22 (17.3) | 17 (18.7) |
| Variable | 3tPD-L1 Analysis | TMB Analysis | ||||||
|---|---|---|---|---|---|---|---|---|
| No. (Row %) | p | No. (Row %) | p | |||||
| ≥20 | 1–19 | 0 | ≥6 | <6 | ||||
| Age | <60 | 14 (31.1) | 25 (55.6) | 6 (13.3) | 0.240 | 31 (48.4) | 33 (51.6) | 0.478 |
| ≥60 | 23 (46.0) | 21 (42.0) | 6 (12.0) | 27 (42.2) | 37 (57.8) | |||
| Gender | Male | 24 (35.3) | 35 (51.5) | 9 (13.2) | 0.510 | 37 (41.6) | 52 (58.4) | 0.199 |
| Female | 13 (48.1) | 11 (40.7) | 3 (11.1) | 21 (53.8) | 18 (46.2) | |||
| Race | Caucasian | 28 (35.4) | 41 (51.9) | 10 (12.7) | 0.046 | 52 (48.1) | 56 (51.9) | 0.087 |
| AA | 9 (69.2) | 2 (15.4) | 2 (15.4) | 3 (23.1) | 10 (76.9) | |||
| HPV | + | 11 (38.0) | 18 (62.1) | 0 (0.0) | 0.354 | 16 (40.0) | 24 (60.0) | 0.804 |
| − | 18 (41.9) | 17 (39.5) | 8 (18.6) | 21 (37.5) | 35 (62.5) | |||
| Smoking History | Current | 12 (33.3) | 17 (47.2) | 7 (19.4) | 0.044 | 31 (59.6) | 21 (40.4) | 0.029 |
| Former | 10 (33.3) | 16 (53.3) | 4 (13.3) | 13 (33.3) | 26 (66.7) | |||
| Never | 15 (51.7) | 13 (44.8) | 1 (3.4) | 14 (37.8) | 23 (62.2) | |||
| Alcohol History | Current | 7 (25.9) | 15 (55.6) | 5 (18.5) | 0.012 | 18 (48.6) | 19 (51.4) | 0.326 |
| Former | 6 (27.3) | 12 (54.5) | 4 (18.2) | 15 (53.6) | 13 (46.4) | |||
| Never | 24 (52.2) | 19 (41.3) | 3 (6.5) | 25 (39.7) | 38 (60.3) | |||
| BMI | ≥30 | 10 (55.5) | 7 (38.9) | 1 (5.6) | 0.072 | 9 (31.0) | 20 (69.0) | 0.071 |
| <30 | 25 (33.8) | 37 (50.0) | 12 (16.2) | 50 (50.0) | 50 (50.0) | |||
| Previous CRT | + | 15 (41.7) | 16 (44.4) | 5 (13.9) | 0.868 | 23 (51.1) | 22 (48.9) | 0.331 |
| − | 22 (37.3) | 30 (50.8) | 7 (11.9) | 35 (42.2) | 48 (57.8) | |||
| Primary Tumor Location | OC | 10 (43.5) | 11 (47.8) | 2 (8.7) | 0.400 | 16 (48.5) | 17 (51.5) | 0.685 |
| Other | 21 (36.2) | 28 (48.3) | 9 (15.5) | 35 (44.3) | 44 (55.7) | |||
| Laryngeal | 6 (37.5) | 8 (50) | 2 (12.5) | 0.984 | 16 (72.7) | 6 (27.3) | 0.004 | |
| OTT | 25 (38.5) | 31 (47.7) | 9 (13.8) | 35 (38.9) | 55 (61.1) | |||
| OP | 15 (40.5) | 16 (43.2) | 6 (16.2) | 0.965 | 15 (30.0) | 35 (70.0) | 0.003 | |
| Other | 16 (36.4) | 23 (52.3) | 5 (11.4) | 36 (58.1) | 26 (41.9) | |||
| Stage at Diagnosis | I | 10 (58.8) | 7 (41.2) | 0 (0.0) | 0.035 | 7 (36.8) | 12 (63.2) | 0.522 |
| II | 7 (38.9) | 11 (61.1) | 0 (0.0) | 11 (52.4) | 10 (45.5) | |||
| III | 4 (26.7) | 6 (40.0) | 5 (33.3) | 11 (37.9) | 18 (62.1) | |||
| IV | 16 (35.6) | 22 (48.9) | 7 (15.6) | 29 (49.2) | 30 (50.8) | |||
| IVA | 5 (71.4) | 2 (28.6) | 0 (0.0) | 0.802 | 22 (56.4) | 17 (43.6) | 0.146 | |
| IVB | 13 (59.1) | 6 (27.3) | 3 (13.6) | 5 (35.7) | 9 (64.3) | |||
| IVC | 11 (68.8) | 3 (18.8) | 2 (12.5) | 2 (33.3) | 4 (66.7) | |||
| T0–2 | 20 (46.5) | 23 (53.5) | 0 (0.0) | 0.008 | 23 (42.6) | 31 (57.4) | 0.864 | |
| T3–4 | 17 (54.8) | 2 (6.5) | 12 (38.7) | 39 (52.7) | 35 (47.3) | |||
| N0 | 11 (40.7) | 10 (37.0) | 6 (19.4) | 0.949 | 17 (45.9) | 20 (54.1) | 0.751 | |
| N1 | 9 (45.0) | 11 (55.0) | 0 (0.0) | 11 (37.9) | 18 (62.1) | |||
| N2 | 13 (35.1) | 20 (54.0) | 4 (10.8) | 24 (49.0) | 25 (51.0) | |||
| N3 | 4 (36.3) | 5 (45.5) | 2 (18.2) | 6 (46.2) | 7 (53.8) | |||
| M0 | 34 (38.2) | 43 (48.3) | 12 (13.5) | 0.372 | 54 (45.0) | 66 (55.0) | 0.784 | |
| M1 | 3 (50.0) | 3 (50.0) | 0 (0.0) | 4 (50.0) | 4 (50.0) | |||
| Survival Start Time Point | Overall Survival Univariate Analysis for Highest Scores | Overall Survival Adjusted Analysis for Highest Scorers | 1 Year OS | 2 Year OS | ||||
|---|---|---|---|---|---|---|---|---|
| HR | 95% CI | p value | HR | 95% CI | p value | p values | ||
| 2tPD-L1 | ||||||||
| From Time of Diagnosis | 1.28 | 0.72–2.27 | 0.473 | 2.02 | (1.06–3.86) | 0.033 | 0.951 | 0.320 |
| From Time of Sample Collection | 1.05 | 0.57–1.97 | 0.888 | |||||
| 3tPD-L1 | ||||||||
| From Time of Diagnosis | 0.97 | 0.42–2.22 | 0.938 | 1.28 | (0.46–3.61) | 0.092 | 0.522 | 0.386 |
| From Time of Sample Collection | 0.95 | 0.41–2.24 | 0.949 | |||||
| TMB | ||||||||
| From Time of Diagnosis | 0.51 | 0.30–0.86 | 0.081 | 0.49 | (0.27–0.90) | 0.021 | 0.950 | 0.121 |
| From Time of Sample Collection | 0.63 | 0.37–1.06 | 0.014 | |||||
| 3tPD-L1 | TMB | TMB and 2tPD-L1 | ||||||||||
|---|---|---|---|---|---|---|---|---|---|---|---|---|
| HR | 95% CI | p | HR | 95% CI | p | PD-L1 HR | PD-L1 95% CI | PD-L1 p | TMB HR | TMB 95% CI | TMB p | |
| Highest Scoring Groups | 1.28 | (0.46–3.61) | 0.092 | 0.49 | (0.27–0.90) | 0.021 | 1.99 | (1.0–3.97) | 0.051 | 0.35 | (0.16–0.76) | 0.008 |
| p values for Adjusted Variables | p values for Adjusted Variables | p values for Adjusted Variables | ||||||||||
| Age Below 60 Years Old (yes vs. no) | 0.52 | 0.508 | 0.656 | |||||||||
| Smoking (never vs. ever) | 0.016 | 0.058 | 0.005 | |||||||||
| N Stage (N0, N1, N2, N3) | 0.003 | 0.709 | 0.007 | |||||||||
| Subsite (OP vs. OC vs Pharynx vs. other) | 0.338 | 0.126 | 0.518 | |||||||||
| Previous CRT (yes vs. no) | 0.027 | 0.0209 | 0.182 | |||||||||
Publisher’s Note: MDPI stays neutral with regard to jurisdictional claims in published maps and institutional affiliations. |
© 2021 by the authors. Licensee MDPI, Basel, Switzerland. This article is an open access article distributed under the terms and conditions of the Creative Commons Attribution (CC BY) license (https://creativecommons.org/licenses/by/4.0/).
Share and Cite
Burcher, K.M.; Lantz, J.W.; Gavrila, E.; Abreu, A.; Burcher, J.T.; Faucheux, A.T.; Xie, A.; Jackson, C.; Song, A.H.; Hughes, R.T.; et al. Relationship between Tumor Mutational Burden, PD-L1, Patient Characteristics, and Response to Immune Checkpoint Inhibitors in Head and Neck Squamous Cell Carcinoma. Cancers 2021, 13, 5733. https://doi.org/10.3390/cancers13225733
Burcher KM, Lantz JW, Gavrila E, Abreu A, Burcher JT, Faucheux AT, Xie A, Jackson C, Song AH, Hughes RT, et al. Relationship between Tumor Mutational Burden, PD-L1, Patient Characteristics, and Response to Immune Checkpoint Inhibitors in Head and Neck Squamous Cell Carcinoma. Cancers. 2021; 13(22):5733. https://doi.org/10.3390/cancers13225733
Chicago/Turabian StyleBurcher, Kimberly M., Jeffrey W. Lantz, Elena Gavrila, Arianne Abreu, Jack T. Burcher, Andrew T. Faucheux, Amy Xie, Clayton Jackson, Alexander H. Song, Ryan T. Hughes, and et al. 2021. "Relationship between Tumor Mutational Burden, PD-L1, Patient Characteristics, and Response to Immune Checkpoint Inhibitors in Head and Neck Squamous Cell Carcinoma" Cancers 13, no. 22: 5733. https://doi.org/10.3390/cancers13225733
APA StyleBurcher, K. M., Lantz, J. W., Gavrila, E., Abreu, A., Burcher, J. T., Faucheux, A. T., Xie, A., Jackson, C., Song, A. H., Hughes, R. T., Lycan, T., Jr., Bunch, P. M., Furdui, C. M., Topaloglu, U., D’Agostino, R. B., Jr., Zhang, W., & Porosnicu, M. (2021). Relationship between Tumor Mutational Burden, PD-L1, Patient Characteristics, and Response to Immune Checkpoint Inhibitors in Head and Neck Squamous Cell Carcinoma. Cancers, 13(22), 5733. https://doi.org/10.3390/cancers13225733