
Cyclin E1 in Murine and Human Liver Cancer: A Promising Target for Therapeutic Intervention during Tumour Progression

 , , , ,
  ,
,
Abstract
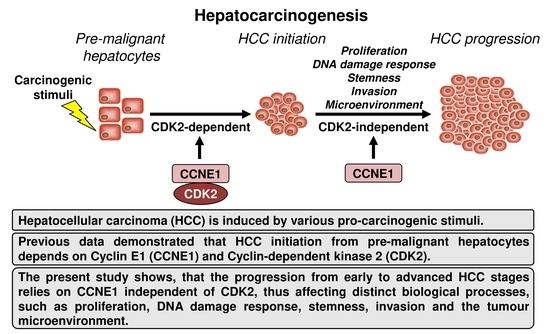
:Simple Summary
Abstract
1. Introduction
2. Materials and Methods
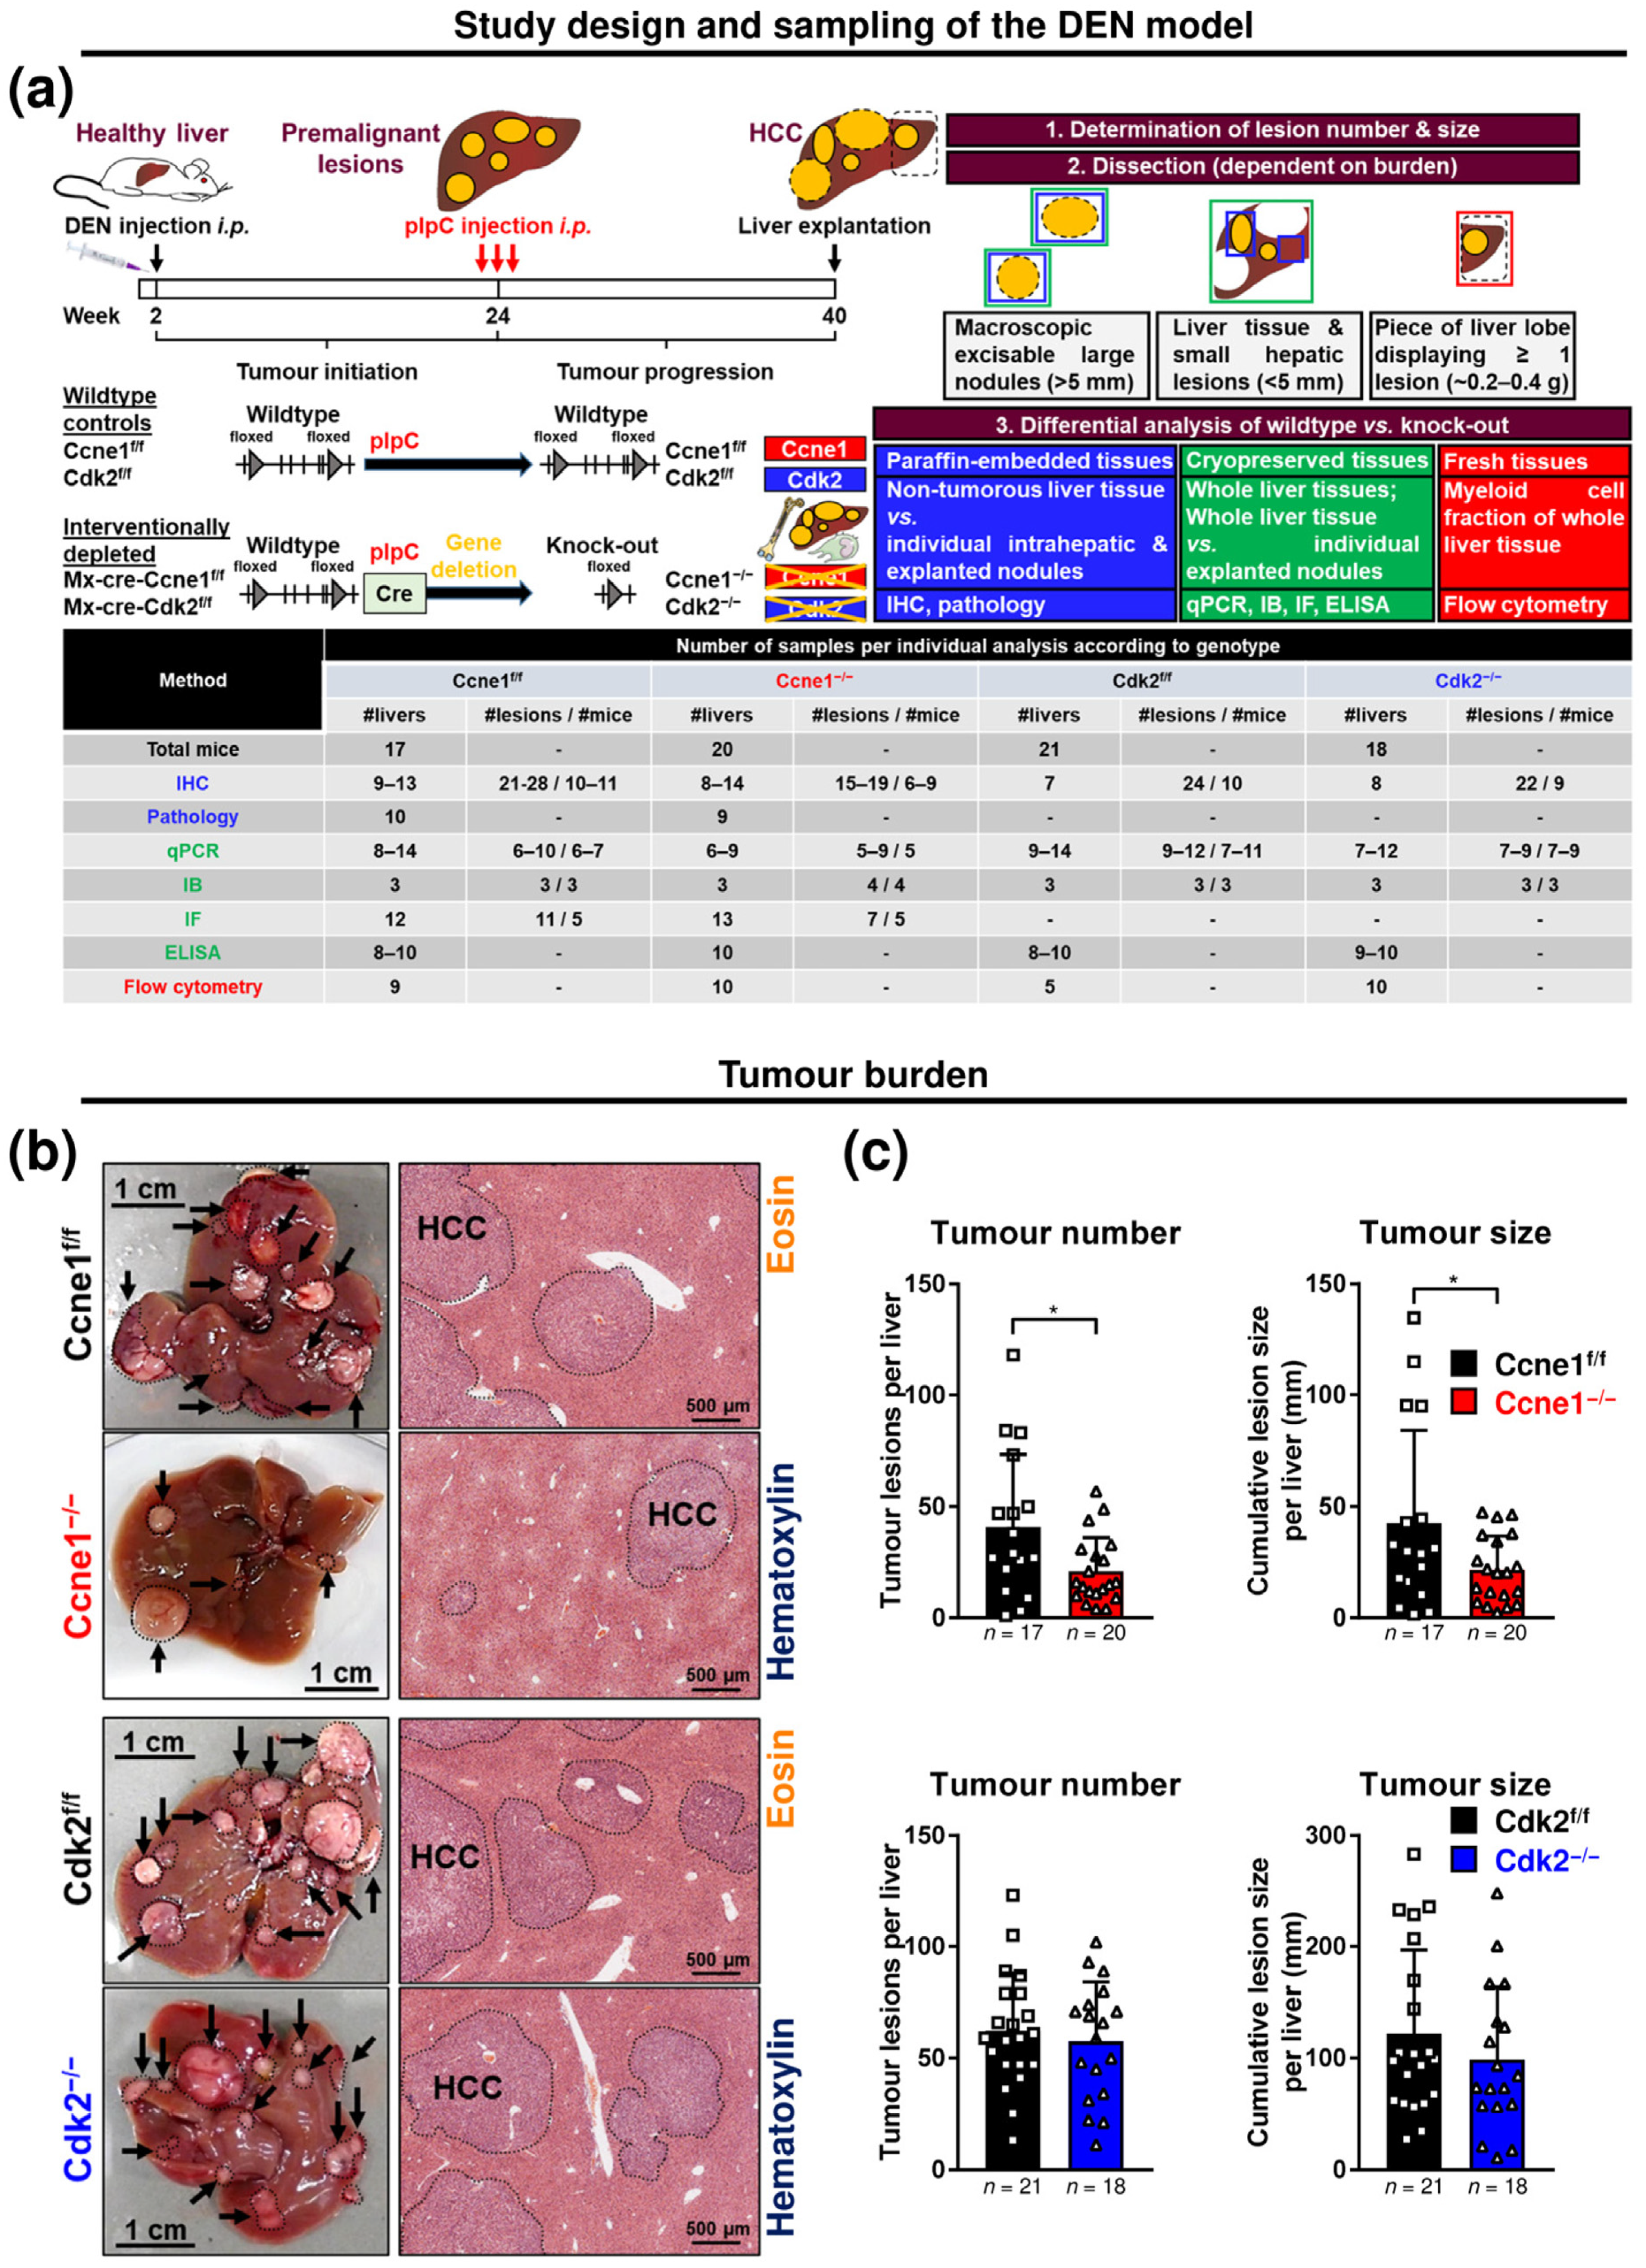
2.1. Animal Experiments
2.2. Tumour Quantification
2.3. Quantitative Real-Time PCR (qPCR)
2.4. Histology and Immunoblot (IB) Analysis
2.5. Immunoprecipitations (IP), In Vitro Kinase Assays and Enzyme Linked Immunosorbent Assay (ELISA)
2.6. Fluorescence-Activated Cell Sorting (FACS)
2.7. Processing of Human and Murine Liver/HCC Samples
2.8. Measurement of Serum Enzyme Activity
2.9. Validation of Ccne1 and Cdk2 Deletion
2.10. Analysis of Human TCGA, TCPA and GTex Databases
2.11. Availability of Whole Transcriptome Shotgun Sequencing Data (RNA-Seq) from DEN-Derived Hepatoma Cell Lines
2.12. Statistical Analysis
3. Results
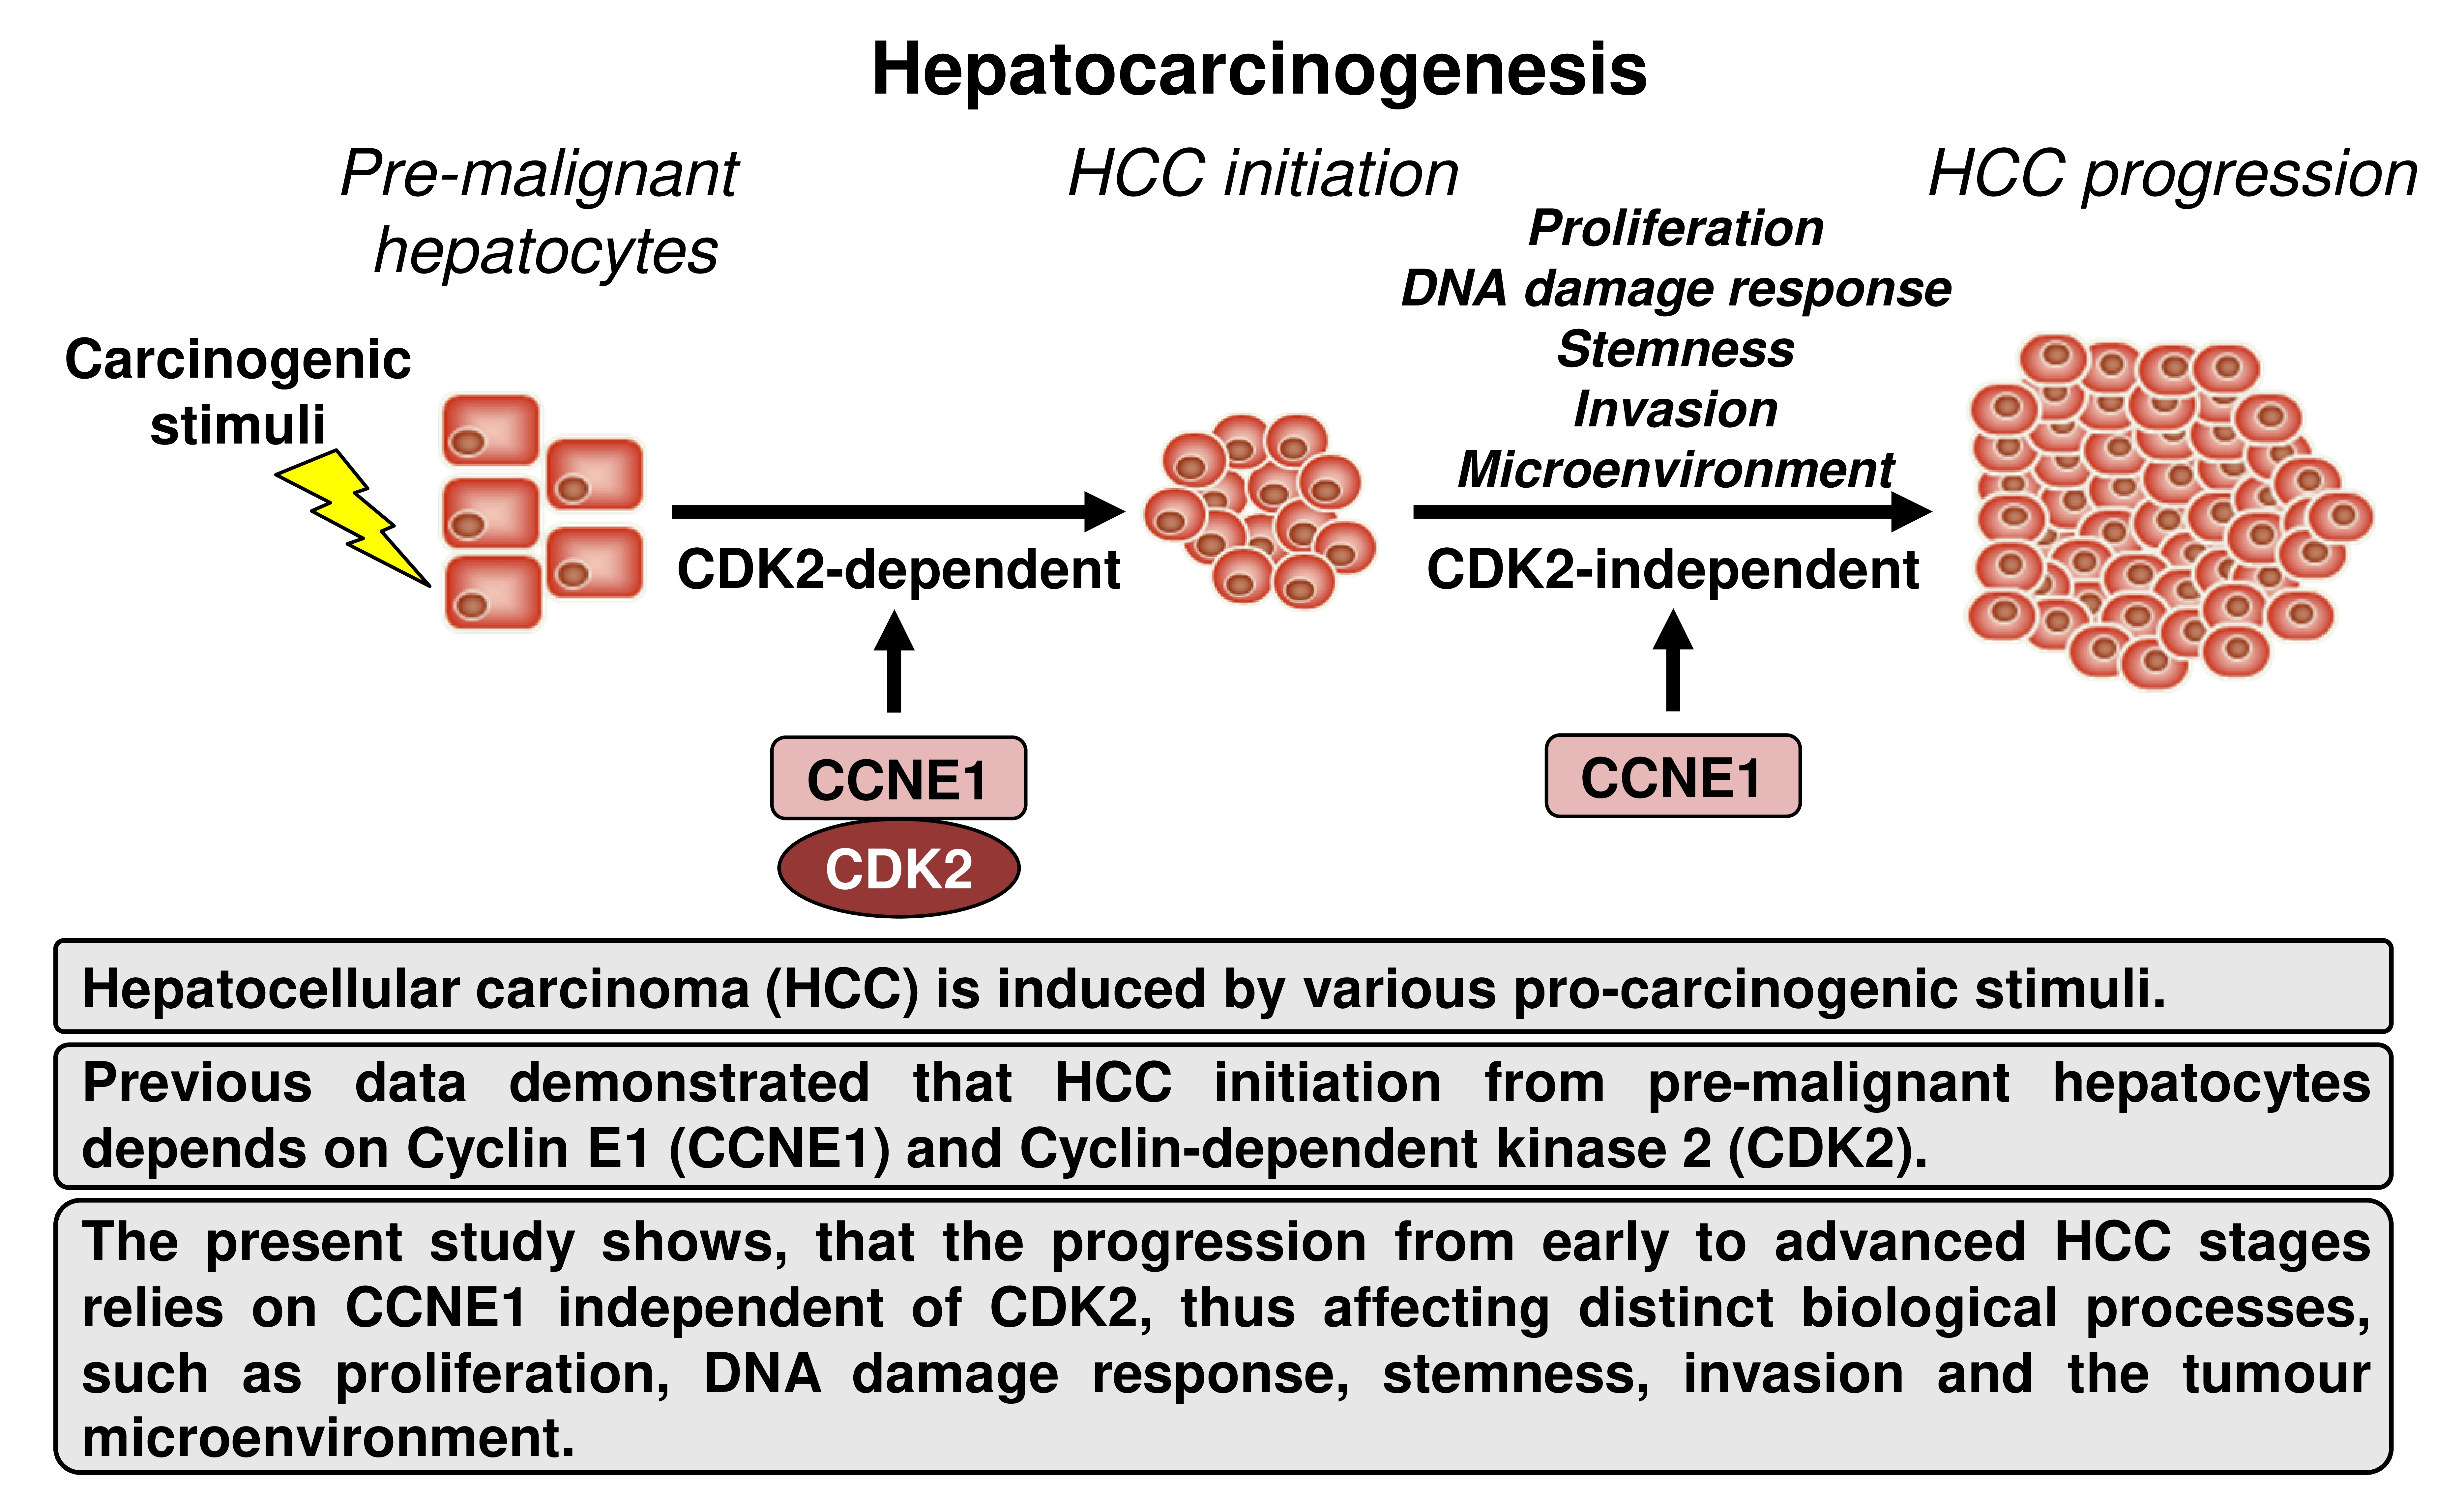
3.1. Interventional Deletion of Ccne1, but Not of Cdk2, after Onset of HCC Inhibits Tumour Progression
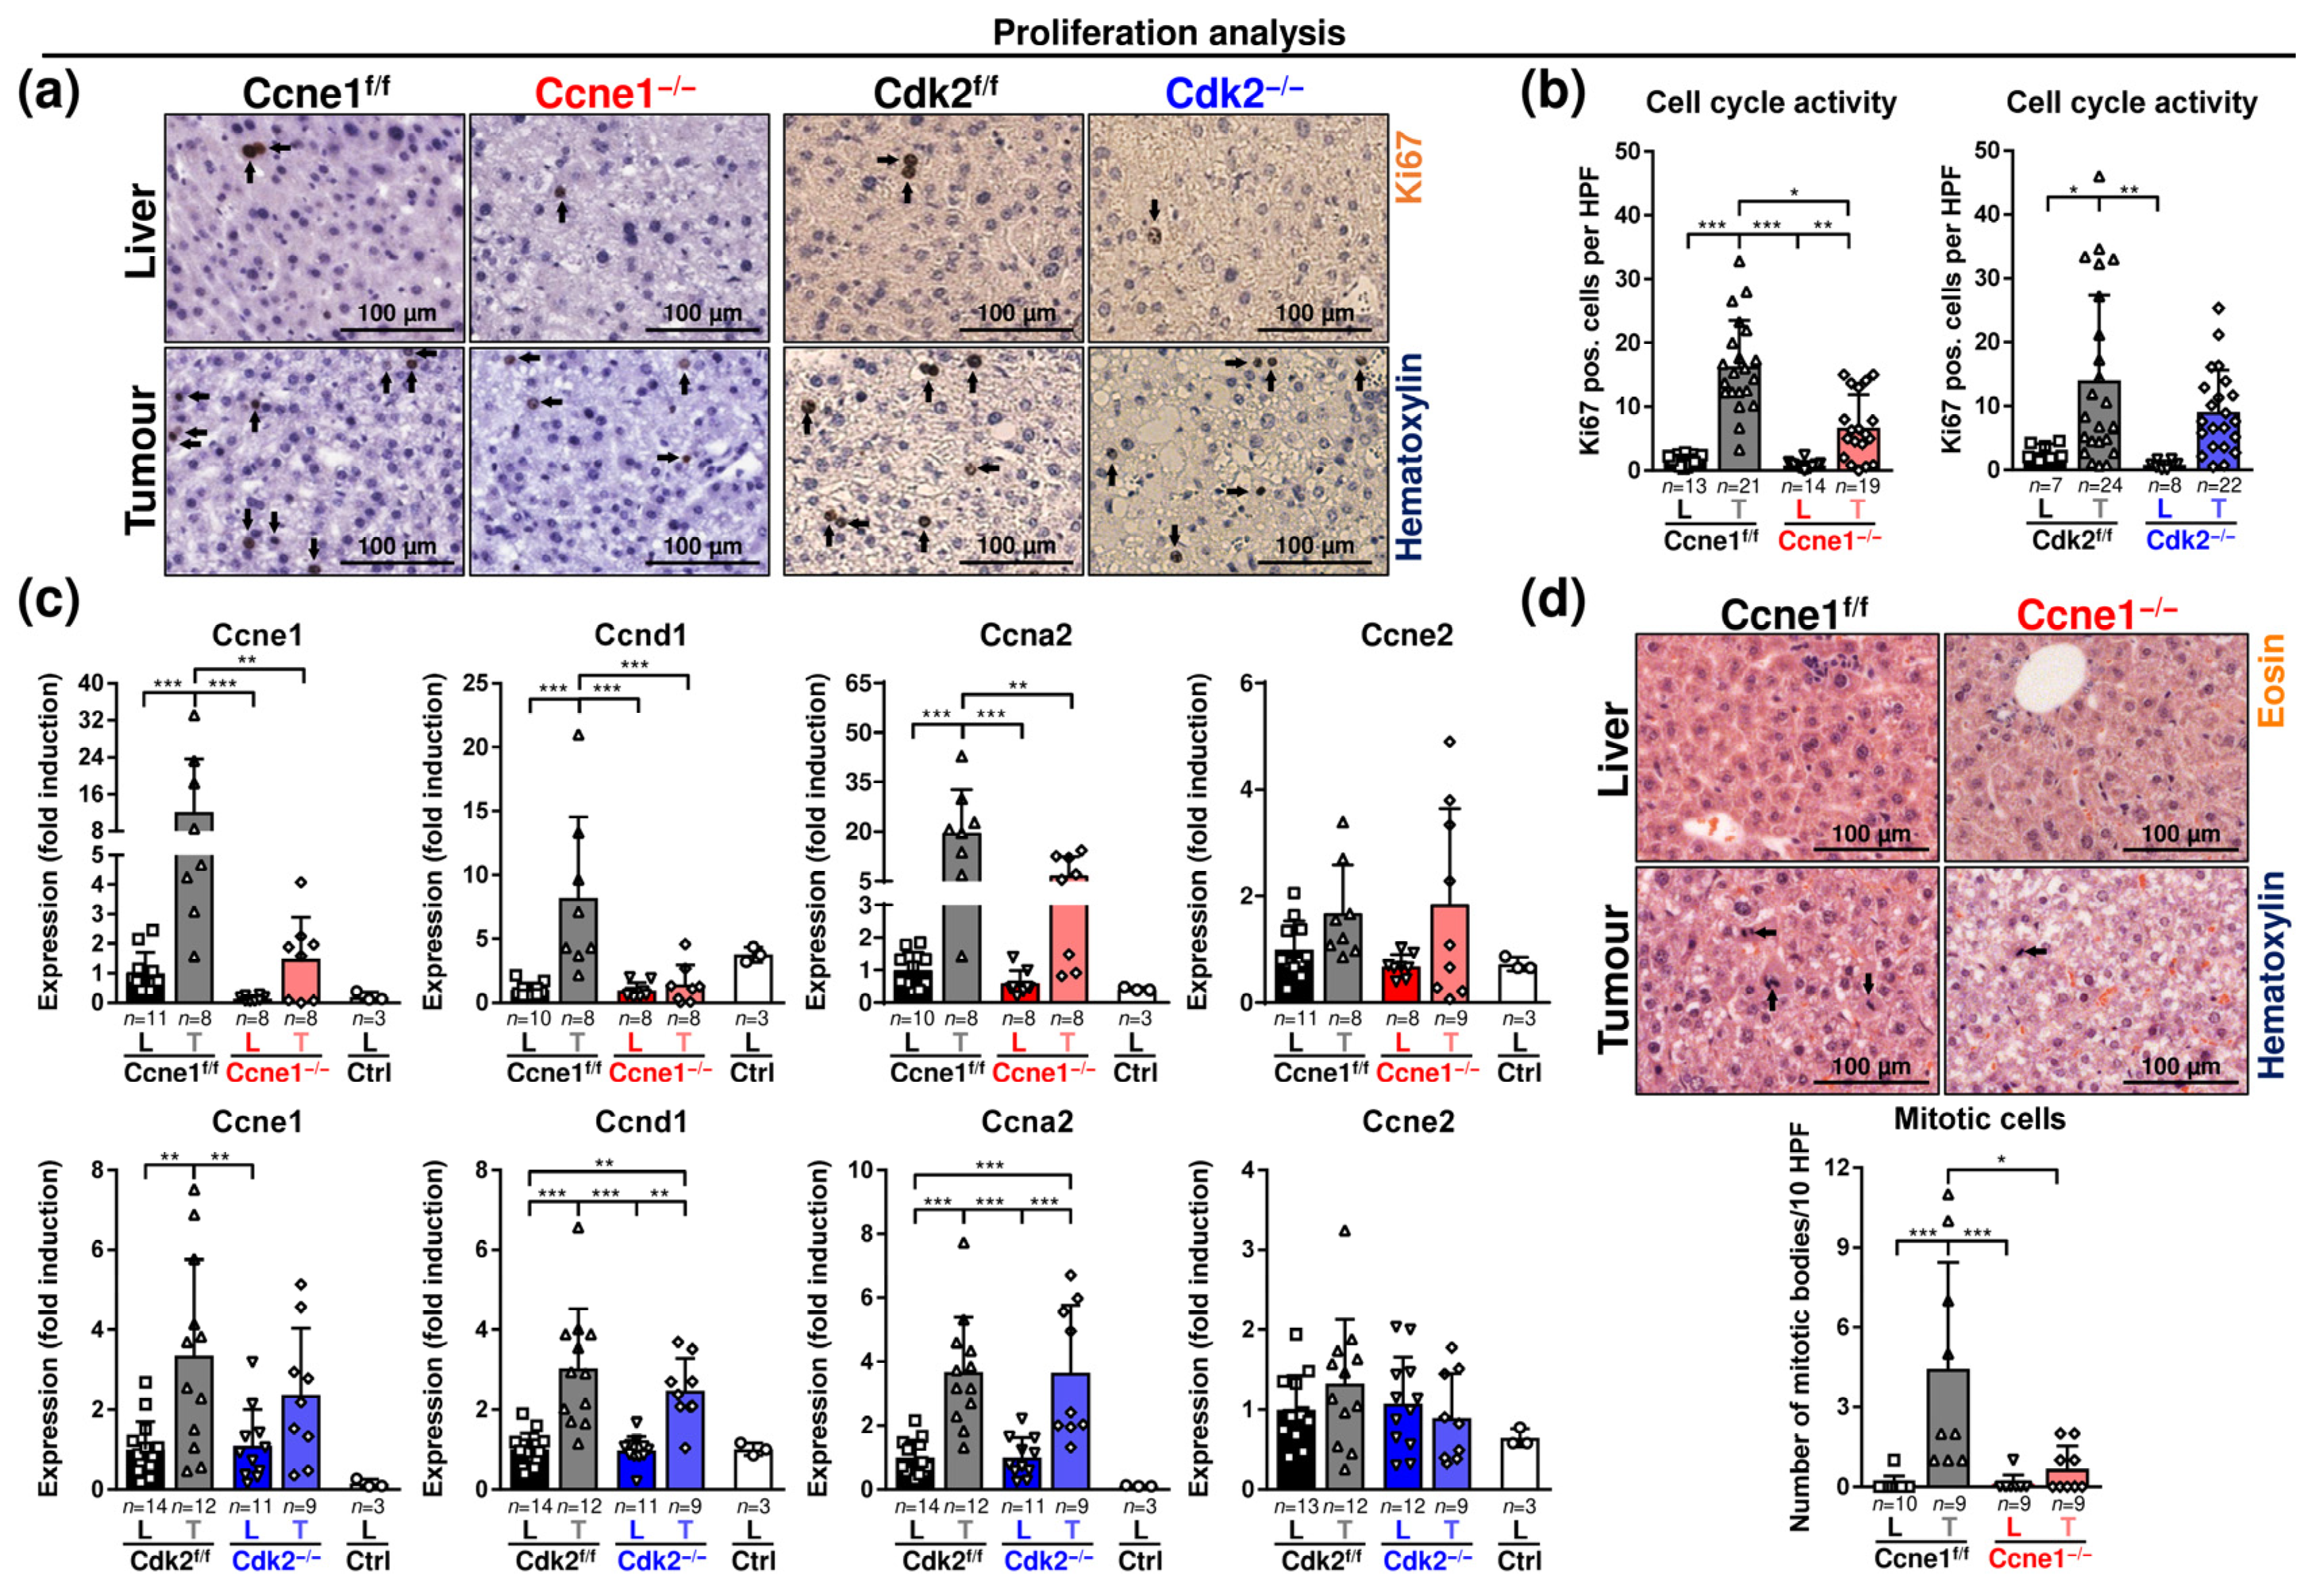
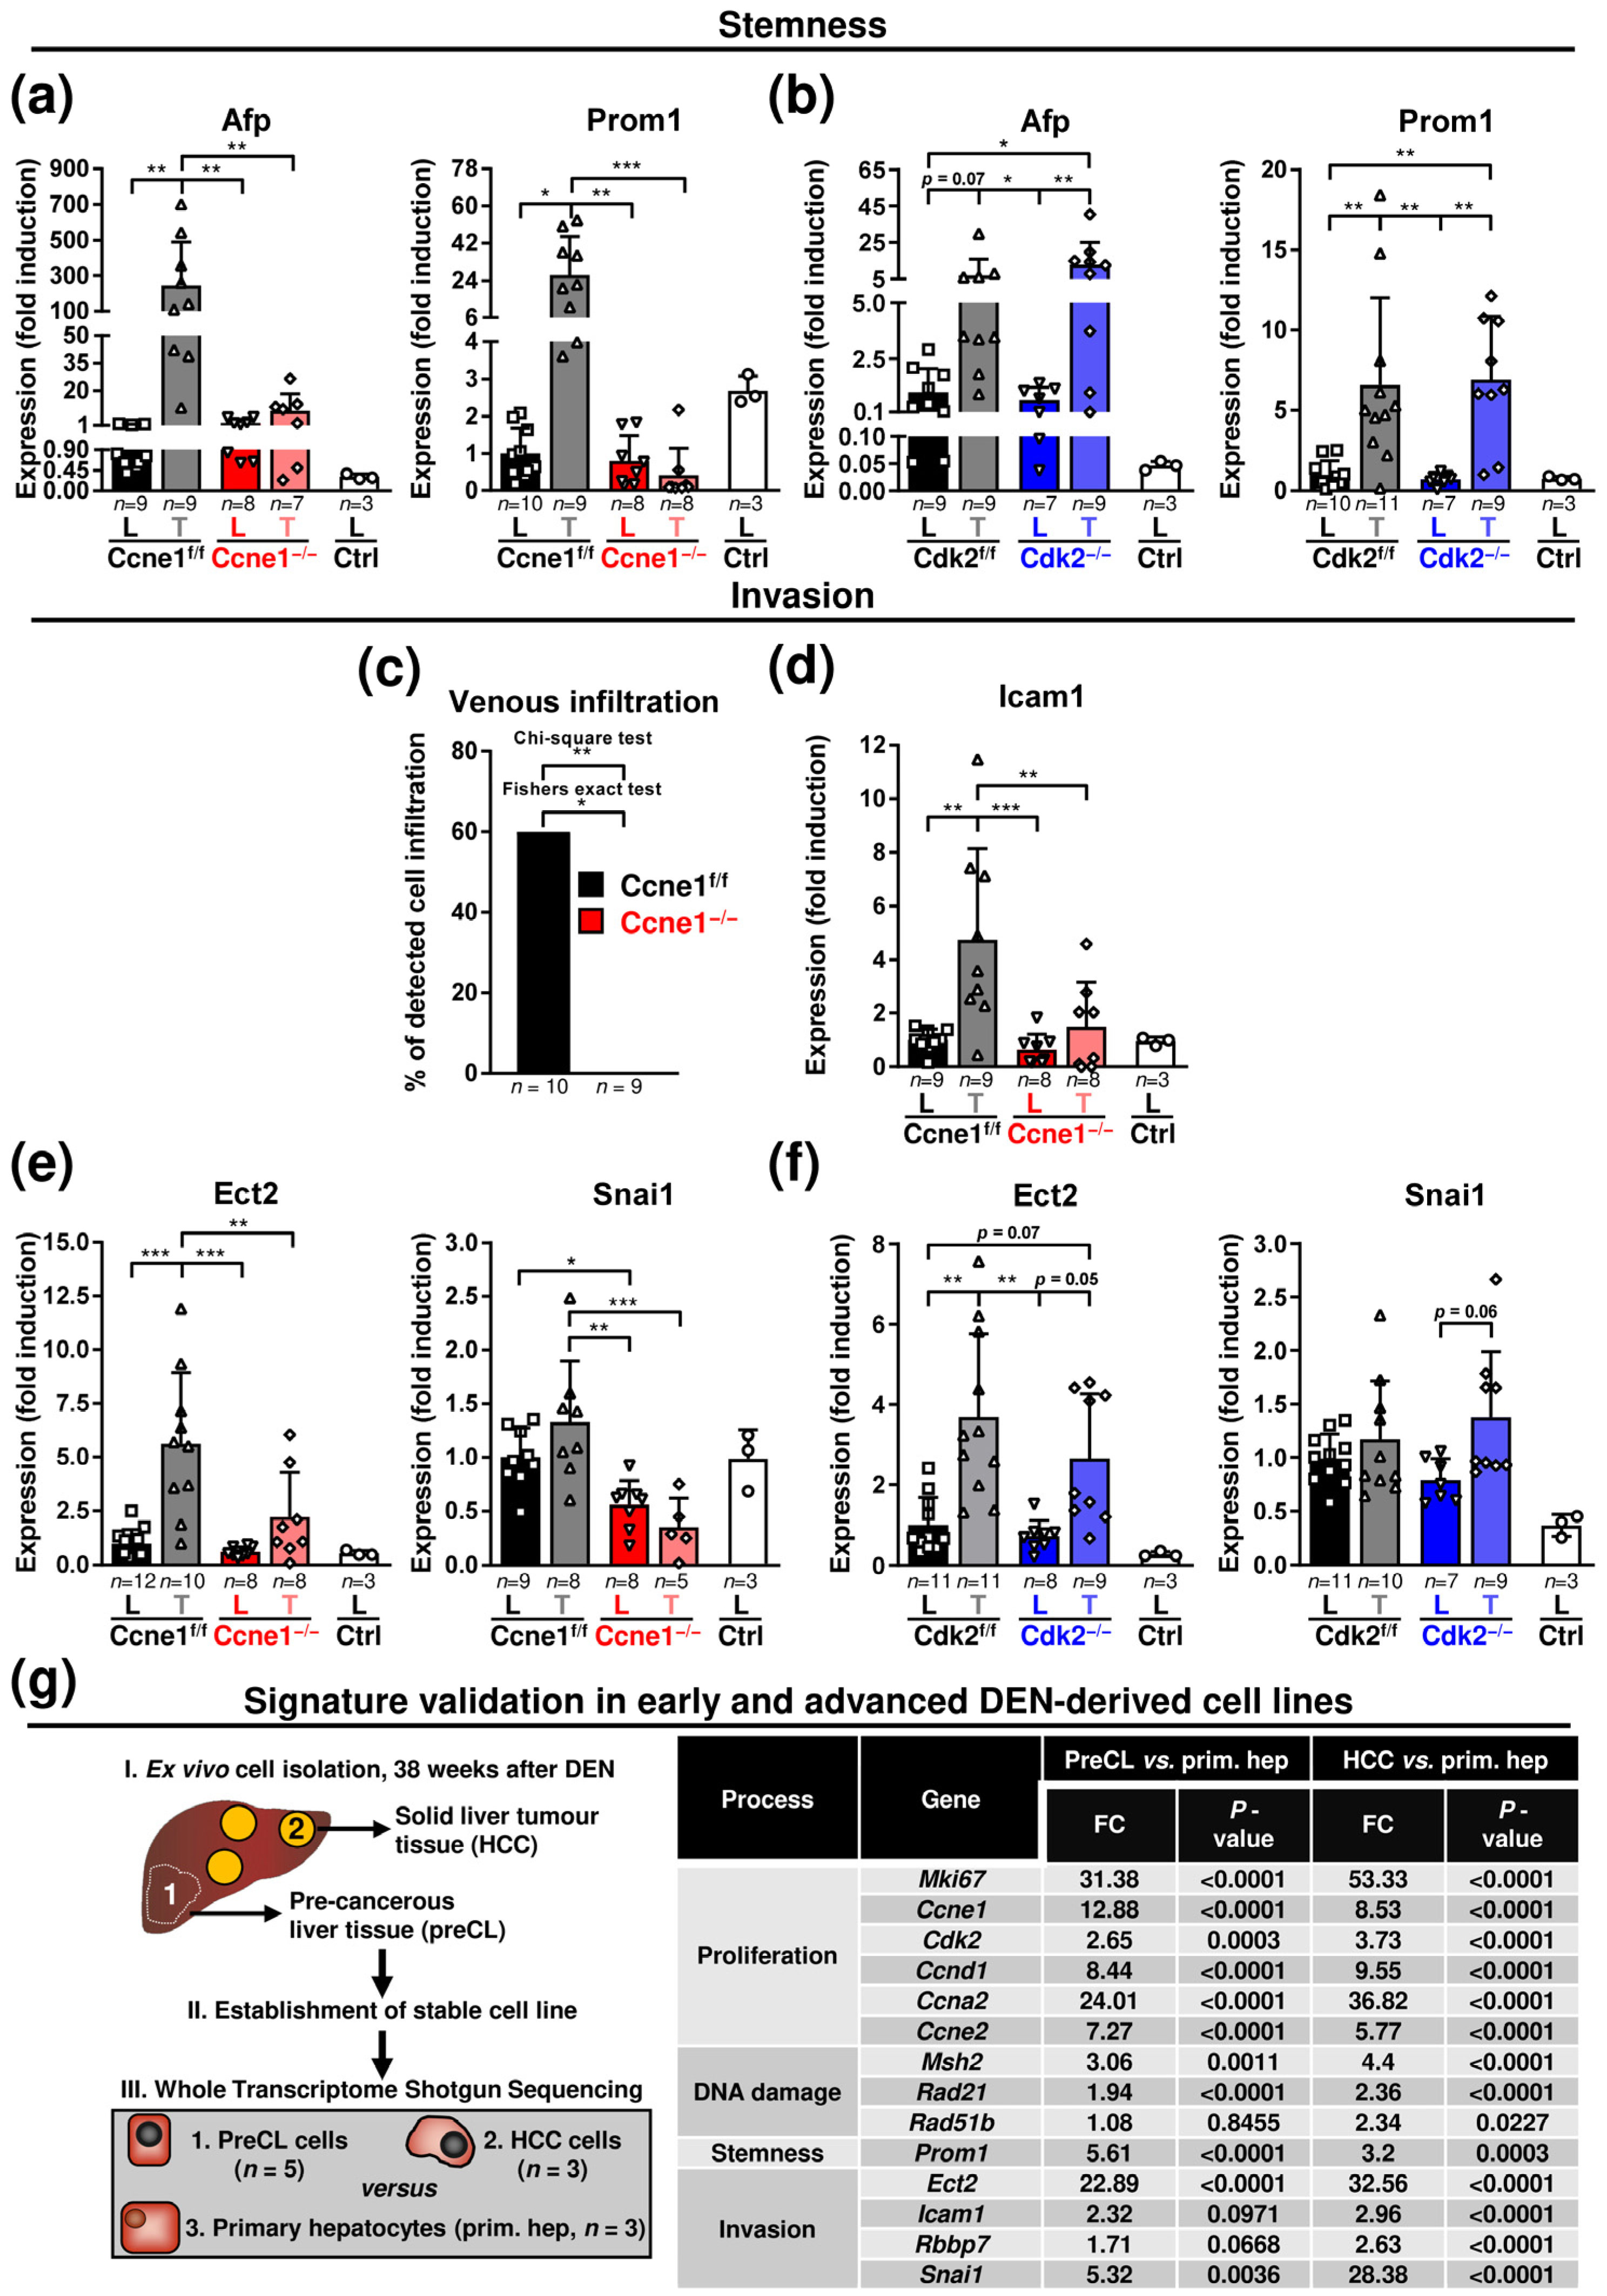
3.2. Absence of Ccne1 Modifies the DNA Damage Response and Restrains Stemness and Microinvasion during HCC Progression
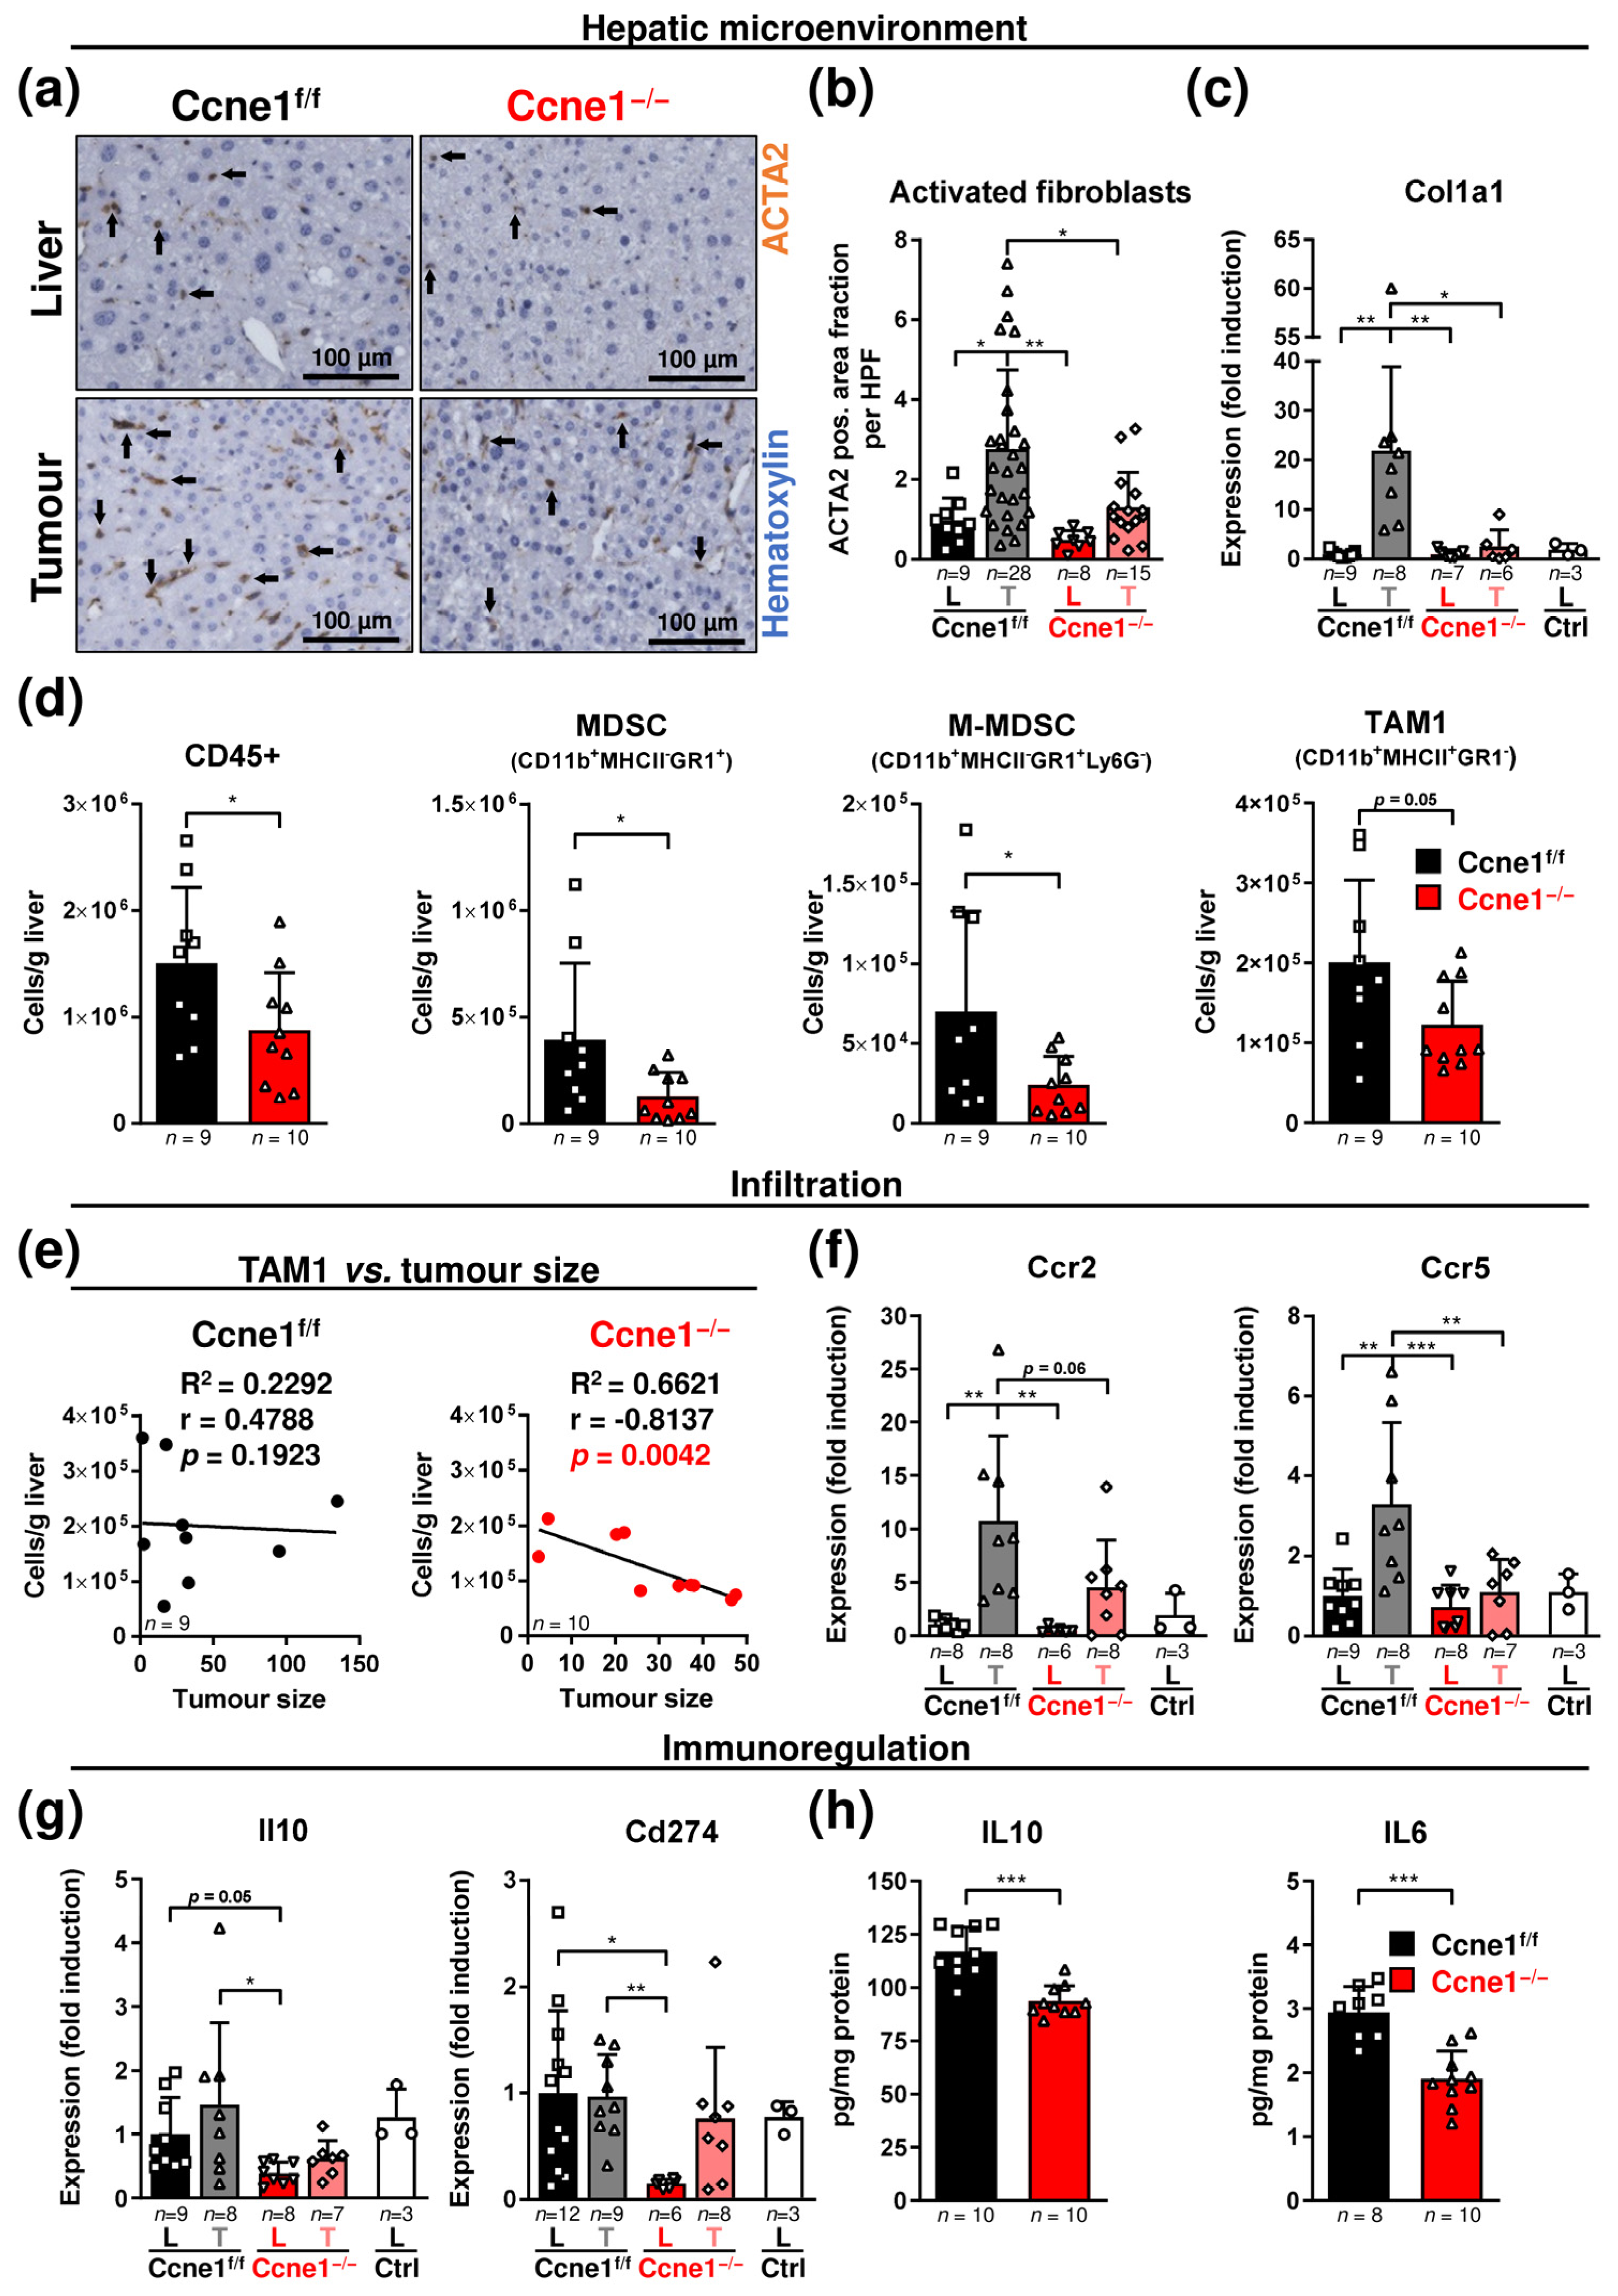
3.3. Loss of CCNE1 after HCC Establishment Limits the Accumulation of Activated Myofibroblasts and Myeloid Cells in the Hepatic Microenvironment
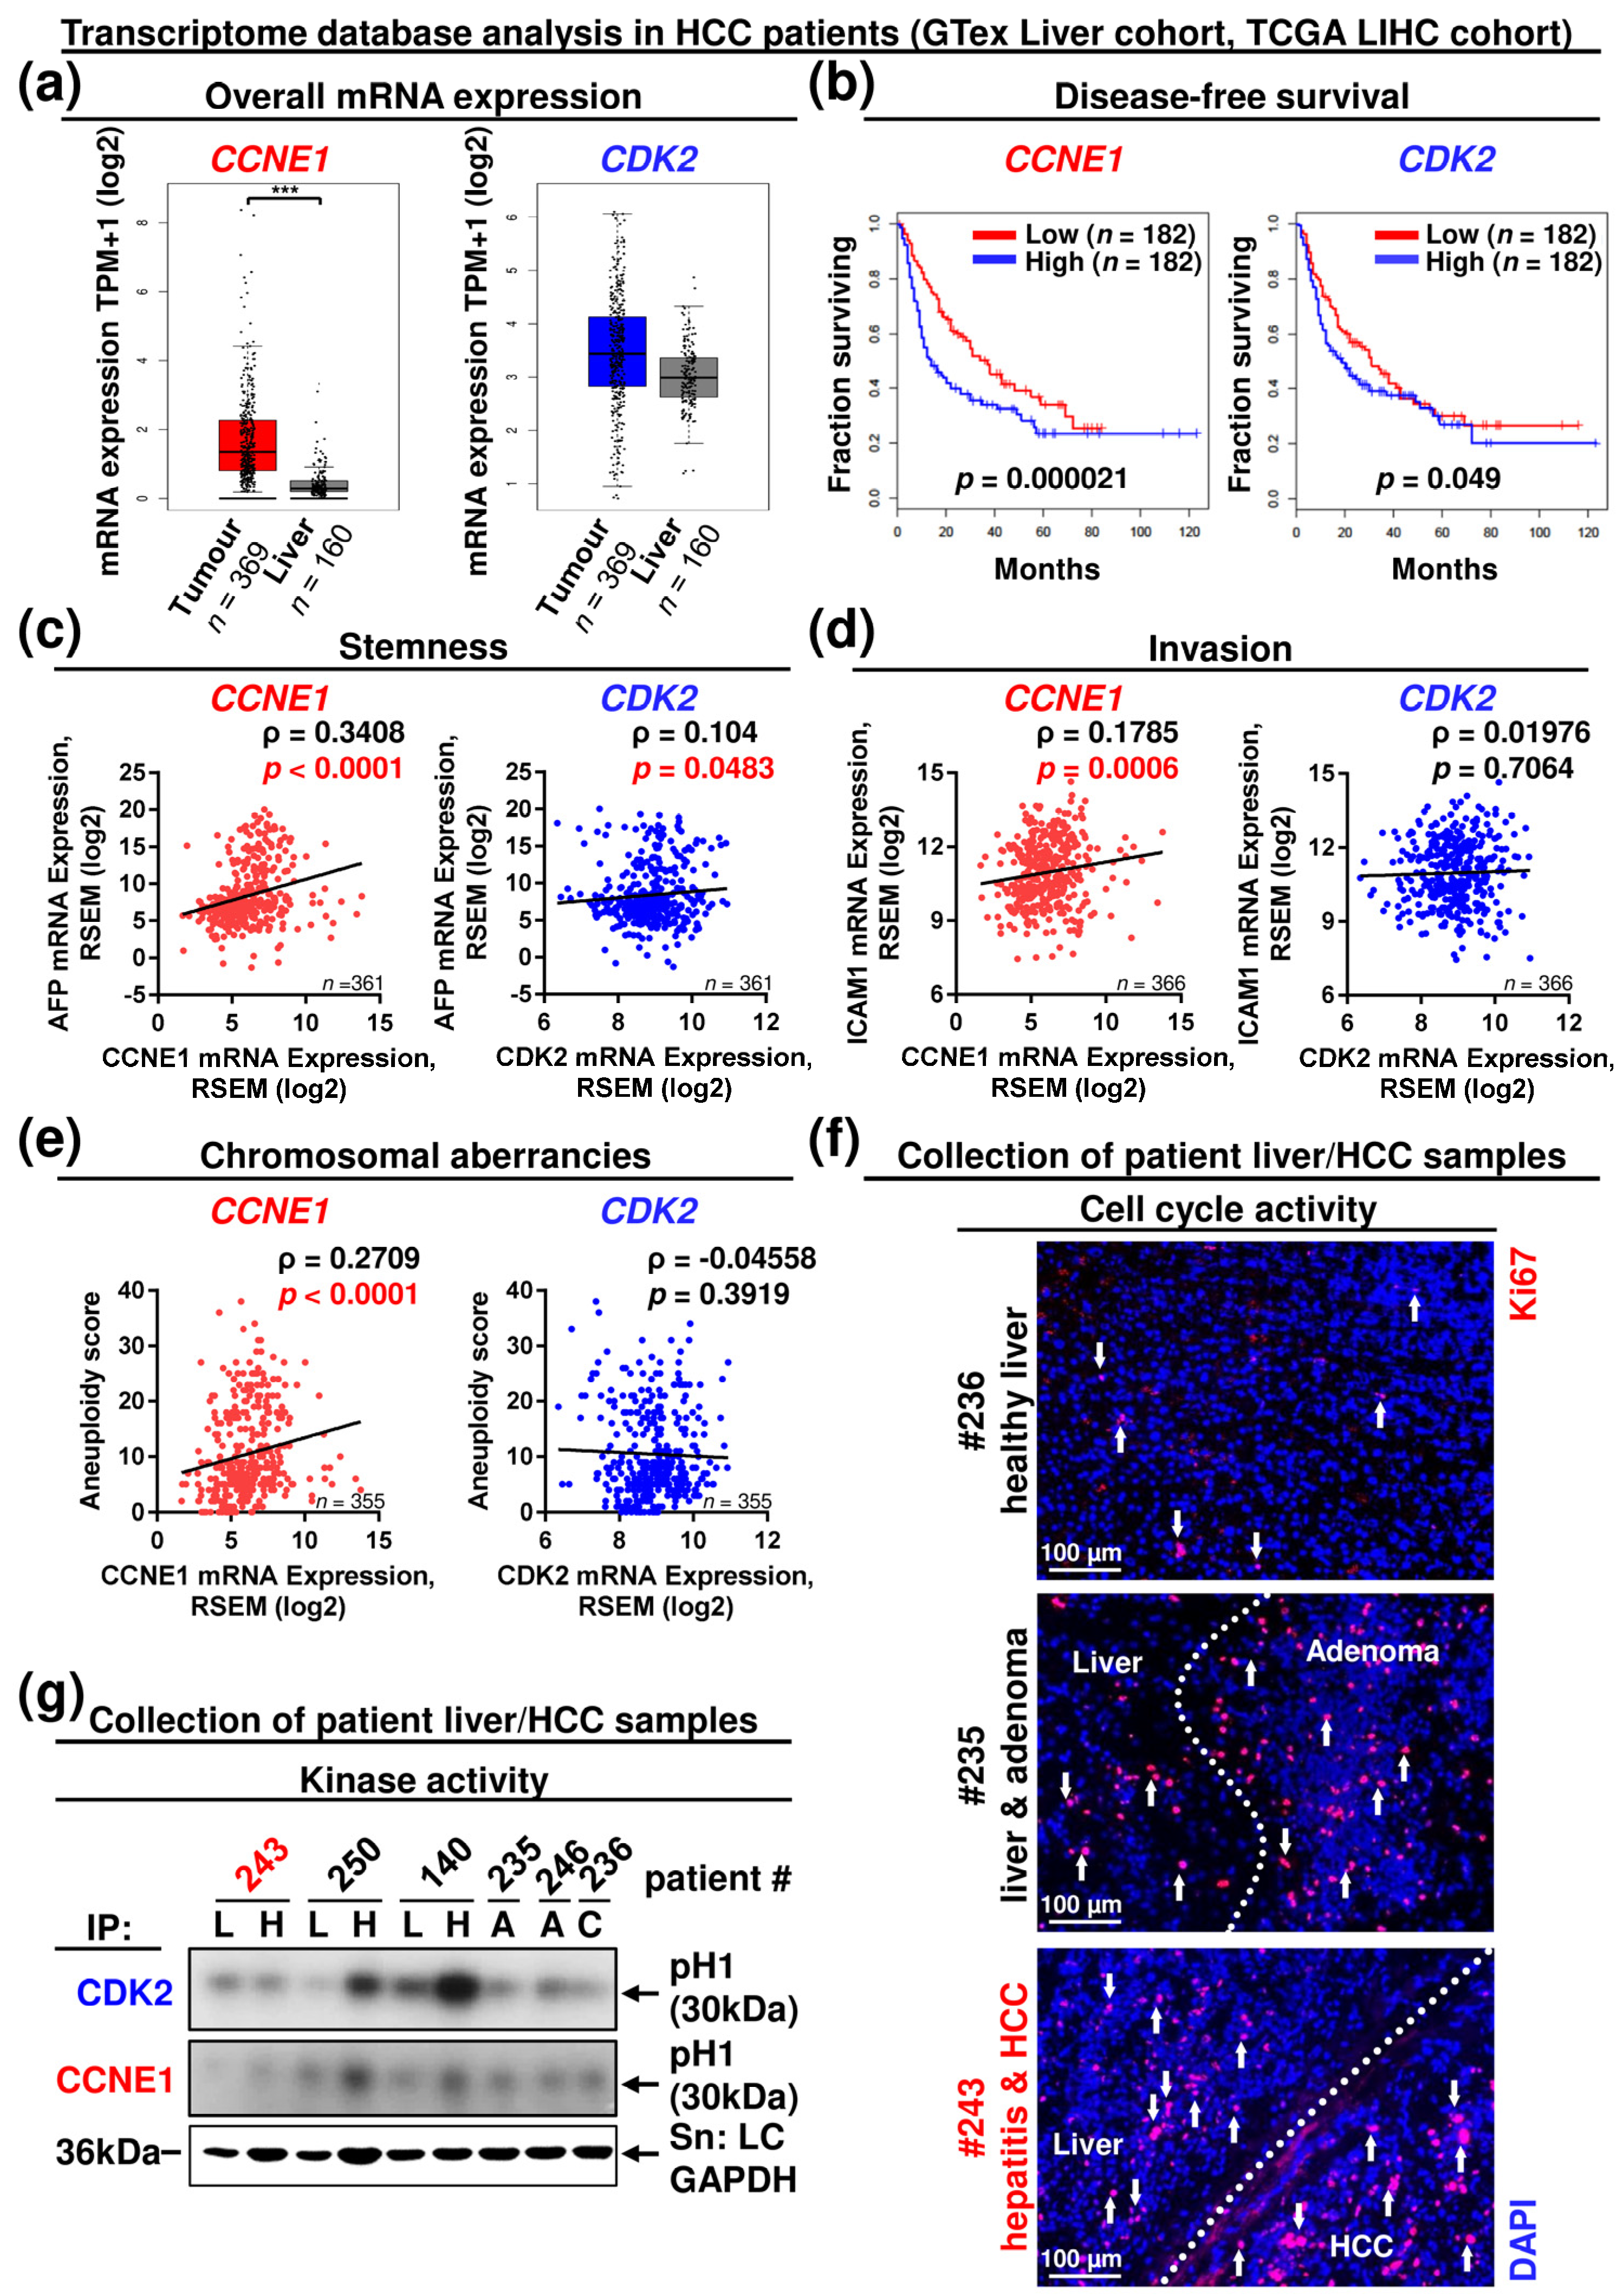
3.4. CCNE1 Expression Is a Diagnostic and Prognostic Biomarker, Correlating with a Molecular Signature of Proliferation, Chromosomal Instability, Dedifferentiation, Invasion and Leucocyte Infiltration in HCC Patients
4. Discussion
5. Conclusions
Supplementary Materials
Author Contributions
Funding
Institutional Review Board Statement
Informed Consent Statement
Data Availability Statement
Acknowledgments
Conflicts of Interest
References
- Global Burden of Disease Liver Cancer Collaboration; Akinyemiju, T.; Abera, S.; Ahmed, M.; Alam, N.; Alemayohu, M.A.; Allen, C.; Al-Raddadi, R.; Alvis-Guzman, N.; Amoako, Y.; et al. The Burden of Primary Liver Cancer and Underlying Etiologies from 1990 to 2015 at the Global, Regional, and National Level: Results from the Global Burden of Disease Study 2015. JAMA Oncol. 2017, 3, 1683–1691. [Google Scholar] [CrossRef]
- Bayard, Q.; Meunier, L.; Peneau, C.; Renault, V.; Shinde, J.; Nault, J.C.; Mami, I.; Couchy, G.; Amaddeo, G.; Tubacher, E.; et al. Cyclin A2/E1 activation defines a hepatocellular carcinoma subclass with a rearrangement signature of replication stress. Nat. Commun. 2018, 9, 5235. [Google Scholar] [CrossRef] [Green Version]
- Hanahan, D.; Weinberg, R.A. Hallmarks of cancer: The next generation. Cell 2011, 144, 646–674. [Google Scholar] [CrossRef] [PubMed] [Green Version]
- Salehan, M.R.; Morse, H.R. DNA damage repair and tolerance: A role in chemotherapeutic drug resistance. Br. J. Biomed. Sci. 2013, 70, 31–40. [Google Scholar] [CrossRef] [PubMed]
- De Mattia, E.; Cecchin, E.; Guardascione, M.; Foltran, L.; Di Raimo, T.; Angelini, F.; D’Andrea, M.; Toffoli, G. Pharmacogenetics of the systemic treatment in advanced hepatocellular carcinoma. World J. Gastroenterol. 2019, 25, 3870–3896. [Google Scholar] [CrossRef] [PubMed]
- Malumbres, M.; Barbacid, M. Cell cycle, CDKs and cancer: A changing paradigm. Nat. Rev. Cancer 2009, 9, 153–166. [Google Scholar] [CrossRef]
- Bangen, J.M.; Hammerich, L.; Sonntag, R.; Baues, M.; Haas, U.; Lambertz, D.; Longerich, T.; Lammers, T.; Tacke, F.; Trautwein, C.; et al. Targeting CCl4-induced liver fibrosis by RNA interference-mediated inhibition of cyclin E1 in mice. Hepatology 2017, 66, 1242–1257. [Google Scholar] [CrossRef] [Green Version]
- Aziz, K.; Limzerwala, J.F.; Sturmlechner, I.; Hurley, E.; Zhang, C.; Jeganathan, K.B.; Nelson, G.; Bronk, S.; Fierro Velasco, R.O.; van Deursen, E.J.; et al. Ccne1 Overexpression Causes Chromosome Instability in Liver Cells and Liver Tumor Development in Mice. Gastroenterology 2019, 157, 210–226. [Google Scholar] [CrossRef]
- Geng, Y.; Michowski, W.; Chick, J.M.; Wang, Y.E.; Jecrois, M.E.; Sweeney, K.E.; Liu, L.; Han, R.C.; Ke, N.; Zagozdzon, A.; et al. Kinase-independent function of E-type cyclins in liver cancer. Proc. Natl. Acad. Sci. USA 2018, 115, 1015–1020. [Google Scholar] [CrossRef] [Green Version]
- Sonntag, R.; Giebeler, N.; Nevzorova, Y.A.; Bangen, J.M.; Fahrenkamp, D.; Lambertz, D.; Haas, U.; Hu, W.; Gassler, N.; Cubero, F.J.; et al. Cyclin E1 and cyclin-dependent kinase 2 are critical for initiation, but not for progression of hepatocellular carcinoma. Proc. Natl. Acad. Sci. USA 2018, 115, 9282–9287. [Google Scholar] [CrossRef] [Green Version]
- Caruso, J.A.; Duong, M.T.; Carey, J.P.W.; Hunt, K.K.; Keyomarsi, K. Low-Molecular-Weight Cyclin E in Human Cancer: Cellular Consequences and Opportunities for Targeted Therapies. Cancer Res. 2018, 78, 5481–5491. [Google Scholar] [CrossRef] [Green Version]
- Odajima, J.; Wills, Z.P.; Ndassa, Y.M.; Terunuma, M.; Kretschmannova, K.; Deeb, T.Z.; Geng, Y.; Gawrzak, S.; Quadros, I.M.; Newman, J.; et al. Cyclin E constrains Cdk5 activity to regulate synaptic plasticity and memory formation. Dev. Cell 2011, 21, 655–668. [Google Scholar] [CrossRef] [PubMed] [Green Version]
- Ortega, S.; Prieto, I.; Odajima, J.; Martin, A.; Dubus, P.; Sotillo, R.; Barbero, J.L.; Malumbres, M.; Barbacid, M. Cyclin-dependent kinase 2 is essential for meiosis but not for mitotic cell division in mice. Nat. Genet. 2003, 35, 25–31. [Google Scholar] [CrossRef]
- Kuhn, R.; Schwenk, F.; Aguet, M.; Rajewsky, K. Inducible gene targeting in mice. Science 1995, 269, 1427–1429. [Google Scholar] [CrossRef] [Green Version]
- Nevzorova, Y.A.; Tschaharganeh, D.; Gassler, N.; Geng, Y.; Weiskirchen, R.; Sicinski, P.; Trautwein, C.; Liedtke, C. Aberrant cell cycle progression and endoreplication in regenerating livers of mice that lack a single E-type cyclin. Gastroenterology 2009, 137, 691–703. [Google Scholar] [CrossRef] [PubMed] [Green Version]
- Chuma, M.; Sakamoto, M.; Yamazaki, K.; Ohta, T.; Ohki, M.; Asaka, M.; Hirohashi, S. Expression profiling in multistage hepatocarcinogenesis: Identification of HSP70 as a molecular marker of early hepatocellular carcinoma. Hepatology 2003, 37, 198–207. [Google Scholar] [CrossRef] [PubMed] [Green Version]
- Bartneck, M.; Schrammen, P.L.; Mockel, D.; Govaere, O.; Liepelt, A.; Krenkel, O.; Ergen, C.; McCain, M.V.; Eulberg, D.; Luedde, T.; et al. The CCR2+ Macrophage Subset Promotes Pathogenic Angiogenesis for Tumor Vascularization in Fibrotic Livers. Cell Mol. Gastroenterol. Hepatol. 2019, 7, 371–390. [Google Scholar] [CrossRef] [PubMed] [Green Version]
- Movahedi, K.; Laoui, D.; Gysemans, C.; Baeten, M.; Stange, G.; Van den Bossche, J.; Mack, M.; Pipeleers, D.; In’t Veld, P.; De Baetselier, P.; et al. Different tumor microenvironments contain functionally distinct subsets of macrophages derived from Ly6C(high) monocytes. Cancer Res. 2010, 70, 5728–5739. [Google Scholar] [CrossRef] [Green Version]
- Kroh, A.; Walter, J.; Schuler, H.; Nolting, J.; Eickhoff, R.; Heise, D.; Neumann, U.P.; Cramer, T.; Ulmer, T.F.; Fragoulis, A. A Newly Established Murine Cell Line as a Model for Hepatocellular Cancer in Non-Alcoholic Steatohepatitis. Int. J. Mol. Sci. 2019, 20, 5658. [Google Scholar] [CrossRef] [Green Version]
- Dubois, N.; Bennoun, M.; Allemand, I.; Molina, T.; Grimber, G.; Daudet-Monsac, M.; Abelanet, R.; Briand, P. Time-course development of differentiated hepatocarcinoma and lung metastasis in transgenic mice. J. Hepatol. 1991, 13, 227–239. [Google Scholar] [CrossRef]
- Hu, W.; Nevzorova, Y.A.; Haas, U.; Moro, N.; Sicinski, P.; Geng, Y.; Barbacid, M.; Trautwein, C.; Liedtke, C. Concurrent deletion of cyclin E1 and cyclin-dependent kinase 2 in hepatocytes inhibits DNA replication and liver regeneration in mice. Hepatology 2014, 59, 651–660. [Google Scholar] [CrossRef] [Green Version]
- Consortium, G.T. The Genotype-Tissue Expression (GTEx) project. Nat. Genet. 2013, 45, 580–585. [Google Scholar] [CrossRef]
- Li, J.; Akbani, R.; Zhao, W.; Lu, Y.; Weinstein, J.N.; Mills, G.B.; Liang, H. Explore, Visualize, and Analyze Functional Cancer Proteomic Data Using the Cancer Proteome Atlas. Cancer Res. 2017, 77, e51–e54. [Google Scholar] [CrossRef] [PubMed] [Green Version]
- Li, J.; Lu, Y.; Akbani, R.; Ju, Z.; Roebuck, P.L.; Liu, W.; Yang, J.Y.; Broom, B.M.; Verhaak, R.G.; Kane, D.W.; et al. TCPA: A resource for cancer functional proteomics data. Nat. Methods 2013, 10, 1046–1047. [Google Scholar] [CrossRef] [Green Version]
- Cerami, E.; Gao, J.; Dogrusoz, U.; Gross, B.E.; Sumer, S.O.; Aksoy, B.A.; Jacobsen, A.; Byrne, C.J.; Heuer, M.L.; Larsson, E.; et al. The cBio cancer genomics portal: An open platform for exploring multidimensional cancer genomics data. Cancer Discov. 2012, 2, 401–404. [Google Scholar] [CrossRef] [PubMed] [Green Version]
- Gao, J.; Aksoy, B.A.; Dogrusoz, U.; Dresdner, G.; Gross, B.; Sumer, S.O.; Sun, Y.; Jacobsen, A.; Sinha, R.; Larsson, E.; et al. Integrative analysis of complex cancer genomics and clinical profiles using the cBioPortal. Sci. Signal. 2013, 6, pl1. [Google Scholar] [CrossRef] [Green Version]
- Tang, Z.; Kang, B.; Li, C.; Chen, T.; Zhang, Z. GEPIA2: An enhanced web server for large-scale expression profiling and interactive analysis. Nucleic Acids Res. 2019, 47, W556–W560. [Google Scholar] [CrossRef] [Green Version]
- Sun, W.; Duan, T.; Ye, P.; Chen, K.; Zhang, G.; Lai, M.; Zhang, H. TSVdb: A web-tool for TCGA splicing variants analysis. BMC Genom. 2018, 19, 405. [Google Scholar] [CrossRef]
- Love, M.I.; Huber, W.; Anders, S. Moderated estimation of fold change and dispersion for RNA-seq data with DESeq2. Genome Biol. 2014, 15, 550. [Google Scholar] [CrossRef] [PubMed] [Green Version]
- Lee, J.S.; Chu, I.S.; Mikaelyan, A.; Calvisi, D.F.; Heo, J.; Reddy, J.K.; Thorgeirsson, S.S. Application of comparative functional genomics to identify best-fit mouse models to study human cancer. Nat. Genet. 2004, 36, 1306–1311. [Google Scholar] [CrossRef]
- Eferl, R.; Ricci, R.; Kenner, L.; Zenz, R.; David, J.P.; Rath, M.; Wagner, E.F. Liver tumor development. c-Jun antagonizes the proapoptotic activity of p53. Cell 2003, 112, 181–192. [Google Scholar] [CrossRef] [Green Version]
- Dai, X.M.; Yang, S.L.; Zheng, X.M.; Chen, G.G.; Chen, J.; Zhang, T. CD133 expression and alpha-fetoprotein levels define novel prognostic subtypes of HBV-associated hepatocellular carcinoma: A long-term follow-up analysis. Oncol. Lett. 2018, 15, 2985–2991. [Google Scholar] [CrossRef] [PubMed] [Green Version]
- Erstad, D.J.; Tanabe, K.K. Prognostic and Therapeutic Implications of Microvascular Invasion in Hepatocellular Carcinoma. Ann. Surg. Oncol. 2019, 26, 1474–1493. [Google Scholar] [CrossRef] [PubMed]
- Chen, J.; Xia, H.; Zhang, X.; Karthik, S.; Pratap, S.V.; Ooi, L.L.; Hong, W.; Hui, K.M. ECT2 regulates the Rho/ERK signalling axis to promote early recurrence in human hepatocellular carcinoma. J. Hepatol. 2015, 62, 1287–1295. [Google Scholar] [CrossRef]
- Shao, S.; Cao, H.; Wang, Z.; Zhou, D.; Wu, C.; Wang, S.; Xia, D.; Zhang, D. CHD4/NuRD complex regulates complement gene expression and correlates with CD8 T cell infiltration in human hepatocellular carcinoma. Clin. Epigenet. 2020, 12, 31. [Google Scholar] [CrossRef] [Green Version]
- Benedicto, A.; Romayor, I.; Arteta, B. Role of liver ICAM-1 in metastasis. Oncol. Lett. 2017, 14, 3883–3892. [Google Scholar] [CrossRef] [Green Version]
- Sistigu, A.; Di Modugno, F.; Manic, G.; Nistico, P. Deciphering the loop of epithelial-mesenchymal transition, inflammatory cytokines and cancer immunoediting. Cytokine Growth Factor Rev. 2017, 36, 67–77. [Google Scholar] [CrossRef]
- Zhang, J.; Shi, Z.; Xu, X.; Yu, Z.; Mi, J. The influence of microenvironment on tumor immunotherapy. FEBS J. 2019, 286, 4160–4175. [Google Scholar] [CrossRef]
- Bergmann, J.; Muller, M.; Baumann, N.; Reichert, M.; Heneweer, C.; Bolik, J.; Lucke, K.; Gruber, S.; Carambia, A.; Boretius, S.; et al. IL-6 trans-signaling is essential for the development of hepatocellular carcinoma in mice. Hepatology 2017, 65, 89–103. [Google Scholar] [CrossRef] [PubMed]
- Cancer Genome Atlas Research Network. Electronic address: wheeler@bcm.edu; Cancer Genome Atlas Research Network. Comprehensive and Integrative Genomic Characterization of Hepatocellular Carcinoma. Cell 2017, 169, 1327–1341.e23. [Google Scholar] [CrossRef] [Green Version]
- Calderaro, J.; Ziol, M.; Paradis, V.; Zucman-Rossi, J. Molecular and histological correlations in liver cancer. J. Hepatol. 2019, 71, 616–630. [Google Scholar] [CrossRef] [PubMed] [Green Version]
- Liu, S.; Li, N.; Yu, X.; Xiao, X.; Cheng, K.; Hu, J.; Wang, J.; Zhang, D.; Cheng, S.; Liu, S. Expression of intercellular adhesion molecule 1 by hepatocellular carcinoma stem cells and circulating tumor cells. Gastroenterology 2013, 144, 1031–1041. [Google Scholar] [CrossRef] [PubMed] [Green Version]
- Kim, B.; Shin, H.C.; Heo, Y.J.; Ha, S.Y.; Jang, K.T.; Kim, S.T.; Kang, W.K.; Lee, J.; Kim, K.M. CCNE1 amplification is associated with liver metastasis in gastric carcinoma. Pathol. Res. Pract. 2019, 215, 152434. [Google Scholar] [CrossRef]
- Pan, X.; Wang, G.; Wang, B. Ectopic expression of microRNA-874 represses epithelial mesenchymal transition through the NF-kappaB pathway via CCNE1 in cholangiocarcinoma. Cell. Signal. 2021, 82, 109927. [Google Scholar] [CrossRef]
- Liu, Q.; VanHoy, R.W.; Zhou, J.H.; Dantzer, R.; Freund, G.G.; Kelley, K.W. Elevated cyclin E levels, inactive retinoblastoma protein, and suppression of the p27KIP1 inhibitor characterize early development of promyeloid cells into macrophages. Mol. Cell. Biol. 1999, 19, 6229–6239. [Google Scholar] [CrossRef] [Green Version]
- Nii, T.; Makino, K.; Tabata, Y. Three-Dimensional Culture System of Cancer Cells Combined with Biomaterials for Drug Screening. Cancers 2020, 12, 2754. [Google Scholar] [CrossRef] [PubMed]
- Fong, E.L.S.; Toh, T.B.; Lin, Q.X.X.; Liu, Z.; Hooi, L.; Mohd Abdul Rashid, M.B.; Benoukraf, T.; Chow, E.K.; Huynh, T.H.; Yu, H. Generation of matched patient-derived xenograft in vitro-in vivo models using 3D macroporous hydrogels for the study of liver cancer. Biomaterials 2018, 159, 229–240. [Google Scholar] [CrossRef]
- Nii, T.; Kuwahara, T.; Makino, K.; Tabata, Y. A Co-Culture System of Three-Dimensional Tumor-Associated Macrophages and Three-Dimensional Cancer-Associated Fibroblasts Combined with Biomolecule Release for Cancer Cell Migration. Tissue Eng. Part. A 2020, 26, 1272–1282. [Google Scholar] [CrossRef]
- Xu, J.; Huang, F.; Yao, Z.; Jia, C.; Xiong, Z.; Liang, H.; Lin, N.; Deng, M. Inhibition of cyclin E1 sensitizes hepatocellular carcinoma cells to regorafenib by mcl-1 suppression. Cell Commun. Signal. 2019, 17, 85. [Google Scholar] [CrossRef] [PubMed] [Green Version]


Publisher’s Note: MDPI stays neutral with regard to jurisdictional claims in published maps and institutional affiliations. |
© 2021 by the authors. Licensee MDPI, Basel, Switzerland. This article is an open access article distributed under the terms and conditions of the Creative Commons Attribution (CC BY) license (https://creativecommons.org/licenses/by/4.0/).
Share and Cite
Sonntag, R.; Penners, C.; Kohlhepp, M.; Haas, U.; Lambertz, D.; Kroh, A.; Cramer, T.; Ticconi, F.; Costa, I.G.; Tacke, F.; et al. Cyclin E1 in Murine and Human Liver Cancer: A Promising Target for Therapeutic Intervention during Tumour Progression. Cancers 2021, 13, 5680. https://doi.org/10.3390/cancers13225680
Sonntag R, Penners C, Kohlhepp M, Haas U, Lambertz D, Kroh A, Cramer T, Ticconi F, Costa IG, Tacke F, et al. Cyclin E1 in Murine and Human Liver Cancer: A Promising Target for Therapeutic Intervention during Tumour Progression. Cancers. 2021; 13(22):5680. https://doi.org/10.3390/cancers13225680
Chicago/Turabian StyleSonntag, Roland, Christian Penners, Marlene Kohlhepp, Ute Haas, Daniela Lambertz, Andreas Kroh, Thorsten Cramer, Fabio Ticconi, Ivan G. Costa, Frank Tacke, and et al. 2021. "Cyclin E1 in Murine and Human Liver Cancer: A Promising Target for Therapeutic Intervention during Tumour Progression" Cancers 13, no. 22: 5680. https://doi.org/10.3390/cancers13225680
APA StyleSonntag, R., Penners, C., Kohlhepp, M., Haas, U., Lambertz, D., Kroh, A., Cramer, T., Ticconi, F., Costa, I. G., Tacke, F., Gassler, N., Trautwein, C., & Liedtke, C. (2021). Cyclin E1 in Murine and Human Liver Cancer: A Promising Target for Therapeutic Intervention during Tumour Progression. Cancers, 13(22), 5680. https://doi.org/10.3390/cancers13225680