
A Systematic Review of Cost-Effectiveness Analyses of Novel Agents in the Treatment of Multiple Myeloma

 , ,
, ,
Abstract
:Simple Summary
Abstract
1. Introduction
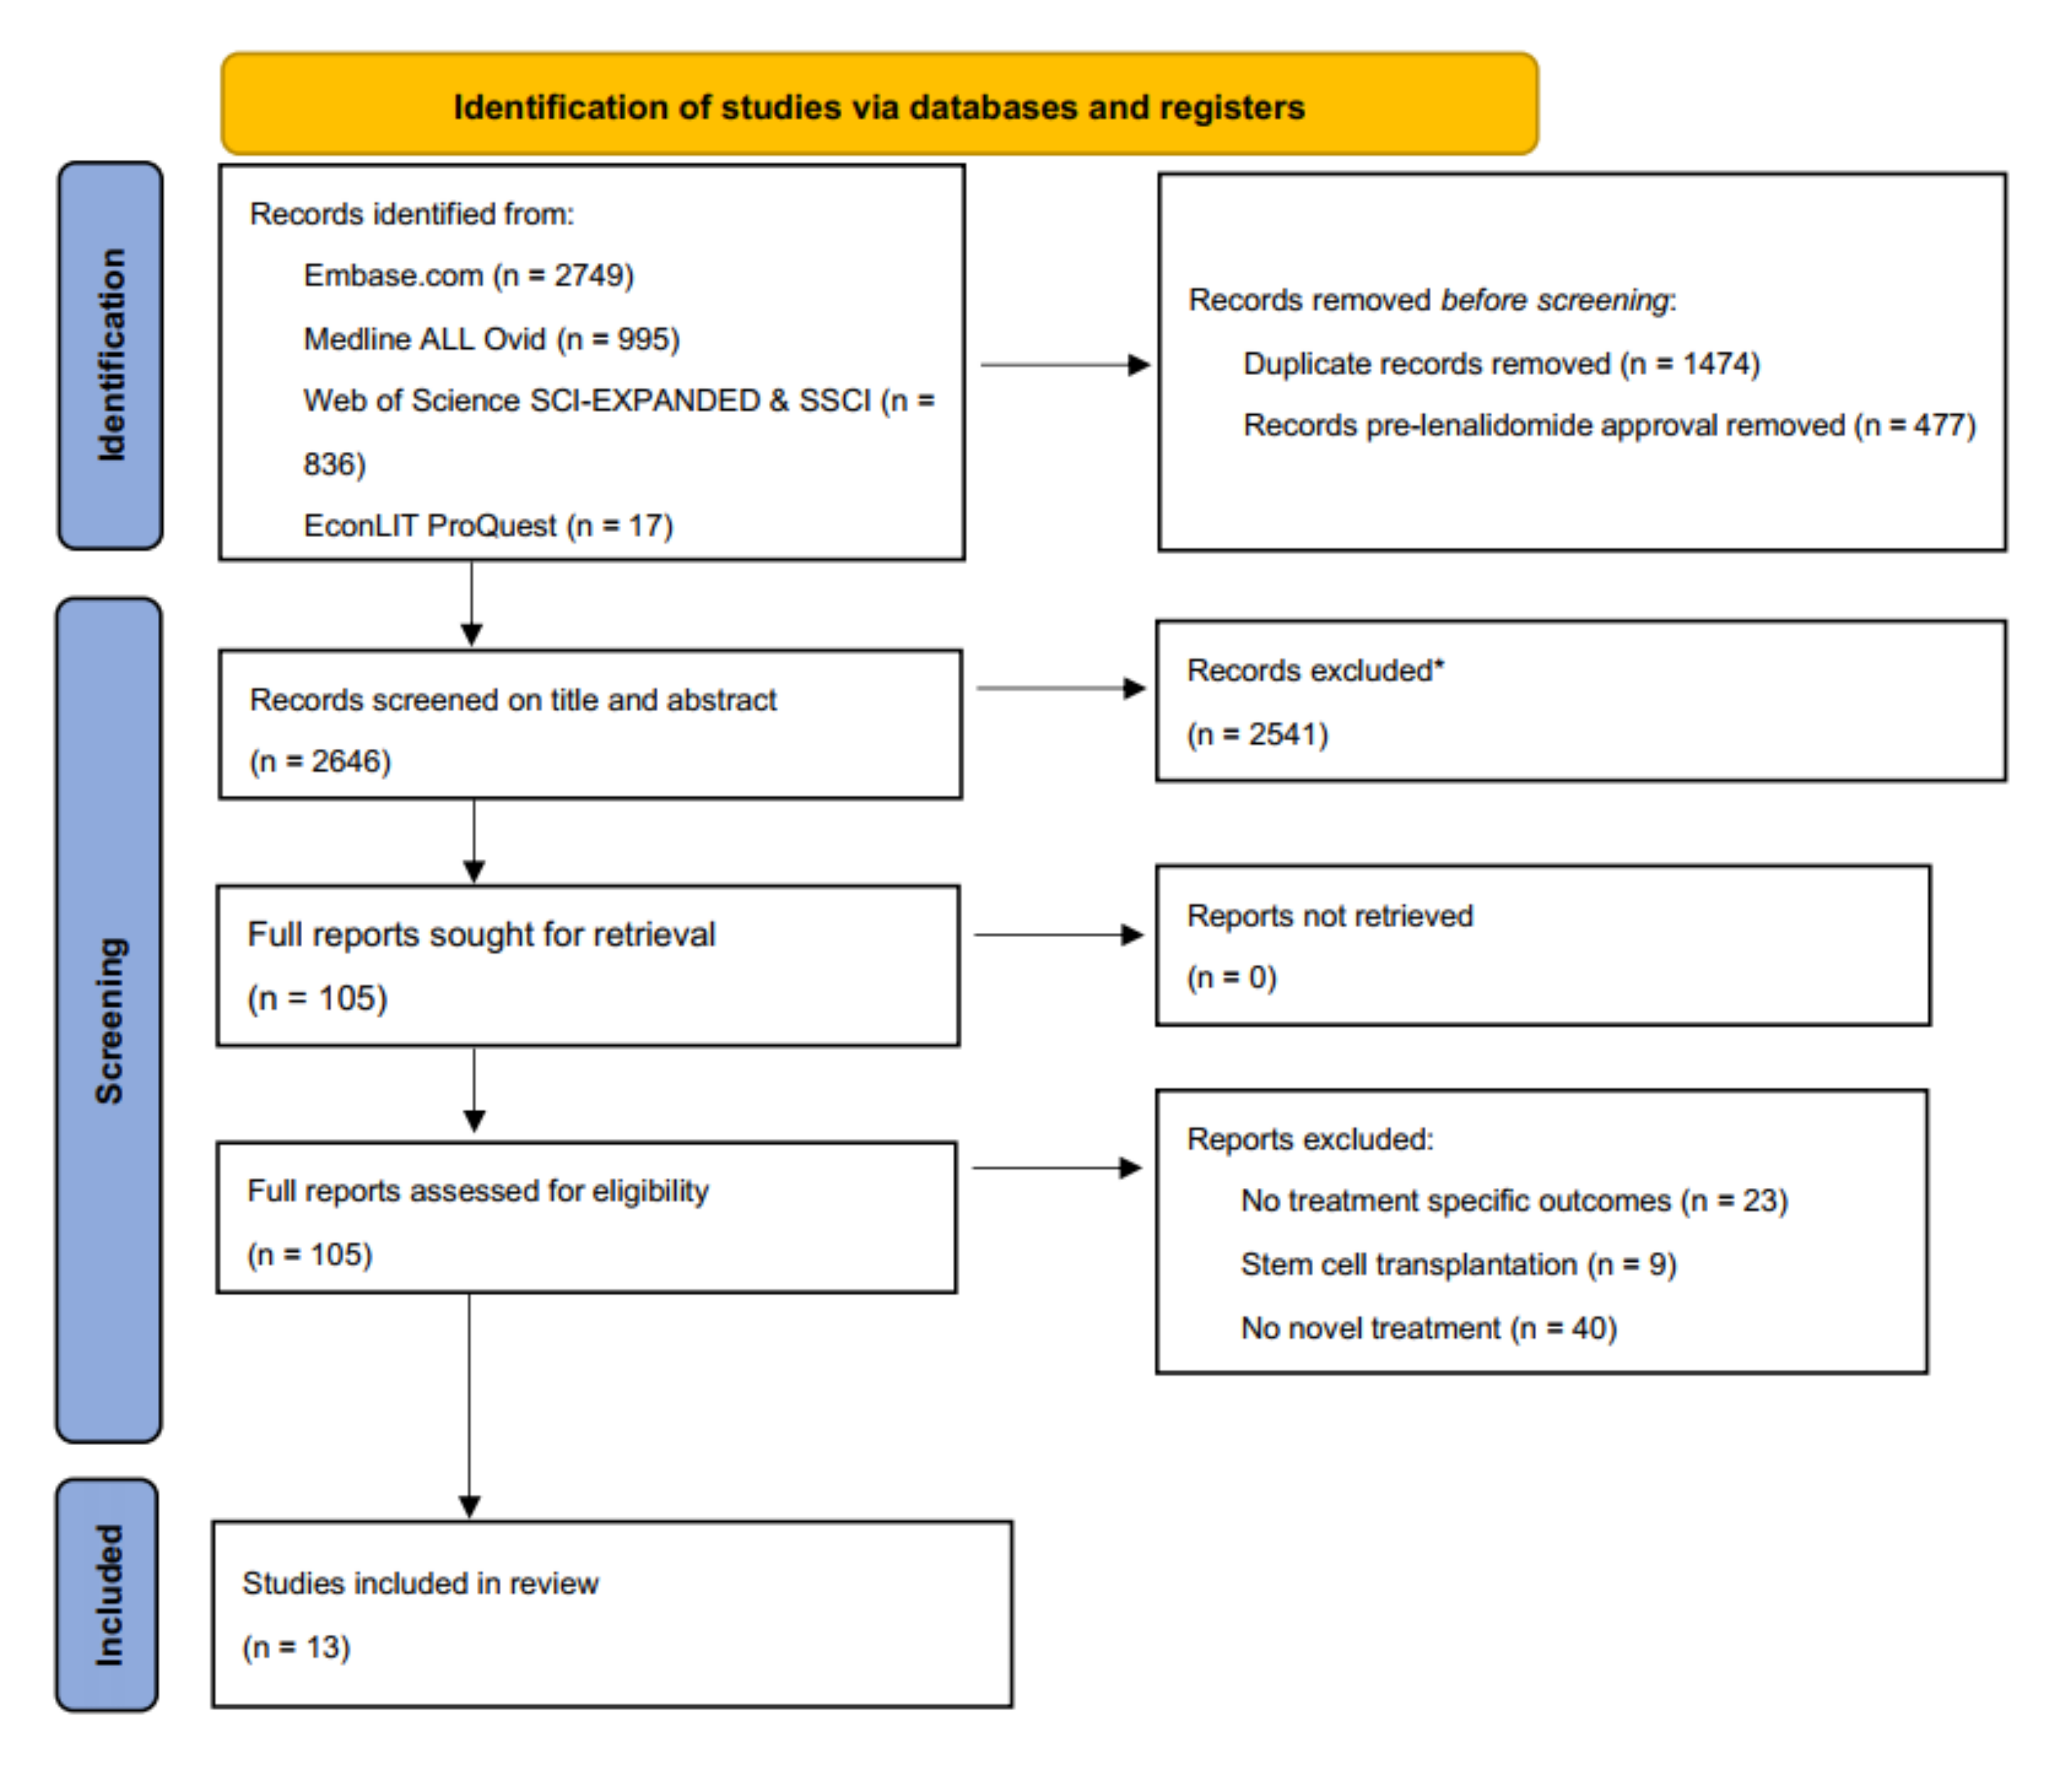
2. Methods
2.1. Eligibility Criteria
2.2. Information Sources and Search Strategy
2.3. Data Extraction
2.4. Quality Assessment
2.5. Reporting Outcomes and Analysis
3. Results
3.1. Study Design and Structural Assumptions
3.2. Model Estimates
3.2.1. Daratumumab
3.2.2. Pomalidomide
3.2.3. Carfilzomib
3.2.4. Elotuzumab
3.2.5. Ixazomib
3.2.6. Panobinostat
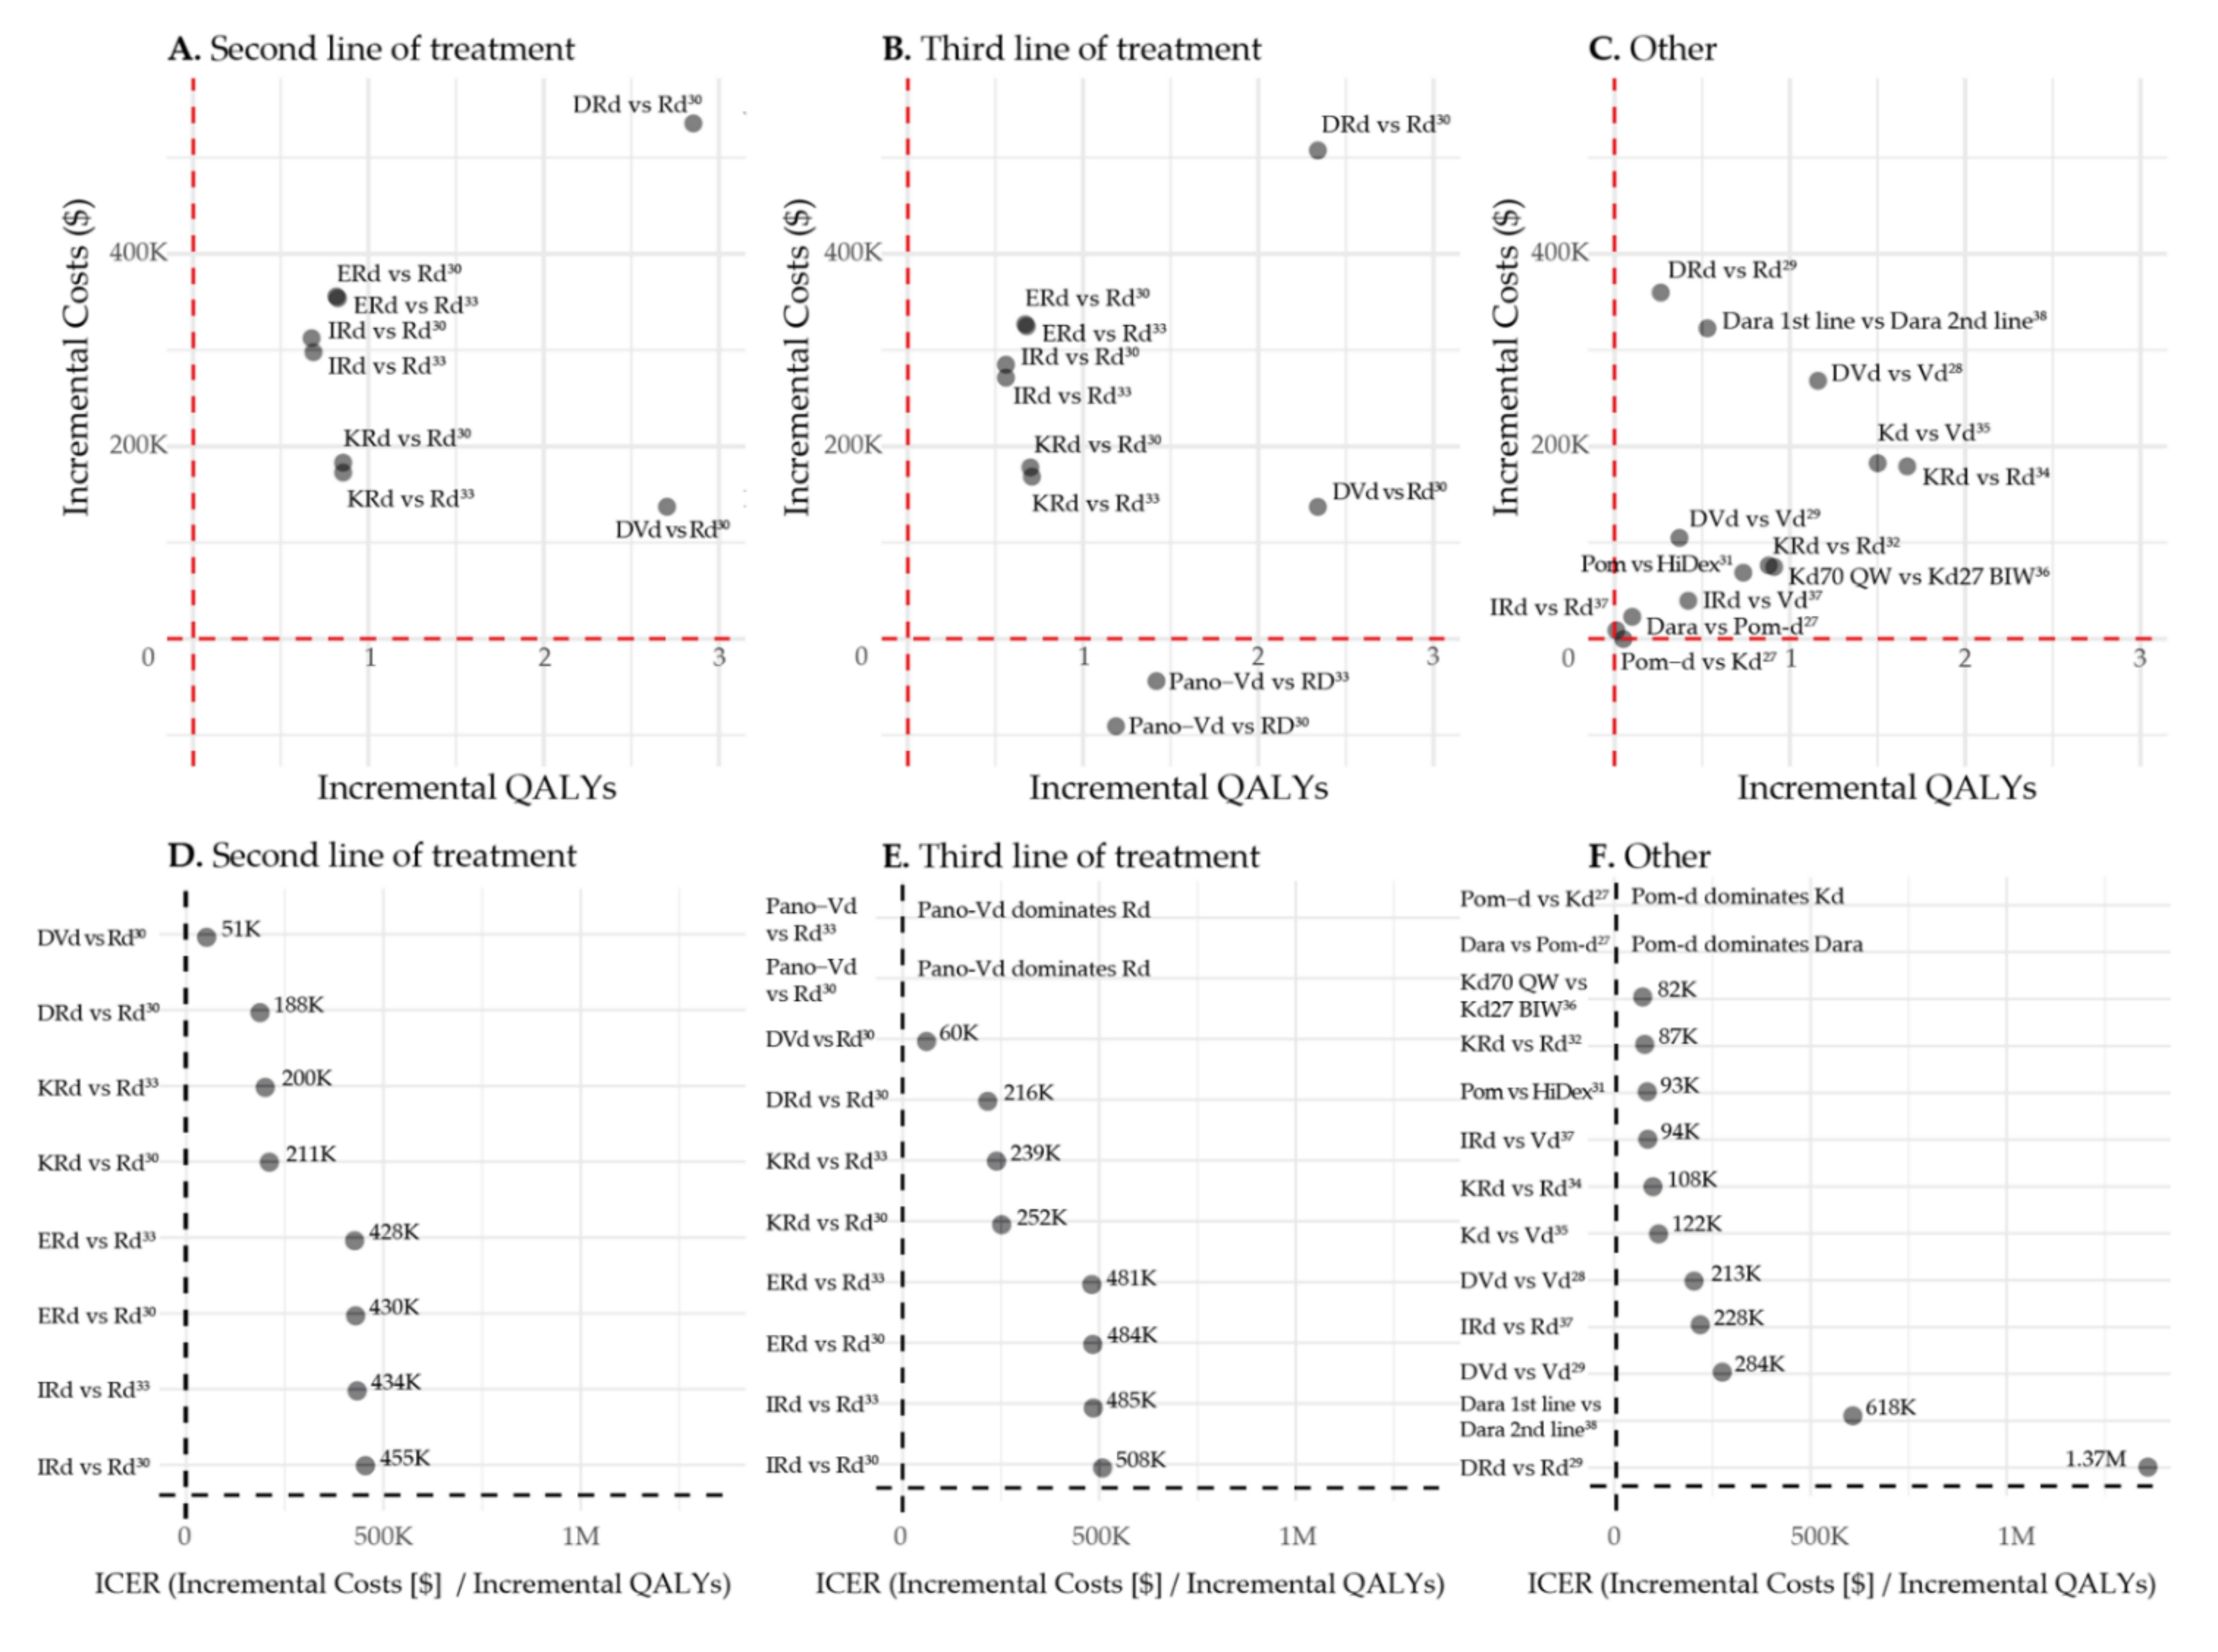
3.3. Second vs. Third Line of Treatment
3.4. First vs. Second Line of Treatment
3.5. Reporting and Quality Assessment
4. Discussion
5. Conclusions
Supplementary Materials
Author Contributions
Funding
Acknowledgments
Conflicts of Interest
References
- Thorsteinsdottir, S.; Dickman, P.W.; Landgren, O.; Blimark, C.; Hultcrantz, M.; Turesson, I.; Björkholm, M.; Kristinsson, S.Y. Dramatically improved survival in multiple myeloma patients in the recent decade: Results from a Swedish population-based study. Haematologica 2018, 103, e412–e415. [Google Scholar] [CrossRef] [Green Version]
- Orlowski, R.Z.; Moreau, P.; Niesvizky, R.; Ludwig, H.; Oriol, A.; Chng, W.J.; Goldschmidt, H.; Yang, Z.; Kimball, A.S.; Dimopoulos, M. Carfilzomib-Dexamethasone versus Bortezomib-Dexamethasone in Relapsed or Refractory Multiple Myeloma: Updated Overall Survival, Safety, and Subgroups. Clin. Lymphoma Myeloma Leuk. 2019, 19, 522–530.e1. [Google Scholar] [CrossRef] [Green Version]
- Dimopoulos, M.; Quach, H.; Mateos, M.V.; Landgren, O.; Leleu, X.; Siegel, D.; Weisel, K.; Yang, H.; Klippel, Z.; Zahlten-Kumeli, A.; et al. Carfilzomib, dexamethasone, and daratumumab versus carfilzomib and dexamethasone for patients with relapsed or refractory multiple myeloma (CANDOR): Results from a randomised, multicentre, open-label, phase 3 study. Lancet 2020, 396, 186–197. [Google Scholar] [CrossRef]
- Richardson, P.G.; Kumar, S.K.; Masszi, T.; Grzasko, N.; Bahlis, N.J.; Hansson, M.; Pour, L.; Sandhu, I.; Ganly, P.; Baker, B.W.; et al. Final Overall Survival Analysis of the TOURMALINE-MM1 Phase III Trial of Ixazomib, Lenalidomide, and Dexamethasone in Patients with Relapsed or Refractory Multiple Myeloma. J. Clin. Oncol. Off. J. Am. Soc. Clin. Oncol. 2021, 39, 2430–2442. [Google Scholar] [CrossRef]
- Bahlis, N.J.; Dimopoulos, M.A.; White, D.J.; Benboubker, L.; Cook, G.; Leiba, M.; Ho, P.J.; Kim, K.; Takezako, N.; Moreau, P.; et al. Daratumumab plus lenalidomide and dexamethasone in relapsed/refractory multiple myeloma: Extended follow-up of POLLUX, a randomized, open-label, phase 3 study. Leukemia 2020, 34, 1875–1884. [Google Scholar] [CrossRef] [PubMed] [Green Version]
- Dimopoulos, M.A.; Lonial, S.; Betts, K.A.; Chen, C.; Zichlin, M.L.; Brun, A.; Signorovitch, J.E.; Makenbaeva, D.; Mekan, S.; Sy, O.; et al. Elotuzumab plus lenalidomide and dexamethasone in relapsed/refractory multiple myeloma: Extended 4-year follow-up and analysis of relative progression-free survival from the randomized ELOQUENT-2 trial. Cancer 2018, 124, 4032–4043. [Google Scholar] [CrossRef]
- Roy, A.; Kish, J.K.; Bloudek, L.; Siegel, D.S.; Jagannath, S.; Globe, D.; Kuriakose, E.T.; Migliaccio-Walle, K. Estimating the Costs of Therapy in Patients with Relapsed and/or Refractory Multiple Myeloma: A Model Framework. Am. Health Drug Benefits 2015, 8, 204–215. [Google Scholar] [PubMed]
- Dinnessen, M.A.W.; Brink, M.; Korf-van Vliet, C.H.; Cardous-Ubbink, M.C.; Sonneveld, P.; Zweegman, S.; van de Donk, N.W.C.J.; Blijlevens, N.M.A.; Cornelissen, J.J.; Posthuma, E.F.M.; et al. Het multipel myeloom in Nederland, 2014–2016. In Landelijk Rapport van het Hemato-Oncologieregister van de Nederlandse Kankerregistratie; Integraal kankercentrum Nederland (IKNL): Utrecht, The Netherlands, 2019. [Google Scholar]
- Van de Donk, N.; Usmani, S.Z. CD38 Antibodies in Multiple Myeloma: Mechanisms of Action and Modes of Resistance. Front. Immunol. 2018, 9, 2134. [Google Scholar] [CrossRef]
- Wang, Y.; Sanchez, L.; Siegel, D.S.; Wang, M.L. Elotuzumab for the treatment of multiple myeloma. J. Hematoly Oncol. 2016, 9, 55. [Google Scholar] [CrossRef] [PubMed] [Green Version]
- International Monetary Fund (IMF). SDRs per Currency Unit for July 2021. Available online: https://www.imf.org/external/np/fin/data/rms_mth.aspx?SelectDate=2021-07-31&reportType=SDRCV (accessed on 13 August 2021).
- Hofmarcher, T.; Lindgren, P.; Wilking, N.; Jönsson, B. The cost of cancer in Europe 2018. Eur. J. Cancer 2020, 129, 41–49. [Google Scholar] [CrossRef] [Green Version]
- World Health Organization. Pricing of Cancer Medicines and Its Impacts; World Health Organization: Geneva, Switzerland, 2018; Available online: https://apps.who.int/iris/bitstream/handle/10665/277190/9789241515115-eng.pdf?sequence=1&isAllowed=y (accessed on 10 April 2020).
- Cook, R. Economic and clinical impact of multiple myeloma to managed care. J. Manag. Care Plus Spec. Pharm. 2008, 14, 19–25. [Google Scholar] [CrossRef] [Green Version]
- Asrar, M.M.; Lad, D.P.; Prinja, S.; Bansal, D. A systematic review of economic evaluations of treatment regimens in multiple myeloma. Expert Rev. Pharm. Outcomes Res. 2020, 21, 799–809. [Google Scholar] [CrossRef] [PubMed]
- Rajkumar, S.V. Value and Cost of Myeloma Therapy. Am. Soc. Clin. Oncol. Educ. Book 2018, 38, 662–666. [Google Scholar] [CrossRef] [PubMed]
- Fonseca, R.; Abouzaid, S.; Bonafede, M.; Cai, Q.; Parikh, K.; Cosler, L.; Richardson, P. Trends in overall survival and costs of multiple myeloma, 2000–2014. Leukemia 2017, 31, 1915–1921. [Google Scholar] [CrossRef] [Green Version]
- Fu, S.; Wu, C.F.; Wang, M.; Lairson, D.R. Cost Effectiveness of Transplant, Conventional Chemotherapy, and Novel Agents in Multiple Myeloma: A Systematic Review. Pharmacoeconomics 2019, 37, 1421–1449. [Google Scholar] [CrossRef]
- Aguiar, P.M.; Lima, T.M.; Storpirtis, S. Systematic review of the economic evaluations of novel therapeutic agents in multiple myeloma: What is the reporting quality? J. Clin. Pharm. Ther. 2016, 41, 189–197. [Google Scholar] [CrossRef] [Green Version]
- Picot, J.; Cooper, K.; Bryant, J.; Clegg, A.J. The clinical effectiveness and cost-effectiveness of bortezomib and thalidomide in combination regimens with an alkylating agent and a corticosteroid for the first-line treatment of multiple myeloma: A systematic review and economic evaluation. Health Technol. Assess. 2011, 15, 1–204. [Google Scholar] [CrossRef]
- Gaultney, J.G.; Redekop, W.K.; Sonneveld, P.; Uyl-de Groot, C.A. Critical review of economic evaluations in multiple myeloma: An overview of the economic evidence and quality of the methodology. Eur. J. Cancer 2011, 47, 1458–1467. [Google Scholar] [CrossRef]
- Page, M.J.; McKenzie, J.E.; Bossuyt, P.M.; Boutron, I.; Hoffmann, T.C.; Mulrow, C.D.; Shamseer, L.; Tetzlaff, J.M.; Akl, E.A.; Brennan, S.E.; et al. The PRISMA 2020 statement: An updated guideline for reporting systematic reviews. Int. J. Surg. 2021, 88, 105906. [Google Scholar] [CrossRef] [PubMed]
- Husereau, D.; Drummond, M.; Petrou, S.; Carswell, C.; Moher, D.; Greenberg, D.; Augustovski, F.; Briggs, A.H.; Mauskopf, J.; Loder, E.; et al. Consolidated Health Economic Evaluation Reporting Standards (CHEERS)—Explanation and Elaboration: A Report of the ISPOR Health Economic Evaluations Publication Guidelines Good Reporting Practices Task Force. Value Health 2013, 16, 231–250. Available online: https://www.equator-network.org/wp-content/uploads/2013/04/Revised-CHEERS-Checklist-Oct13.pdf (accessed on 13 August 2021). [CrossRef] [Green Version]
- Hong, D.; Si, L.; Jiang, M.; Shao, H.; Ming, W.K.; Zhao, Y.; Li, Y.; Shi, L. Cost Effectiveness of Sodium-Glucose Cotransporter-2 (SGLT2) Inhibitors, Glucagon-Like Peptide-1 (GLP-1) Receptor Agonists, and Dipeptidyl Peptidase-4 (DPP-4) Inhibitors: A Systematic Review. Pharmacoeconomics 2019, 37, 777–818. [Google Scholar] [CrossRef] [PubMed] [Green Version]
- Gong, C.L.; Studdert, A.L.; Liedtke, M. Daratumumab vs pomalidomide for the treatment of relapsed/refractory multiple myeloma: A cost-effectiveness analysis. Am. J. Hematol. 2019, 94, E68–E70. [Google Scholar] [CrossRef] [PubMed] [Green Version]
- Pelligra, C.G.; Parikh, K.; Guo, S.; Chandler, C.; Mouro, J.; Abouzaid, S.; Ailawadhi, S. Cost-effectiveness of Pomalidomide, Carfilzomib, and Daratumumab for the Treatment of Patients with Heavily Pretreated Relapsed-refractory Multiple Myeloma in the United States. Clin. Ther. 2017, 39, 1986–2005.e5. [Google Scholar] [CrossRef] [Green Version]
- Zeng, X.; Peng, L.; Peng, Y.; Tan, C.; Wan, X. Economic Evaluation of Adding Daratumumab to a Regimen of Bortezomib + Dexamethasone in Relapsed or Refractory Multiple Myeloma: Based on the Latest Updated Analysis of CASTOR. Clin. Ther. 2020, 42, 251–262.e5. [Google Scholar] [CrossRef] [PubMed]
- Zhang, T.T.; Wang, S.; Wan, N.; Zhang, L.; Zhang, Z.; Jiang, J. Cost-effectiveness of Daratumumab-based Triplet Therapies in Patients with Relapsed or Refractory Multiple Myeloma. Clin. Ther. 2018, 40, 1122–1139. [Google Scholar] [CrossRef] [PubMed]
- Carlson, J.J.; Guzauskas, G.F.; Chapman, R.H.; Synnott, P.G.; Liu, S.; Russo, E.T.; Pearson, S.D.; Brouwer, E.D.; Ollendorf, D.A. Cost-effectiveness of Drugs to Treat Relapsed/Refractory Multiple Myeloma in the United States. J. Manag. Care Spec. Pharm. 2018, 24, 29–38. [Google Scholar] [CrossRef] [PubMed]
- Borg, S.; Nahi, H.; Hansson, M.; Lee, D.; Elvidge, J.; Persson, U. Cost effectiveness of pomalidomide in patients with relapsed and refractory multiple myeloma in Sweden. Acta Oncol. 2016, 55, 554–560. [Google Scholar] [CrossRef] [Green Version]
- Campioni, M.; Agirrezabal, I.; Hajek, R.; Minarik, J.; Pour, L.; Spicka, I.; Gonzalez-McQuire, S.; Jandova, P.; Maisnar, V. Methodology and results of real-world cost-effectiveness of carfilzomib in combination with lenalidomide and dexamethasone in relapsed multiple myeloma using registry data. Eur. J. Health Econ. 2020, 21, 219–233. [Google Scholar] [CrossRef] [Green Version]
- Djatche, L.M.; Goble, J.A.; Chun, G.; Varga, S. Evaluating Oncology Value-Based Frameworks in the U.S. Marketplace and Challenges in Real-World Application: A Multiple Myeloma Test Case. J. Manag. Care Spec. Pharm. 2018, 24, 39–46. [Google Scholar] [CrossRef]
- Ollendorf, D.A.; Chapman, R.; Khan, S.; Russo, E.T.; Synnot, P.G.; Pearson, S.D.; Carlson, J.J.; Guzauskas, G.F. Treatment Options for Relapsed or Refractory Multiple Myeloma: Effectiveness, Value, and Value-Based Price Benchmarks, Evidence Report. Institute for Clinical and Economic Review. 2016. Available online: https://icer.org/wp-content/uploads/2020/10/MWCEPAC_MM_Evidence_Report_050516-1.pdf (accessed on 10 June 2021).
- Jakubowiak, A.J.; Campioni, M.; Benedict, Á.; Houisse, I.; Tichy, E.; Giannopoulou, A.; Aggarwal, S.K.; Barber, B.L.; Panjabi, S. Cost-effectiveness of adding carfilzomib to lenalidomide and dexamethasone in relapsed multiple myeloma from a US perspective. J. Med. Econ. 2016, 19, 1061–1074. [Google Scholar] [CrossRef] [Green Version]
- Jakubowiak, A.J.; Houisse, I.; Májer, I.; Benedict, Á.; Campioni, M.; Panjabi, S.; Ailawadhi, S. Cost-effectiveness of carfilzomib plus dexamethasone compared with bortezomib plus dexamethasone for patients with relapsed or refractory multiple myeloma in the United States. Expert Rev. Hematol. 2017, 10, 1107–1119. [Google Scholar] [CrossRef] [PubMed]
- Kumar, S.K.; Majer, I.; Panjabi, S.; Medhekar, R.; Campioni, M.; Dimopoulos, M.A. Cost-effectiveness of once weekly carfilzomib 70 mg/m2 plus dexamethasone in patients with relapsed and refractory multiple myeloma in the United States. Expert Rev. Hematol. 2020, 13, 687–696. [Google Scholar] [CrossRef] [PubMed]
- Cai, H.; Zhang, L.; Li, N.; Zheng, B.; Liu, M. Cost-effectiveness analysis on binary/triple therapy on the basis of ixazomib or bortezomib for refractory or relapsed multiple myeloma. Leuk. Lymphoma 2019, 60, 2951–2959. [Google Scholar] [CrossRef]
- Patel, K.K.; Giri, S.; Parker, T.L.; Bar, N.; Neparidze, N.; Huntington, S.F. Cost-Effectiveness of First-Line Versus Second-Line Use of Daratumumab in Older, Transplant-Ineligible Patients With Multiple Myeloma. J. Clin. Oncol. Off. J. Am. Soc. Clin. Oncol. 2021, 39, 1119–1128. [Google Scholar] [CrossRef] [PubMed]
- Richardson, P.G.; Siegel, D.S.; Vij, R.; Hofmeister, C.C.; Baz, R.; Jagannath, S.; Chen, C.; Lonial, S.; Jakubowiak, A.; Bahlis, N.; et al. Pomalidomide alone or in combination with low-dose dexamethasone in relapsed and refractory multiple myeloma: A randomized phase 2 study. Blood 2014, 123, 1826–1832. [Google Scholar] [CrossRef]
- Lonial, S.; Weiss, B.M.; Usmani, S.Z.; Singhal, S.; Chari, A.; Bahlis, N.J.; Belch, A.; Krishnan, A.; Vescio, R.A.; Mateos, M.V.; et al. Daratumumab monotherapy in patients with treatment-refractory multiple myeloma (SIRIUS): An open-label, randomised, phase 2 trial. Lancet 2016, 387, 1551–1560. [Google Scholar] [CrossRef]
- Spencer, A.; Lentzsch, S.; Weisel, K.; Avet-Loiseau, H.; Mark, T.M.; Spicka, I.; Masszi, T.; Lauri, B.; Levin, M.D.; Bosi, A.; et al. Daratumumab plus bortezomib and dexamethasone versus bortezomib and dexamethasone in relapsed or refractory multiple myeloma: Updated analysis of CASTOR. Haematologica 2018, 103, 2079–2087. [Google Scholar] [CrossRef] [Green Version]
- Weber, D.M.; Chen, C.; Niesvizky, R.; Wang, M.; Belch, A.; Stadtmauer, E.A.; Siegel, D.; Borrello, I.; Rajkumar, S.V.; Chanan-Khan, A.A.; et al. Lenalidomide plus dexamethasone for relapsed multiple myeloma in North America. N. Engl. J. Med. 2007, 357, 2133–2142. [Google Scholar] [CrossRef]
- Dimopoulos, M.; Spencer, A.; Attal, M.; Prince, H.M.; Harousseau, J.L.; Dmoszynska, A.; San Miguel, J.; Hellmann, A.; Facon, T.; Foà, R.; et al. Lenalidomide plus dexamethasone for relapsed or refractory multiple myeloma. N. Engl. J. Med. 2007, 357, 2123–2132. [Google Scholar] [CrossRef] [Green Version]
- Dimopoulos, M.A.; Oriol, A.; Nahi, H.; San-Miguel, J.; Bahlis, N.J.; Usmani, S.Z.; Rabin, N.; Orlowski, R.Z.; Komarnicki, M.; Suzuki, K.; et al. Daratumumab, Lenalidomide, and Dexamethasone for Multiple Myeloma. N. Engl. J. Med. 2016, 375, 1319–1331. [Google Scholar] [CrossRef] [Green Version]
- Morgan, G.; Palumbo, A.; Dhanasiri, S.; Lee, D.; Weisel, K.; Facon, T.; Delforge, M.; Oriol, A.; Zaki, M.; Yu, X.; et al. Overall survival of relapsed and refractory multiple myeloma patients after adjusting for crossover in the MM-003 trial for pomalidomide plus low-dose dexamethasone. Br. J. Haematol. 2015, 168, 820–823. [Google Scholar] [CrossRef]
- Siegel, D.S.; Martin, T.; Wang, M.; Vij, R.; Jakubowiak, A.J.; Lonial, S.; Trudel, S.; Kukreti, V.; Bahlis, N.; Alsina, M.; et al. A phase 2 study of single-agent carfilzomib (PX-171-003-A1) in patients with relapsed and refractory multiple myeloma. Blood 2012, 120, 2817–2825. [Google Scholar] [CrossRef] [PubMed] [Green Version]
- Stewart, A.K.; Siegel, D.S.; Ludwig, H.; Facon, T.; Goldschmidt, H.; Jakubowiak, A.J.; San-Miguel, J.F.; Obreja, M.; Blaedel, J.; Dimopoulos, M.A. 743 Overal Survival (OS) of Patients with Relapsed/Refractory Multiple Myeloma (RRMM) Treated with Carfilzomib, Lenalidomide, and Dexamethasone (KRd) Versus Lenalidomide and Dexamethasone (Rd): Final Analysis from the Randomized Phase 3 Aspire. In Proceedings of the 59th American Society of Hematology (ASH) Annual Meeting & Exposition, Atlanta, GA, USA, 9–12 December 2017. [Google Scholar]
- Dimopoulos, M.A.; Goldschmidt, H.; Niesvizky, R.; Joshua, D.; Chng, W.J.; Oriol, A.; Orlowski, R.Z.; Ludwig, H.; Facon, T.; Hajek, R.; et al. Carfilzomib or bortezomib in relapsed or refractory multiple myeloma (ENDEAVOR): An interim overall survival analysis of an open-label, randomised, phase 3 trial. Lancet Oncol. 2017, 18, 1327–1337. [Google Scholar] [CrossRef]
- Moreau, P.; Mateos, M.V.; Berenson, J.R.; Weisel, K.; Lazzaro, A.; Song, K.; Dimopoulos, M.A.; Huang, M.; Zahlten-Kumeli, A.; Stewart, A.K. Once weekly versus twice weekly carfilzomib dosing in patients with relapsed and refractory multiple myeloma (A.R.R.O.W.): Interim analysis results of a randomised, phase 3 study. Lancet Oncol. 2018, 19, 953–964. [Google Scholar] [CrossRef]
- Lonial, S.; Dimopoulos, M.; Palumbo, A.; White, D.; Grosicki, S.; Spicka, I.; Walter-Croneck, A.; Moreau, P.; Mateos, M.V.; Magen, H.; et al. Elotuzumab Therapy for Relapsed or Refractory Multiple Myeloma. N. Engl. J. Med. 2015, 373, 621–631. [Google Scholar] [CrossRef] [Green Version]
- Hou, J.; Jin, J.; Xu, Y.; Wu, D.; Ke, X.; Zhou, D.; Lu, J.; Du, X.; Chen, X.; Li, J.; et al. Randomized, double-blind, placebo-controlled phase III study of ixazomib plus lenalidomide-dexamethasone in patients with relapsed/refractory multiple myeloma: China Continuation study. J. Hematol. Oncol. 2017, 10, 137. [Google Scholar] [CrossRef] [PubMed] [Green Version]
- Luo, X.W.; Du, X.Q.; Li, J.L.; Liu, X.P.; Meng, X.Y. Treatment options for refractory/relapsed multiple myeloma: An updated evidence synthesis by network meta-analysis. Cancer Manag. Res. 2018, 10, 2817–2823. [Google Scholar] [CrossRef] [Green Version]
- Moreau, P.; Masszi, T.; Grzasko, N.; Bahlis, N.J.; Hansson, M.; Pour, L.; Sandhu, I.; Ganly, P.; Baker, B.W.; Jackson, S.R.; et al. Oral Ixazomib, Lenalidomide, and Dexamethasone for Multiple Myeloma. N. Engl. J. Med. 2016, 374, 1621–1634. [Google Scholar] [CrossRef]
- San-Miguel, J.F.; Hungria, V.T.; Yoon, S.S.; Beksac, M.; Dimopoulos, M.A.; Elghandour, A.; Jedrzejczak, W.W.; Günther, A.; Nakorn, T.N.; Siritanaratkul, N.; et al. Panobinostat plus bortezomib and dexamethasone versus placebo plus bortezomib and dexamethasone in patients with relapsed or relapsed and refractory multiple myeloma: A multicentre, randomised, double-blind phase 3 trial. Lancet Oncol. 2014, 15, 1195–1206. [Google Scholar] [CrossRef]
- Facon, T.; Kumar, S.; Plesner, T.; Orlowski, R.Z.; Moreau, P.; Bahlis, N.; Basu, S.; Nahi, H.; Hulin, C.; Quach, H.; et al. Daratumumab plus Lenalidomide and Dexamethasone for Untreated Myeloma. N. Engl. J. Med. 2019, 380, 2104–2115. [Google Scholar] [CrossRef]
- Neumann, P.J.; Cohen, J.T.; Weinstein, M.C. Updating cost-effectiveness--the curious resilience of the $50,000-per-QALY threshold. N. Engl. J. Med. 2014, 371, 796–797. [Google Scholar] [CrossRef] [PubMed] [Green Version]
- McDougall, J.A.; Furnback, W.E.; Wang, B.; Mahlich, J. Understanding the global measurement of willingness to pay in health. J. Mark. Access Health Policy 2020, 8, 1717030. [Google Scholar] [CrossRef] [Green Version]
- Zwaap, J.K.S.; van der Meijden, C.; Staal, P.; Van der Heiden, L. Cost-Effectiveness in Practice, Issued to Minister of Health, Welfare and Sport. Zorginstituut Nederland. 2015. Available online: https://english.zorginstituutnederland.nl/binaries/zinl-eng/documents/reports/2015/06/16/cost-effectiveness-in-practice/Cost-effectiveness+in+practice.pdf (accessed on 10 June 2021).
- National Institute for Health and Care Excellence. Guide to the Methods of Technology Appraisal 2013; National Institute for Health and Care Excellence (NICE): London, UK, 2013. [Google Scholar]
- Dias, S.; Welton, N.J.; Sutton, A.J.; Ades, A.E. Evidence synthesis for decision making 1: Introduction. Med. Decis. Mak. 2013, 33, 597–606. [Google Scholar] [CrossRef] [PubMed] [Green Version]
- National Institute for Health and Care Excelence. Evidence Search. Available online: https://www.evidence.nhs.uk/ (accessed on 16 July 2021).
- Tagalag, L. Bristol-Myers Settles Revlimid Patent Suit with India’s Cipla. 2020. Available online: https://www.spglobal.com/marketintelligence/en/news-insights/latest-news-headlines/bristol-myers-settles-revlimid-patent-suit-with-india-s-cipla-61706336 (accessed on 27 October 2021).
- Conrad, R.; Lutter, R. Generic Competition and Drug Prices: New Evidence Linking Greater Generic Competition and Lower Generic Drug Prices; U.S. Food & Drug Administration: Silver Spring, MD, USA, 2019. Available online: https://www.fda.gov/media/133509/download (accessed on 27 October 2021).
- Chari, A.; Romanus, D.; Palumbo, A.; Blazer, M.; Farrelly, E.; Raju, A.; Huang, H.; Richardson, P. Randomized Clinical Trial Representativeness and Outcomes in Real-World Patients: Comparison of 6 Hallmark Randomized Clinical Trials of Relapsed/Refractory Multiple Myeloma. Clin. Lymphoma Myeloma Leuk. 2020, 20, 8–17.e16. [Google Scholar] [CrossRef] [Green Version]
- Richardson, P.G.; San Miguel, J.F.; Moreau, P.; Hajek, R.; Dimopoulos, M.A.; Laubach, J.P.; Palumbo, A.; Luptakova, K.; Romanus, D.; Skacel, T.; et al. Interpreting clinical trial data in multiple myeloma: Translating findings to the real-world setting. Blood Cancer J. 2018, 8, 109. [Google Scholar] [CrossRef] [PubMed] [Green Version]
- Polak, T.B.; van Rosmalen, J.; Uyl-de Groot, C.A. Expanded Access as a source of real-world data: An overview of FDA and EMA approvals. Br. J. Clin. Pharmacol. 2020, 86, 1819–1826. [Google Scholar] [CrossRef] [PubMed]
- Bell, H.; Wailoo, A.J.; Hernandez, M.; Grieve, R.; Faria, R.; Gibson, L.; Grimm, S. The Use of Real World Data for the Estimation of Treatment Effects in NICE Decision Making; NICE Decisision Support Unit: Sheffield, UK, 2016. [Google Scholar]
- Faria, R.; Hernández Alava, M.; Manca, A.; Wailoo, A.J. The Use of Observational Data to Inform Estimates of Treatment Effectiveness in Technology Appraisal: Methods for Comparative Individual Patient Data; NICE Decisision Support Unit: Sheffield, UK, 2015. [Google Scholar]

| Study | Comparison | Time Horizon | Model | Valuta/Discount Rate | Perspective | Country | Cost Resources * | Funding |
|---|---|---|---|---|---|---|---|---|
| Gong et al. 2019 [25] | Dara vs. Pom | Lifetime | Markov model | Costs in 2017 USD Discount rate NA | US payer perspective | USA | Empirical data without references | Commercial |
| Pelligra et al. 2017 [26] | Dara vs. Pom-dPom-d vs. Kd | 3 years | Economic model | Costs in 2016 USD Discount rate 3% | US payer perspective | USA | Empirical data with references | Commercial |
| Zeng et al. 2020 [27] | DVd vs. Vd | Lifetime | Markov model | Costs in 2018 USD Discount rate 3% | US payer perspective | China | Empirical data with references | Foundation/government grants |
| Zhang et al. 2018 [28] | DVd vs. Vd DRd vs. Rd | 10 years | Semi-Markov model | Costs in 2017 USD Discount rate 3% | US payer perspective | China | Empirical data with references | Foundation/government grants |
| Carlson et al. 2018 [29] | DVd vs. Rd DRd vs. Rd KRd vs. Rd ERd vs. Rd IRd vs. Rd 2nd and 3rd line Pano-Vd vs. Rd 3rd line | Lifetime | Partition survival model | Costs in 2016 USD Discount rate 3% | US healthcare system perspective | USA | Empirical data with references | Commercial and foundation/government grants |
| Borg et al. 2016 [30] | Pom-d vs. HiDex | Lifetime | Economic model | Costs in 2015 SEK Discount rate 3% | Societal perspective | Sweden | Empirical data with references | Commercial |
| Campioni et al. 2019 [31] | KRd vs. Rd | Lifetime (40 years) | Partition survival model | Costs in 2017 Euro Discount rate 3% | Payer perspective | Czech Republic | Empirical data with references | Commercial |
| Djatche et al. 2018 [32] | KRd vs. Rd ERd vs. Rd IRd vs. Rd | Lifetime | Partition survival model [33] ** | Costs in 2016 USD Discount rate 3% | US healthcare system perspective | USA | Empirical data with references [33] ** | Report: Commercial, foundation/government grants [33] * |
| Jakubowiak et al. 2016 [34] | KRd vs. Rd | Lifetime (30 years) | Partition survival model, “K-GEM” model | Costs in 2015 USD Discount rate 3% | US payer perspective | USA | Empirical data with references | Commercial |
| Jakubowiak et al. 2017 [35] | Kd vs. Vd | Lifetime (30 years) | Partition survival model, “K-GEM” model | Costs in 2015 USD Discount rate 3% | US payer perspective | USA | Empirical data with references | Commercial |
| Kumar et al. 2020 [36] | Kd70 QW vs. Kd27 BIW | Lifetime (30 years) | Partition survival model, “K-GEM” model | Costs in 2018 USD Discount rate 3% | US payer perspective | USA | Empirical data with references | Commercial |
| Cai et al. 2019 [37] | IRd vs. Vd and Rd | Lifetime (10 years) | Markov model | Costs in 2017 USD Discount rate 3% | China’s healthcare system perspective | China | Empirical data with references | Foundation/government grants |
| Patel et al. 2021 [38] | Dara in 1st line vs. Dara in 2nd line | Lifetime | Markov model | Costs in 2020 USD Discount rate 3% | US payer perspective | USA | Empirical data with references | Commercial, foundation/government grants |
| Comparison | Total Costs Regimen * | Life Years | QALYs | Cost/LY Gained | Cost/QALY Gained | Clinical Data | Study |
|---|---|---|---|---|---|---|---|
| Dara vs. Pom | NA | NA | NA | NA | USD 156,385 | Prior LOTs: NA | Gong et al. 2019 [25] |
| Dara vs. Pom-d | Dara: USD 139,843 Pom-d: USD 130,924 Incr: USD 8,919 | Dara: 1.41 Pom-d: 1.43 Incr: 0.02 | Dara: 0.98 Pom-d: 0.99 Incr: 0.01 | Pom-d dominates Dara (i.e., more effective and less costly) | Pom-d dominates Dara (i.e., more effective and less costly) | Median prior LOTs: 5 MM-002 and SIRIUS trials [39,40] | Pelligra et al. 2017 [26] |
| DVd vs. Vd | DVd: USD 399,506 Vd: USD 131,091 Incr: USD 268,415 | DVd: 2.887 Vd: 1.242 Incr 1.645 | DVd: 2.206 Vd: 0.947 Incr: 1.159 | USD 163,184 | USD 213,164 | Minimally 1 prior LOT Median prior LOTs: 2 CASTOR trial [41] | Zeng et al. 2020 [27] |
| DVd vs. Vd | DVd: USD 462,340 Vd: USD 357,217 Incr: USD 105,123 | DVd: 2.169 Vd: 1.743 Incr: 0.426 | DVd: 1.655 Vd: 1.285 Incr: 0.37 | USD 246,767.61 | USD 284,180 | Minimally 1 prior LOT Median prior LOTs: 2 CASTOR trial [41] | Zhang et al. 2018 [28] |
| DVd vs. Rd 2nd and 3rd line | DVd 2nd line: USD 447,182 Rd 2nd line: USD 309,997 Incr 2nd line: USD 137,185 DVd 3rd line: USD 423,119 Rd 3rd line: USD 281,754 Incr 3rd line: USD 141,365 | 2nd line: DVd: 7.11 Rd: 3.53 Incr: 3.58 3rd line: DVd: 6.71 Rd: 3.25 Incr: 3.46 | 2nd line: DVd: 5.29 Rd: 2.59 Incr: 2.70 3rd line: DVd: 4,38 Rd: 2.04 Incr: 2.34 | 2nd line: USD 38,320 3rd line: USD 40,857 | 2nd line: USD 50,704 3rd line: USD 60,359 | Rd MM-009 and 010 [42,43] DVd CASTOR trial [41] Median prior LOTs: 2 | Carlson et al. 2018 [29] |
| DRd vs. Rd 2nd and 3rd line | DRd 2nd line: USD 845,527 Rd 2nd line: USD 309,997 Incr 2nd line: USD 535,530 DRd 3rd line: USD 789,202 Rd 3rd line: USD 281,754 Incr 3rd line: USD 507,448 | 2nd line: DRd: 7.38 Rd: 3.53 Incr: 3.85 3rd line: DRd: 6.97 Rd: 3.25 Incr: 3.72 | 2nd line: DRd: 5.44 Rd: 2.59 Incr: 2.85 3rd line: DRd: 4.38 Rd: 2.04 Incr: 2.34 | 2nd line: USD 139,099 3rd line: USD 136,411 | 2nd line: USD 187,728 3rd line: USD 216,360 | Rd MM-009 and 010 [42,43] DRd POLLUX trial [44] Median prior LOTs: 1 | Carlson et al. 2018 [29] |
| DRd vs. Rd | DRd: USD 770,614 Rd: USD 410,828 Incr: USD 359,786 | DRd: 2.276 Rd: 1.965 Incr: 0.311 | DRd: 1.772 Rd: 1.509 Incr: 0.263 | USD 1,156,868 | USD 1,369,062 | Minimally 1 prior LOT Median prior LOTs: 1 POLLUX trial [44] | Zhang et al. 2018 [28] |
| Pom-d vs. HiDex | Pom-d: USD 89,618.68 HiDex: USD 21,027.21 Incr: USD 68,591.47 | Pom-d: 2.33 HiDex: 1.12 Incr: 1.21 | Pom-d: 1.3904 HiDex: 0.6553 Incr: 0.7351 | USD 56,687 | USD 93,305 | Average prior LOTs: 5 MM-003 trial [45] | Borg et al. 2016 [30] |
| Pom-d vs. Kd | Pom-d: USD 130,924 Kd: USD 131,119 Incr: −USD 195 | Pom-d: 1.43 Kd: 1.36 Incr: 0.07 | Pom-d: 0.99 Kd: 0.94 Incr: 0.05 | Pom-d dominates Kd (i.e., more effective and less costly) | Pom-d dominates Kd (i.e., more effective and less costly) | Median prior LOTs: 5 MM-002 and PX-171-003-A1 trials [39,46] | Pelligra et al. 2017 [26] |
| KRd vs. Rd | KRd: USD 139,677.39 | KRd: 3.42 | KRd: 2.63 | USD 77,268 | USD 86,939 | ASPIRE [47] (median prior LOTS: 2 (range1–3, 43.1% 1 LOT)) and RMG (Registry of Monoclonal Gammopathies) | Campioni et al. 2019 [31] |
| Rd: USD 63,181.28 | Rd: 2.43 | Rd: 1.75 | |||||
| Incr: USD 76,496.11 | Incr: 0.99 | Incr: 0.88 | |||||
| KRd vs. Rd 2nd and 3rd line | KRd 2nd line: USD 492,872 Rd 2nd line: USD 309,997 Incr 2nd line: USD 182,875 KRd 3rd line: USD 459,868 Rd 3rd line: USD 281,754 Incr 3rd line: USD 178,114 | 2nd line: KRd: 4.71 Rd: 3.53 Incr: 1.18 3rd line: KRd: 4.37 Rd: 3.25 Incr: 1.12 | 2nd line: KRd: 3.45 Rd: 2.59 Incr: 0.86 3rd line: KRd: 2.74 Rd: 2.04 Incr: 0.70 | 2nd line: USD 154,979 3rd line: USD 159,030 | 2nd line: USD 211,458 3rd line: USD 252,293 | Rd MM-009 and 010 [42,43] KRd ASPIRE trial [47] Median prior LOTs: 2 | Carlson et al. 2018 [29] |
| KRd vs. Rd 2nd and 3rd line | KRd 2nd line: USD 457,350 ** Rd 2nd line: USD 284,400 ** Incr: USD 172,951 ** KRd 3rd line: USD 427,027 ** Rd 3rd line: USD 258,609 ** Incr: USD 168,418 ** | 2nd line: KRd: 4.71 (2.34 PFLYs) ** Rd: 3.53 (1.73 PFLYs) ** Incr: 1.17 (0.61 PFLYs) ** 3rd line: KRd: 4.37 (2.12 PFLYs) ** Rd: 3.25 (1.55 PFLYs) ** Incr: 1.12 (0.57 PFLYs) ** | 2nd line: KRd: 3.45 (1.91 QAPFLYs) ** Rd: 2.59 (1.41 QAPFLYs) ** Incr: 0.86 (0.50 QAPFLYs) ** 3rd line: KRd 2.74 (1.37 QAPFLYs) ** Rd: 2.04 (1.00 QAPFLYs) ** Incr: 0.71 (0.37 QAPFLYs) ** | 2nd line: USD 147,821 ** 3rd line: USD 150,373 ** | 2nd line: USD 199,982 3rd line: USD 238,560 | Number of prior LOTs: 1 or 2 Median prior LOTS: 2 ASPIRE trial [47] | Djatche et al. 2018 [32] |
| KRd vs. Rd | KRd: USD 483,845 Rd: USD 304,452 Incr: USD 179,393 | KRd: 7.83 (3.79 PFLYs) Rd: 5.84 (2.59 PFLYs) Incr: 1.99 (1.20 PFLYs) | KRd: 5.88 (3.20 QAPFLYs) Rd: 4.21 (2.13 QAPFLYs) Incr: 1.67 (1.07 QAPFLYs) | USD 89,957 USD 149,834 per PFLY | USD 107,520 USD 167,379 per QAPFLY | 1–3 prior LOTs Median prior LOTS: 2 ASPIRE trial [47] | Jakubowiak et al. 2016 [34] |
| Kd vs. Vd | Kd: USD 508,730 Vd: USD 326,032 Incr: USD 182,699 | Kd: 6.59 (3.21 PFLYs) Vd: 4.93 (1.43 PFLYs) Incr: 1.66 (1.79 PFLYs) | Kd: 5.12 (2.62 QAPFLYs) Vd: 3.62 (1.13 QAPFLYs) Incr: 1.50, (1.50 QAPFLYs) | USD 109,975 USD 102,191 per PFLY | USD 121,828 USD 122,028 per QAPFLY | 1–3 prior lots +/− 50% 1 prior LOT, +/50% 2–3 prior LOTs ENDEAVOR trial [48] | Jakubowiak et al. 2017 [35] |
| Kd70 QW vs. Kd27 BIW | Kd70 QW: USD 449,193 Kd27 BIW: USD 374,335 Incr: USD 74,858 | Kd70QW: 4.17 (1.76 PFLYs) Kd27BIW: 3.07 (1.19 PFLYs) Incr: 1.10 (0.58 PFLYs) | Kd70 QW: 2.93 (1.42 QAPFLYs) Kd27 BIW: 2.02 (0.90 QAPFLYs) Incr: 0.91 (0.52 QAPFLYs) | USD 67,915 USD 129,066 per PFLY | USD 82,257 USD 143,958 per QAPFLY | 2–3 prior LOTs +/− 50% 2LOTs and +/− 50% 3 LOTs ARROW trial [49] | Kumar et al. 2020 [36] |
| ERd vs. Rd 2nd and 3rd line | ERd 2nd line: USD 665,728 Rd 2nd line: USD 309,997 Incr: USD 355,731 ERd 3rd line: USD 608,651 Rd 3rd line: USD 281,754 Incr: USD 326,897 | 2nd line: ERd: 4.66 Rd: 3.53 Incr: 1.13 3rd line: ERd: 4.32 Rd: 3.25 Incr: 1.07 | 2nd line: ERd: 3.41 Rd: 2.59 Incr: 0.82 3rd line: ERd: 2.71 Rd: 2.04 Incr: 0.67 | 2nd line: USD 314,806 3rd line: USD 305,511 | 2nd line: USD 430,009 3rd line: USD 484,168 | Rd MM-009 and 010 [42,43] ERd ELOQUENT-2 trial [50] Median prior LOTs: 2. | Carlson et al. 2018 [29] |
| ERd vs. Rd 2nd and 3rd line | ERd 2nd line: USD 638,144 ** Incr 2nd line: USD 353,744 ** ERd 3rd line: USD 583,531 ** Incr 3rd line: USD 324,922 ** | 2nd line: ERd: 4.66 (2.31 PFLYs) ** Rd: 3.53 (1.73 PFLYs) ** Incr: 1.12 (0.58 PFLYs) ** 3rd line: ERd: 4.32 (2.09 PFLYs) ** Rd: 3.25 (1.55 PFLYs) ** Incr: 1.07 (0.54 PFLYs) ** | 2nd line: ERd: 3.41 (1.89 QAPFLYs) ** Rd: 2.59 (1.41 QAPFLYs) ** Incr: 0.83 (0.58 QAPFLYs) ** 3rd line: ERd: 2.71 (1.36 QAPFLYs) ** Rd: 2.04 (1.00 QAPFLYs) ** Incr: 0.68 (0.35 QAPFLYs) ** | 2nd line: USD 315,843 ** 3rd line: USD 303,665 ** | 2nd line: USD 427,607 3rd line: USD 481,244 | 1–2 prior LOTs Median prior LOTs: 2 ELOQUENT-2 [50] | Djatche et al. 2018 [32] |
| IRd vs. Vd and Rd | IRd: USD 60,413 Incr: Compared with Vd: USD 39,671 Compared with Rd: USD 22,803 | NA | IRd: 0.68 Incr: Compared with Vd: 0.42 Compared with Rd: 0.1 | NA | Compared to Vd: USD 94,455 Compared to Rd: USD 228,030 | Prior LOTs: 1 44% 2 38% 3 17% IRd vs. Rd: Hou et al. 2017 [51] Vd: Luo et al. 2018 [52] | Cai et al. 2019 [37] |
| IRd vs. Rd 2nd and 3rd line | IRd 2nd line: USD 622,378 Rd 2nd line: USD 309,997 Incr: USD 312,381 IRd 3rd line: USD 566,512 Rd 3rd line: USD 281,754 Incr: USD 284,758 | 2nd line: IRd: 4.46 Rd: 3.53 Incr: 0.93 3rd line: IRd: 4.14 Rd: 3.25 Incr: 0.89 | 2nd line: IRd: 3.27 Rd: 2.59 Incr: 0.68 3rd line: IRd: 2.60 Rd: 2.04 Incr: 0.56 | 2nd line: USD 335,894 3rd line: USD 319,953 | 2nd line: USD 454,684 3rd line: USD 508,021 | Rd MM-009 and 010 [42,43] IRd TOURMALINE-MM1 trial [53] Median prior LOTs: 2 | Carlson et al. 2018 [29] |
| IRd vs. Rd 2nd and 3rd line | IRd 2nd line: USD 582,428 * Incr 2nd line: USD 298,028 * IRd 3rd line: USD 530,228 * Incr 3rd line: USD 271,619 * | 2nd line: IRd: 4.46 (2.21 PFLYs) * Rd: 3.53 (1.73 PFLYs) * Incr: 0.93 (0.48 PFLYs) * 3rd line: IRd: 4.14 (2.00 PFLYs) * Rd: 3.25 (1.55 PFLYs) * Incr: 0.89 (0.45 PFLYs) * | 2nd line: IRd 3.27 (1.81 QAPFLYs) * Rd: 2.59 (1.41 QAPFLYs) * Incr: 0.69 (0.39 QAPFLYs) * 3rd line: IRd: 2.60 (1.30 QAPFLYs) * Rd: 2.04 (1.00 QAPFLYs) * Incr: 0.56 (0.29 QAPFLYs) * | 2nd line: USD 320,460 * 3rd line: USD 305,190 * | 2nd line: USD 433,794 3rd line: USD 484,582 | 1–2 prior LOTs TOURMALINE [53] (prior LOTs: 1 61% 2 29% 3 10%) | Djatche et al. 2018 [32] |
| Pano-Vd vs. Rd 3rd line | Pano-Vd 3rd line: USD 190,876 Rd 3rd line: USD 281,754 Incr: −USD 90,878 | Pano-Vd:4.93 Rd: 3.25 Incr: 1.68 | Pano-Vd: 3.23 Rd: 2.04 Incr: 1.19 | Pano-Vd dominates Rd (i.e., more effective and less costly) | Pano-Vd dominates Rd (i.e., more effective and less costly) | Rd MM-009 and 010 [42,43] Pano-Vd PANORAMA-1 trial [54] 1 prior LOT: 51% | Carlson et al. 2018 [29] |
| Pano-Vd vs. Rd 3rd line | Pano-Vd: USD 196,021 ** Incr: −USD 44,084 ** | Pano-Vd: 5.27 (2.59 PFLYs) ** Incr: 2.02 (1.04 PFLYs) ** | Pano-Vd: 3.46 (1.82 QAPFLYs) ** Incr: 1.42 (0.82 QAPFLYs) ** | Pano-Vd dominates Rd (i.e., more effective and less costly) | Pano-Vd dominates Rd (i.e., more effective and less costly) | PANORAMA-1 trial [54] 1 prior LOT: 51% | Djatche et al. 2018 [32] |
| Dara in 1st line vs. Dara in 2nd line | Lifetime healthcare costs when: Dara in 1st line: USD 1,434,937 Dara in 2nd line: USD 1,112,101 Incr: USD 322,836 | Dara 1st line: 7.47 (total of 1st 2 lines) Dara in 2nd line: 6.80 (total of 1st 2 lines) Incr: 0.67 | Dara in 1st line: 4.87 (total of 1st 2 lines) Dara in 2nd line: 4.34 (total of 1st 2 lines) Incr: 0.53 | USD 481,844.78 | USD 618,018 | DRd: Facon et al. (MAIA) 0 prior LOTs [55] DKd: Dimopoulos et al. (CANDOR) median prior LOTs: 2 [3] | Patel et al. 2021 [38] |
Publisher’s Note: MDPI stays neutral with regard to jurisdictional claims in published maps and institutional affiliations. |
© 2021 by the authors. Licensee MDPI, Basel, Switzerland. This article is an open access article distributed under the terms and conditions of the Creative Commons Attribution (CC BY) license (https://creativecommons.org/licenses/by/4.0/).
Share and Cite
Seefat, M.R.; Cucchi, D.G.J.; Dirven, S.; Groen, K.; Zweegman, S.; Blommestein, H.M. A Systematic Review of Cost-Effectiveness Analyses of Novel Agents in the Treatment of Multiple Myeloma. Cancers 2021, 13, 5606. https://doi.org/10.3390/cancers13225606
Seefat MR, Cucchi DGJ, Dirven S, Groen K, Zweegman S, Blommestein HM. A Systematic Review of Cost-Effectiveness Analyses of Novel Agents in the Treatment of Multiple Myeloma. Cancers. 2021; 13(22):5606. https://doi.org/10.3390/cancers13225606
Chicago/Turabian StyleSeefat, Maarten R., David G. J. Cucchi, Stijn Dirven, Kaz Groen, Sonja Zweegman, and Hedwig M. Blommestein. 2021. "A Systematic Review of Cost-Effectiveness Analyses of Novel Agents in the Treatment of Multiple Myeloma" Cancers 13, no. 22: 5606. https://doi.org/10.3390/cancers13225606
APA StyleSeefat, M. R., Cucchi, D. G. J., Dirven, S., Groen, K., Zweegman, S., & Blommestein, H. M. (2021). A Systematic Review of Cost-Effectiveness Analyses of Novel Agents in the Treatment of Multiple Myeloma. Cancers, 13(22), 5606. https://doi.org/10.3390/cancers13225606