
Polycaprolactone Electrospun Scaffolds Produce an Enrichment of Lung Cancer Stem Cells in Sensitive and Resistant EGFRm Lung Adenocarcinoma

 , , , ,
  ,
,  and
and 
Abstract
:Simple Summary
Abstract
1. Introduction
2. Materials and Methods
2.1. Chemicals & Reagents
2.2. Electrospun Scaffolds Manufacturing
2.3. Thermal Analysis
2.3.1. Thermogravimetric Analysis
2.3.2. Differential Scanning Calorimetry
2.3.3. Dynamic Mechanical Analysis
2.4. PCL Electrospun Scaffolds Observation through Scanning Electrone Microscopy
2.5. Weight Degradation Assay
2.6. Protein Adsorption Assay
2.7. Cell Models
2.8. Three-Dimensional Cell Culture
2.9. Nucleus and Cytoplasm Elongation
2.10. Cell Viability Assays
2.11. Quantitative Real-Time PCR Analysis
2.12. Immunoblotting Analysis
2.13. Selection of Patients
2.14. Immunohistochemistry Assay of Tissue Samples
2.15. Data Analysis
3. Results
3.1. Characterization of PCL-ES Scaffolds
3.1.1. Thermal Characterization of PCL-ES Scaffolds
3.1.2. Microarchitecture of PCL-ES Scaffolds
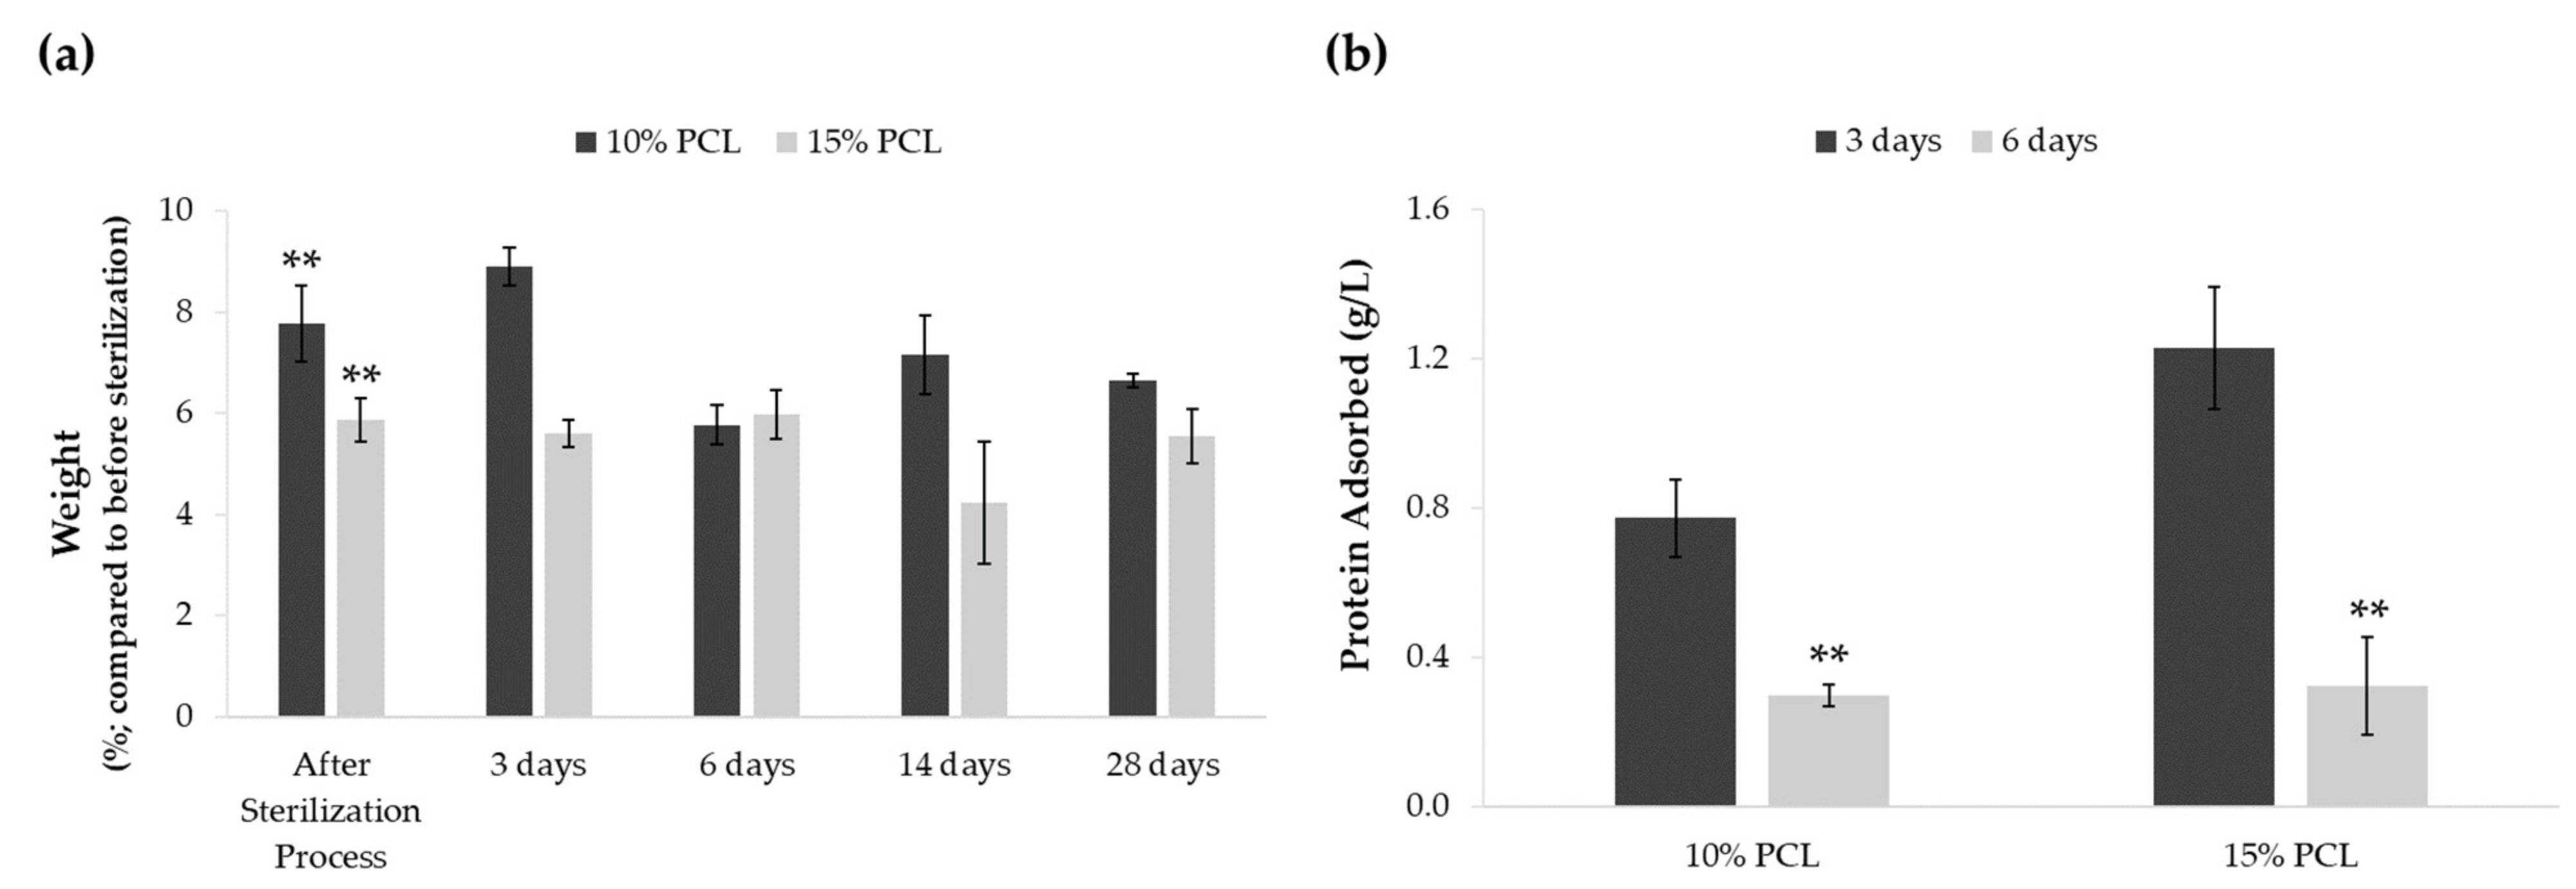
3.1.3. Effect of the Sterilization Process and Medium Immersion on PCL-ES Scaffolds
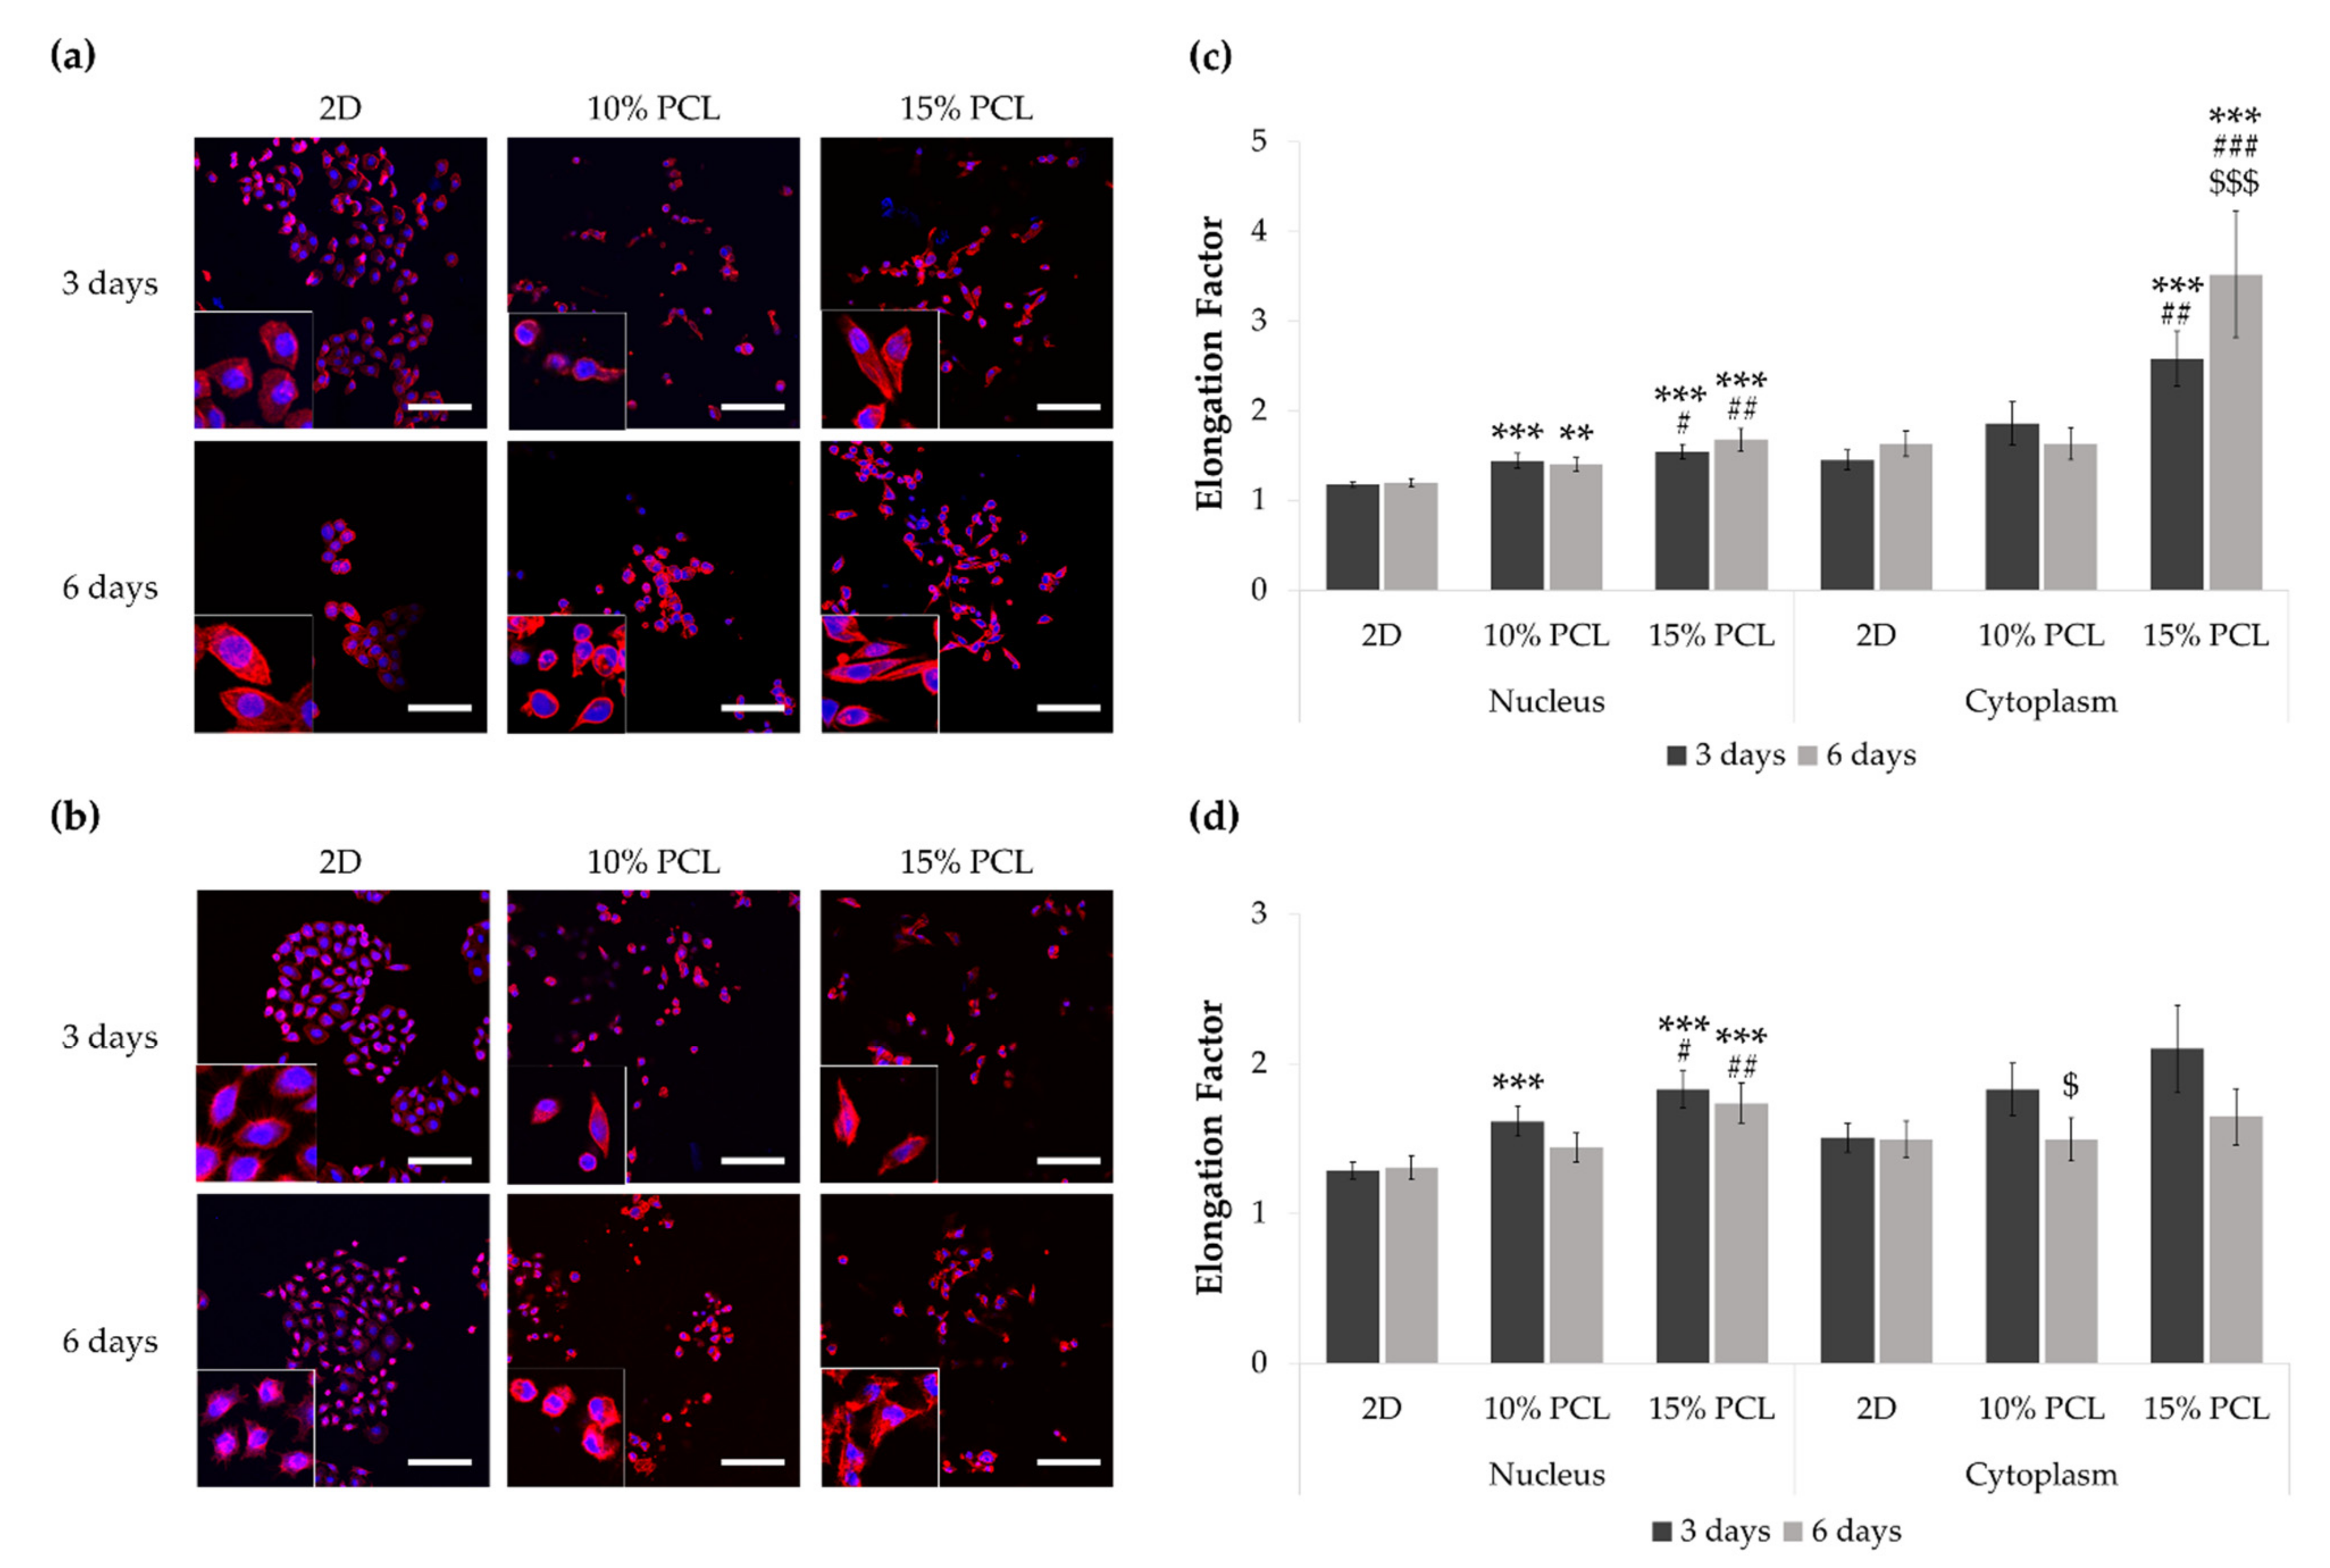
3.2. Morphology of Sensitive and Resistant EGFRm Lung Adenocarcinoma Cell Models Cultured on PCL-ES Scaffolds
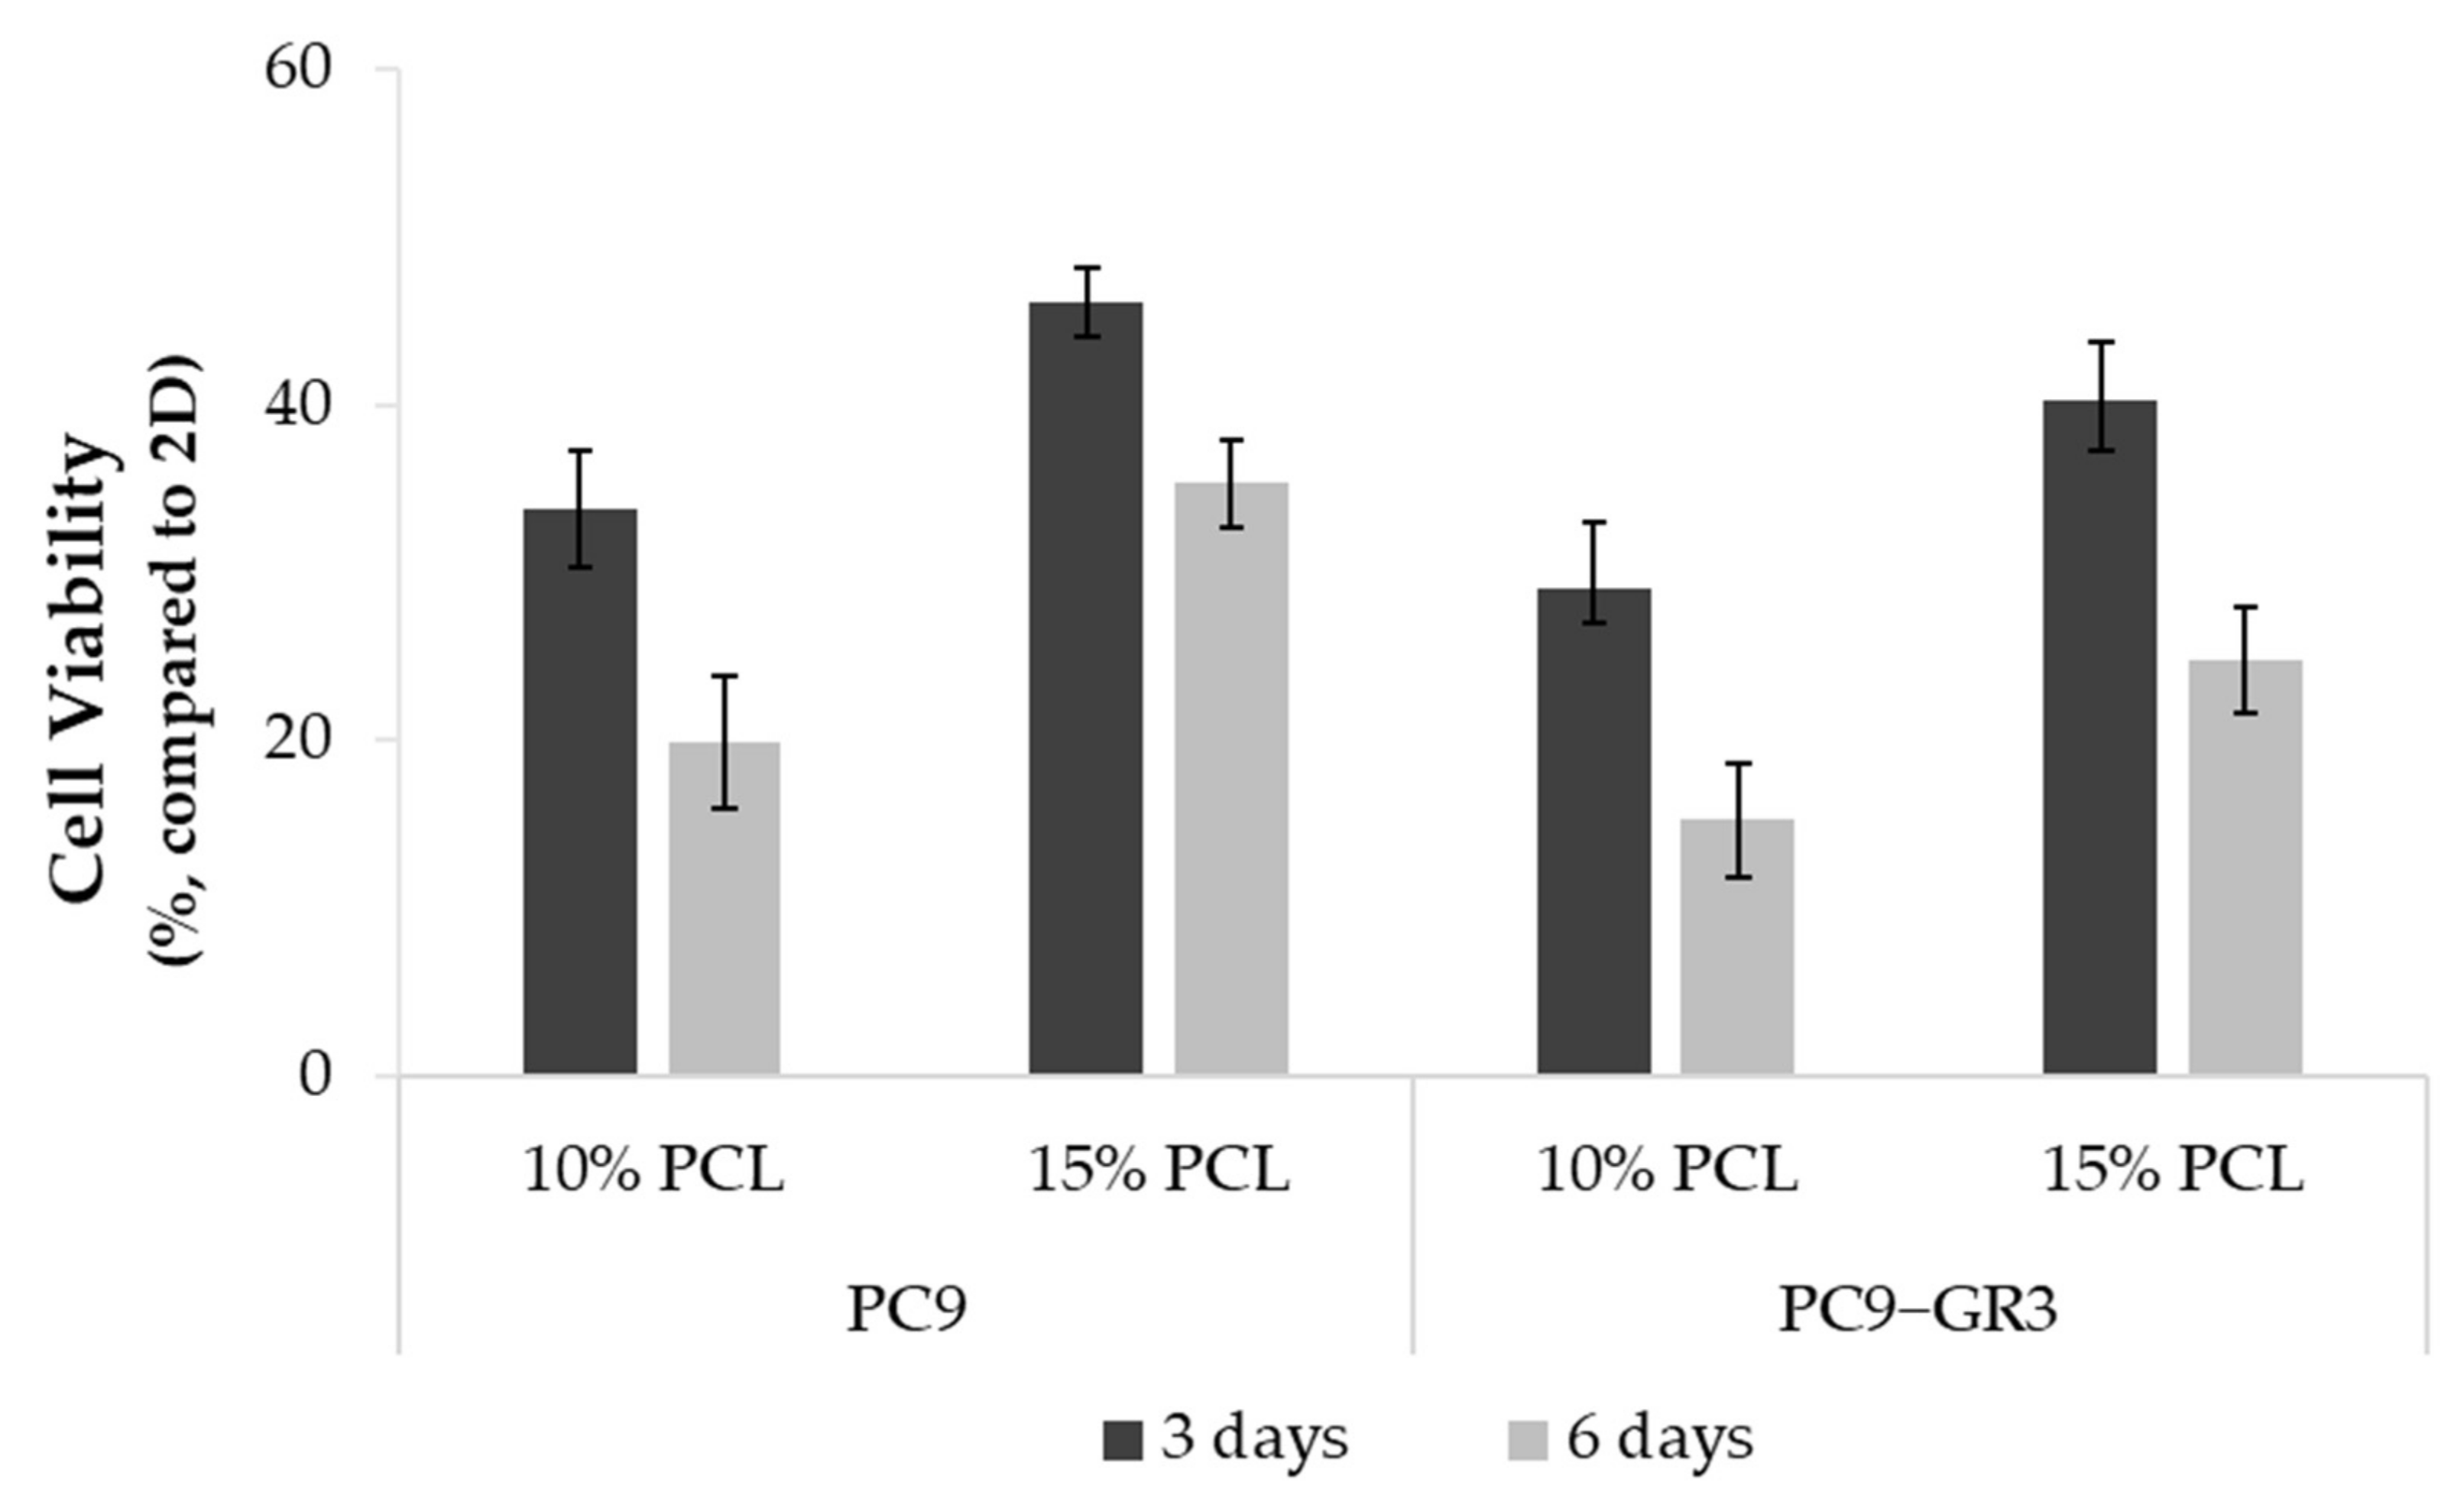
3.3. Viability of Sensitive and Resistant EGFRm Lung Adenocarcinoma Cell Models Cultured on PCL-ES Scaffolds
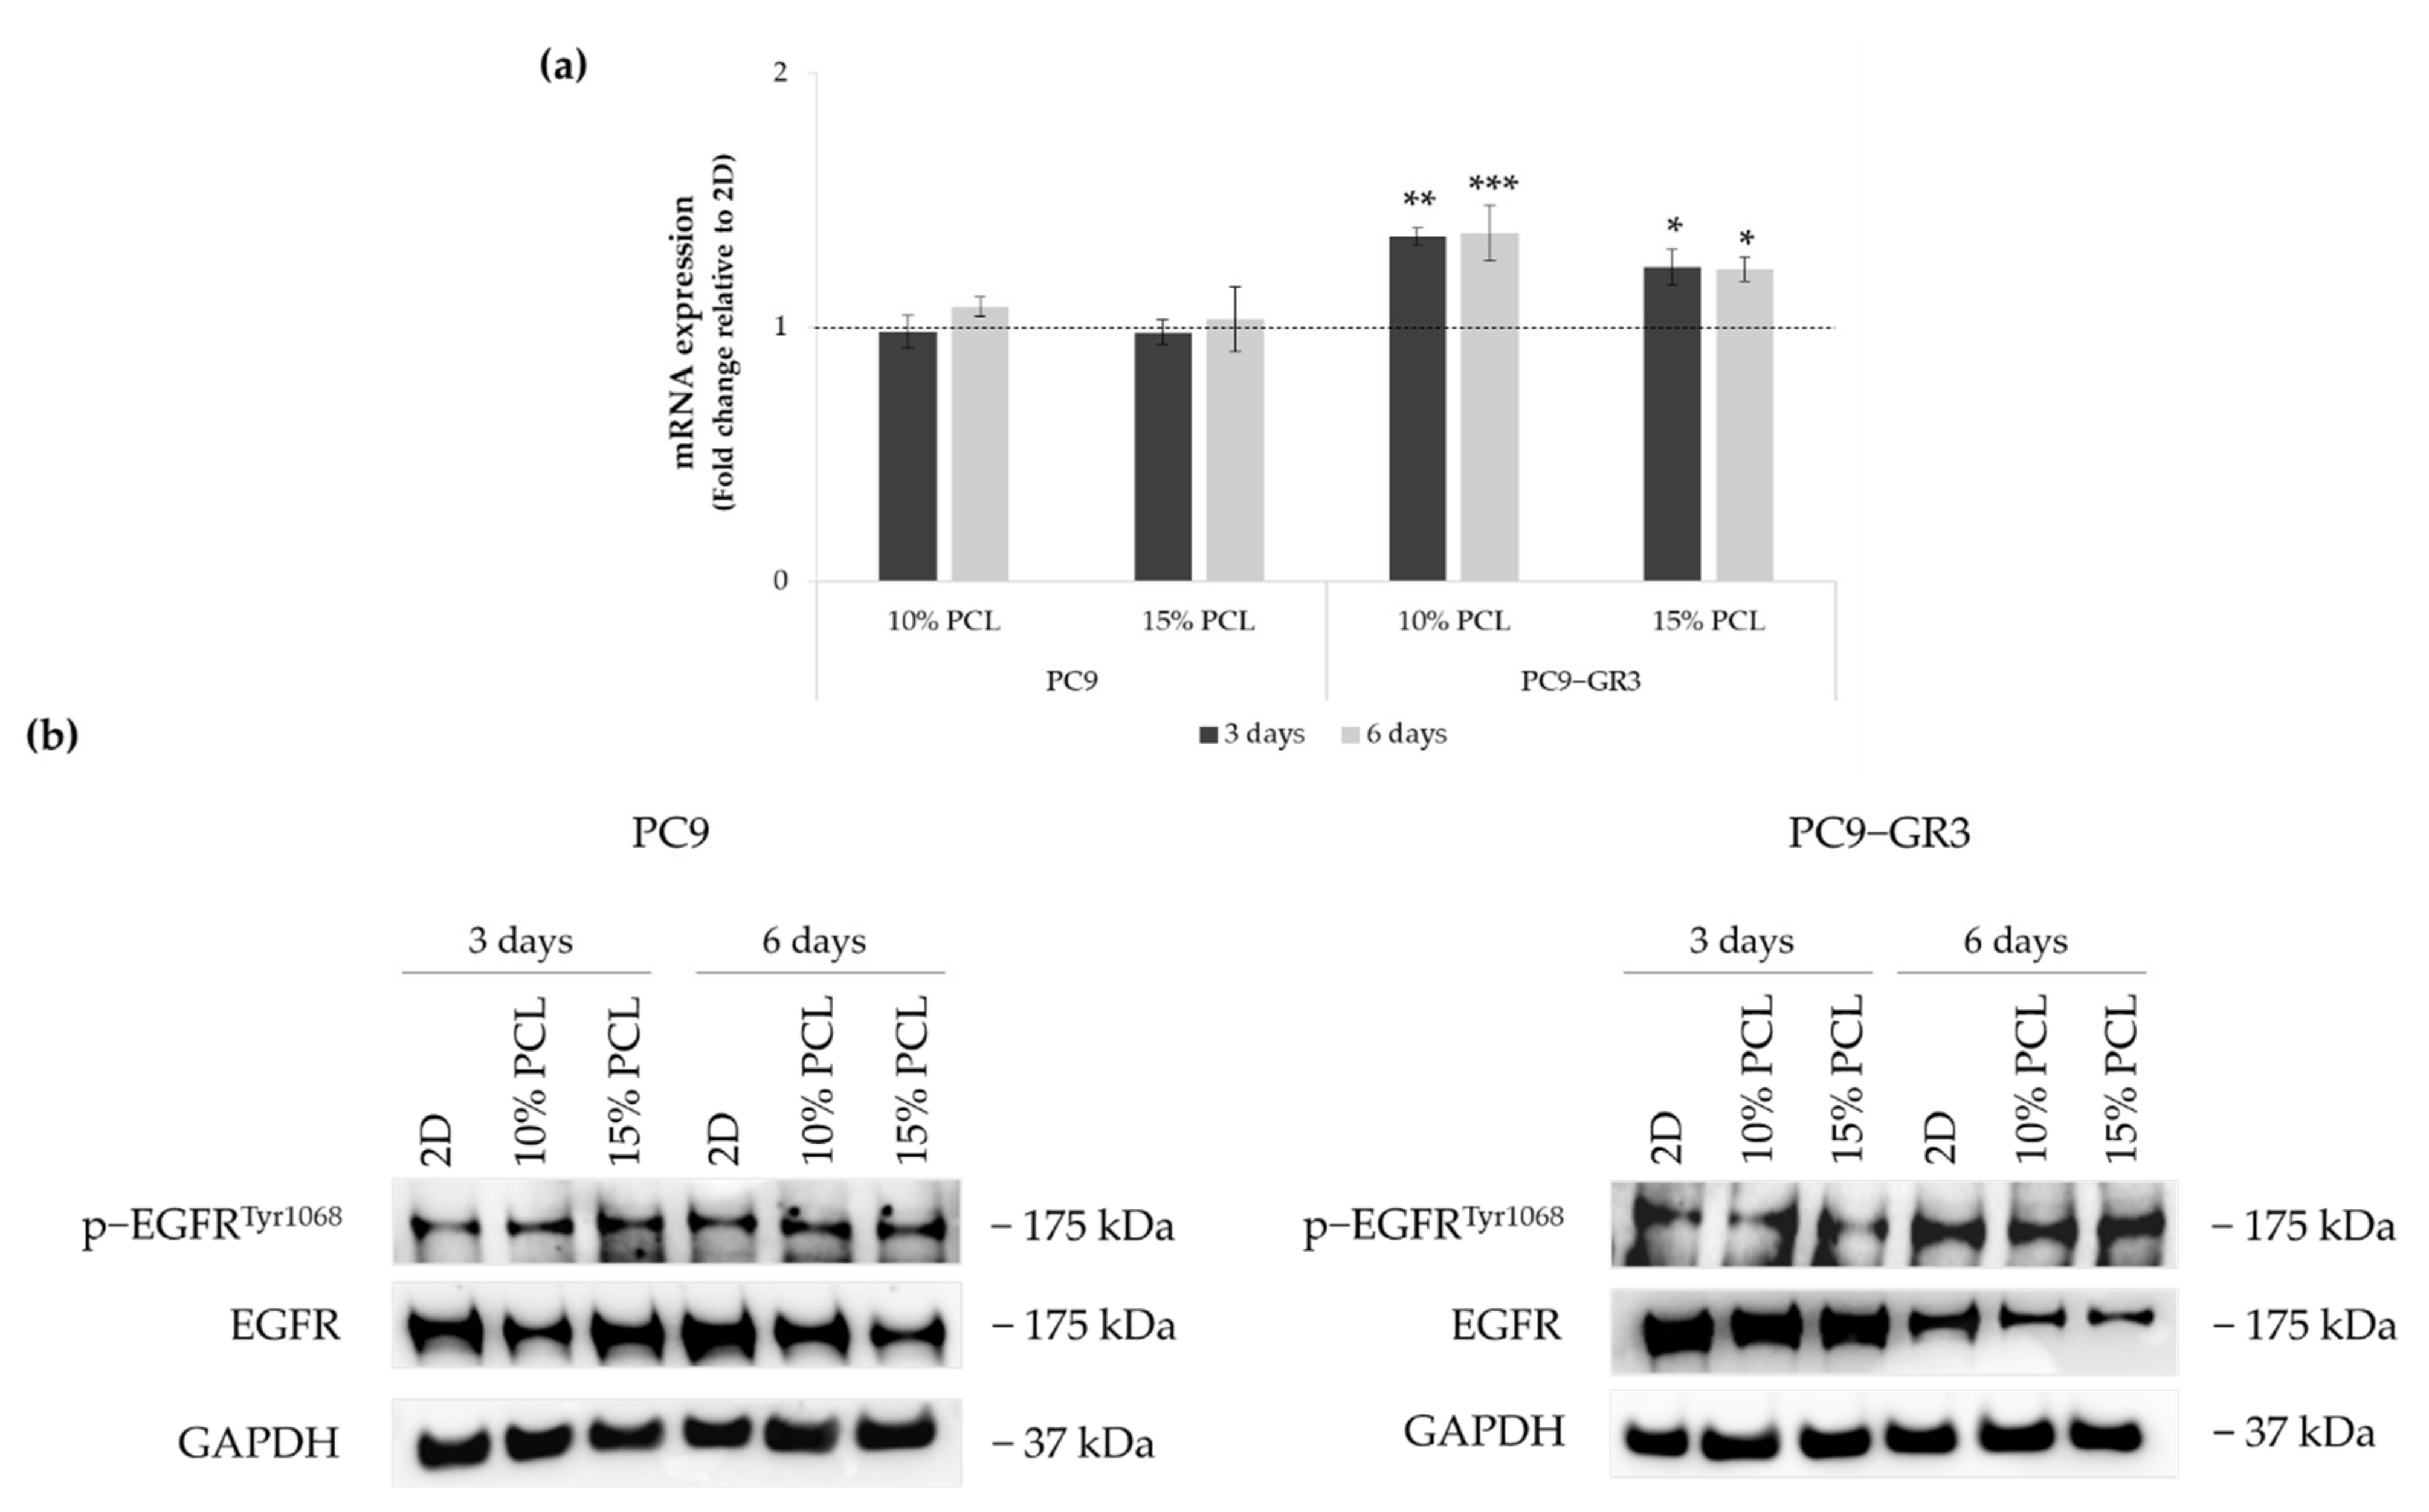
3.4. Evaluation of EGFR Status in Sensitive and Resistant EGFRm Lung Adenocarcinoma Cell Models Cultured on PCL-ES Scaffolds
3.5. Study of LCSC population in Sensitive and Resistant EGFRm Lung Adenocarcinoma Cell Models Cultured on PCL-ES Scaffolds
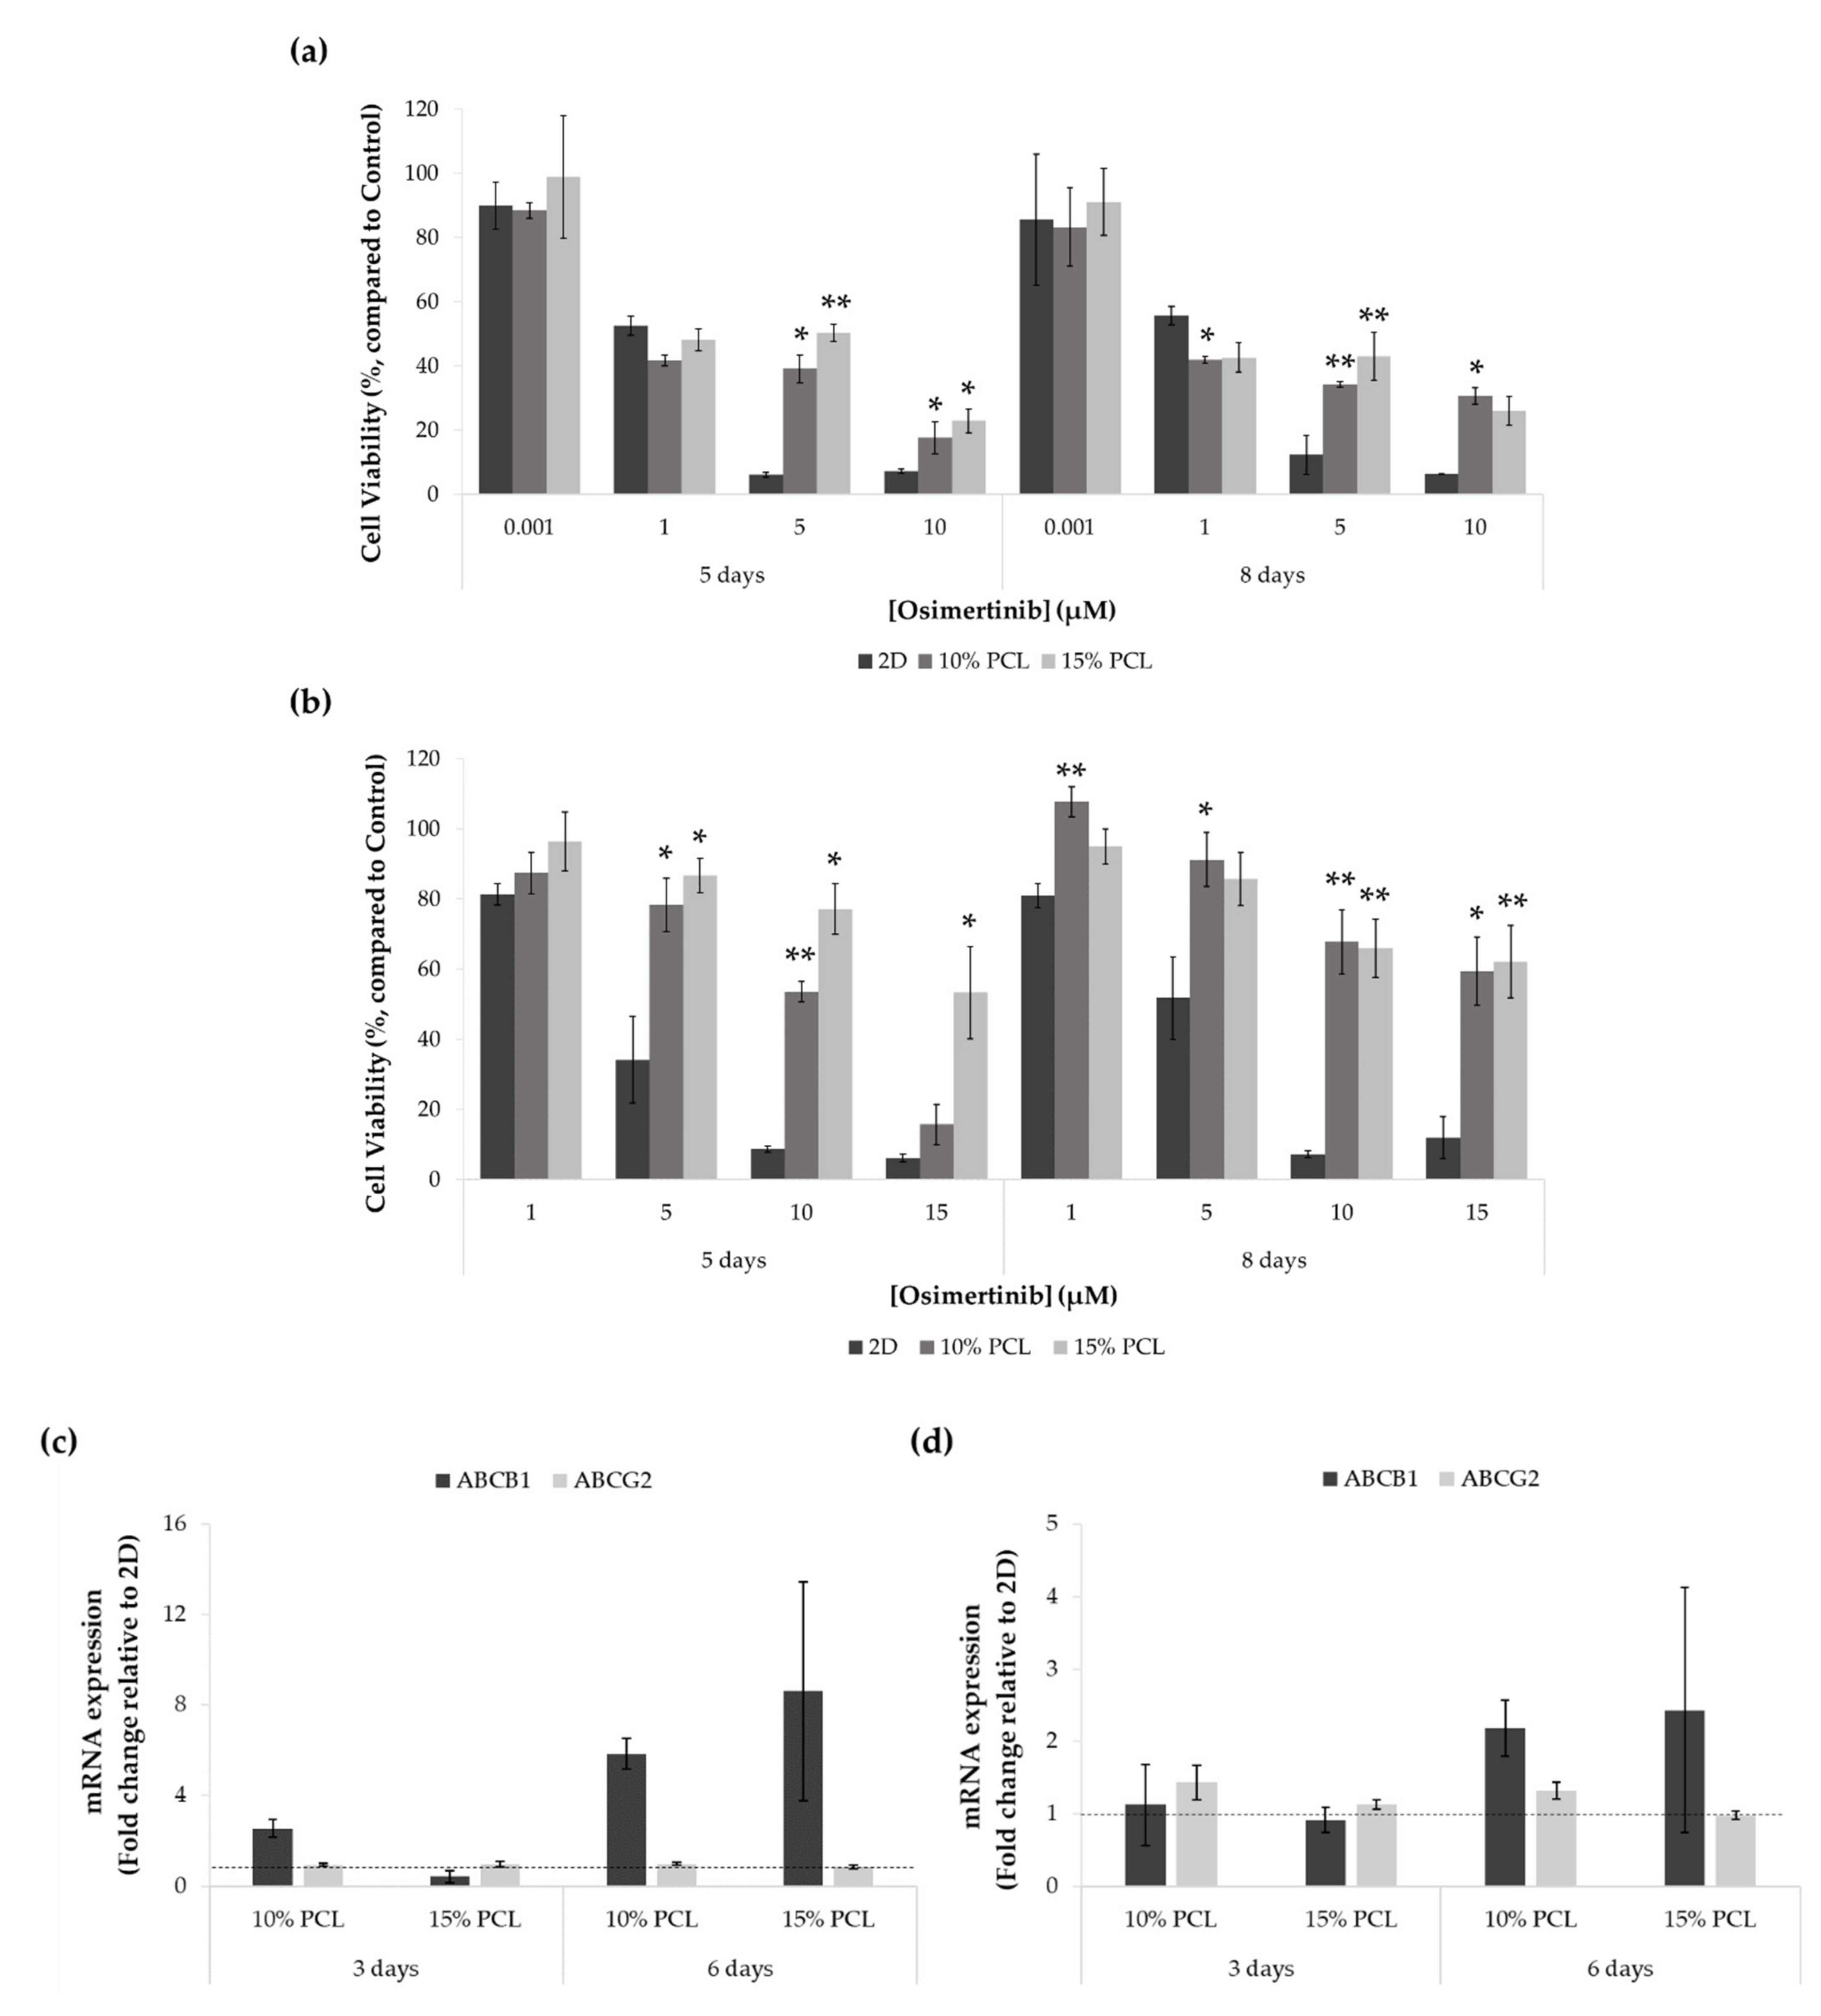
3.5.1. Resistance to Osimertinib of Sensitive and Resistant EGFRm Lung Adenocarcinoma Cell Models Cultured on PCL-ES Scaffolds
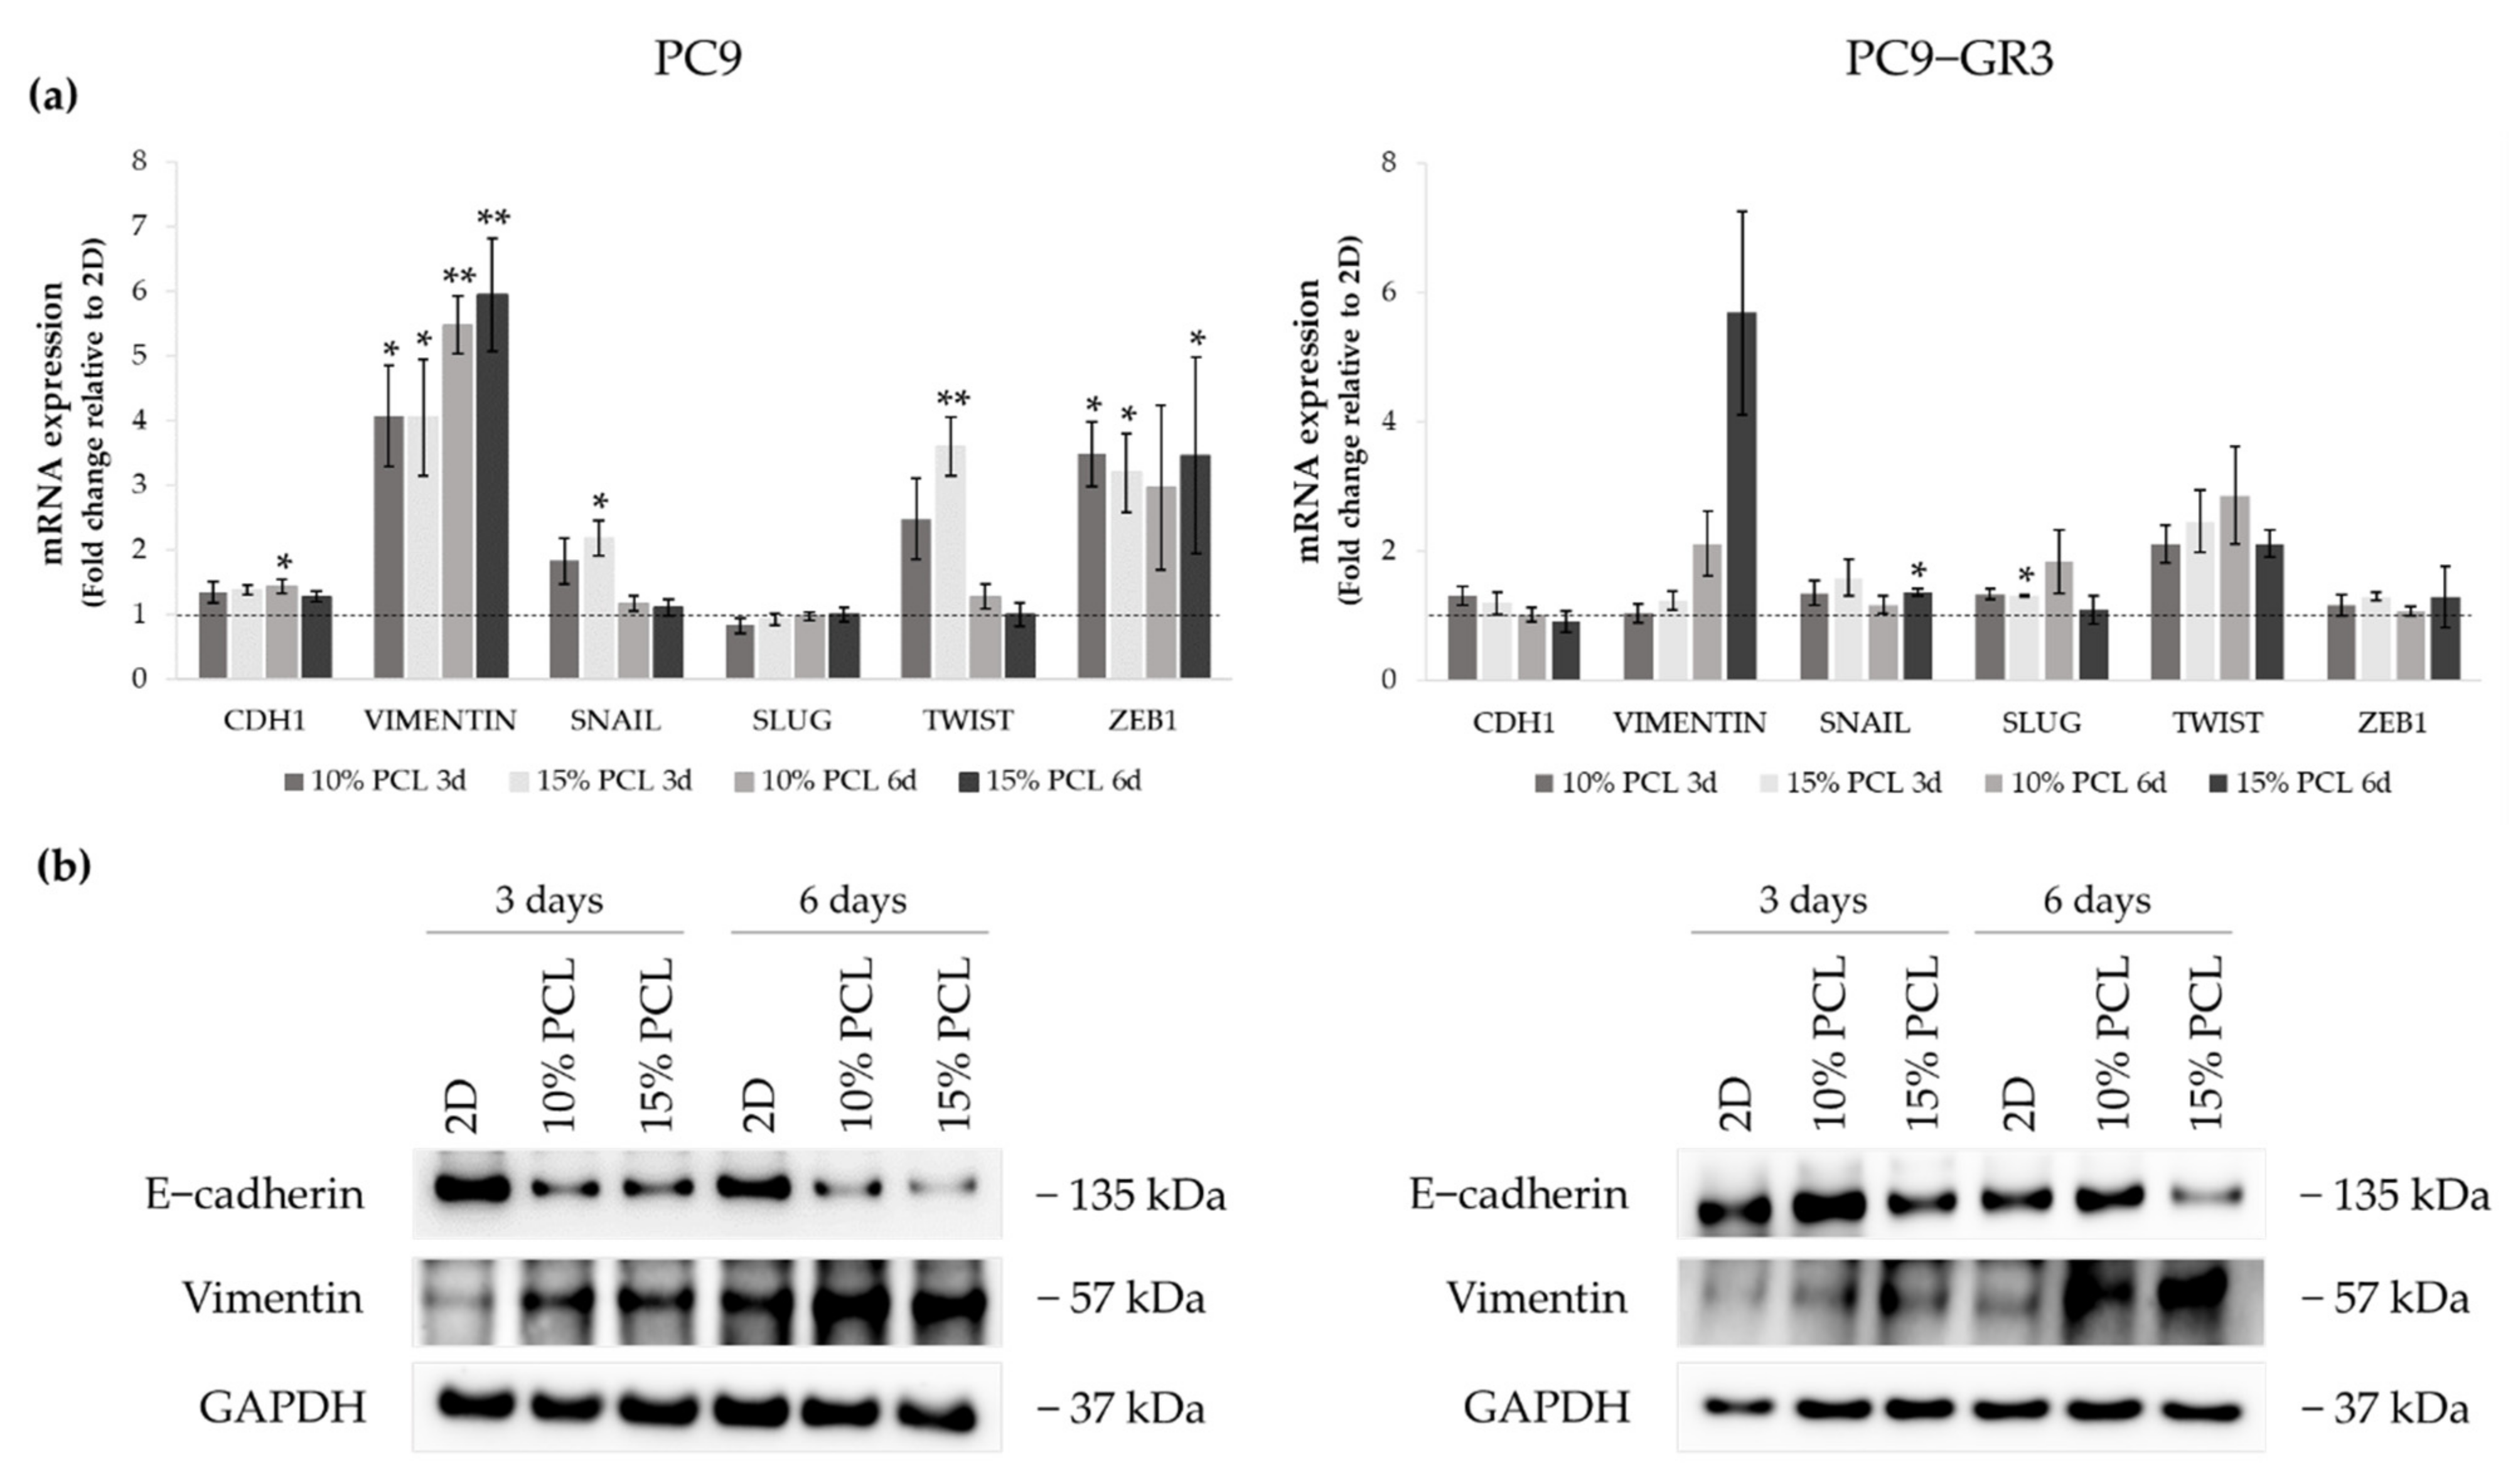
3.5.2. Epithelial-to-Mesenchymal Transition (EMT) of Sensitive and Resistant EGFRm Lung Adenocarcinoma Cell Models Cultured on PCL-ES Scaffolds
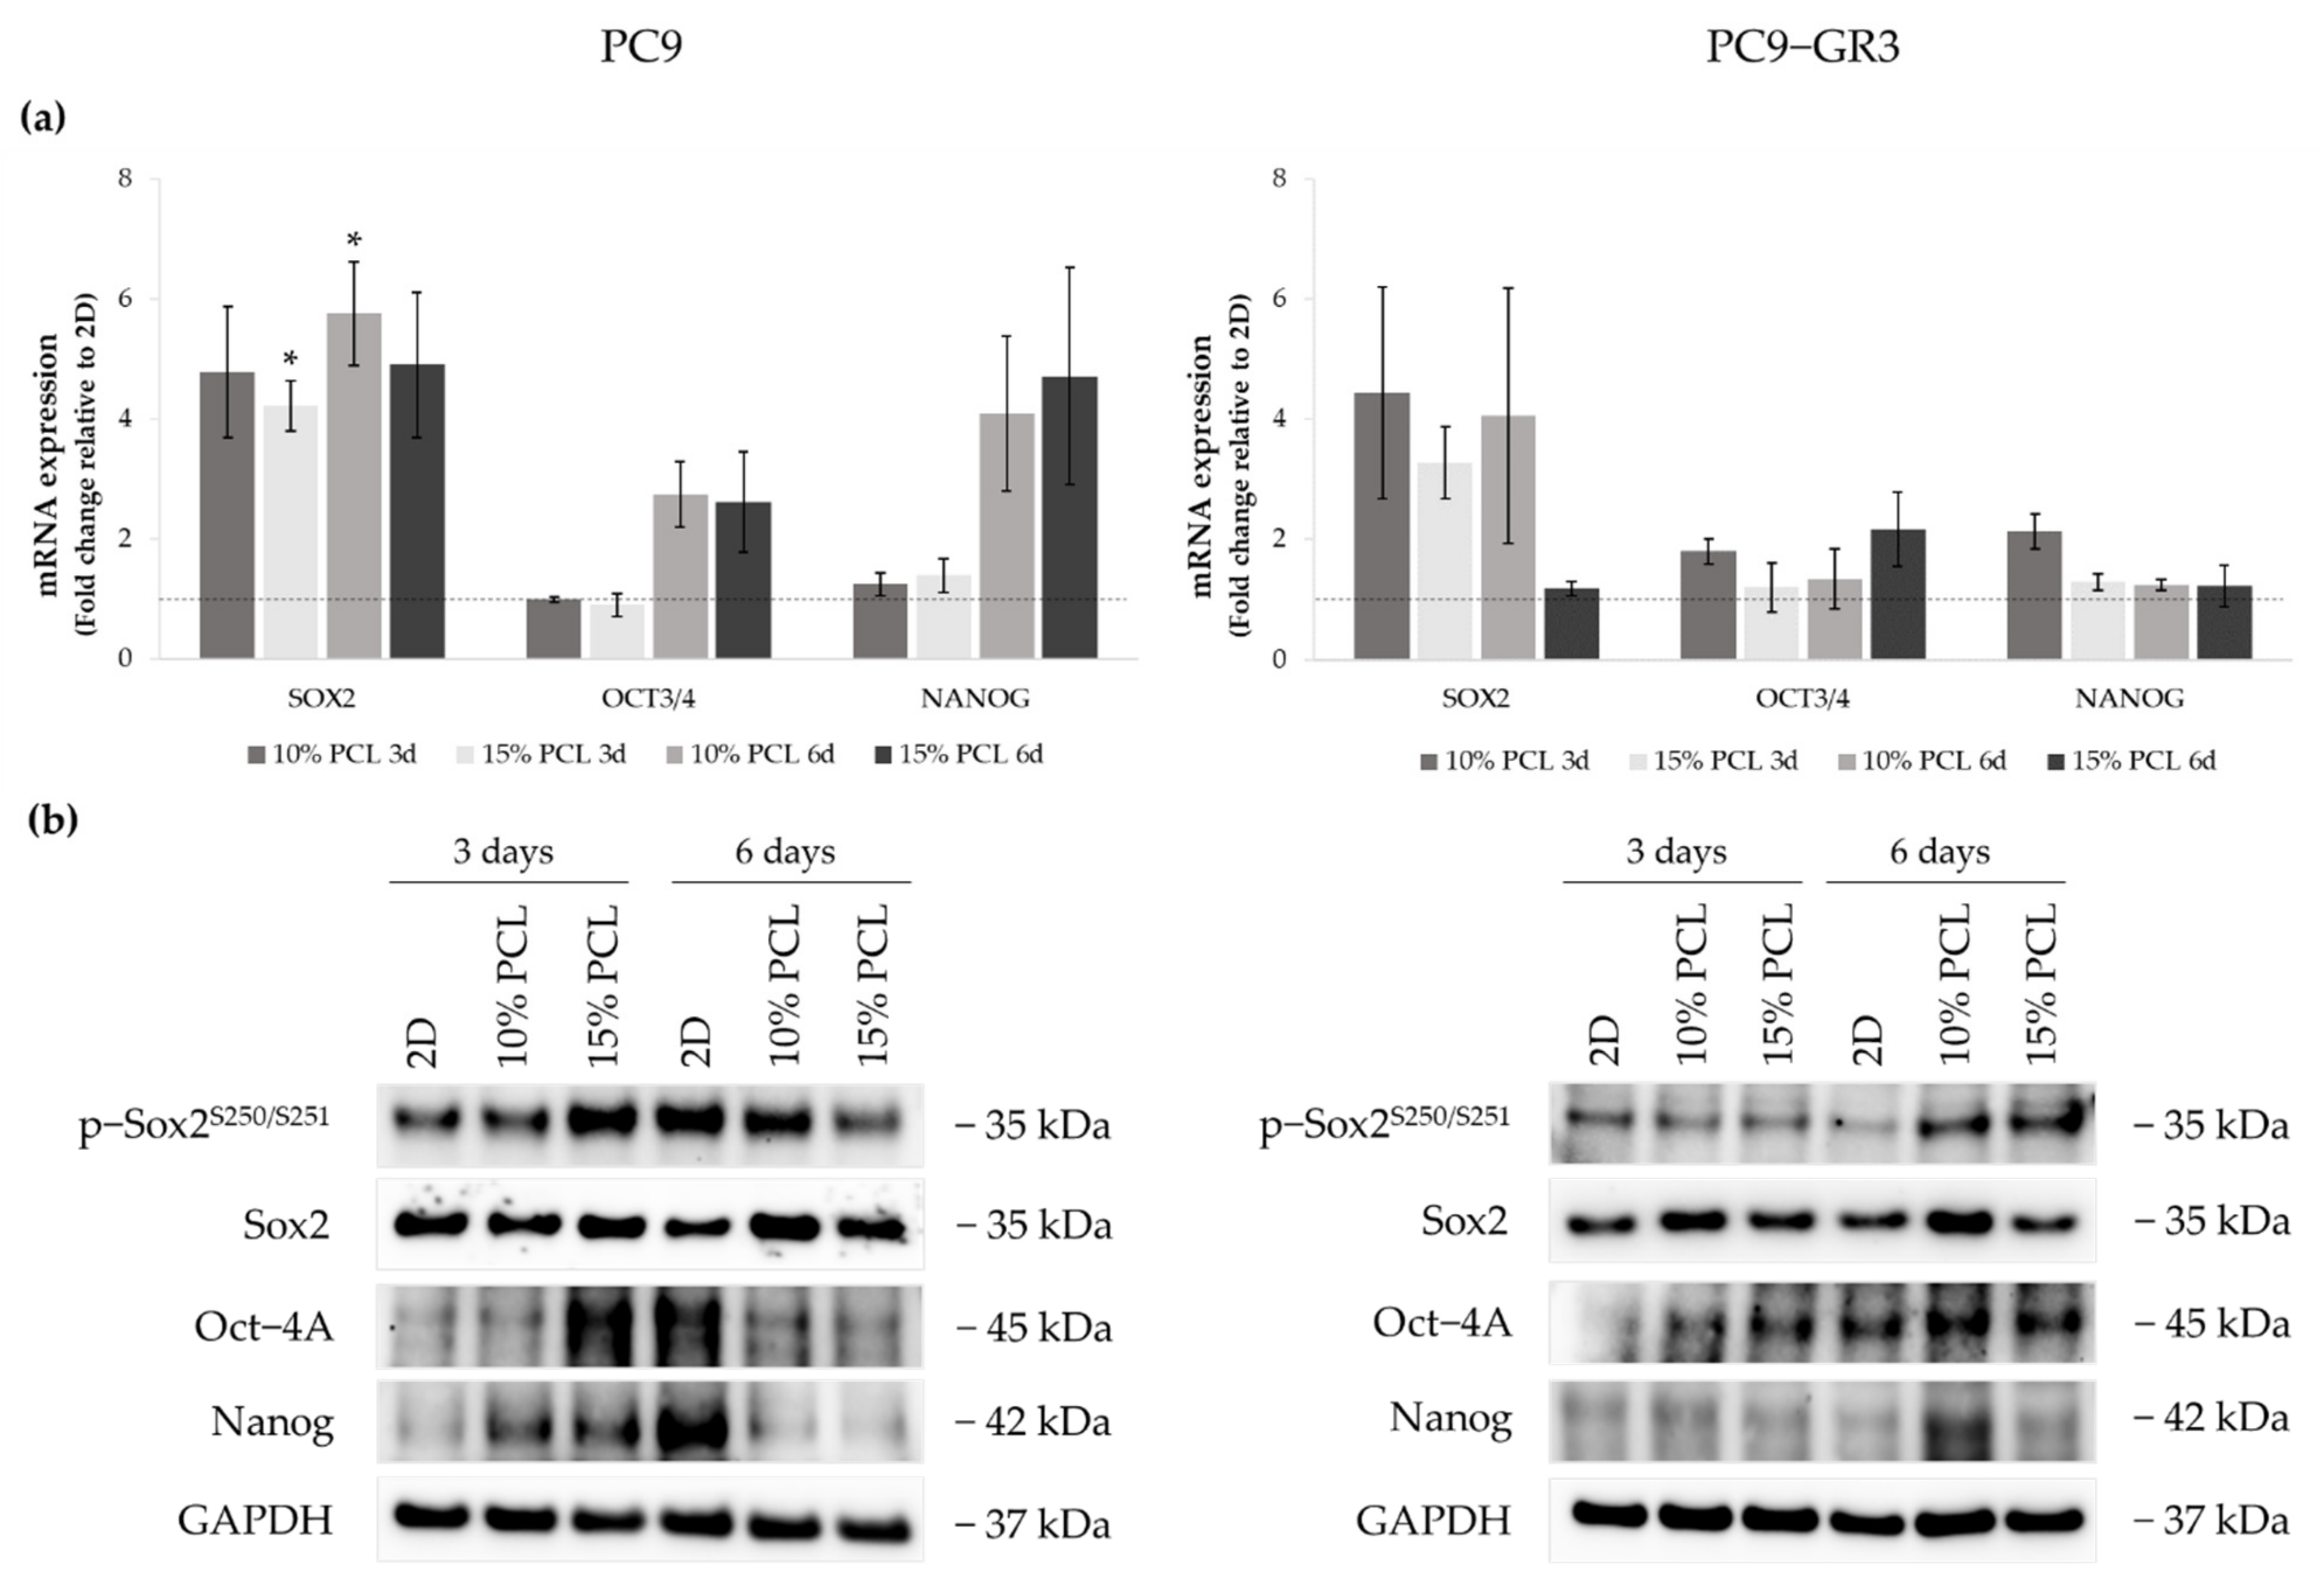
3.5.3. Self-Renewal, Stemness and Pluripotency Markers of Sensitive and Resistant EGFRm Lung Adenocarcinoma Cell Models Cultured on PCL-ES Scaffolds
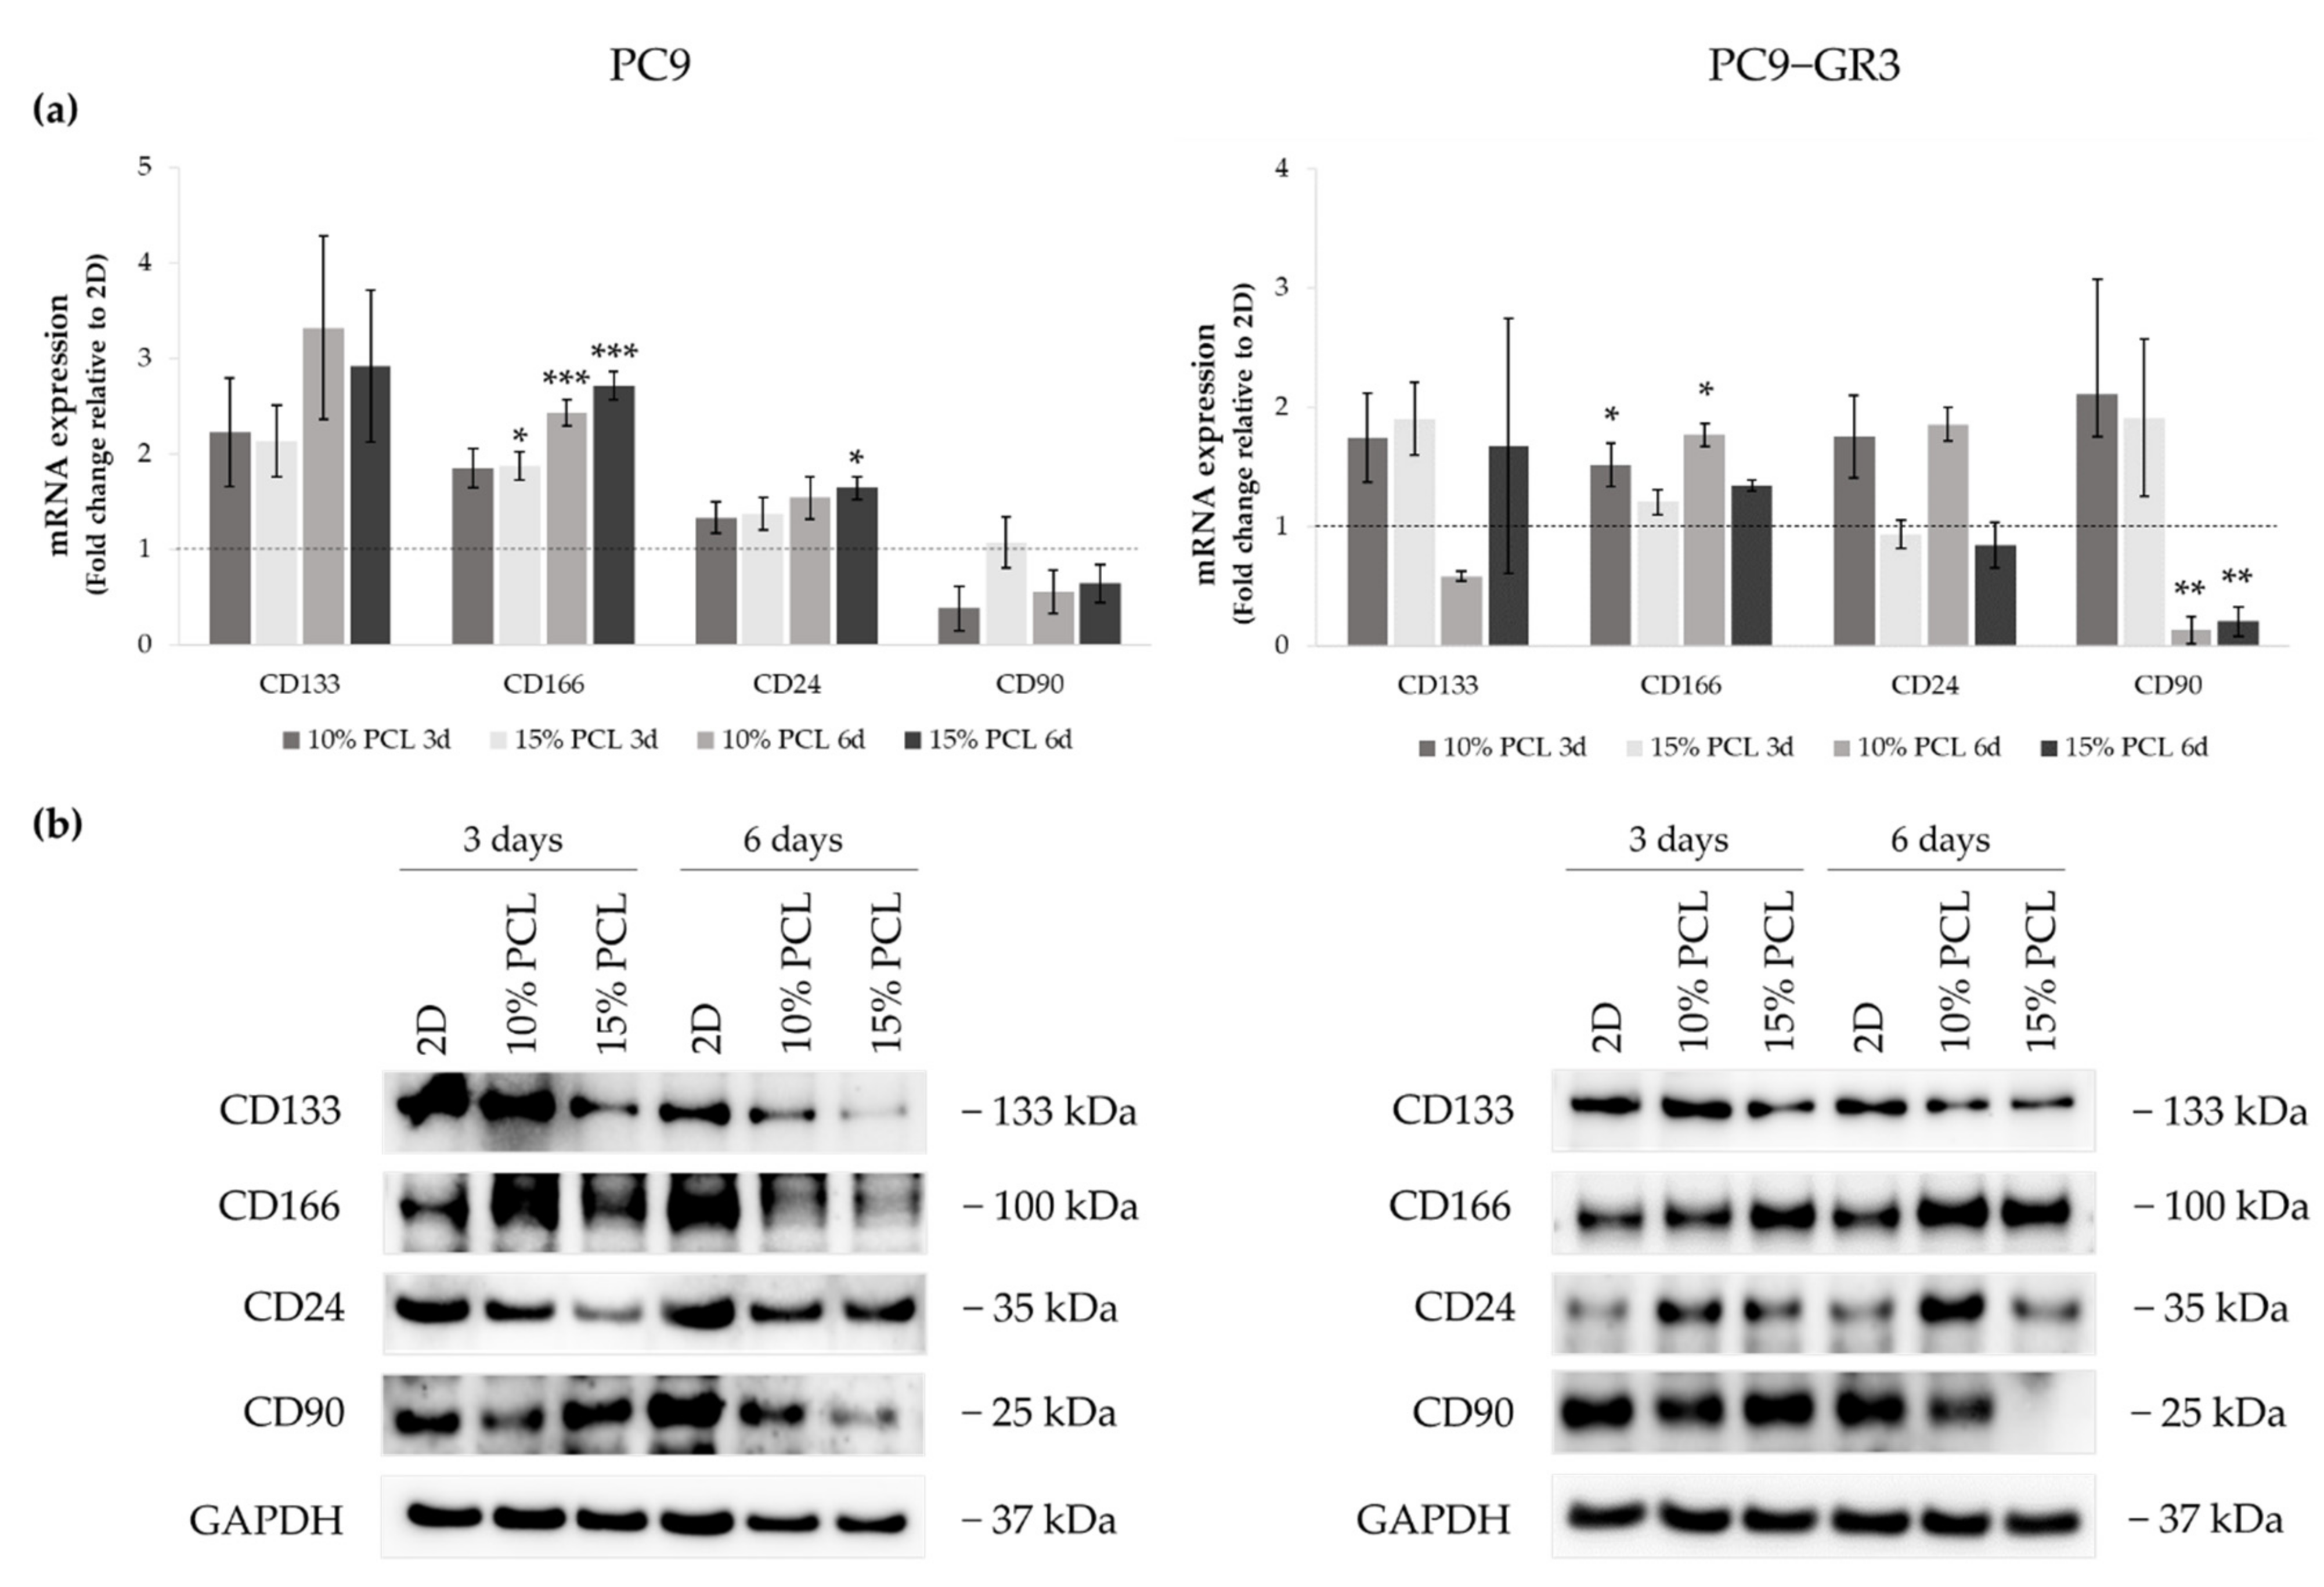
3.5.4. Membrane Receptors of Sensitive and Resistant EGFRm Lung Adenocarcinoma Cell Models Cultured on PCL-ES Scaffolds
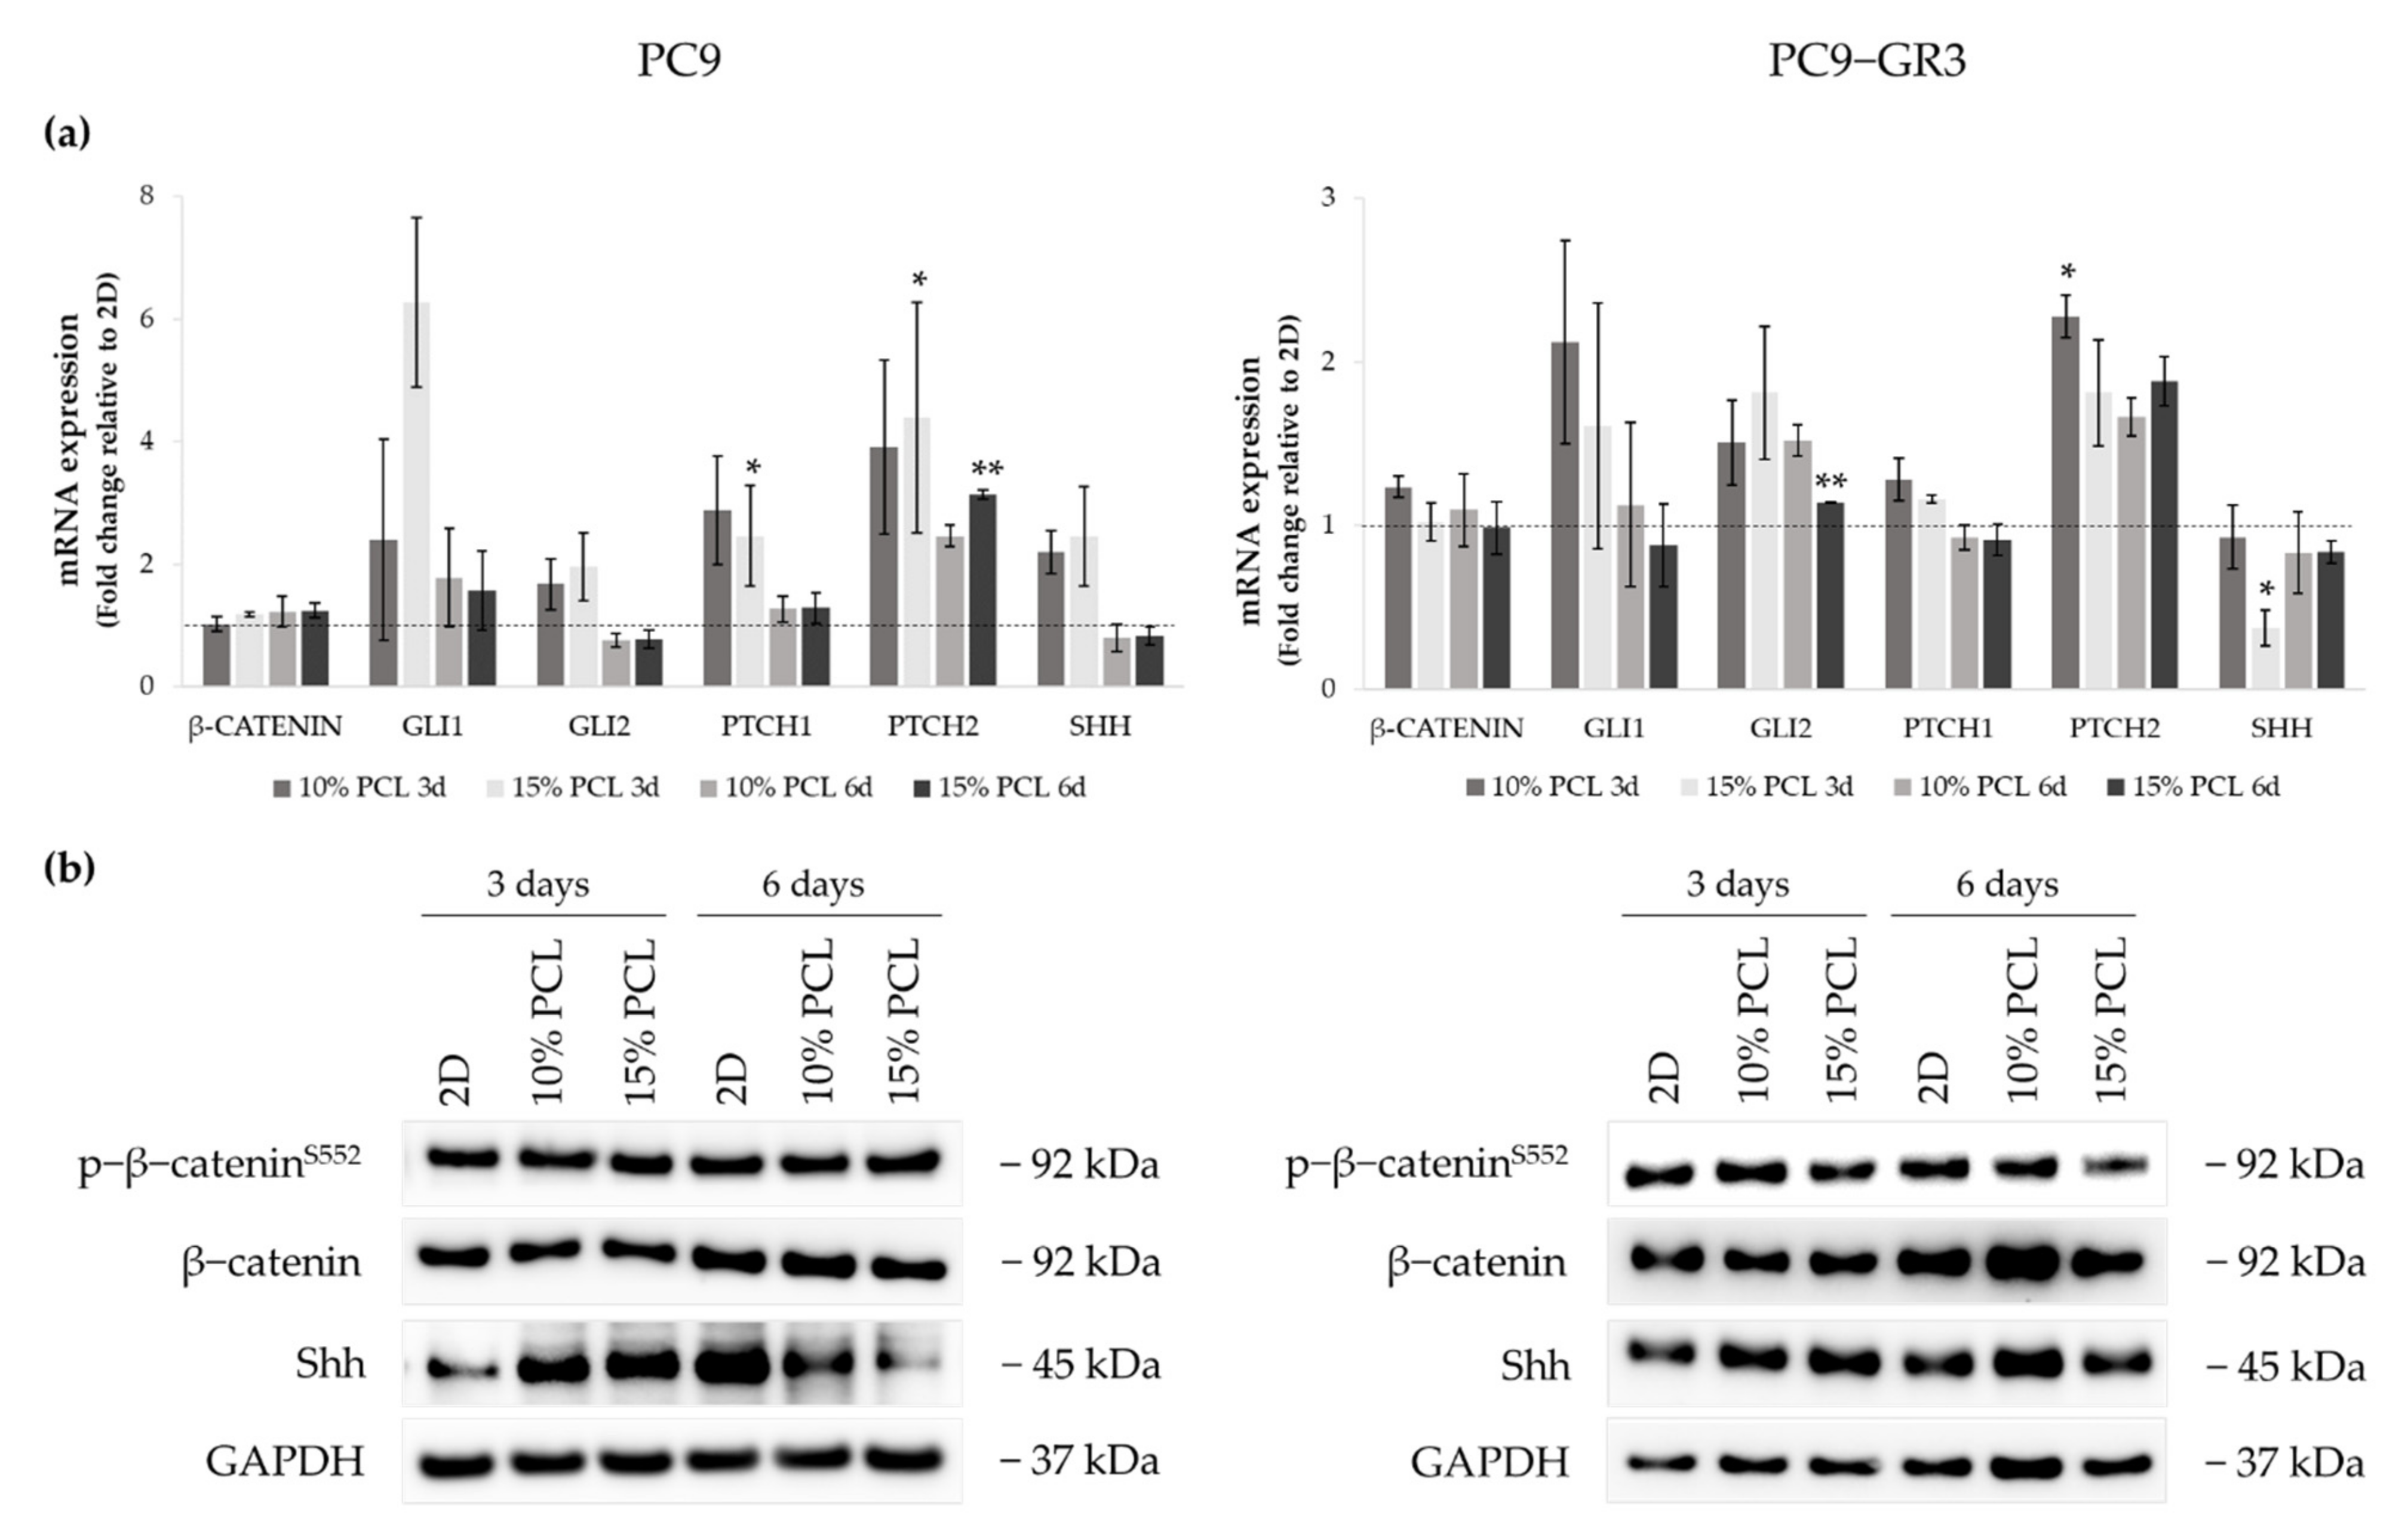
3.5.5. Hedgehog and Canonical Pathway of Sensitive and Resistant EGFRm Lung Adenocarcinoma Cell Models Cultured on PCL-ES Scaffolds
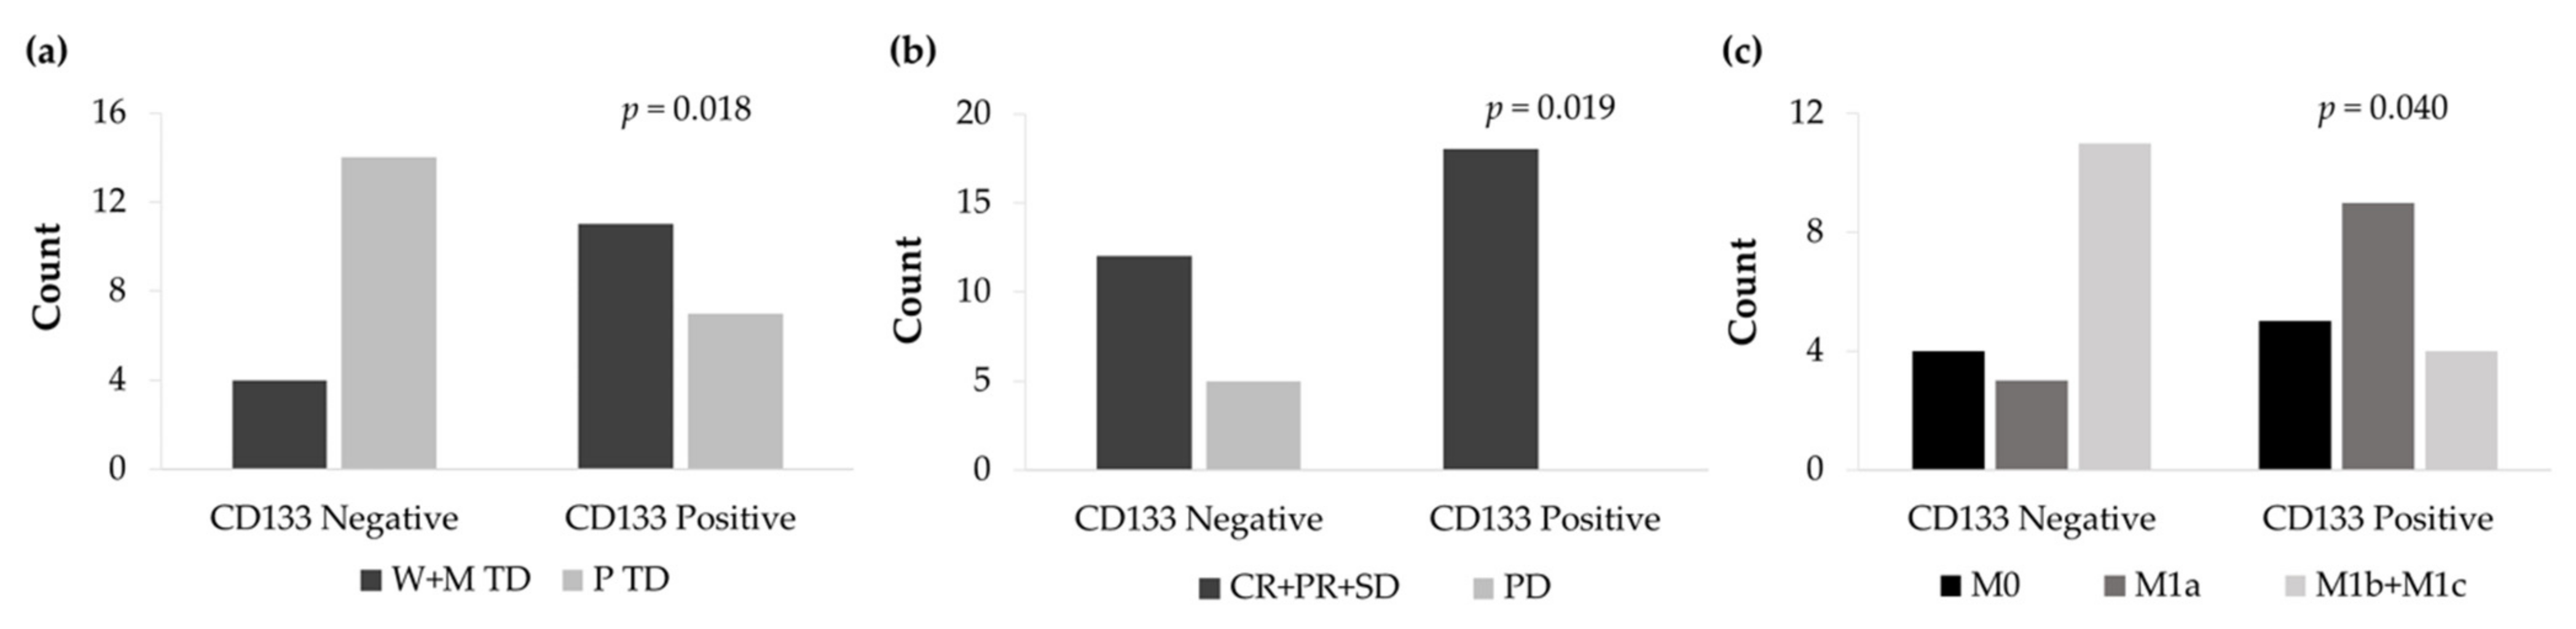
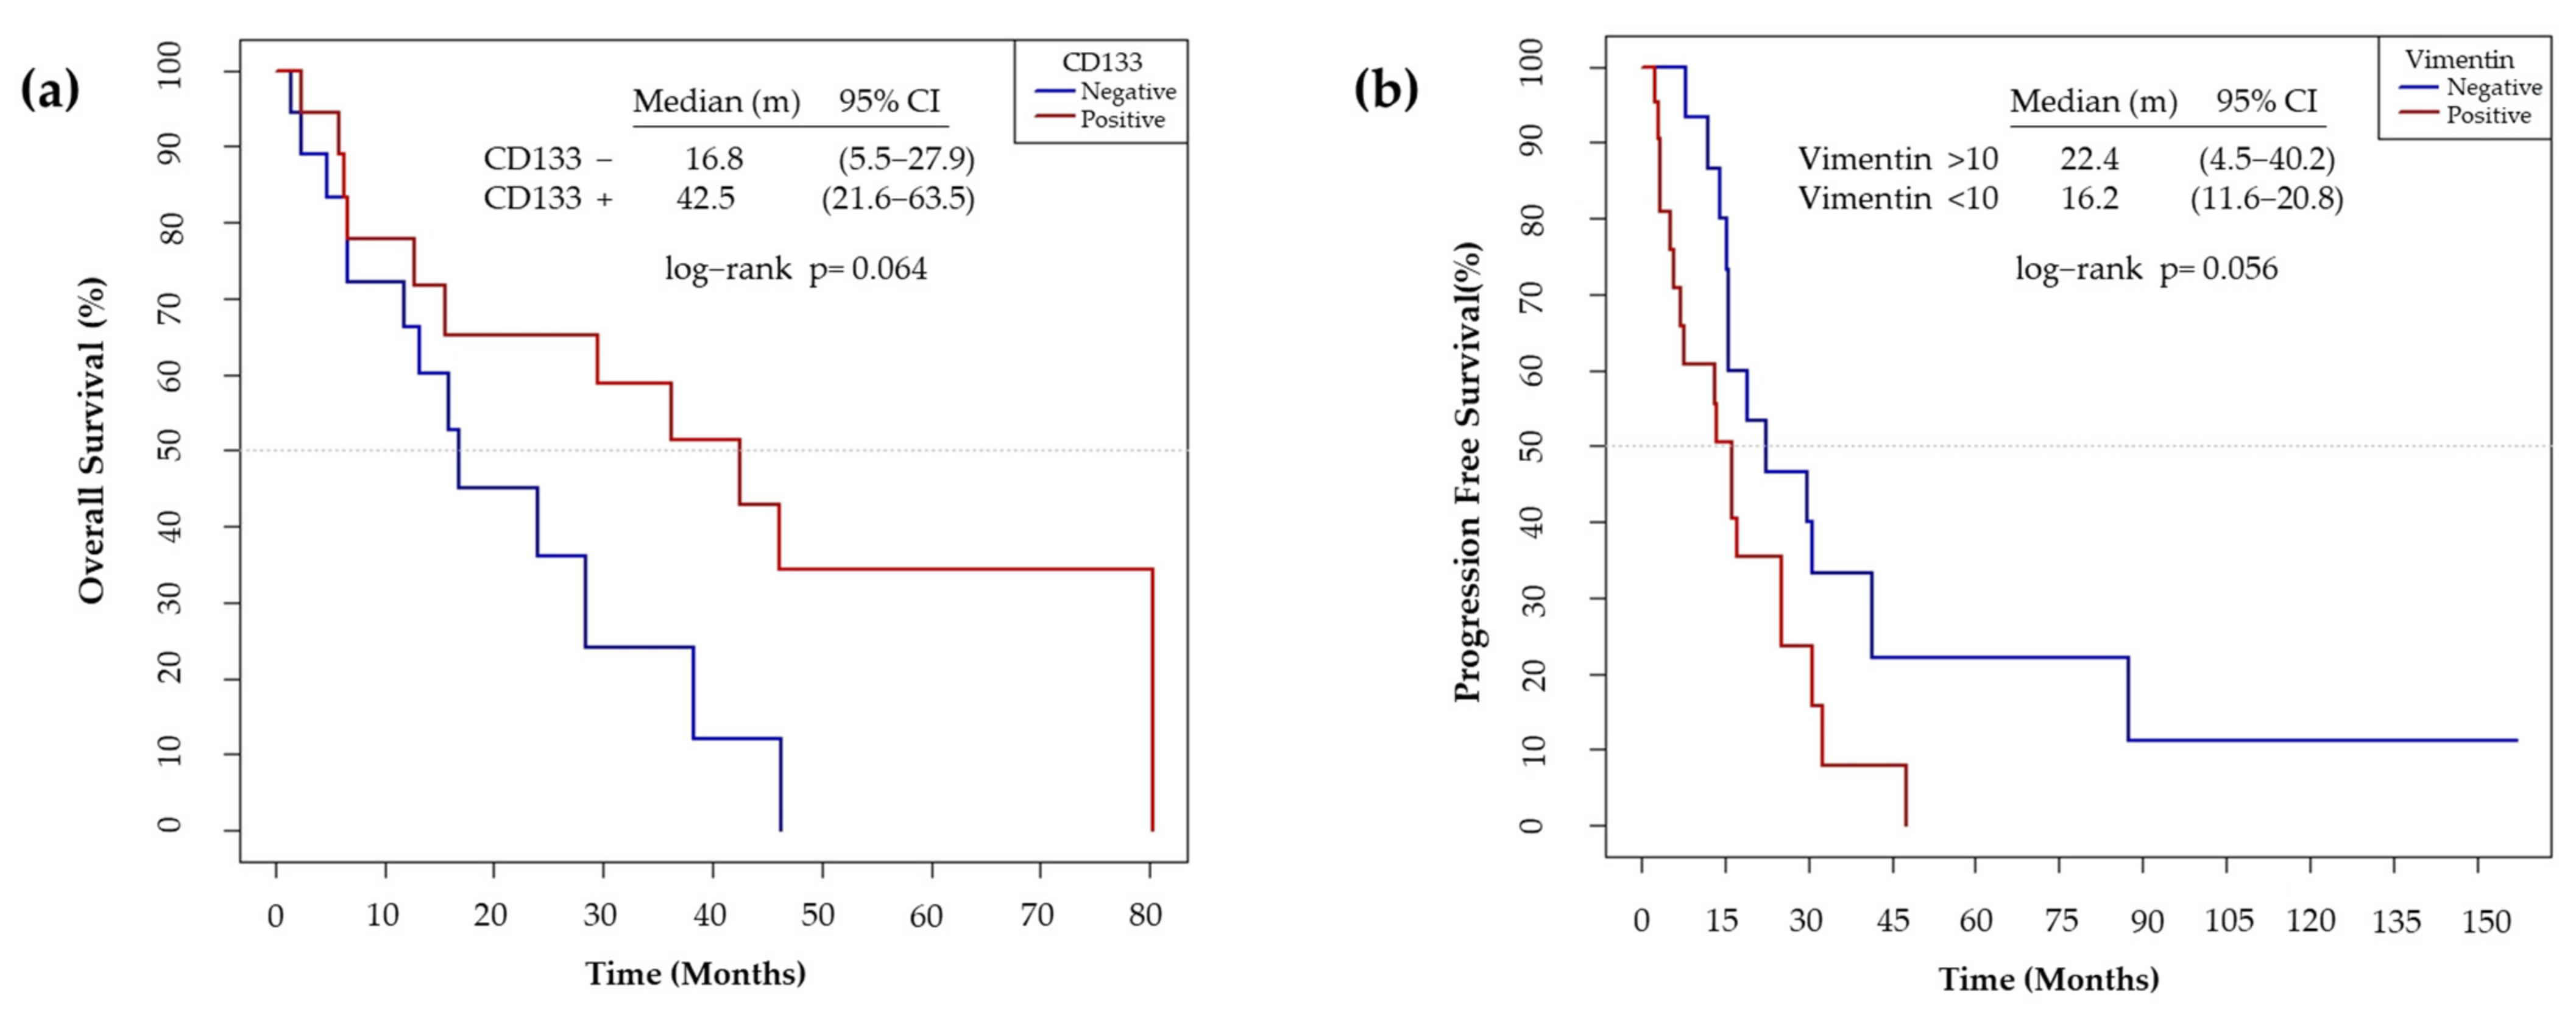
3.6. CD133 and Vimentin Expression in EGFRm NSCLC Patient-Derived Tumors
3.6.1. Patient and Tumor Characteristics
3.6.2. CD133 and Vimentin Tumor Expression in EGFRm NSCLC Patients
4. Discussion
5. Conclusions
Supplementary Materials
Author Contributions
Funding
Institutional Review Board Statement
Informed Consent Statement
Data Availability Statement
Acknowledgments
Conflicts of Interest
References
- Bray, F.; Ferlay, J.; Soerjomataram, I.; Siegel, R.L.; Torre, L.A.; Jemal, A. Global Cancer Statistics 2018: GLOBOCAN Estimates of Incidence and Mortality Worldwide for 36 Cancers in 185 Countries. CA Cancer J. Clin. 2018, 68, 394–424. [Google Scholar] [CrossRef] [PubMed] [Green Version]
- Bade, B.C.; Dela Cruz, C.S. Lung Cancer 2020: Epidemiology, Etiology, and Prevention. Clin. Chest Med. 2020, 41, 1–24. [Google Scholar] [CrossRef]
- Travis, W.D.; Brambilla, E.; Nicholson, A.G.; Yatabe, Y.; Austin, J.H.M.; Beth Beasley, M.; Chirieac, L.R.; Dacic, S.; Duhig, E.; Flieder, D.B.; et al. The 2015 World Health Organization Classification of Lung Tumors. J. Thorac. Oncol. 2015, 10, 1243–1260. [Google Scholar] [CrossRef] [PubMed] [Green Version]
- Forsythe, M.L.; Alwithenani, A.; Bethune, D.; Castonguay, M.; Drucker, A.; Flowerdew, G.; French, D.; Fris, J.; Greer, W.; Henteleff, H.; et al. Molecular profiling of non-small cell lung cancer. PLoS ONE 2020, 15, e0236580. [Google Scholar] [CrossRef] [PubMed]
- Lynch, T.J.; Bell, D.W.; Sordella, R.; Gurubhagavatula, S.; Okimoto, R.A.; Brannigan, B.W.; Harris, P.L.; Haserlat, S.M.; Supko, J.G.; Haluska, F.G.; et al. Activating Mutations in the Epidermal Growth Factor Receptor Underlying Responsiveness of Non-Small-Cell Lung Cancer to Gefitinib. N. Engl. J. Med. 2004, 350, 2129–2139. [Google Scholar] [CrossRef]
- Wu, S.G.; Shih, J.Y. Management of acquired resistance to EGFR TKI-targeted therapy in advanced non-small cell lung cancer. Mol. Cancer 2018, 17, 38. [Google Scholar] [CrossRef]
- Yu, Y.; Ramena, G.; Elble, R.C. The role of cancer stem cells in relapse of solid tumors. Front. Biosci. 2012, 1, 1528. [Google Scholar] [CrossRef]
- Singh, S.; Chellappan, S. Lung cancer stem cells: Molecular features and therapeutic targets. Mol. Aspects Med. 2014, 39, 50–60. [Google Scholar] [CrossRef] [Green Version]
- Medema, J.P. Cancer stem cells: The challenges ahead. Nat. Cell Biol. 2013, 15, 338–344. [Google Scholar] [CrossRef]
- Hyslop, L.; Stojkovic, M.; Armstrong, L.; Walter, T.; Stojkovic, P.; Przyborski, S.; Herbert, M.; Murdoch, A.; Strachan, T.; Lako, M. Downregulation of NANOG Induces Differentiation of Human Embryonic Stem Cells to Extraembryonic Lineages. Stem Cells 2005, 23, 1035–1043. [Google Scholar] [CrossRef]
- Sarkar, A.; Hochedlinger, K. The Sox family of transcription factors: Versatile regulators of stem and progenitor cell fate. Cell Stem Cell 2013, 12, 15–30. [Google Scholar] [CrossRef] [Green Version]
- Kumar, S.M.; Liu, S.; Lu, H.; Zhang, H.; Zhang, P.J.; Gimotty, P.A.; Guerra, M.; Guo, W.; Xu, X. Acquired cancer stem cell phenotypes through Oct4-mediated dedifferentiation. Oncogene 2012, 31, 4898–4911. [Google Scholar] [CrossRef] [Green Version]
- Nassar, D.; Blanpain, C. Cancer Stem Cells: Basic Concepts and Therapeutic Implications. Annu. Rev. Pathol. Mech. Dis. 2016, 11, 47–76. [Google Scholar] [CrossRef]
- Zhang, D.G.; Jiang, A.G.; Lu, H.Y.; Zhang, L.X.; Gao, X.Y. Isolation, cultivation and identification of human lung adenocarcinoma stem cells. Oncol. Lett. 2015, 9, 47–54. [Google Scholar] [CrossRef] [PubMed] [Green Version]
- Zakaria, N.; Yusoff, N.M.; Zakaria, Z.; Lim, M.N.; Baharuddin, P.J.N.; Fakiruddin, K.S.; Yahaya, B. Human non-small cell lung cancer expresses putative cancer stem cell markers and exhibits the transcriptomic profile of multipotent cells. BMC Cancer 2015, 15, 84. [Google Scholar] [CrossRef] [Green Version]
- Akunuru, S.; Zhai, Q.J.; Zheng, Y. Non-small cell lung cancer stem/progenitor cells are enriched in multiple distinct phenotypic subpopulations and exhibit plasticity. Cell Death Dis. 2012, 3, e352. [Google Scholar] [CrossRef] [PubMed] [Green Version]
- Yan, X.; Luo, H.; Zhou, X.; Zhu, B.; Wang, Y.; Bian, X. Identification of CD90 as a marker for lung cancer stem cells in A549 and H446 cell lines. Oncol. Rep. 2013, 30, 2733–2740. [Google Scholar] [CrossRef] [PubMed] [Green Version]
- Zhang, Y.; Weinberg, R.A. Epithelial-to-mesenchymal transition in cancer: Complexity and opportunities. Front. Med. 2018, 12, 361–373. [Google Scholar] [CrossRef] [Green Version]
- Pastushenko, I.; Brisebarre, A.; Sifrim, A.; Fioramonti, M.; Revenco, T.; Boumahdi, S.; Van Keymeulen, A.; Brown, D.; Moers, V.; Lemaire, S.; et al. Identification of the tumour transition states occurring during EMT. Nature 2018, 556, 463–468. [Google Scholar] [CrossRef]
- Teng, Y.; Wang, X.; Wang, Y.; Ma, D. Wnt/β-catenin signaling regulates cancer stem cells in lung cancer A549 cells. Biochem. Biophys. Res. Commun. 2010, 392, 373–379. [Google Scholar] [CrossRef]
- Park, K.S.; Martelotto, L.G.; Peifer, M.; Sos, M.L.; Karnezis, A.N.; Mahjoub, M.R.; Bernard, K.; Conklin, J.F.; Szczepny, A.; Yuan, J.; et al. A crucial requirement for Hedgehog signaling in small cell lung cancer. Nat. Med. 2011, 17, 1504–1508. [Google Scholar] [CrossRef] [PubMed] [Green Version]
- Costard, L.S.; Hosn, R.R.; Ramanayake, H.; O’Brien, F.J.; Curtin, C.M. Influences of the 3D microenvironment on cancer cell behaviour and treatment responsiveness: A recent update on lung, breast and prostate cancer models. Acta Biomater. 2021, 132, 360–378. [Google Scholar] [CrossRef]
- Boucherit, N.; Gorvel, L.; Olive, D. 3D Tumor Models and Their Use for the Testing of Immunotherapies. Front. Immunol. 2020, 11, 3220. [Google Scholar] [CrossRef] [PubMed]
- Chitcholtan, K.; Asselin, E.; Parent, S.; Sykes, P.H.; Evans, J.J. Differences in growth properties of endometrial cancer in three dimensional (3D) culture and 2D cell monolayer. Exp. Cell Res. 2013, 319, 75–87. [Google Scholar] [CrossRef] [PubMed]
- Mak, I.W.; Evaniew, N.; Ghert, M. Lost in translation: Animal models and clinical trials in cancer treatment. Am. J. Transl. Res. 2014, 6, 114–118. [Google Scholar]
- Tapias, L.F.; Gilpin, S.E.; Ren, X.; Wei, L.; Fuchs, B.C.; Tanabe, K.K.; Lanuti, M.; Ott, H.C. Assessment of Proliferation and Cytotoxicity in a Biomimetic Three-Dimensional Model of Lung Cancer. Ann. Thorac. Surg. 2015, 100, 414–421. [Google Scholar] [CrossRef] [PubMed]
- Godugu, C.; Patel, A.R.; Desai, U.; Andey, T.; Sams, A.; Singh, M. AlgiMatrixTM Based 3D Cell Culture System as an In-Vitro Tumor Model for Anticancer Studies. PLoS ONE 2013, 8, e53708. [Google Scholar] [CrossRef] [Green Version]
- Yao, K.; Li, W.; Li, K.; Wu, Q.; Gu, Y.; Zhao, L.; Zhang, Y.; Gao, X. Simple Fabrication of Multicomponent Heterogeneous Fibers for Cell Co-Culture via Microfluidic Spinning. Macromol. Biosci. 2020, 20, 1900395. [Google Scholar] [CrossRef]
- Sachs, N.; Papaspyropoulos, A.; Zomer-van Ommen, D.D.; Heo, I.; Böttinger, L.; Klay, D.; Weeber, F.; Huelsz-Prince, G.; Iakobachvili, N.; Amatngalim, G.D.; et al. Long-term expanding human airway organoids for disease modeling. EMBO J. 2019, 38, e100300. [Google Scholar] [CrossRef] [PubMed]
- Nakamura, H.; Sugano, M.; Miyashita, T.; Hashimoto, H.; Ochiai, A.; Suzuki, K.; Tsuboi, M.; Ishii, G. Organoid culture containing cancer cells and stromal cells reveals that podoplanin-positive cancer-associated fibroblasts enhance proliferation of lung cancer cells. Lung Cancer 2019, 134, 100–107. [Google Scholar] [CrossRef]
- Herreros-Pomares, A.; Zhou, X.; Calabuig-Fariñas, S.; Lee, S.-J.; Torres, S.; Esworthy, T.; Hann, S.Y.; Jantus-Lewintre, E.; Camps, C.; Zhang, L.G. 3D printing novel in vitro cancer cell culture model systems for lung cancer stem cell study. Mater. Sci. Eng. C 2021, 122, 111914. [Google Scholar] [CrossRef] [PubMed]
- Moghadas, H.; Saidi, M.S.; Kashaninejad, N.; Kiyoumarsioskouei, A.; Nguyen, N.T. Fabrication and characterization of low-cost, bead-free, durable and hydrophobic electrospun membrane for 3D cell culture. Biomed. Microdevices 2017, 19, 74. [Google Scholar] [CrossRef] [Green Version]
- Chen, S.; Giannakou, A.; Wyman, S.; Gruzas, J.; Golas, J.; Zhong, W.; Loreth, C.; Sridharan, L.; Yamin, T.-T.; Damelin, M.; et al. Cancer-associated fibroblasts suppress SOX2-induced dysplasia in a lung squamous cancer coculture. Proc. Natl. Acad. Sci. USA 2018, 115, E11671–E11680. [Google Scholar] [CrossRef] [Green Version]
- Hu, S.; Dasbiswas, K.; Guo, Z.; Tee, Y.H.; Thiagarajan, V.; Hersen, P.; Chew, T.L.; Safran, S.A.; Zaidel-Bar, R.; Bershadsky, A.D. Long-range self-organization of cytoskeletal myosin II filament stacks. Nat. Cell Biol. 2017, 19, 133–141. [Google Scholar] [CrossRef]
- Reneker, D.H.; Chun, I. Nanometre diameter fibres of polymer, produced by electrospinning. Nanotechnology 1996, 7, 216–223. [Google Scholar] [CrossRef] [Green Version]
- Cipitria, A.; Skelton, A.; Dargaville, T.R.; Dalton, P.D.; Hutmacher, D.W. Design, fabrication and characterization of PCL electrospun scaffolds—A review. J. Mater. Chem. 2011, 21, 9419–9453. [Google Scholar] [CrossRef] [Green Version]
- Rabionet, M.; Yeste, M.; Puig, T.; Ciurana, J. Electrospinning PCL Scaffolds Manufacture for Three-Dimensional Breast Cancer Cell Culture. Polymers 2017, 9, 328. [Google Scholar] [CrossRef] [PubMed]
- Polonio-Alcalá, E.; Rabionet, M.; Guerra, A.; Yeste, M.; Ciurana, J.; Puig, T.; Polonio-Alcalá, E.; Rabionet, M.; Guerra, A.J.; Yeste, M.; et al. Screening of Additive Manufactured Scaffolds Designs for Triple Negative Breast Cancer 3D Cell Culture and Stem-Like Expansion. Int. J. Mol. Sci. 2018, 19, 3148. [Google Scholar] [CrossRef] [Green Version]
- Polonio-Alcalá, E.; Rabionet, M.; Gallardo, X.; Angelats, D.; Ciurana, J.; Ruiz-Martínez, S.; Puig, T. PLA Electrospun Scaffolds for Three-Dimensional Triple-Negative Breast Cancer Cell Culture. Polymers 2019, 11, 916. [Google Scholar] [CrossRef] [PubMed] [Green Version]
- Saha, S.; Duan, X.; Wu, L.; Lo, P.-K.; Chen, H.; Wang, Q. Electrospun fibrous scaffolds promote breast cancer cell alignment and epithelial-mesenchymal transition. Langmuir 2012, 28, 2028–2034. [Google Scholar] [CrossRef] [Green Version]
- Mohamed, A.; Gordon, S.H.; Biresaw, G. Polyaprolactone/polystyrene bioblends characterized by thermogravimetry, modulated differential scanning calorimetry and infrared photoacoustic spectroscopy. Polym. Degrad. Stab. 2007, 92, 1177–1185. [Google Scholar] [CrossRef]
- Wang, Y.; Rodriguez-Perez, M.A.; Reis, R.L.; Mano, J.F. Thermal and thermomechanical behaviour of polycaprolactone and starch/polycaprolactone blends for biomedical applications. Macromol. Mater. Eng. 2005, 290, 792–801. [Google Scholar] [CrossRef] [Green Version]
- Balgude, A.P.; Yu, X.; Szymanski, A.; Bellamkonda, R.V. Agarose gel stiffness determines rate of DRG neurite extension in 3D cultures. Biomaterials 2001, 22, 1077–1084. [Google Scholar] [CrossRef]
- Singh, D.; Zo, S.M.; Kumar, A.; Han, S.S. Engineering three-dimensional macroporous hydroxyethyl methacrylate- alginate-gelatin cryogel for growth and proliferation of lung epithelial cells. J. Biomater. Sci. Polym. Ed. 2013, 24, 1343–1359. [Google Scholar] [CrossRef] [PubMed]
- Russo, P.; Acierno, D.; Corradi, A.; Leonelli, C. Dynamic-mechanical behavior and morphology of polystyrene/perovskite composites: Effects of filler size. Procedia Eng. 2011, 10, 1017–1022. [Google Scholar] [CrossRef] [Green Version]
- Wu, H.; Fan, J.; Chu, C.C.; Wu, J. Electrospinning of small diameter 3-D nanofibrous tubular scaffolds with controllable nanofiber orientations for vascular grafts. J. Mater. Sci. Mater. Med. 2010, 21, 3207–3215. [Google Scholar] [CrossRef] [PubMed]
- Shin, M.; Ishii, O.; Sueda, T.; Vacanti, J.P. Contractile cardiac grafts using a novel nanofibrous mesh. Biomaterials 2004, 25, 3717–3723. [Google Scholar] [CrossRef]
- Ishii, O.; Shin, M.; Sueda, T.; Vacanti, J.P. In vitro tissue engineering of a cardiac graft using a degradable scaffold with an extracellular matrix-like topography. J. Thorac. Cardiovasc. Surg. 2005, 130, 1358–1363. [Google Scholar] [CrossRef] [Green Version]
- Nottelet, B.; Pektok, E.; Mandracchia, D.; Tille, J.C.; Walpoth, B.; Gurny, R.; Möller, M. Factorial design optimization and in vivo feasibility of poly(ε-caprolactone)-micro- and nanofiber-based small diameter vascular grafts. J. Biomed. Mater. Res. Part A 2009, 89, 865–875. [Google Scholar] [CrossRef]
- Pektok, E.; Nottelet, B.; Tille, J.C.; Gurny, R.; Kalangos, A.; Moeller, M.; Walpoth, B.H. Degradation and healing characteristics of small-diameter poly(ε-caprolactone) vascular grafts in the rat systemic arterial circulation. Circulation 2008, 118, 2563–2570. [Google Scholar] [CrossRef] [Green Version]
- Lawrence, B.J.; Madihally, S.V. Cell colonization in degradable 3D porous matrices. Cell Adhes. Migr. 2008, 2, 9–16. [Google Scholar] [CrossRef]
- Li, W.J.; Laurencin, C.T.; Caterson, E.J.; Tuan, R.S.; Ko, F.K. Electrospun nanofibrous structure: A novel scaffold for tissue engineering. J. Biomed. Mater. Res. 2002, 60, 613–621. [Google Scholar] [CrossRef]
- Guerra, A.J.; Cano, P.; Rabionet, M.; Puig, T.; Ciurana, J. Effects of different sterilization processes on the properties of a novel 3D-printed polycaprolactone stent. Polym. Adv. Technol. 2018, 29, 2327–2335. [Google Scholar] [CrossRef]
- Bölgen, N.; Menceloǧlu, Y.Z.; Acatay, K.; Vargel, I.; Pişkin, E. In vitro and in vivo degradation of non-woven materials made of poly(ε-caprolactone) nanofibers prepared by electrospinning under different conditions. J. Biomater. Sci. Polym. Ed. 2005, 16, 1537–1555. [Google Scholar] [CrossRef] [Green Version]
- Firkowska-Boden, I.; Zhang, X.; Jandt, K.D. Controlling Protein Adsorption through Nanostructured Polymeric Surfaces. Adv. Healthc. Mater. 2018, 7, 1700995. [Google Scholar] [CrossRef] [PubMed]
- Kumar, N.; Parajuli, O.; Gupta, A.; Hahm, J.I. Elucidation of protein adsorption behavior on polymeric surfaces: Toward high-density, high-payload protein templates. Langmuir 2008, 24, 2688–2694. [Google Scholar] [CrossRef] [PubMed]
- Nandakumar, A.; Tahmasebi Birgani, Z.; Santos, D.; Mentink, A.; Auffermann, N.; Van Der Werf, K.; Bennink, M.; Moroni, L.; Van Blitterswijk, C.; Habibovic, P. Surface modification of electrospun fibre meshes by oxygen plasma for bone regeneration. Biofabrication 2013, 5, 015006. [Google Scholar] [CrossRef]
- Santos, M.I.; Pashkuleva, I.; Alves, C.M.; Gomes, M.E.; Fuchs, S.; Unger, R.E.; Reis, R.L.; Kirkpatrick, C.J. Surface-modified 3D starch-based scaffold for improved endothelialization for bone tissue engineering. J. Mater. Chem. 2009, 19, 4091–4101. [Google Scholar] [CrossRef] [Green Version]
- Smith, J. Chemical Engineering Kinetics; McGraw Hill: New York, NY, USA, 1981. [Google Scholar]
- Li, D.; Wu, T.; He, N.; Wang, J.; Chen, W.; He, L.; Huang, C.; EI-Hamshary, H.A.; Al-Deyab, S.S.; Ke, Q.; et al. Three-dimensional polycaprolactone scaffold via needleless electrospinning promotes cell proliferation and infiltration. Colloids Surfaces B Biointerfaces 2014, 121, 432–443. [Google Scholar] [CrossRef]
- Dugina, V.; Khromova, N.; Rybko, V.; Blizniukov, O.; Shagieva, G.; Chaponnier, C.; Kopnin, B.; Kopnin, P. Tumor promotion by γ and suppression by β non-muscle actin isoforms. Oncotarget 2015, 6, 14556–14571. [Google Scholar] [CrossRef] [Green Version]
- Maounis, N.F.; Dráberová, E.; Trakas, N.; Chorti, M.; Riga, D.; Tzannis, K.; Kanakis, M.; Voralu, K.; Ellina, E.; Mahera, E.; et al. Expression of γ-tubulin in non-small cell lung cancer and effect on patient survival. Histol. Histopathol. 2018, 34, 81–90. [Google Scholar] [PubMed]
- Levallet, G.; Bergot, E.; Antoine, M.; Creveuil, C.; Santos, A.O.; Beau-Faller, M.; De Fraipont, F.; Brambilla, E.; Levallet, J.; Morin, F.; et al. High TUBB3 expression, an independent prognostic marker in patients with early non-small cell lung cancer treated by preoperative chemotherapy, is regulated by K-ras signaling pathway. Mol. Cancer Ther. 2012, 11, 1203–1213. [Google Scholar] [CrossRef] [PubMed] [Green Version]
- McCarroll, J.A.; Gan, P.P.; Liu, M.; Kavallaris, M. βIII-tubulin is a multifunctional protein involved in drug sensitivity and tumorigenesis in non-small cell lung cancer. Cancer Res. 2010, 70, 4995–5003. [Google Scholar] [CrossRef] [Green Version]
- Huang, Y.J.; Hsu, S. Acquisition of epithelial-mesenchymal transition and cancer stem-like phenotypes within chitosan-hyaluronan membrane-derived 3D tumor spheroids. Biomaterials 2014, 35, 10070–10079. [Google Scholar] [CrossRef] [PubMed]
- Yan, X.; Zhou, L.; Wu, Z.; Wang, X.; Chen, X.; Yang, F.; Guo, Y.; Wu, M.; Chen, Y.; Li, W.; et al. High throughput scaffold-based 3D micro-tumor array for efficient drug screening and chemosensitivity testing. Biomaterials 2019, 198, 167–179. [Google Scholar] [CrossRef]
- Li, J.; Zhou, Y.; Chen, W.; Yuan, Z.; You, B.; Liu, Y.; Yang, S.; Li, F.; Qu, C.; Zhang, X. A Novel 3D in Vitro Tumor Model Based on Silk Fibroin/Chitosan Scaffolds to Mimic the Tumor Microenvironment. ACS Appl. Mater. Interfaces 2018, 10, 36641–36651. [Google Scholar] [CrossRef]
- Baxter, G.C.; Stanners, C.P. The effect of protein degradation on cellular growth characteristics. J. Cell. Physiol. 1978, 96, 139–145. [Google Scholar] [CrossRef]
- Ekert, J.E.; Johnson, K.; Strake, B.; Pardinas, J.; Jarantow, S.; Perkinson, R.; Colter, D.C. Three-dimensional lung tumor microenvironment modulates therapeutic compound responsiveness in vitro--implication for drug development. PLoS ONE 2014, 9, e92248. [Google Scholar] [CrossRef] [PubMed]
- Du, W.; Ni, L.; Liu, B.; Wei, Y.; Lv, Y.; Qiang, S.; Dong, J.; Liu, X. Upregulation of SALL4 by EGFR activation regulates the stemness of CD44-positive lung cancer. Oncogenesis 2018, 7, 36. [Google Scholar] [CrossRef] [PubMed]
- Singh, S.; Trevino, J.; Bora-Singhal, N.; Coppola, D.; Haura, E.; Altiok, S.; Chellappan, S.P. EGFR/Src/Akt signaling modulates Sox2 expression and self-renewal of stem-like side-population cells in non-small cell lung cancer. Mol. Cancer 2012, 11, 73. [Google Scholar] [CrossRef] [Green Version]
- Wang, Y.; Jiang, M.; Du, C.; Yu, Y.; Liu, Y.; Li, M.; Luo, F. Utilization of lung cancer cell lines for the study of lung cancer stem cells. Oncol. Lett. 2018, 15, 6791–6798. [Google Scholar] [CrossRef] [PubMed]
- Wang, L.; Liu, X.; Ren, Y.; Zhang, J.; Chen, J.; Zhou, W.; Guo, W.; Wang, X.; Chen, H.; Li, M.; et al. Cisplatin-enriching cancer stem cells confer multidrug resistance in non-small cell lung cancer via enhancing TRIB1/HDAC activity. Cell Death Dis. 2017, 8, e2746. [Google Scholar] [CrossRef] [PubMed] [Green Version]
- Gong, S.; Li, Q.; Jeter, C.R.; Fan, Q.; Tang, D.G.; Liu, B. Regulation of NANOG in cancer cells. Mol. Carcinog. 2015, 54, 679–687. [Google Scholar] [CrossRef] [PubMed] [Green Version]
- Robey, R.W.; Pluchino, K.M.; Hall, M.D.; Fojo, A.T.; Bates, S.E.; Gottesman, M.M. Revisiting the role of ABC transporters in multidrug-resistant cancer. Nat. Rev. Cancer 2018, 18, 452–464. [Google Scholar] [CrossRef]
- Liu, Y.P.; Yang, C.J.; Huang, M.S.; Yeh, C.T.; Wu, A.T.H.; Lee, Y.C.; Lai, T.C.; Lee, C.H.; Hsiao, Y.W.; Lu, J.; et al. Cisplatin selects for multidrug-resistant CD133+ cells in lung adenocarcinoma by activating notch signaling. Cancer Res. 2013, 73, 406–416. [Google Scholar] [CrossRef] [Green Version]
- Amiri-Kordestani, L.; Basseville, A.; Kurdziel, K.; Fojo, A.T.; Bates, S.E. Targeting MDR in breast and lung cancer: Discriminating its potential importance from the failure of drug resistance reversal studies. Drug Resist. Updat. 2012, 15, 50–61. [Google Scholar] [CrossRef] [Green Version]
- Goldstein, L.J.; Galski, H.; Fojo, A.; Willingham, M.; Lai, S.L.; Gazdar, A.; Pirker, R.; Green, A.; Crist, W.; Brodeur, G.M.; et al. Expression of multidrug resistance gene in human cancers. J. Natl. Cancer Inst. 1989, 81, 116–124. [Google Scholar] [CrossRef]
- Liu, B.; Guo, Z.; Dong, H.; Daofeng, T.; Cai, Q.; Ji, B.; Zhang, S.; Wu, L.; Wang, J.; Wang, L.; et al. LRIG1, human EGFR inhibitor, reverses multidrug resistance through modulation of ABCB1 and ABCG2. Brain Res. 2015, 1611, 93–100. [Google Scholar] [CrossRef]
- Shi, Z.; Tiwari, A.K.; Shukla, S.; Robey, R.W.; Kim, I.W.; Parmar, S.; Bates, S.E.; Si, Q.S.; Goldblatt, C.S.; Abraham, I.; et al. Inhibiting the function of ABCB1 and ABCG2 by the EGFR tyrosine kinase inhibitor AG1478. Biochem. Pharmacol. 2009, 77, 781–793. [Google Scholar] [CrossRef] [Green Version]
- Jacobsen, K.; Bertran-Alamillo, J.; Molina, M.A.; Teixidó, C.; Karachaliou, N.; Pedersen, M.H.; Castellví, J.; Garzón, M.; Codony-Servat, C.; Codony-Servat, J.; et al. Convergent Akt activation drives acquired EGFR inhibitor resistance in lung cancer. Nat. Commun. 2017, 8, 410. [Google Scholar] [CrossRef] [Green Version]
- Nieto, M.A. Epithelial-Mesenchymal Transitions in development and disease: Old views and new perspectives. Int. J. Dev. Biol. 2009, 53, 1541–1547. [Google Scholar] [CrossRef] [PubMed] [Green Version]
- Li, S.; Li, Q. Cancer stem cells and tumor metastasis (review). Int. J. Oncol. 2014, 44, 1806–1812. [Google Scholar] [CrossRef] [Green Version]
- Han, H.-W.; Hsu, S. Chitosan-hyaluronan based 3D co-culture platform for studying the crosstalk of lung cancer cells and mesenchymal stem cells. Acta Biomater. 2016, 42, 157–167. [Google Scholar] [CrossRef]
- Choe, C.; Kim, H.; Min, S.; Park, S.; Seo, J.; Roh, S. SOX2, a stemness gene, induces progression of NSCLC A549 cells toward anchorage-independent growth and chemoresistance to vinblastine. Onco. Targets. Ther. 2018, 11, 6197–6207. [Google Scholar] [CrossRef] [PubMed] [Green Version]
- Liu, P.; Zhang, R.; Yu, W.; Ye, Y.; Cheng, Y.; Han, L.; Dong, L.; Chen, Y.; Wei, X.; Yu, J. FGF1 and IGF1-conditioned 3D culture system promoted the amplification and cancer stemness of lung cancer cells. Biomaterials 2017, 149, 63–76. [Google Scholar] [CrossRef] [PubMed]
- Kumar, M.; Allison, D.F.; Baranova, N.N.; Wamsley, J.J.; Katz, A.J.; Bekiranov, S.; Jones, D.R.; Mayo, M.W. NF-κB Regulates Mesenchymal Transition for the Induction of Non-Small Cell Lung Cancer Initiating Cells. PLoS ONE 2013, 8, e68597. [Google Scholar]
- Song, K.A.; Niederst, M.J.; Lochmann, T.L.; Hata, A.N.; Kitai, H.; Ham, J.; Floros, K.V.; Hicks, M.A.; Hu, H.; Mulvey, H.E.; et al. Epithelial-to-mesenchymal transition antagonizes response to targeted therapies in lung cancer by suppressing BIM. Clin. Cancer Res. 2018, 24, 197–208. [Google Scholar] [CrossRef] [Green Version]
- Tiran, V.; Lindenmann, J.; Brcic, L.; Heitzer, E.; Stanzer, S.; Tabrizi-Wizsy, N.G.; Stacher, E.; Stoeger, H.; Popper, H.H.; Balic, M.; et al. Primary patient-derived lung adenocarcinoma cell culture challenges the association of cancer stem cells with epithelial-to-mesenchymal transition. Sci. Rep. 2017, 7, 10040. [Google Scholar] [CrossRef] [PubMed]
- Mani, S.A.; Guo, W.; Liao, M.J.; Eaton, E.N.; Ayyanan, A.; Zhou, A.Y.; Brooks, M.; Reinhard, F.; Zhang, C.C.; Shipitsin, M.; et al. The Epithelial-Mesenchymal Transition Generates Cells with Properties of Stem Cells. Cell 2008, 133, 704–715. [Google Scholar] [CrossRef] [Green Version]
- Mihalko, E.P.; Brown, A.C. Material Strategies for Modulating Epithelial to Mesenchymal Transitions. ACS Biomater. Sci. Eng. 2018, 4, 1149–1161. [Google Scholar] [CrossRef] [PubMed]
- Murakami, A.; Takahashi, F.; Nurwidya, F.; Kobayashi, I.; Minakata, K.; Hashimoto, M.; Nara, T.; Kato, M.; Tajima, K.; Shimada, N.; et al. Hypoxia increases gefitinib-resistant lung cancer stem cells through the activation of insulin-like growth factor 1 receptor. PLoS ONE 2014, 9, e86459. [Google Scholar] [CrossRef]
- Nakatsugawa, M.; Takahashi, A.; Hirohashi, Y.; Torigoe, T.; Inoda, S.; Murase, M.; Asanuma, H.; Tamura, Y.; Morita, R.; Michifuri, Y.; et al. SOX2 is overexpressed in stem-like cells of human lung adenocarcinoma and augments the tumorigenicity. Lab. Investig. 2011, 91, 1796–1804. [Google Scholar] [CrossRef]
- Sholl, L.M.; Barletta, J.A.; Yeap, B.Y.; Chirieac, L.R.; Hornick, J.L. Sox2 protein expression is an independent poor prognostic indicator in stage i lung adenocarcinoma. Am. J. Surg. Pathol. 2010, 34, 1193–1198. [Google Scholar] [CrossRef]
- Li, M.; Yang, J.; Zhou, W.; Ren, Y.; Wang, X.; Chen, H.; Zhang, J.; Chen, J.; Sun, Y.; Cui, L.; et al. Activation of an AKT/FOXM1/STMN1 pathway drives resistance to tyrosine kinase inhibitors in lung cancer. Br. J. Cancer 2017, 117, 974–983. [Google Scholar] [CrossRef] [Green Version]
- Jiang, Z.; Hao, Y.; Ding, X.; Zhang, Z.; Liu, P.; Wei, X.; Xi, J. The effects and mechanisms of SLC34A2 on tumorigenicity in human non-small cell lung cancer stem cells. Tumor Biol. 2016, 37, 10383–10392. [Google Scholar] [CrossRef]
- Zhang, W.C.; Ng, S.C.; Yang, H.; Rai, A.; Umashankar, S.; Ma, S.; Soh, B.S.; Sun, L.L.; Tai, B.C.; Nga, M.E.; et al. Glycine decarboxylase activity drives non-small cell lung cancer tumor-initiating cells and tumorigenesis. Cell 2012, 148, 259–272. [Google Scholar] [CrossRef] [Green Version]
- Tachezy, M.; Zander, H.; Wolters-Eisfeld, G.; Müller, J.; Wicklein, D.; Gebauer, F.; Izbicki, J.R.; Bockhorn, M. Activated leukocyte cell adhesion molecule (CD166): An “inert” cancer stem cell marker for non-small cell lung cancer? Stem Cells 2014, 32, 1429–1436. [Google Scholar] [CrossRef]
- Wang, J.; Li, Z.; White, J.; Zhang, L. Lung Cancer Stem Cells and Implications for Future Therapeutics. Cell Biochem. Biophys. 2014, 69, 389–398. [Google Scholar] [CrossRef]
- Bertolini, G.; Roz, L.; Perego, P.; Tortoreto, M.; Fontanella, E.; Gatti, L.; Pratesi, G.; Fabbri, A.; Andriani, F.; Tinelli, S.; et al. Highly tumorigenic lung cancer CD133+ cells display stem-like features and are spared by cisplatin treatment. Proc. Natl. Acad. Sci. USA 2009, 106, 16281–16286. [Google Scholar] [CrossRef] [Green Version]
- Eramo, A.; Lotti, F.; Sette, G.; Pilozzi, E.; Biffoni, M.; Di Virgilio, A.; Conticello, C.; Ruco, L.; Peschle, C.; De Maria, R. Identification and expansion of the tumorigenic lung cancer stem cell population. Cell Death Differ. 2008, 15, 504–514. [Google Scholar] [CrossRef]
- Zhang, Y.; Xu, W.; Guo, H.; Zhang, Y.; He, Y.; Lee, S.H.; Song, X.; Li, X.; Guo, Y.; Zhao, Y.; et al. NOTCH1 signaling regulates self-renewal and platinum chemoresistance of cancer stem-like cells in human non-small cell lung cancer. Cancer Res. 2017, 77, 3082–3091. [Google Scholar] [CrossRef] [Green Version]
- Meng, X.; Wang, X.; Wang, Y. More than 45% of A549 and H446 cells are cancer initiating cells: Evidence from cloning and tumorigenic analyses. Oncol. Rep. 2009, 21, 995–1000. [Google Scholar] [PubMed] [Green Version]
- Alama, A.; Gangemi, R.; Ferrini, S.; Barisione, G.; Orengo, A.M.; Truini, M.; Bello, M.G.D.; Grossi, F. CD133-Positive Cells from Non-Small Cell Lung Cancer Show Distinct Sensitivity to Cisplatin and Afatinib. Arch. Immunol. Ther. Exp. 2015, 63, 207–214. [Google Scholar] [CrossRef]
- Watkins, D.N.; Berman, D.M.; Burkholder, S.G.; Wang, B.; Beachy, P.A.; Baylin, S.B. Hedgehog signalling within airway epithelial progenitors and in small-cell lung cancer. Nature 2003, 422, 313–317. [Google Scholar] [CrossRef]
- Po, A.; Silvano, M.; Miele, E.; Capalbo, C.; Eramo, A.; Salvati, V.; Todaro, M.; Besharat, Z.M.; Catanzaro, G.; Cucchi, D.; et al. Noncanonical GLI1 signaling promotes stemness features and in vivo growth in lung adenocarcinoma. Oncogene 2017, 36, 4641–4652. [Google Scholar] [CrossRef] [Green Version]
- Li, H.; Yue, D.; Jin, J.Q.; Woodard, G.A.; Tolani, B.; Luh, T.M.; Giroux-Leprieur, E.; Mo, M.; Chen, Z.; Che, J.; et al. Gli promotes epithelial-mesenchymal transition in human lung adenocarcinomas. Oncotarget 2016, 7, 80415–80425. [Google Scholar] [CrossRef] [Green Version]
- Della Corte, C.M.; Malapelle, U.; Vigliar, E.; Pepe, F.; Troncone, G.; Ciaramella, V.; Troiani, T.; Martinelli, E.; Belli, V.; Ciardiello, F.; et al. Efficacy of continuous EGFR-inhibition and role of Hedgehog in EGFR acquired resistance in human lung cancer cells with activating mutation of EGFR. Oncotarget 2017, 8, 23020–23032. [Google Scholar] [CrossRef] [Green Version]
- Bora-Singhal, N.; Perumal, D.; Nguyen, J.; Chellappan, S. Gli1-Mediated Regulation of Sox2 Facilitates Self-Renewal of Stem-Like Cells and Confers Resistance to EGFR Inhibitors in Non-Small Cell Lung Cancer. Neoplasia 2015, 17, 538–551. [Google Scholar] [CrossRef] [Green Version]
- Schnidar, H.; Eberl, M.; Klingler, S.; Mangelberger, D.; Kasper, M.; Hauser-Kronberger, C.; Regl, G.; Kroismayr, R.; Moriggl, R.; Sibilia, M.; et al. Epidermal Growth Factor Receptor Signaling Synergizes with Hedgehog/GLI in Oncogenic Transformation via Activation of the MEK/ERK/JUN Pathway. Cancer Res. 2009, 69, 1284–1292. [Google Scholar] [CrossRef] [Green Version]
- Lauth, M.; Toftgård, R. Non-canonical activation of GLI transcription factors: Implications for targeted anti-cancer therapy. Cell Cycle 2007, 6, 2458–2463. [Google Scholar] [CrossRef] [Green Version]
- Rosell, R.; Moran, T.; Queralt, C.; Porta, R.; Cardenal, F.; Camps, C.; Majem, M.; Lopez-Vivanco, G.; Isla, D.; Provencio, M.; et al. Screening of epidermal growth factor receptor mutation in lung cancer. N. Engl. J. Med. 2009, 361, 958–967. [Google Scholar] [CrossRef] [Green Version]
- Teocharoen, R.; Ruangritchankul, K.; Vinayanuwattikun, C.; Sriuranpong, V.; Sitthideatphaiboon, P. Vimentin expression status is a potential biomarker for brain metastasis development in EGFR-mutant NSCLC patients. Transl. Lung Cancer Res. 2021, 10, 790–801. [Google Scholar] [CrossRef]
- Richardson, F.; Young, G.D.; Sennello, R.; Wolf, J.; Argast, G.M.; Mercado, P.; Davies, A.; Epstein, D.M.; Wacker, B. The Evaluation of E-Cadherin and Vimentin as Biomarkers of Clinical Outcomes Among Patients with Non-small Cell Lung Cancer Treated with Erlotinib as Second- or Third-line Therapy. Anticancer Res. 2012, 32, 537–552. [Google Scholar]
- Wen, G.-M.; Mou, F.-F.; Hou, W.; Wang, D.; Xia, P. Integrative Analysis of CD133 mRNA in Human Cancers Based on Data Mining. Stem Cell Rev. Rep. 2019, 15, 23–34. [Google Scholar] [CrossRef]
- Janikova, M.; Skarda, J.; Dziechciarkova, M.; Radova, L.; Chmelova, J.; Krejci, V.; Sedlakova, E.; Zapletalova, J.; Langova, K.; Klein, J.; et al. Identification of CD133+/Nestin+ Putative Cancer Stem Cells in Non-Small Cell Lung Cancer. Biomed. Pap. Med. Fac. Univ. Palacky Olomouc Czech Repub. 2010, 154, 321–326. [Google Scholar] [CrossRef] [Green Version]
- Herpel, E.; Jensen, K.; Muley, T.; Warth, A.; Schnabel, P.A.; Meister, M.; Herth, F.J.F.; Dienemann, H.; Thomas, M.; Gottschling, S. The cancer stem cell antigens CD133, BCRP1/ABCG2 and CD117/c-KIT are not associated with prognosis in resected early-stage non-small cell lung cancer. Anticancer Res. 2011, 31, 4491–4500. [Google Scholar]
- Okudela, K.; Woo, T.; Mitsui, H.; Tajiri, M.; Masuda, M.; Ohashi, K. Expression of the potential cancer stem cell markers, CD133, CD44, ALDH1, and β-catenin, in primary lung adenocarcinoma-their prognostic significance. Pathol. Int. 2012, 62, 792–801. [Google Scholar] [CrossRef]
- Mizugaki, H.; Sakakibara-Konishi, J.; Kikuchi, J.; Moriya, J.; Hatanaka, K.C.; Kikuchi, E.; Kinoshita, I.; Oizumi, S.; Dosaka-Akita, H.; Matsuno, Y.; et al. CD133 expression: A potential prognostic marker for non-small cell lung cancers. Int. J. Clin. Oncol. 2014, 19, 254–259. [Google Scholar] [CrossRef]


| Side | Magnification | ||
|---|---|---|---|
| ×1000 | ×5000 | ||
| 10% PCL | Top |  | 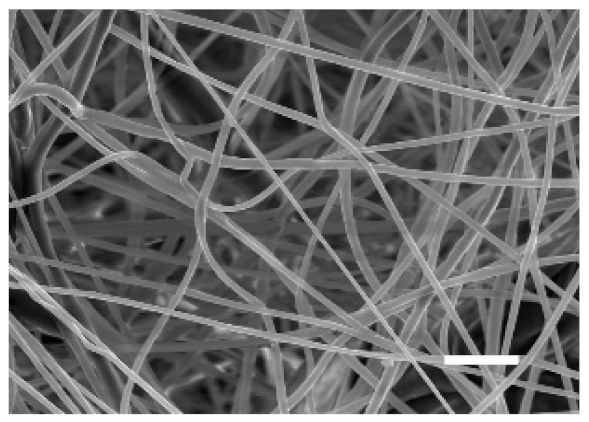 |
| Bottom | 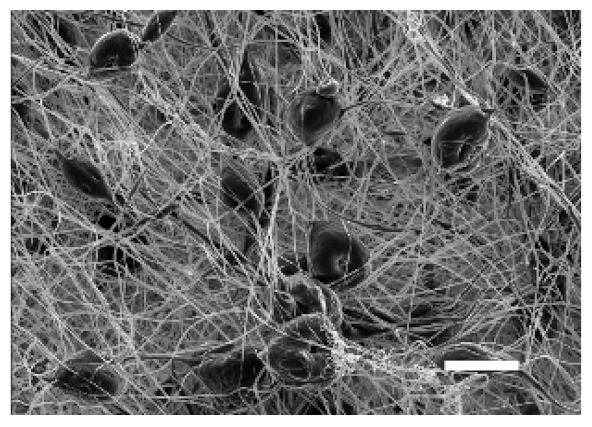 | 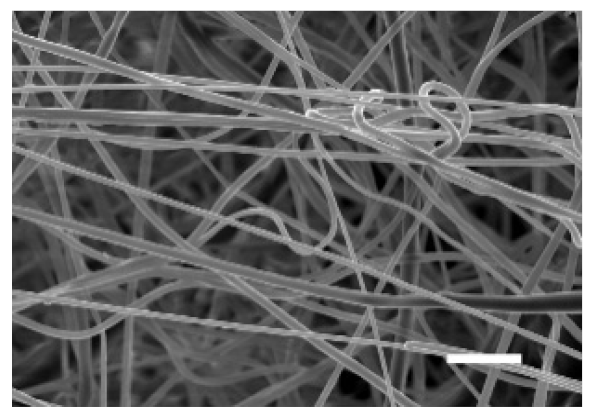 | |
| 15% PCL | Top |  | 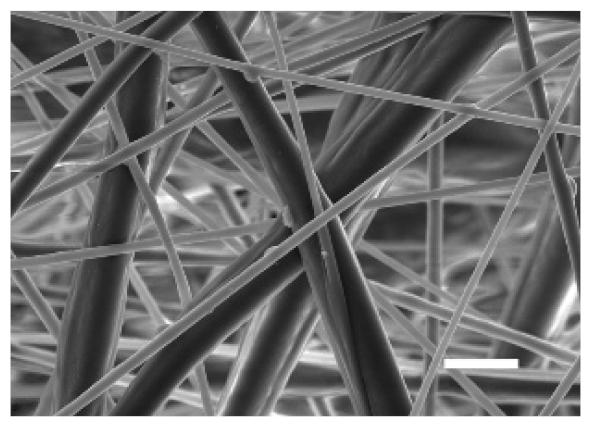 |
| Bottom | 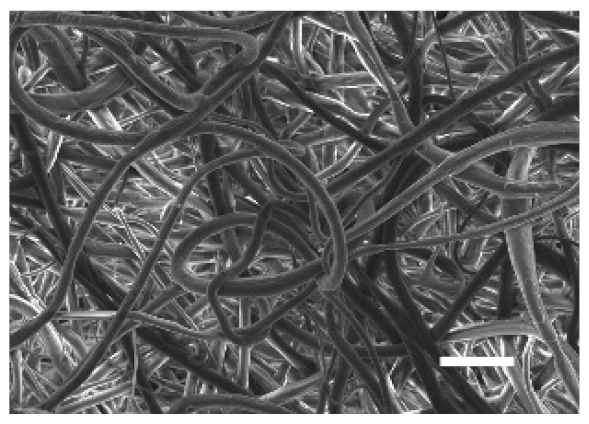 | 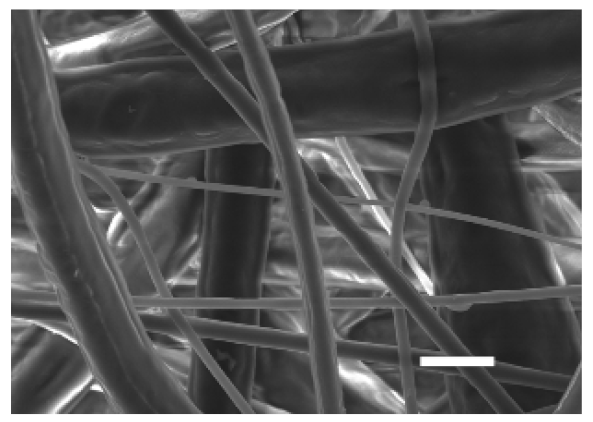 | |
| Scale bars: 15 µm | Scale bars: 3 µm | ||
| Parameter | 10% PCL | 15% PCL |
|---|---|---|
| Filament diameter (nm) | 315.67 ± 21.84 | 1764.42 ± 333.43 (***) |
| Surface Porosity (%) | 68.26 ± 1.06 | 82.29 ± 3.68 (***) |
| Pore Area (µm2) | 0.36 ± 0.13 | 0.73 ± 0.25 (***) |
Publisher’s Note: MDPI stays neutral with regard to jurisdictional claims in published maps and institutional affiliations. |
© 2021 by the authors. Licensee MDPI, Basel, Switzerland. This article is an open access article distributed under the terms and conditions of the Creative Commons Attribution (CC BY) license (https://creativecommons.org/licenses/by/4.0/).
Share and Cite
Polonio-Alcalá, E.; Rabionet, M.; Ruiz-Martínez, S.; Palomeras, S.; Porta, R.; Vásquez-Dongo, C.; Bosch-Barrera, J.; Puig, T.; Ciurana, J. Polycaprolactone Electrospun Scaffolds Produce an Enrichment of Lung Cancer Stem Cells in Sensitive and Resistant EGFRm Lung Adenocarcinoma. Cancers 2021, 13, 5320. https://doi.org/10.3390/cancers13215320
Polonio-Alcalá E, Rabionet M, Ruiz-Martínez S, Palomeras S, Porta R, Vásquez-Dongo C, Bosch-Barrera J, Puig T, Ciurana J. Polycaprolactone Electrospun Scaffolds Produce an Enrichment of Lung Cancer Stem Cells in Sensitive and Resistant EGFRm Lung Adenocarcinoma. Cancers. 2021; 13(21):5320. https://doi.org/10.3390/cancers13215320
Chicago/Turabian StylePolonio-Alcalá, Emma, Marc Rabionet, Santiago Ruiz-Martínez, Sònia Palomeras, Rut Porta, Carmen Vásquez-Dongo, Joaquim Bosch-Barrera, Teresa Puig, and Joaquim Ciurana. 2021. "Polycaprolactone Electrospun Scaffolds Produce an Enrichment of Lung Cancer Stem Cells in Sensitive and Resistant EGFRm Lung Adenocarcinoma" Cancers 13, no. 21: 5320. https://doi.org/10.3390/cancers13215320
APA StylePolonio-Alcalá, E., Rabionet, M., Ruiz-Martínez, S., Palomeras, S., Porta, R., Vásquez-Dongo, C., Bosch-Barrera, J., Puig, T., & Ciurana, J. (2021). Polycaprolactone Electrospun Scaffolds Produce an Enrichment of Lung Cancer Stem Cells in Sensitive and Resistant EGFRm Lung Adenocarcinoma. Cancers, 13(21), 5320. https://doi.org/10.3390/cancers13215320