T-Cell Lymphoma Clonality by Copy Number Variation Analysis of T-Cell Receptor Genes

 , , , , ,
  , , add
Show full author list
, , add
Show full author list
Abstract
Simple Summary
Abstract
1. Introduction
2. Results
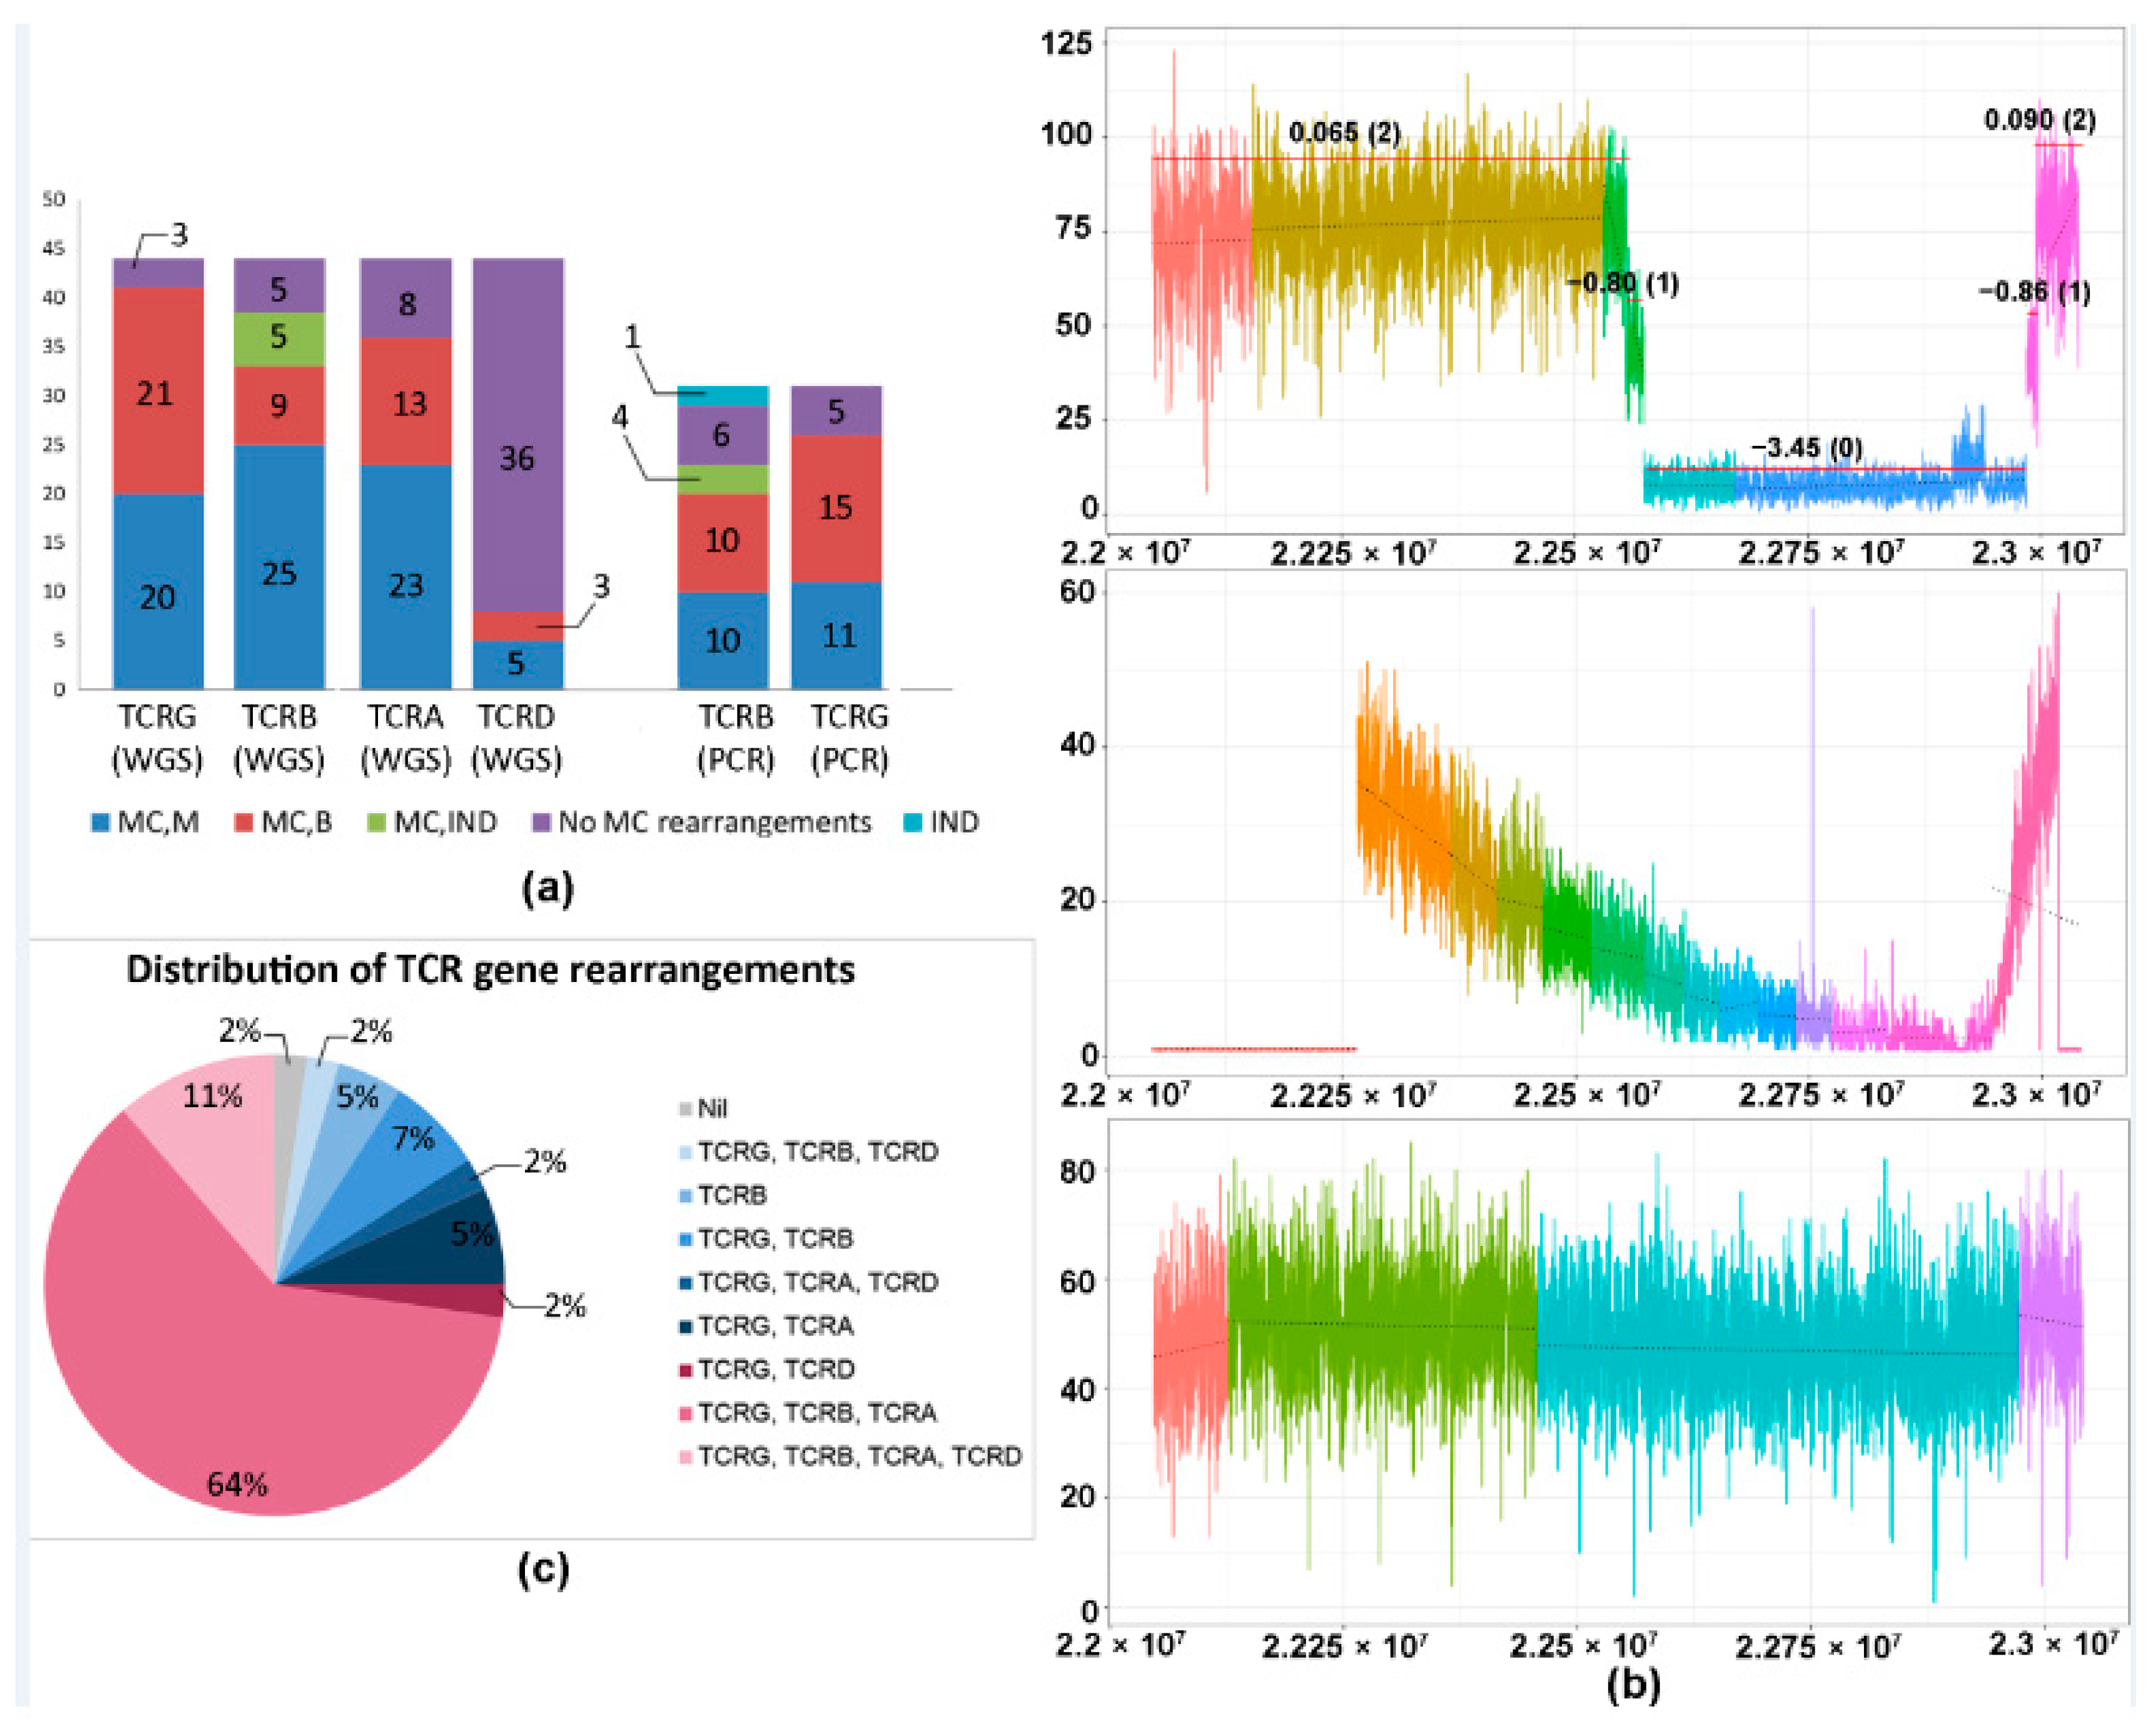
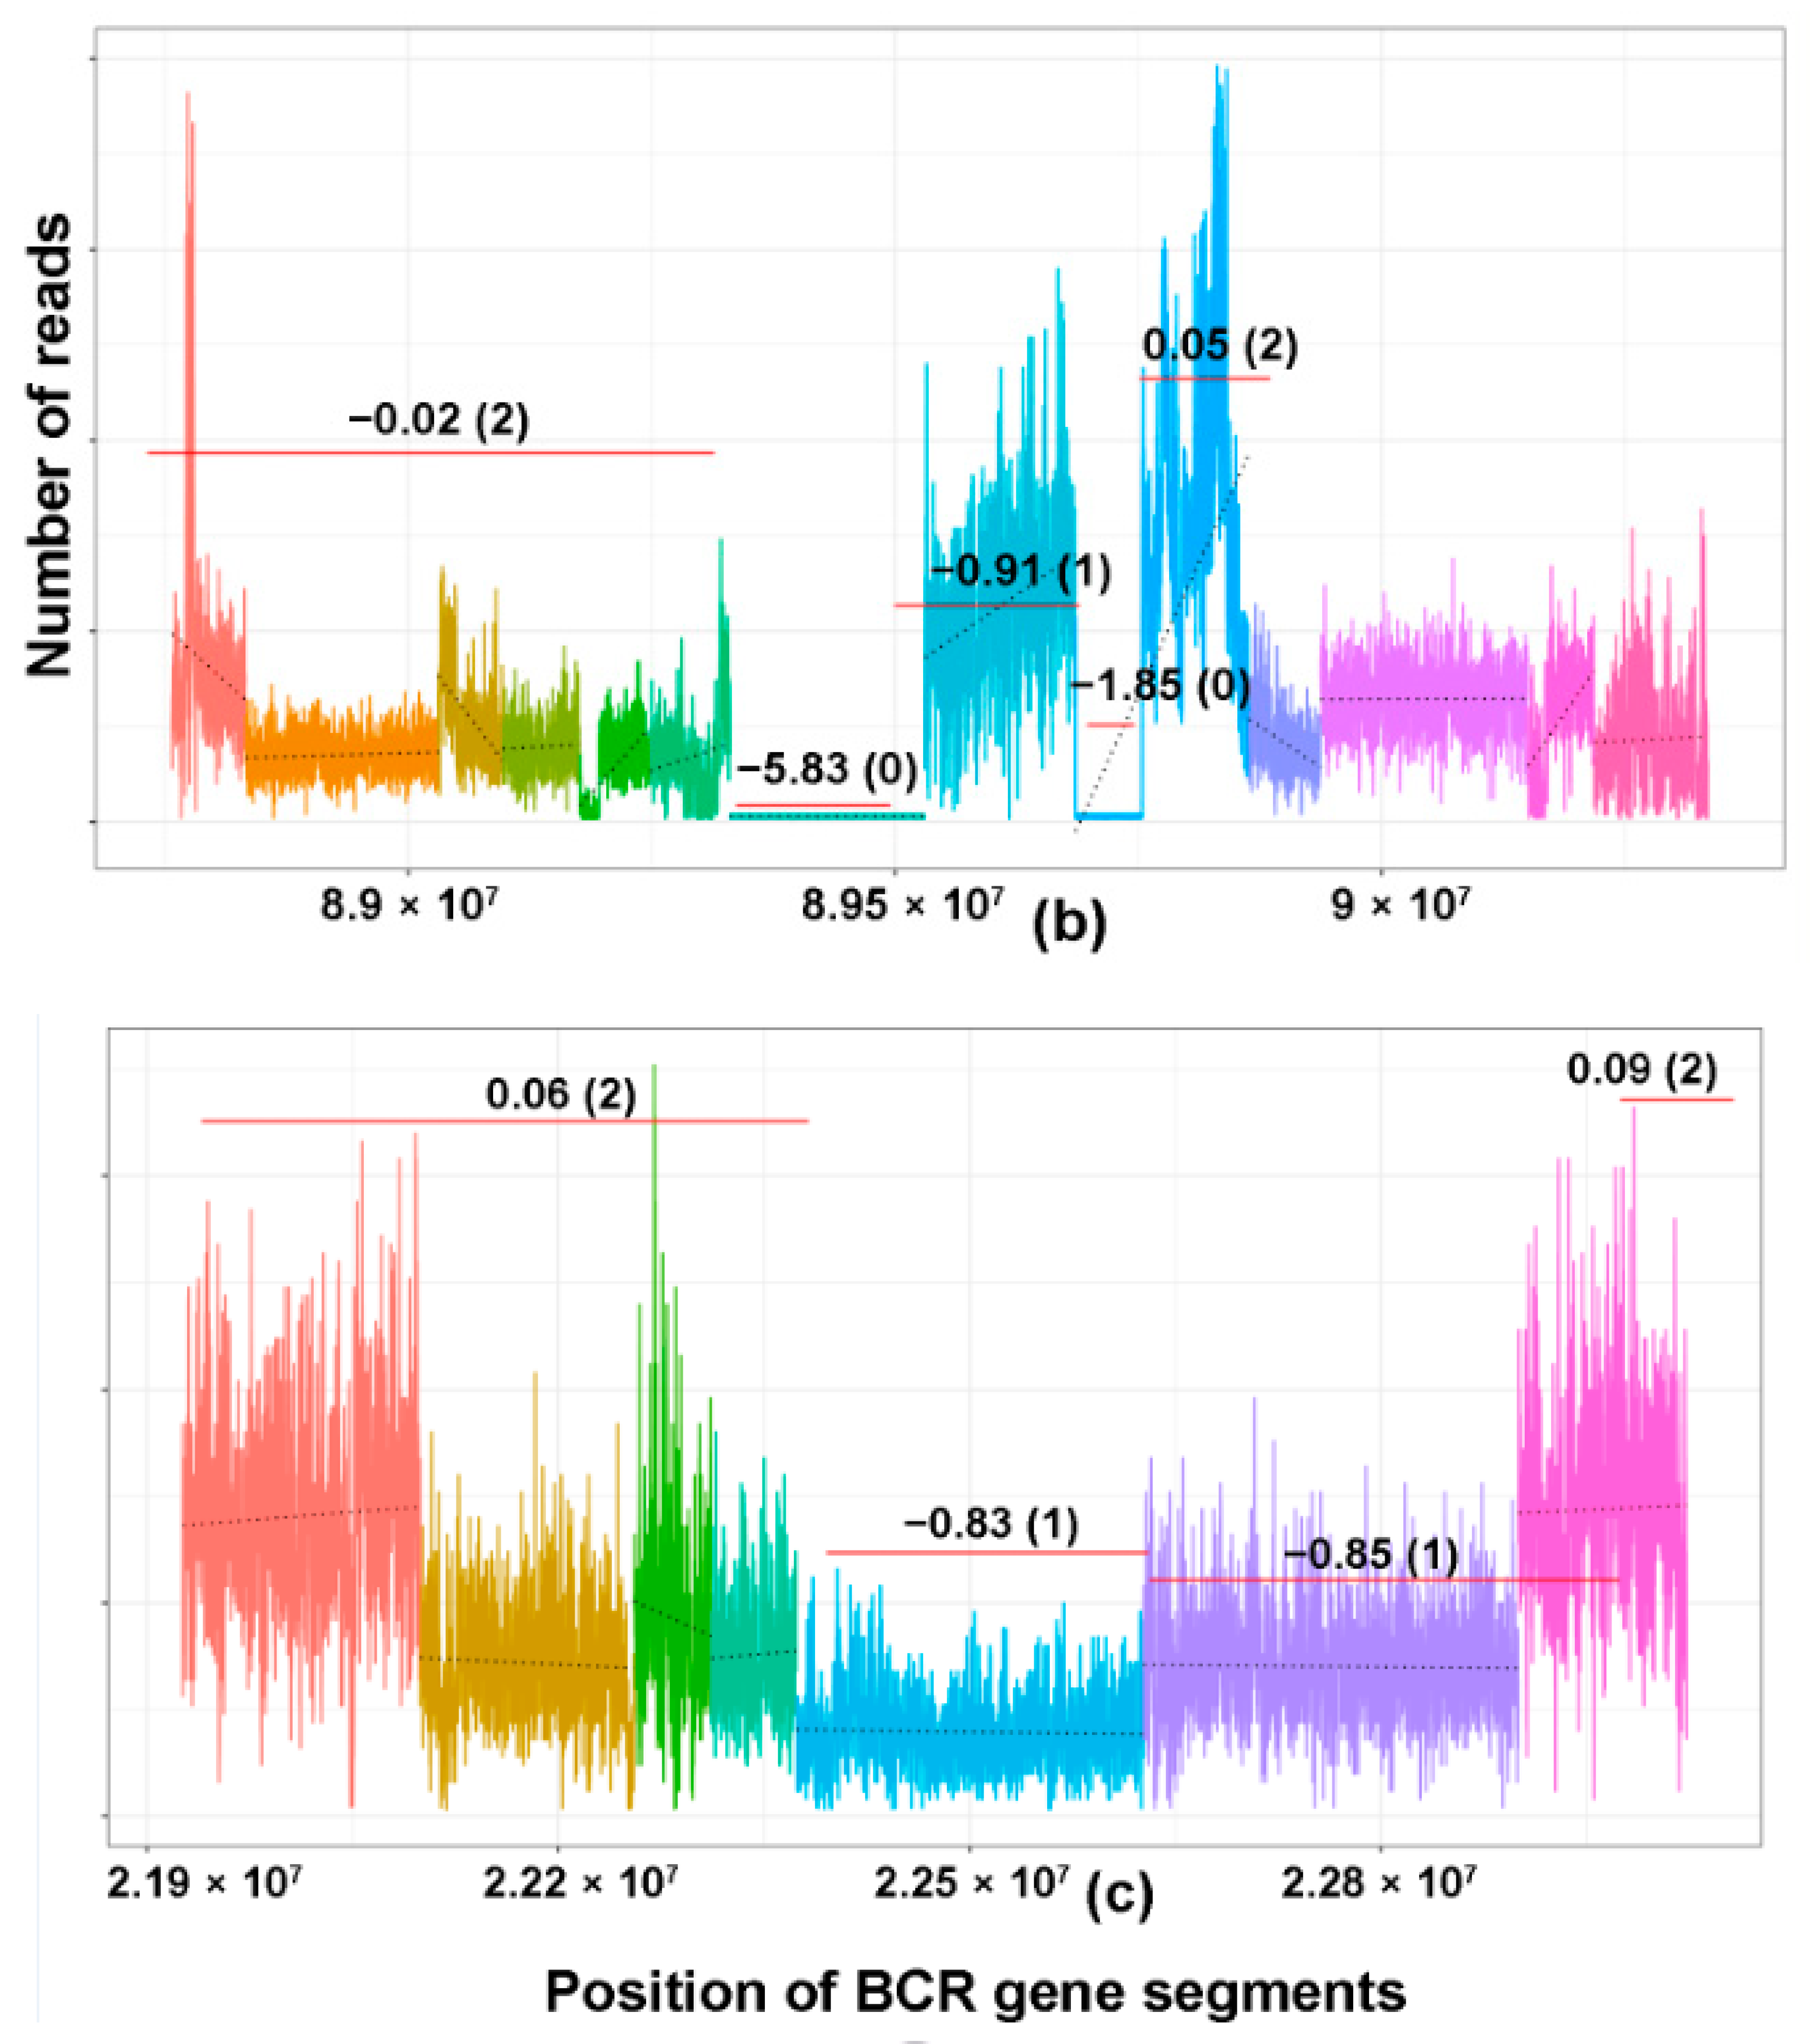
2.1. CNV Analysis of TCR and Ig Loci in TCLs and ENKTL
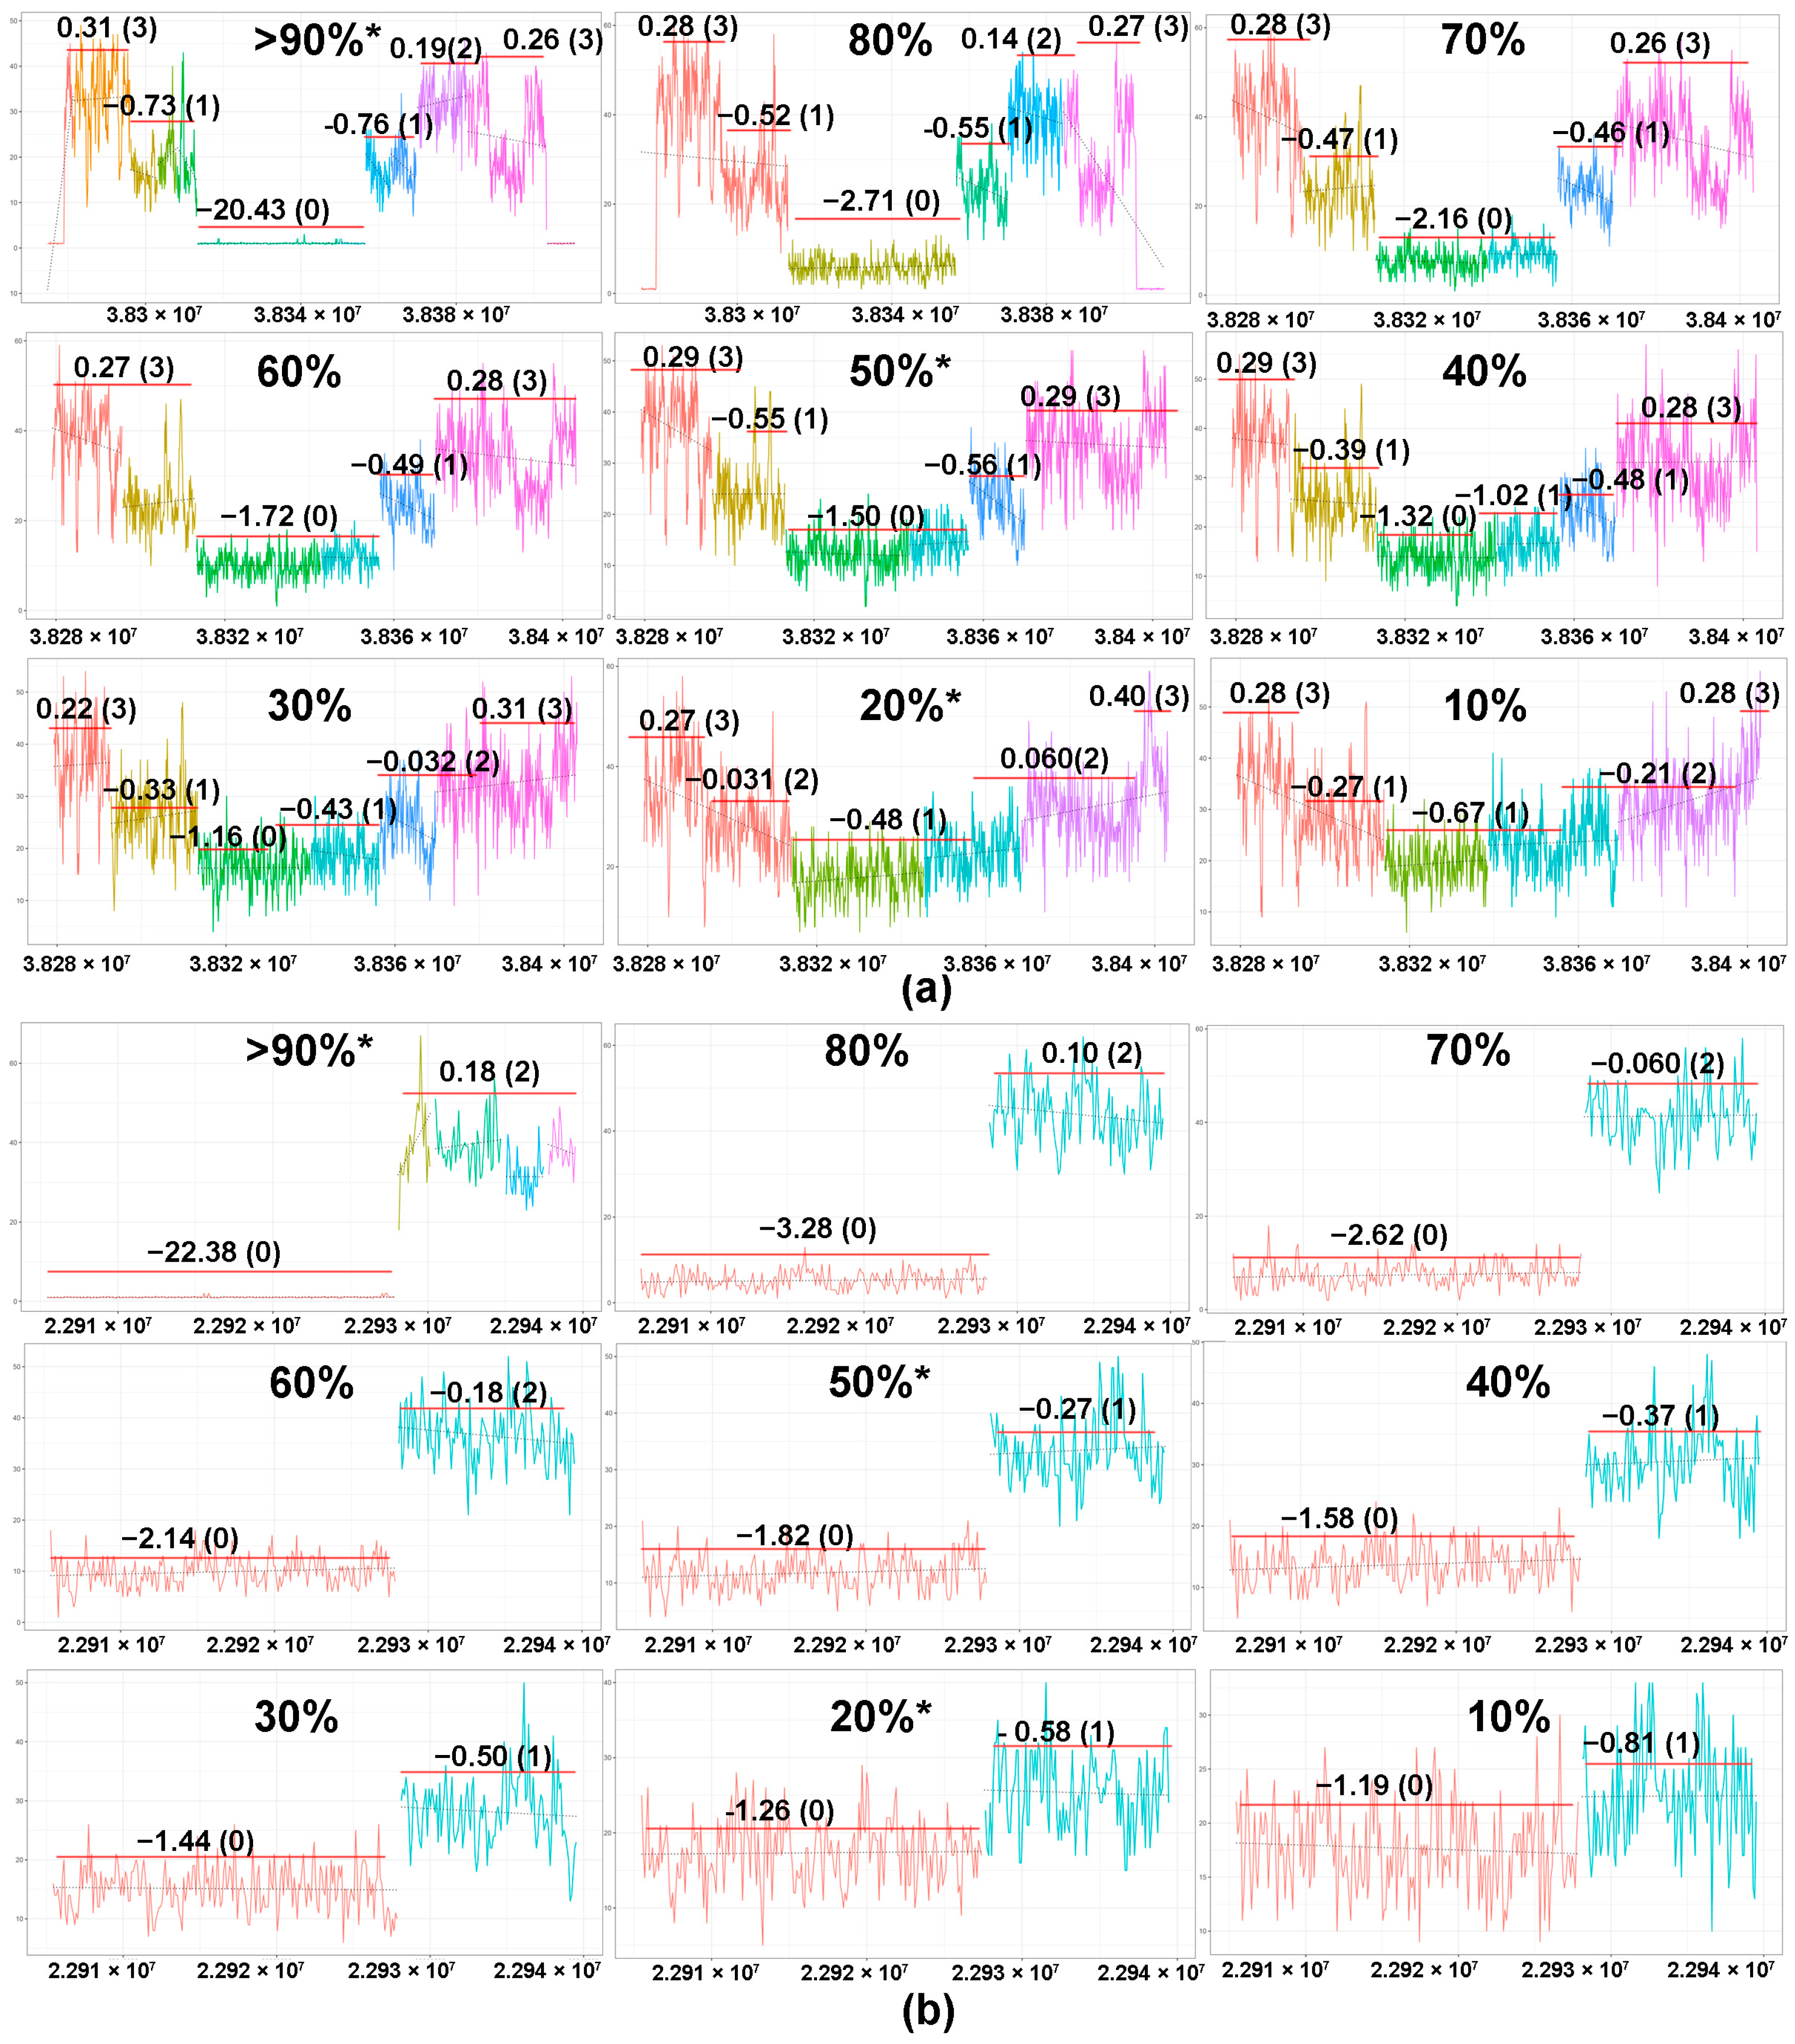
2.2. Tumor Content and In Silico Sensitivity Analysis
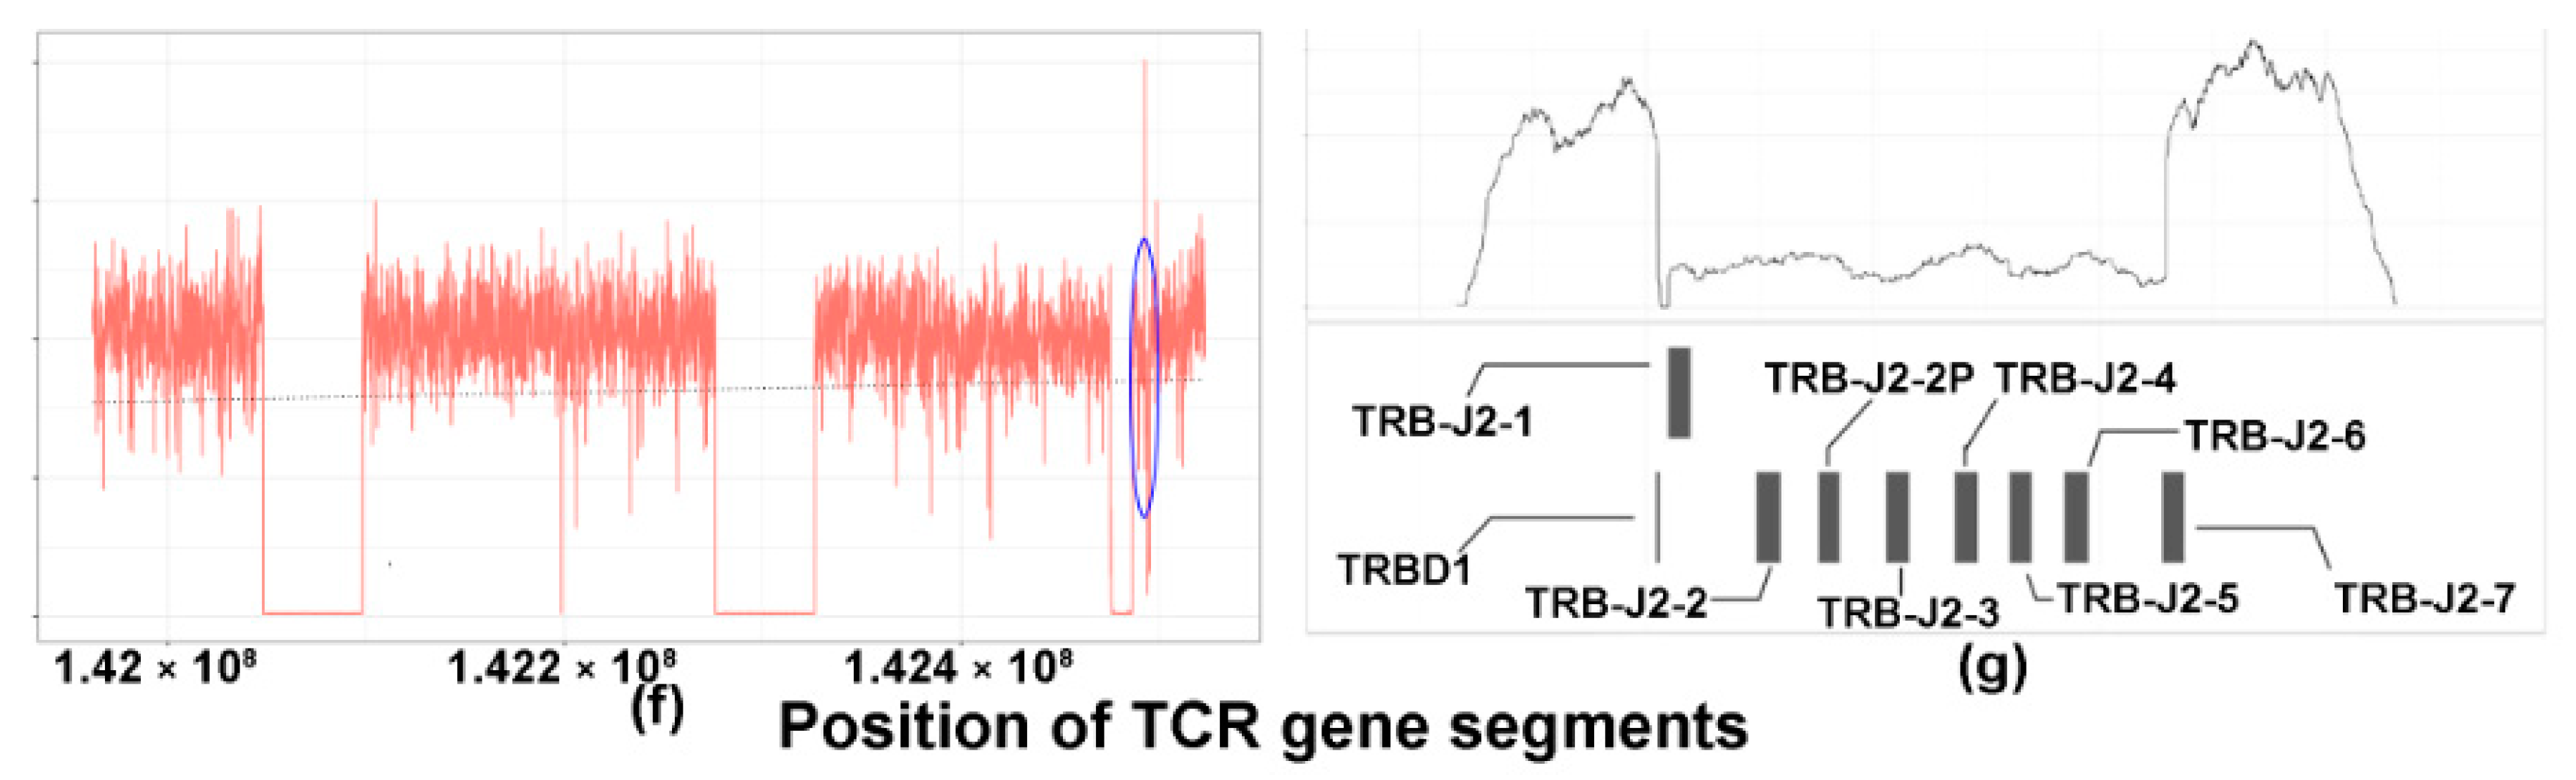
2.3. TCRB Rearrangements
2.4. CNV Analysis of DLBCL Cell Lines
3. Discussion
4. Materials and Methods
4.1. Case Selection
4.2. Preparation of Genomic DNA for WGS
4.3. WGS and Determination of Copy Number Aberrations
4.4. Segmentation of Coverage Plots
4.5. Copy Number Prediction and Analysis
4.6. WGS of DLBCL Cell Lines
4.7. Estimation of Tumor Content
4.8. Sensitivity Testing Using In Silico Dilutional Analysis
4.9. Analysis of TCRB and TCRG Clonality by PCR
4.10. Targeted Sequencing of TCRB and Analysis
5. Conclusions
Supplementary Materials
Author Contributions
Funding
Institutional Review Board Statement
Informed Consent Statement
Data Availability Statement
Conflicts of Interest
References
- Tak Mak, M.S.; Jett, B. Primer to the Immune Response, 2nd ed.; Academic Cell: Burlington, MA, USA, 2014. [Google Scholar]
- Bruggemann, M.; White, H.; Gaulard, P.; Garcia-Sanz, R.; Gameiro, P.; Oeschger, S.; Jasani, B.; Ott, M.; Delsol, G.; Orfao, A.; et al. Powerful strategy for polymerase chain reaction-based clonality assessment in t-cell malignancies report of the biomed-2 concerted action bhm4 ct98-3936. Leukemia 2007, 21, 215–221. [Google Scholar] [CrossRef] [PubMed]
- Van Dongen, J.J.; Langerak, A.W.; Bruggemann, M.; Evans, P.A.; Hummel, M.; Lavender, F.L.; Delabesse, E.; Davi, F.; Schuuring, E.; Garcia-Sanz, R.; et al. Design and standardization of pcr primers and protocols for detection of clonal immunoglobulin and t-cell receptor gene recombinations in suspect lymphoproliferations: Report of the biomed-2 concerted action bmh4-ct98-3936. Leukemia 2003, 17, 2257–2317. [Google Scholar] [CrossRef] [PubMed]
- Khor, B.; Wehrly, T.D.; Sleckman, B.P. Chromosomal excision of tcrdelta chain genes is dispensable for alphabeta t cell lineage commitment. Int. Immunol. 2005, 17, 225–232. [Google Scholar] [CrossRef] [PubMed]
- Mahe, E.; Pugh, T.; Kamel-Reid, S. T cell clonality assessment: Past, present and future. J. Clin. Pathol. 2018, 71, 195–200. [Google Scholar] [CrossRef] [PubMed]
- Ng, S.B.; Chung, T.H.; Kato, S.; Nakamura, S.; Takahashi, E.; Ko, Y.H.; Khoury, J.D.; Yin, C.C.; Soong, R.; Jeyasekharan, A.D.; et al. Epstein-barr virus-associated primary nodal t/nk-cell lymphoma shows a distinct molecular signature and copy number changes. Haematologica 2018, 103, 278–287. [Google Scholar] [CrossRef]
- Tan, B.T.; Seo, K.; Warnke, R.A.; Arber, D.A. The frequency of immunoglobulin heavy chain gene and t-cell receptor gamma-chain gene rearrangements and epstein-barr virus in alk+ and alk- anaplastic large cell lymphoma and other peripheral t-cell lymphomas. J. Mol. Diagn. 2008, 10, 502–512. [Google Scholar] [CrossRef]
- Huang, Y.; Chen, S.; Wei, R.; Guo, X.; Yang, X.; Cao, Q.; Yang, Y.; Yun, J. Cd20-positive extranodal nk/t cell lymphoma: Clinicopathologic and prognostic features. Virchows Archiv. 2020, 477, 873–883. [Google Scholar] [CrossRef]
- Tan, B.T.; Warnke, R.A.; Arber, D.A. The frequency of b- and t-cell gene rearrangements and epstein-barr virus in t-cell lymphomas: A comparison between angioimmunoblastic t-cell lymphoma and peripheral t-cell lymphoma, unspecified with and without associated b-cell proliferations. J. Mol. Diagn. 2006, 8, 466–475. [Google Scholar] [CrossRef]
- Hodges, E.; Krishna, M.T.; Pickard, C.; Smith, J.L. Diagnostic role of tests for t cell receptor (tcr) genes. J. Clin. Pathol. 2003, 56, 1–11. [Google Scholar] [CrossRef]
- Janeway, C.A., Jr.; Travers, P.; Walport, M.; Shlomchik, M.J. T-cell receptor gene rearrangement. In Immunobiology: The Immune System in Health and Disease, 5th ed.; Garland Science: New York, NY, USA, 2001. [Google Scholar]
- Langerak, A.W.; Groenen, P.J.T.A.; Brüggemann, M.; Beldjord, K.; Bellan, C.; Bonello, L.; Boone, E.; Carter, G.I.; Catherwood, M.; Davi, F.; et al. Euroclonality/biomed-2 guidelines for interpretation and reporting of ig/tcr clonality testing in suspected lymphoproliferations. Leukemia 2012, 26, 2159–2171. [Google Scholar] [CrossRef]
- McClure, R.F.; Kaur, P.; Pagel, E.; Ouillette, P.D.; Holtegaard, C.E.; Treptow, C.L.; Kurtin, P.J. Validation of immunoglobulin gene rearrangement detection by pcr using commercially available biomed-2 primers. Leukemia 2006, 20, 176–179. [Google Scholar] [CrossRef]
- Groenen, P.J.; Langerak, A.W.; van Dongen, J.J.; van Krieken, J.H. Pitfalls in tcr gene clonality testing: Teaching cases. J. Hematopathol. 2008, 1, 97–109. [Google Scholar] [CrossRef]
- Bagg, A.; Braziel, R.M.; Arber, D.A.; Bijwaard, K.E.; Chu, A.Y. Immunoglobulin heavy chain gene analysis in lymphomas: A multi-center study demonstrating the heterogeneity of performance of polymerase chain reaction assays. J. Mol. Diagn. 2002, 4, 81–89. [Google Scholar] [CrossRef]
- Cushman-Vokoun, A.M.; Connealy, S.; Greiner, T.C. Assay design affects the interpretation of t-cell receptor gamma gene rearrangements: Comparison of the performance of a one-tube assay with the biomed-2-based tcrg gene clonality assay. J. Mol. Diagn. 2010, 12, 787–796. [Google Scholar] [CrossRef]
- Fitzgerald, J.E.; Ricalton, N.S.; Meyer, A.C.; West, S.G.; Kaplan, H.; Behrendt, C.; Kotzin, B.L. Analysis of clonal cd8+ t cell expansions in normal individuals and patients with rheumatoid arthritis. J. Immunol. 1995, 154, 3538–3547. [Google Scholar]
- Strioga, M.; Pasukoniene, V.; Characiejus, D. Cd8+ cd28- and cd8+ cd57+ t cells and their role in health and disease. Immunology 2011, 134, 17–32. [Google Scholar] [CrossRef]
- Wolniak, K.L.; Goolsby, C.L.; Chen, Y.H.; Chenn, A.; Singhal, S.; Mehta, J.; Peterson, L.A. Expansion of a clonal cd8+cd57+ large granular lymphocyte population after autologous stem cell transplant in multiple myeloma. Am. J. Clin. Pathol. 2013, 139, 231–241. [Google Scholar] [CrossRef]
- Smirnova, S.J.; Sidorova, J.V.; Tsvetaeva, N.V.; Nikulina, O.F.; Biderman, B.V.; Nikulina, E.E.; Kulikov, S.M.; Sudarikov, A.B. Expansion of cd8+ cells in autoimmune hemolytic anemia. Autoimmunity 2016, 49, 147–154. [Google Scholar] [CrossRef]
- Lim, A.; Toubert, A.; Pannetier, C.; Dougados, M.; Charron, D.; Kourilsky, P.; Even, J. Spread of clonal t-cell expansions in rheumatoid arthritis patients. Human Immunol. 1996, 48, 77–83. [Google Scholar] [CrossRef]
- Lima, M.; Teixeira Mdos, A.; Queirós, M.L.; Santos, A.H.; Gonçalves, C.; Correia, J.; Farinha, F.; Mendonça, F.; Soares, J.M.; Almeida, J.; et al. Immunophenotype and tcr-vbeta repertoire of peripheral blood t-cells in acute infectious mononucleosis. Blood Cells Mol. Dis. 2003, 30, 1–12. [Google Scholar] [CrossRef]
- Langerak, A.W.; van Dongen, J.J.M. Multiple clonal ig/tcr products: Implications for interpretation of clonality findings. J. Hematopathol. 2012, 5, 35–43. [Google Scholar] [CrossRef][Green Version]
- Brüggemann, M.; Kotrová, M.; Knecht, H.; Bartram, J.; Boudjogrha, M.; Bystry, V.; Fazio, G.; Froňková, E.; Giraud, M.; Grioni, A.; et al. Standardized next-generation sequencing of immunoglobulin and t-cell receptor gene recombinations for mrd marker identification in acute lymphoblastic leukaemia; a euroclonality-ngs validation study. Leukemia 2019, 33, 2241–2253. [Google Scholar] [CrossRef] [PubMed]
- Scheijen, B.; Meijers, R.W.J.; Rijntjes, J.; van der Klift, M.Y.; Möbs, M.; Steinhilber, J.; Reigl, T.; van den Brand, M.; Kotrová, M.; Ritter, J.-M.; et al. Next-generation sequencing of immunoglobulin gene rearrangements for clonality assessment: A technical feasibility study by euroclonality-ngs. Leukemia 2019, 33, 2227–2240. [Google Scholar] [CrossRef] [PubMed]
- De Masson, A.; O’Malley, J.T.; Elco, C.P.; Garcia, S.S.; Divito, S.J.; Lowry, E.L.; Tawa, M.; Fisher, D.C.; Devlin, P.M.; Teague, J.E.; et al. High-throughput sequencing of the t cell receptor β gene identifies aggressive early-stage mycosis fungoides. Sci. Transl. Med. 2018, 10, eaar5894. [Google Scholar] [CrossRef] [PubMed]
- Kirsch, I.R.; Watanabe, R.; O’Malley, J.T.; Williamson, D.W.; Scott, L.L.; Elco, C.P.; Teague, J.E.; Gehad, A.; Lowry, E.L.; LeBoeuf, N.R.; et al. Tcr sequencing facilitates diagnosis and identifies mature t cells as the cell of origin in ctcl. Sci. Transl. Med. 2015, 7, 308ra158. [Google Scholar] [CrossRef] [PubMed]
- Affymetrix. User Guide Oncoscan® ffpe Assay Kit; Affymetrix: Santa Clara, CA, USA, 2014. [Google Scholar]
- Swerdlow, S.H.; Campo, E.; Harris, N.L.; Jaffe, E.S.; Pileri, S.A.; Stein, H.; Thiele, J. WHO Classification of Tumours of Haematopoietic and Lymphoid Tissues; IARC: Lyon, France, 2017. [Google Scholar]
- Talevich, E. Copy Number Calling Pipeline. Available online: https://cnvkit.readthedocs.io/en/stable/pipeline.html#calling-methods (accessed on 22 December 2020).
- Nilsen, G.; Liestøl, K.; Van Loo, P.; Moen Vollan, H.K.; Eide, M.B.; Rueda, O.M.; Chin, S.-F.; Russell, R.; Baumbusch, L.O.; Caldas, C.; et al. Copynumber: Efficient algorithms for single- and multi-track copy number segmentation. BMC Genom. 2012, 13, 591. [Google Scholar] [CrossRef]
- Talevich, E.; Shain, A.H.; Botton, T.; Bastian, B.C. Cnvkit: Genome-wide copy number detection and visualization from targeted DNA sequencing. PLoS Comput. Biol. 2016, 12, e1004873. [Google Scholar] [CrossRef]
- Bolotin, D.A.; Poslavsky, S.; Mitrophanov, I.; Shugay, M.; Mamedov, I.Z.; Putintseva, E.V.; Chudakov, D.M. Mixcr: Software for comprehensive adaptive immunity profiling. Nat. Methods 2015, 12, 380–381. [Google Scholar] [CrossRef]
- Giraud, M.; Salson, M.; Duez, M.; Villenet, C.; Quief, S.; Caillault, A.; Grardel, N.; Roumier, C.; Preudhomme, C.; Figeac, M. Fast multiclonal clusterization of v(d)j recombinations from high-throughput sequencing. BMC Genom. 2014, 15, 409. [Google Scholar] [CrossRef]
- Robbe, P.; Popitsch, N.; Knight, S.J.L.; Antoniou, P.; Becq, J.; He, M.; Kanapin, A.; Samsonova, A.; Vavoulis, D.V.; Ross, M.T.; et al. Clinical whole-genome sequencing from routine formalin-fixed, paraffin-embedded specimens: Pilot study for the 100,000 genomes project. Gen. Med. Off. J. Am. Coll. Med. Genet. 2018, 20, 1196–1205. [Google Scholar] [CrossRef]


| Frequency and Nature of Monoclonal Rearrangements of Combinations and Individual TCR Genes in WGS TCL Cohort | ||||
|---|---|---|---|---|
| Combinations of Monoclonal TCR Rearrangements | Number of Cases with Particular Rearrangement (%) (n = 44) | |||
| Nil | 1 (2) | |||
| TCRB | 2 (5) | |||
| TCRG, TCRA | 2 (5) | |||
| TCRG, TCRB | 3 (7) | |||
| TCRG, TCRD | 1 (2) | |||
| TCRG, TCRB, TCRA | 28 (64) | |||
| TCRG, TCRB, TCRD | 1 (2) | |||
| TCRG, TCRA, TCRD | 1 (2) | |||
| TCRG, TCRB, TCRA, TCRD | 5 (12) | |||
| Total monoclonal cases | 43 (98) | |||
| Frequency of Monoclonal Rearrangements of TCR Gene | TCRG (n = 44) | TCRB (n = 44) | TCRA (n = 44) | TCRD (n = 44) |
| No. with monoclonal rearrangements (%) | 41 (93) | 39 (89) | 36 (82) | 8 (18) |
| No. without monoclonal rearrangements (%) | 3 (7) | 5 (11) | 8 (18) | 36 (82) |
| Allelic Status of Monoclonal TCR Genes | TCRG (n = 41) | TCRB (n = 34) # | TCRA (n = 36) | TCRD (n = 8) |
| No. of monoallelic rearrangements (%) | 20 (49) | 25 (73) | 23 (64) | 5 (63) |
| No. of biallelic rearrangements (%) | 21 (51) | 9 (27) | 13 (36) | 3 (38) |
| Frequency and Nature of Monoclonal Rearrangements of TCR Genes in PCR TCL Cohort | ||||
| Combinations of Monoclonal TCR Rearrangements | Number of Cases with Particular Rearrangement (%) (n = 31) | |||
| Nil | 3 (10) | |||
| TCRB | 2 (6) | |||
| TCRG | 3 (10) | |||
| TCRG, TCRB | 22 (71) | |||
| TCRG, indeterminate for TCRB | 1 (3) | |||
| Total monoclonal cases | 28 (91) | |||
| Frequency of Monoclonal Rearrangements of TCR Gene | TCRG (n = 31) | TCRB (n = 31) | ||
| No. with monoclonal rearrangements (%) | 26 (84) | 24 (77) | ||
| No. without monoclonal rearrangements (%) | 5 (16) | 6 (19) | ||
| No. with indeterminate rearrangements | 0 | 1 (3) | ||
| Allelic Status of Monoclonal TCR Genes | TCRG (n = 26) | TCRB (n = 20) ## | ||
| No. of monoallelic rearrangements (%) | 11 (42) | 10 (50) | ||
| No. of biallelic rearrangements (%) | 15 (58) | 10 (50) | ||
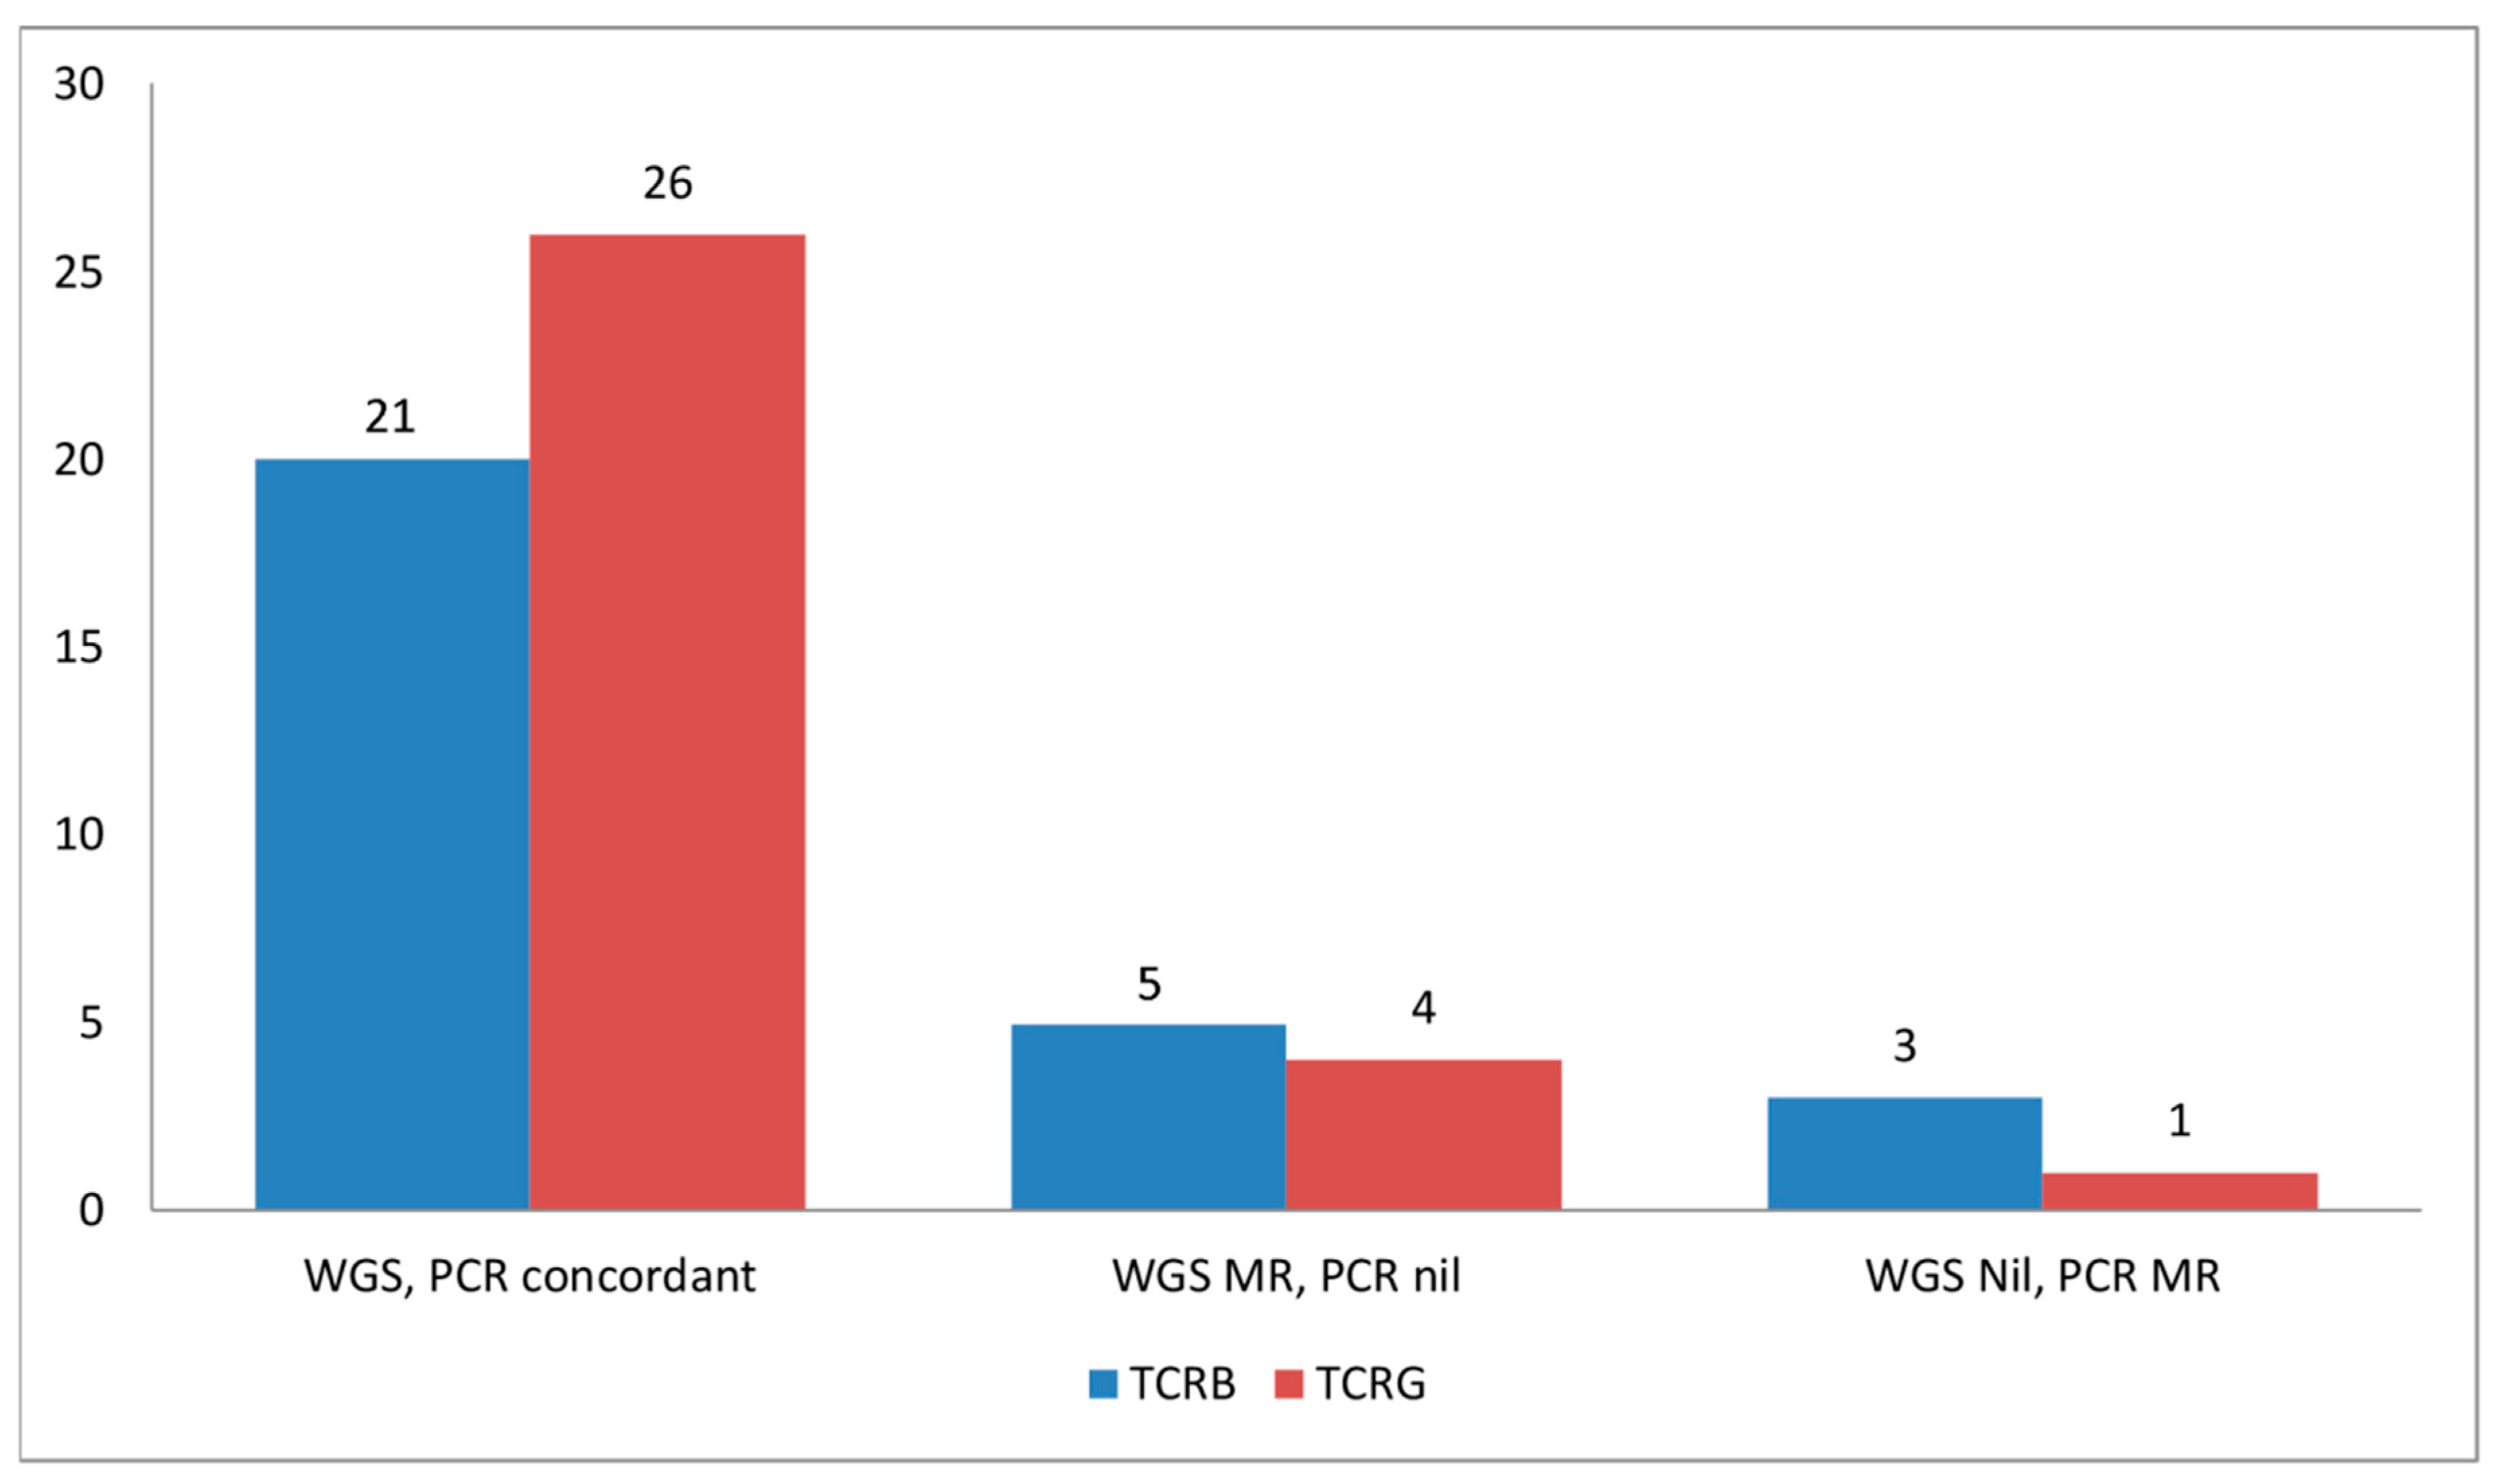
| Case No. | Case ID | TCRG MR on WGS | TCRG MR on PCR | TCRB MR on WGS | TCRB MR on PCR | Color Legend | |||
|---|---|---|---|---|---|---|---|---|---|
| 5 | z3917 | No | Yes | Yes | Yes | WGS Monoclonal, PCR No Rearrangement for TCRG | |||
| 3 | z9951 | Yes | Yes | Yes | No | WGS no rearrangement, PCR monoclonal for TCRG | |||
| 6 | AITL13 | Yes | Yes | Yes | Yes | WGS monoclonal, PCR no rearrangement for TCRB | |||
| 12 | TR4323 | Yes | Yes | Yes | Yes | WGS no rearrangement, PCR monoclonal for TCRB | |||
| 15 | 229A | Yes | Yes | Yes | Yes | ||||
| 16 | PTCL02 | Yes | Yes | No | Yes | ||||
| 18 | T1443KC | Yes | Yes | Yes | Yes | ||||
| 20 | 496A | Yes | Yes | Yes | Yes | ||||
| 22 | TR4241 | Yes | Yes | Yes | Yes | ||||
| 23 | 69A | Yes | Yes | Yes | No | ||||
| 24 | 211A | Yes | Yes | Yes | Yes | ||||
| 25 | z4739 | Yes | Yes | Yes | Yes | ||||
| 26 | z5286 | Yes | Yes | No | Yes | ||||
| 28 | z3706 | Yes | Yes | Yes | Yes | ||||
| 29 | TR4290 | Yes | Yes | Yes | Yes | ||||
| 30 | AITL10 | Yes | Yes | Yes | Yes | ||||
| 32 | SLS0697 | Yes | Yes | No | IND | ||||
| 33 | z2756 | Yes | Yes | Yes | Yes | ||||
| 34 | z8043 | Yes | Yes | Yes | Yes | ||||
| 36 | z4110 | Yes | Yes | Yes | Yes | ||||
| 37 | 116A | Yes | Yes | Yes | Yes | ||||
| 38 | TR4232 | Yes | Yes | Yes | No | ||||
| 39 | z3951 | Yes | Yes | Yes | Yes | ||||
| 42 | z5469 | Yes | Yes | Yes | Yes | ||||
| 43 | z5340 | Yes | Yes | Yes | Yes | ||||
| 31 | 194A | Yes | Yes | Yes | Yes | ||||
| 8 | TR4254 | No | No | Yes | No | ||||
| 9 | z8343 | Yes | No | Yes | No | ||||
| 10 | z5021 | Yes | No | Yes | Yes | ||||
| 17 | z7285 | Yes | No | Yes | No | ||||
| 40 | PB12311 | Yes | No | Yes | Yes | ||||
| 14 | PB30818 | No | NA | No | NA | ||||
| 1 | PB000933 | Yes | NA | Yes | NA | ||||
| 2 | 426A | Yes | NA | Yes | NA | ||||
| 4 | z6425 | Yes | NA | No | NA | ||||
| 7 | 193A | Yes | NA | Yes | NA | ||||
| 11 | z7889 | Yes | NA | Yes | NA | ||||
| 13 | TR4313 | Yes | NA | Yes | NA | ||||
| 19 | T1482TA | Yes | NA | Yes | NA | ||||
| 21 | TR4250 | Yes | NA | Yes | NA | ||||
| 27 | 62A | Yes | NA | Yes | NA | ||||
| 35 | TR4311 | Yes | NA | Yes | NA | ||||
| 41 | 226A | Yes | NA | Yes | NA | ||||
| 44 | T1473WK | Yes | NA | Yes | NA | ||||
Publisher’s Note: MDPI stays neutral with regard to jurisdictional claims in published maps and institutional affiliations. |
© 2021 by the authors. Licensee MDPI, Basel, Switzerland. This article is an open access article distributed under the terms and conditions of the Creative Commons Attribution (CC BY) license (http://creativecommons.org/licenses/by/4.0/).
Share and Cite
Oon, M.L.; Lim, J.Q.; Lee, B.; Leong, S.M.; Soon, G.S.-T.; Wong, Z.W.; Lim, E.H.; Li, Z.; Yeoh, A.E.J.; Chen, S.; et al. T-Cell Lymphoma Clonality by Copy Number Variation Analysis of T-Cell Receptor Genes. Cancers 2021, 13, 340. https://doi.org/10.3390/cancers13020340
Oon ML, Lim JQ, Lee B, Leong SM, Soon GS-T, Wong ZW, Lim EH, Li Z, Yeoh AEJ, Chen S, et al. T-Cell Lymphoma Clonality by Copy Number Variation Analysis of T-Cell Receptor Genes. Cancers. 2021; 13(2):340. https://doi.org/10.3390/cancers13020340
Chicago/Turabian StyleOon, Ming Liang, Jing Quan Lim, Bernett Lee, Sai Mun Leong, Gwyneth Shook-Ting Soon, Zi Wei Wong, Evelyn Huizi Lim, Zhenhua Li, Allen Eng Juh Yeoh, Shangying Chen, and et al. 2021. "T-Cell Lymphoma Clonality by Copy Number Variation Analysis of T-Cell Receptor Genes" Cancers 13, no. 2: 340. https://doi.org/10.3390/cancers13020340
APA StyleOon, M. L., Lim, J. Q., Lee, B., Leong, S. M., Soon, G. S.-T., Wong, Z. W., Lim, E. H., Li, Z., Yeoh, A. E. J., Chen, S., Ban, K. H. K., Chung, T.-H., Tan, S.-Y., Chuang, S.-S., Kato, S., Nakamura, S., Takahashi, E., Ho, Y.-H., Khoury, J. D., ... Ng, S.-B. (2021). T-Cell Lymphoma Clonality by Copy Number Variation Analysis of T-Cell Receptor Genes. Cancers, 13(2), 340. https://doi.org/10.3390/cancers13020340