Next Article in Journal
Recent Advances in the Management of Patients with Non-Muscle-Invasive Bladder Cancer Using a Multidisciplinary Approach: Practical Recommendations from the Spanish Oncology Genitourinary (SOGUG) Working Group
Next Article in Special Issue
Targeting the Redox Balance Pathway Using Ascorbic Acid in sdhb Zebrafish Mutant Larvae
Previous Article in Journal
Fibroblasts Influence Metastatic Melanoma Cell Sensitivity to Combined BRAF and MEK Inhibition
Previous Article in Special Issue
Characteristics of a Novel ATP2B3 K416_F418delinsN Mutation in a Classical Aldosterone-Producing Adenoma
 
 
cancers-logo
Article Menu

Article Menu

Article

Analysis of Telomere Maintenance Related Genes Reveals NOP10 as a New Metastatic-Risk Marker in Pheochromocytoma/Paraganglioma

by
María Monteagudo
1,2,†,
Paula Martínez
3,†,
Luis J. Leandro-García
1,
Ángel M. Martínez-Montes
1,
Bruna Calsina
1,
Marta Pulgarín-Alfaro
1,
Alberto Díaz-Talavera
1,4,
Sara Mellid
1,
Rocío Letón
1,
Eduardo Gil
1,
Manuel Pérez-Martínez
5,
Diego Megías
5,
Raúl Torres-Ruiz
6,
Sandra Rodriguez-Perales
6,
Patricia González
7,
Eduardo Caleiras
7,
Scherezade Jiménez-Villa
8,
Giovanna Roncador
8,
Cristina Álvarez-Escolá
9,
Rita M. Regojo
10,
María Calatayud
11,
Sonsoles Guadalix
11,
Maria Currás-Freixes
12,
Elena Rapizzi
13,
Letizia Canu
13,
Svenja Nölting
14,
Hanna Remde
15,
Martin Fassnacht
15,16,
Nicole Bechmann
17,18,
Graeme Eisenhofer
17,18,
Massimo Mannelli
13,
Felix Beuschlein
14,19,
Marcus Quinkler
20,
Cristina Rodríguez-Antona
1,4,
Alberto Cascón
1,4,
María A. Blasco
3,
Cristina Montero-Conde
1,4 and
Mercedes Robledo
1,4,*
add Show full author list remove Hide full author list
1
Hereditary Endocrine Cancer Group, Human Cancer Genetics Program, Spanish National Cancer Research Centre (CNIO), 28029 Madrid, Spain
2
PhD Program in Neuroscience, Autonoma de Madrid University, 28029 Madrid, Spain
3
Telomeres and telomerase Group, Molecular Oncology Program, Spanish National Cancer Research Centre (CNIO), 28029 Madrid, Spain
4
Centro de Investigación Biomédica en Red de Enfermedades Raras (CIBERER), 28029 Madrid, Spain
5
Confocal Microscopy Core Unit, Biotechnology Program, Spanish National Cancer Research Centre (CNIO), 28029 Madrid, Spain
6
Molecular Citogenetic, Unit Human Cancer Genetics Program, Spanish National Cancer Research Centre (CNIO), 28029 Madrid, Spain
7
Histopathology Core Unit, Biotechnology Program, Spanish National Cancer Research Centre (CNIO), 28029 Madrid, Spain
8
Monoclonal Antibodies Core Unit, Biotechnology Program, Spanish National Cancer Research Centre (CNIO), 28029 Madrid, Spain
9
Department of Endocrinology, La Paz University Hospital, 28046 Madrid, Spain
10
Department of Pathology La Paz University Hospital, 28046 Madrid, Spain
11
Department of Endocrinology, 12 de Octubre University Hospital, 28041 Madrid, Spain
12
Department of Endocrinology, Clínica Universidad de Navarra, 28027 Madrid, Spain
13
Department of Experimental and Clinical Medicine, University of Florence, 50121 Florence, Italy
14
Medizinische Klinik und Poliklinik IV, Klinikum der Universität München, 80336 Munich, Germany
15
Department of Internal Medicine I, Division of Endocrinology and Diabetes, University Hospital Würzburg, University of Würzburg, 97070 Würzburg, Germany
16
Comprehensive Cancer Center, Mainfranken University of Würzburg, 97070 Würzburg, Germany
17
Institute of Clinical Chemistry and Laboratory Medicine, University Hospital Carl Gustav Carus, Technische Universität Dresden, 01069 Dresden, Germany
18
Department of Medicine III, University Hospital Carl Gustav Carus, Technische Universität Dresden, 01069 Dresden, Germany
19
Klinik für Endokrinologie Diabetologie und Klinische Ernährung, Universitätsspital Zürich, 8091 Zürich, Switzerland
20
Endocrinology in Charlottenburg Stuttgarter Platz 1, 10627 Berlin, Germany
*
Author to whom correspondence should be addressed.
These authors contributed equally to this work.
Cancers 2021, 13(19), 4758; https://doi.org/10.3390/cancers13194758
Submission received: 26 August 2021 / Revised: 17 September 2021 / Accepted: 19 September 2021 / Published: 23 September 2021

Abstract

:

Simple Summary

Telomere maintenance involving TERT and ATRX genes has been recently described in metastatic pheochromocytoma and paraganglioma, reinforcing the importance of immortalization mechanisms in the progression of these tumors. Thus, the aim of this study was to analyze additional telomere-related genes to uncover potential new markers capable of identifying metastatic-risk patients more accurately. After analyzing 29 telomere-related genes, we were able to validate the predictive value of TERT and ATRX in mPPGL progression. In addition, we were able to identify NOP10 as a novel prognostic risk marker of mPPGLs, which also facilitates telomerase-dependent telomere length maintenance in these tumors. Interestingly, NOP10 overexpression assessment by IHC could be easily included within the current battery of markers for stratifying PPGL patients to fine-tune their clinical diagnoses.

Abstract

One of the main problems we face with PPGL is the lack of molecular markers capable of predicting the development of metastases in patients. Telomere-related genes, such as TERT and ATRX, have been recently described in PPGL, supporting the association between the activation of immortalization mechanisms and disease progression. However, the contribution of other genes involving telomere preservation machinery has not been previously investigated. In this work, we aimed to analyze the prognostic value of a comprehensive set of genes involved in telomere maintenance. For this study, we collected 165 PPGL samples (97 non-metastatic/63 metastatic), genetically characterized, in which the expression of 29 genes of interest was studied by NGS. Three of the 29 genes studied, TERT, ATRX and NOP10, showed differential expression between metastatic and non-metastatic cases, and alterations in these genes were associated with a shorter time to progression, independent of SDHB-status. We studied telomere length by Q-FISH in patient samples and in an in vitro model. NOP10 overexpressing tumors displayed an intermediate-length telomere phenotype without ALT, and in vitro results suggest that NOP10 has a role in telomerase-dependent telomere maintenance. We also propose the implementation of NOP10 IHC to better stratify PPGL patients.

Graphical Abstract

1. Introduction

Pheochromocytomas (PCC) and paragangliomas (PGL), all together called PPGLs, are rare neuroendocrine tumors derived from the adrenal medulla or extra-adrenal paraganglia [1]. PPGLs are known as the most hereditary neoplasms, since at least 40% are caused by germline mutations in one of the 23 genes associated so far with the susceptibility to develop this kind of tumor [2]. In addition, 30–40% of PPGLs are due to somatic mutations in these same genes, other cancer-related genes or chromosomal translocations involving the MAML3 gene [3].
Approximately 15–20% of the patients develop metastatic disease (mPPGL) in the first two-three years after diagnosis [4,5]. In this regard, it is important to note that although synchronous metastases occur in 35–50% of cases, metachronous lesions can be developed during the decade following the initial diagnosis [4]. Prognosis of mPPGL is poor and heterogeneous, showing a 5-year overall survival of 40–77% from diagnosis of the first metastasis [6].
Risk factors associated with metastatic disease in PPGLs are scarce, inaccurate and remain poorly defined, mainly due to the low prevalence of the disease, which makes it difficult to recruit large series of patients to reach robust conclusions. Therefore, the early detection of mPPGLs becomes highly relevant for early detection of metastatic disease for which treatment options and therapies remain limited for these patients beyond surgery [7,8,9,10,11].
Even so, there are some clinical features that provide useful information about the potential for developing metastases, such as transcriptional clusters, tumor size and location or plasma metabolites concentration [3,7,8,9,10,11]. Among molecular metastatic risk markers, it is accepted that SDHB mutations are associated with poor prognosis [12]. Although, it has been suggested that additional factors must be involved in disease progression [13]. Recent studies reported that immortalization mechanisms common in other types of carcinomas, which involve telomere deregulation, also play a role in PPGL progression. In fact, the activation of the telomerase gene, TERT, and ATRX loss of function mutations have been reported to be associated with poor prognosis in PPGL [3,14,15].
Telomeres are DNA regions associated with the shelterin protein complex located at the end of chromosomes. The function of these structures is to protect the DNA termini from degradation and from being recognized as DNA double-strand breaks (DSB), to prevent end-to-end interchromosomal fusions [16,17,18,19,20]. Telomeric regions shorten with each cell division [21,22], due to the “end replication” problem and other processes, such as DNA processing and oxidative damage [16,17]. When they reach a critical short length, cells become senescent/quiescent, affecting the generative capacity of tissues [23]. Telomere shortening can be compensated through the de novo addition of telomeric repeats by telomerase, a reverse transcriptase composed of a catalytic subunit (TERT) and an RNA component (TERC), used as a template for telomere elongation [24]. TERT is downregulated in the majority of tissues post-natally, with the exception of adult stem cells [25]. Noteworthy, human tumors reach an indefinite proliferative capacity by either upregulating telomerase or activating the alternative lengthening of the telomeres mechanism [15,26,27,28].
The enzyme telomerase (TERT/TERC) is associated with additional factors that are required for telomerase biogenesis, localization and activity in vivo. Among other factors, telomerase forms a complex with the H/ACA-motif RNA-binding proteins, i.e., DKC1, NOP10, GAR1 and NHP2, that are involved in the proper stability, regulation and intracellular trafficking of telomerase and therefore are key for telomerase-dependent telomere lengthening [29,30].
Since telomere regulation is an important event in the metastatic progression of PPGLs, the aim of this study was to analyze other genes directly or indirectly related to telomere maintenance, in order to uncover potential new markers capable of identifying PPGL patients at risk of developing metastatic disease more accurately. For this purpose, we performed an exhaustive analysis of the expression of 29 genes related to telomere maintenance in a series of 165 metastatic and non-metastatic PPGL tumor samples with clinical and genetic information. The 29 telomere-related genes, henceforth called telomerome, are grouped into different categories: telomerase holoenzyme complex, shelterin complex, ALT (alternative lengthening of telomeres) phenotype and genes indirectly related to telomere maintenance. We were able to validate the predictive value of TERT and ATRX for mPPGL. Furthermore, our findings from patient samples showed that NOP10 is a novel prognostic risk marker of developing mPPGLs. On the other hand, in vitro experiments supported a mechanism in which NOP10 overexpression facilitates telomerase-dependent telomere length maintenance in these tumors.

2. Materials and Methods

2.1. PPGL Cohort and Genetic Characterization

The CNIO study cohort included 149 patients: 81 women, 64 men and 4 of unknown gender, with a mean age at diagnosis of 45 years and a mean follow-up time of 6 years. Among patients, 47 were classified as metastatic (from which 54 primary tumors and 9 metastases were available), diagnosed either with synchronous or metachronous metastasis. This series also included 5 patients with tumors classified as clinically aggressive, characterized by detection of capsular, vascular or adipose tissue infiltration in the pathology report, and/or multiple local recurrences, but without confirmed metastases. The 97 remaining tumors corresponded to non-metastatic PPGL patients with a mean follow-up of 7.67 years (2800 days; min: 0-max: 5895). The series included 96 formalin-fixed paraffin embedded tissues (FFPE) and 69 frozen samples. Clinical data are summarized in Table 1.
Germline and somatic mutational status characterization were performed using a customized NGS panel. The targeted gene panel was designed using the AmpliSeq Custom DNA Panel (Illumina, San Diego, CA, USA), and included the main susceptibility PPGL genes (VHL, RET, SDHA, SDHB, SDHC, SDHD, SDHAF2, SDHAF1, MAX, HIF1A (exon 12), HIF2A (exon 12), TMEM127, HRAS, KRAS, NF1, GOT2, FH, MDH2, SLC25A11, DNMT3A (exon 8), DLST (exon 14), MERTK (exon 17), IDH1, IDH2, CSDE1, EGLN1, EGLN2, BRAF (exon 15), MET (exons 1421), FGFR1 (exons 12 and 14), KIF1B, CDKN1B, MEN1, PTEN, H3F3a) and ATRX. The panel was used according to the manufacturer’s instructions, starting with 200ng of DNA. Interpretation of variants was performed following the recommendations of the NGS in PPGL Study Group and the American College of Medical Genetics and Genomics-Association for Molecular Pathology (ACMG-AMP) [31,32], and mutations detected were confirmed by Sanger sequencing (Figure 1).
Written informed consent for the use of specimens and clinical data were obtained from all patients, according to the institutional ethics committee guidelines. All subjects gave their informed consent for inclusion before they participated in the study. The study was conducted in accordance with the Declaration of Helsinki, and the protocol was approved by the following ethics committees: Hospital Universitario 12 de Octubre (15/024), Madrid, Spain; Universität Spital (2017-00771), Zurich, Germany; Klinikum der Universität (379-10), Munich, Germany; University Hospital Würzburg (ENS@T Ethics Committee 88/11), Würzburg, Germany; Azienda Ospedaliera Universitaria Careggi (Prot. N. 2011/0020149) Florence, Italy; Berlin Chamber of Physicians (Eth-S-R/14), Berlin, Germany.

2.2. Tumor DNA Extraction

Total DNA was isolated from FFPE samples using the Maxwell® RSC DNA Formalin-fixed paraffin embedded Kit (Promega, Madison, WI, USA) and a Maxwell® RSC Instrument (Promega). DNA from frozen tissue was extracted with DNeasy® Blood and Tissue Kit (Qiagen, Hilden, Germany), following the manufacturer’s protocols. In FFPE, at least 2 cores were obtained from selected tumor areas. DNA was quantified using QuantiFluor® ONE dsDNA System kit (Promega) or Quant-iTTM PicoGreenTM dsDNA protocol (Invitrogen, Carlsbad, CA, USA).

2.3. Tumor RNA Extraction and Quality Test

Three or four 5 μm sections, or at least 2 cores from tumor enriched areas, were used for total RNA extraction from FFPE specimens using Maxwell® RSC RNA FFPE Kit (Promega). Frozen sample RNA extraction was performed using TRIzolTM reagent (Invitrogen) following manufacturers’ protocol. After extraction, RNA was quantified by Nanodrop (NanoDrop™, Waltham, MA, USA). RNA integrity was assessed using Agilent Bioanalyzer 2100 (Agilent Technologies, Santa Clara, CA, USA) and the percentage of RNA fragments over 200 nt (DV200) was determined. RNA input was adjusted to DV200 values according to the following criteria: DV200 > 70%, 200 ng; DV200 = 50–70%, 400 ng; DV200 = 30–50%, 600 ng, and poor integrity RNAs (DV200 < 30%) were discarded. High quality commercial RNA from human placenta tissue and RNAs from human cancer cell lines were included in all runs as inter-assay controls. Three frozen/FFPE pairs of tumors, for which both types of preservation were available, were included to evaluate technique reliability for samples with different RNA integrity.

2.4. TREx RNA Sequencing

A customized TruSeq Targeted RNA expression (TREx) panel (Illumina, San Diego, CA, USA), capable of analyzing paraffin-embedded and frozen tissues, was designed to assess telomere-related gene expressions. A total of 29 telomere maintenance genes were included in the assay, belonging directly and indirectly to telomere maintenance pathways: telomerase complex (TERT, TERC, DKC1, GAR1, NOP10, NHP2); shelterin–telosome protein complex (POT1, TERF1, TERF2, TERF2IP, TINF2, TPP1); histone binding and alternative telomere lengthening mechanism (ATRX, DAXX, TNKS); non-canonical telomere maintenance (ACD, FBXO4, GPX2, MCRS1, MKRN1, NAT10, NFX1, RLIM, SMG5, SMG6, SOX7, TEP1, WRAP53, YLPM1).
Sequencing runs of 150bp single-end reads were successfully performed in an Illumina MiSeq system. The output data were mapped to the reference genome version GRCh37, adapted for the TREx custom panel, using TopHat [33] included in the Nextpresso suite [34]. Random down-sampling of each sample was performed to obtain a final number of ≈170,000 mapped reads. Samples with less than 170,000 aligned reads were discarded due to low read depth (<700 reads/amplicon). A total of 165 samples (96 FFPE and 69 frozen) passed this cut-off and were used for the analysis: 143 samples had >1000 reads/amplicon, 23 samples had between 1000–750 reads/amplicon and 4 were excluded with <750 reads/amplicon. New mapping process and different quality steps were performed with the down-sampled FASTQ files. Briefly, to decrease the bias effect between FFPE and frozen samples, we used limma package [35], which allowed obtaining unbiased log2CPMs (counts per million) for all the selected samples.
TERT expression was detected using 3 specific probes, and only samples with at least 3 raw counts in each one of the probes and average raw counts ≥ 4 were considered as positive for expression, in order to minimize false positive identification due to TERT low-expressor condition.

2.5. ATRX Mutations

Mutations in ATRX were detected by the customized NGS panel in a set of 120 tumors. Exome data were available for 45 additional PPGLs (unpublished data). WES (whole exome sequencing) was performed using two different Illumina sequencing platforms, HiSeq and NovaSeq, generating 100bp paired-end reads. RubioSeq suite was used for the exome analysis [36], and data were processed and aligned to the human reference genome GRCh37 using Burrows–Wheeler Aligner (BWA). Germline and somatic variants were detected with Haplotype Caller [37] and MuTect [38] (Table S1).

2.6. Identification of TERT PROMOTER Mutations (TPMs)

Mutations causing altered TERT expression were studied using NGS, following the 16S Metagenomic Sequencing Library Preparation (Illumina, San Diego, CA, USA) protocol. To identify TPMs (chr5:1,295,228 C > T and chr5: 1,295,250 C > T), amplicons of 151bp were amplified from 50 ng of tumor DNA (primer sequences provided in Table S2). Amplicon PCR was performed using Multiplex QIAGEN 2X Master Mix following manufacturer’s instructions. Index PCR was later executed with the EasyTaq DNA polymerase (TransGen Biotech, Beijing, China) using synthetic indices from the Nextera XT Index Kit (Illumina, San Diego, CA, USA). Both PCR products were purified using AMPure XP beads (Beckman Coulter, Pasadena, IN, USA) and quantified by PicoGreen (Thermo Fisher Scientific, Waltham, MA, USA). Amplicon concentration was normalized and pooled up to 96 samples for a single run.
Libraries were sequenced according to manufacturer’s instructions in a MiSeq sequencer (Illumina). The sequencing module used was the “PCR Amplicon” protocol with a paired-end design with 150 base pairs reads. Illumina software was used to perform the variant calling, and Illumina VariantStudio software (Illumina) was used to obtain the sequencing results. TERT promoter mutations detected by NGS were confirmed by PCR and Sanger sequencing (primers are provided in Table S2).

2.7. Analysis of TERT Promoter Methylation Levels

To analyze THOR (TERT hypermethylated oncological region) methylation levels, bisulfite-modified DNA was used to amplify four THOR sections: A1, A2, A3 and A4, as described in Lee et al., 2019. Within the fourth THOR amplicon is located the UTSS region (upstream of the transcription start site), which contains a subset of five CpG sites (CpG 1295586, 1295590, 1295593, 1295605 & 1295618) whose average methylation level accurately correlates with the average methylation level of the whole THOR.
An amount of 100 ng of tumor DNA was bisulfite-modified using the EZ-96 DNA MethylationTM Kit (ZYMO RESEARCH, Irvine, CA, USA) research for the analysis of promoter hypermethylation. Bisulfite-modified DNA results in the conversion of unmethylated cytosine to uracil, which will be copied as thymine upon PCR, thus distinguishing methylated (thymine) from unmethylated (cytosine) DNA bases. Preparation and sequencing of the four THOR PCR amplicons were performed following the protocol “16S Metagenomic Sequencing Library Preparation” for the Illumina MiSeq platform with a paired-end design of 150 base pairs reads. Primers were chosen according to Lee et al., 2019 (Table S2).
Paired-end FASTQ files of each sample were generated. Only forward reads were used in the analysis. Trimming was performed with cut-adapt software to eliminate the sequences corresponding to the Illumina adapters incorporated during the sequencing process. The first step was to generate a reference genome adapted to bisulfite modification from the human genome assembly hg19. Reads were aligned to this modified reference genome using BS-Seeker2 software (2), taking into account changes introduced by bisulfite modification and favoring correct alignment. Secondly, we obtained the coverage at the positions of interest (UTSS region) using bam-readcount software (https://github.com/genome/bam-readcount, accessed on 16 January 2019). Finally, we calculated for each CpG site of interest the percentage of methylation observed as a function of the number of reads showing “C” or “T” at that position. Only samples with a mean UTSS-region value ≥ 16.1% were considered as hypermethylated, as previously established by Lee et al., 2019.

2.8. TERT Copy Number Alterations (CNAs)

TERT CNAs analysis was performed in those samples from which WES data were available (unpublished data). Anaconda pipeline was used to detect somatic copy number alterations [39]. CNA profiles at gene level were identified using GISTIC 2.tool [40]. Data from frozen and FFPE samples were analyzed separately to minimize the preservation type bias in the analysis. Thresholds for gain detection were set to 4 and 8 for frozen and FFPE samples, respectively.

2.9. Telomerome Significant Genes and Metastasis Prediction Risk Model

To determine tumors with altered expression of telomere maintenance genes, we estimated the interquartile range (IQR) of the expression values of the non-metastatic samples with long follow-up (≥8 years) from diagnosis (n = 45). We considered de-regulated gene expression tumors those with values below or above the threshold set using lower/upper whiskers (Q1 − (1.5 × IQR) or Q3 + (1.5 × IQR), respectively) of the gene expression dispersion. Candidate genes were chosen according to Fisher exact test after Bonferroni correction. Expression outlier data of candidate genes were transformed into dichotomous variables. For this analysis, tumors with clinically aggressive phenotype (n = 5) and non-metastatic samples with <8 years or unknown follow-up (n = 52) were excluded, leaving a total of 108 samples (63 metastatic and 45 non-metastatic).
A logistic regression analysis to assess the odds of metastatic risk was executed including as variables SDHB, TERT/ATRX, NOP10 and FBXO4. Selection of the best gene classifier was evaluated using a stepwise conditional logistic regression model. Non-metastatic patients with unknown follow-up, and those with clinically aggressive tumors, were excluded from the analysis.
The classification power of telomerome genes selected in the previous step was evaluated by computing receiver operating characteristic (ROC) curves and area under the curve analysis (AUC). A total number of 45 non-metastatic (≥8 years of follow-up) and 54 primary-metastatic samples were included. This analysis was applied considering 3 scenarios: 1) tumors with any event in TERT (expression outliers, TPMs, promoter hypermethylation or gains in 5p region) and/or ATRX (expression outliers and loss of function mutations), 2) tumors with only outlier expression of NOP10 but excluding events in TERT and ATRX, and 3) considering any event in any of the 3 aforementioned telomerome genes. Data were analyzed using IBM-SPSS Version 19 (Armonk, NY, USA) and GraphPad Prism Version 5 (San Diego, CA, USA).

2.10. Time to Progression and Validated Telomerome Genes

Time to progression was evaluated using the Kaplan–Meier analysis for the whole series with follow-up data, testing differences using the log-rank test (IBM-SPSS Version 19) Metastasis (n = 9), clinically aggressive (n = 5) and non-metastatic cases with unknown follow-up (n = 6) were excluded from the analysis. TERT+ATRX (considering TERT expression outliers, TPMs, TERT promoter hypermethylation, gains and ATRX down expression outliers and loss of function mutations) and TERT+ATRX+NOP10 (considering NOP10 overexpression outliers) were studied for association with time to progression. The latter was defined as the number of days between surgery of the primary PPGL and the appearance of the first confirmed metastasis. The inclusion criteria were the presence of either synchronous or metachronous metastases (those that appeared before and after one year since surgery of the primary tumor, respectively) or at least 2 years’ follow-up in the case of non-metastatic patients. Patients with non-metastatic tumors were censored at the date of last follow-up available.

2.11. Telomere Length Q-FISH, High-Throughput Quantification

Telomere length was studied by Q-FISH in selected representative FFPE samples. Hematoxylin and eosin-stained tumor sections were evaluated by a pathologist in order to select the areas of interest. Samples with a high tumor content were cut into complete sections (4 µm), and for those samples with a low tumor content, representative cores (1 mm) were selected for study in a tissue micro array (TMA). After deparaffinization and rehydration, tissues were washed in PBS 1X and fixed in 4% formaldehyde for 5 min. After washing, slides were dehydrated in a 70–90%–100% ethanol series (5 min each).
Slides were air dried and 30 µL of the telomere probe mix (10 mM TrisHCl, pH 7.2, 25 mM MgCl2, 9 mM citric acid, 82 mM Na2HPO4, 50% deionized formamide (Sigma-Aldrich, Darmstadt, Germany), 0.25% blocking reagent (Roche, Basel, Switzerland), and 0.5 µg/mL Telomeric PNA probe (Panagene, Daejeon, Korea) was added. Slides were incubated for 3 min at 85 °C and then 2 h at room temperature in a wet chamber in the dark. Slides were washed twice for 15 min each in 10 mM TrisCl (pH 7.2) and 0.1% BSA in 50% formamide and then three times for 5 min each in TBS 0.08% Tween 20. After washing, slides were stained with DAPI (0.2 µg/mL) and dehydrated in a 70–90%–100% ethanol series. Dried samples were finally mounted with VECTASHIELD mounting media (Vector Laboratories, Burlingame, CA, USA).
Telomere length analysis is based on the specific and stable hybridization of the PNA with the telomeric region; the intensity of this PNA is directly related to telomere length allowing the measurement of telomeres at each individual chromosome end. Samples were imaged and quantified by confocal microscopy. For each sample evaluation, five representative areas from each tumor were imaged for an unbiased study of telomere length. Q-FISH images were acquired in a confocal microscope equipped with a 63×/NA 1.4 oil immersion objective and LAS AF v2.6 software (Leica-Microsystems, Wetzlar, Germany), and maximum projection images were created with the LAS AF 2.7.3.9723 software. Telomere signal intensity from Z-stacks was quantified using Definiens Developer Cell software version XD 64 2.5. Telomere length was estimated as the mean telomere intensity value per nucleus.

2.12. Promelocytic Leukaemia (PML) Bodies and Telomere Co-Localization by Immuno-Q-FISH

FFPE tissue samples were fixed in 10% buffered formalin, dehydrated, embedded in paraffin wax and sectioned at 4 μm. Tissue sections were deparaffinized in xylene and re-hydrated through a series of decreasing ethanol concentrations up to water. Immunofluorescence (IF) was performed on deparaffined tissue sections processed with 10 mM sodium citrate (pH 6.5) cooked under pressure for 2 min. Tissue sections were permeabilized with 0.5% Triton in PBS and blocked with 5% BSA in PBS. Samples were incubated overnight at 4 ºC with rabbit polyclonal anti-PML (1:100; Santa Cruz Biotechnology, Santa Cruz, CA, USA, H-238). Q-FISH was performed on IF-stained slides fixed with 4% formaldehyde for 20 min. The DAPI images were used to detect telomeric signals inside each nucleus. Immunofluorescence images were obtained with a TCS-SP8 STED 3X confocal microscope equipped with a 63×/NA 1.4 oil immersion objective, a white light laser and LAS X v3.5 software (Leica-Microsystems). Z-stacks of the samples were acquired and then analyzed with Definiens Developer XD 64 v2.5 software (Definiens Inc., Munich, Bayern, Germany).

2.13. Characterization of NOP10 Expression Mechanisms

The coding regions (exons 1 and 2) of NOP10 gene were analyzed by Sanger sequencing in order to detect activating mutations (primers in Table S2). Additionally, NOP10 promoter region (200 bp upstream of the transcription start site or TSS) was checked for activating mutations using the previously mentioned WES data. Epigenetic mechanisms were also studied, including methylation 450K array data from PPGL TCGA project ([3], https://xenabrowser.net/datapages/, accessed on 19 February 2021) and PPGL CNIO series previously published data [41,42,43,44] as well as miRNA expression data from PPGL TCGA project (https://xenabrowser.net/datapages/, accessed on 19 February 2021) and from the PPGL CNIO series [45].
NOP10 protein expression was assessed by immunohistochemistry (IHC) in metastatic and non-metastatic PPGLs, previously selected according to NOP10 overexpression. Sections of 2 μm thick were prepared from FFPE tissue and were dried in a 60 °C oven overnight. The sections were placed in a BOND-MAX Automated Immunohistochemistry Vision Biosystem (Leica Microsystems GmbH, Wetzlar, Germany) using standard protocol. First, tissues were deparaffinized and pre-treated with the Epitope Retrieval Solution 2 (EDTA-buffer pH8.8) at 98 °C for 20 min. After washing steps, peroxidase blocking was carried out for 10 min using the Bond Polymer Refine Detection Kit DC9800 (Leica Microsystems GmbH). Tissues were again washed and then incubated with the primary antibody anti-NOP10 (rabbit monoclonal antibody (EPR8857) (ab134902, Abcam)) diluted 1:1000 for 30 min. Subsequently, tissues were incubated with polymer for 10 min and developed with DAB-chromogen for 10 min. Human kidney slides were used as positive staining control following manufacturer’s recommendations. Additionally, patients with long-term follow-up (>8 years), TERT over-expressing samples and ATRX down-expressing samples and normal adrenal medulla FFPE slides were included as controls.
Images of whole sections were taken with a slide scanner (AxioScan Z1, Zeiss, Jena, Germany). For analysis, an appropriate script was created using QuPath software (Belfast, UK) [46]. Representative areas from each slide were chosen for quantification program training, creating an appropriate script for NOP10 antibody according to the intensity method: positivity was evaluated in three stages from high to low (3+, 2+, 1+) and negative. After training and script optimization, the quantification step was run, and results were exported as excel files with scoring data for each file.
Staining was classified as: low staining (negative and 1+) and high staining (2+ and 3+). Tumor staining was compared with negative staining from normal adrenal medulla. The percentage of high positivity staining was compared between samples (Neuwman–Keuls multiple comparison test, p-value < 0.05).

2.14. Cell Culture and Generation of TERT and NOP10 Overexpression Models

Human mesenchymal cells [47] were cultured in MesenPRO RS™ (Gibco) medium with L-Glutamin (5%; Gibco) and penicillin/streptomycin (1%; Gibco). Cells were maintained in monolayer in an incubator at 37 °C and 5% CO2. For the experiments performed in vitro, two different plasmids were used:
  • pLV-TERT-IRES-puro: to generate TERT overexpressing cells, lentiviral plasmid pLV-TERT-IRES-hygro was acquired from Addgene repository (Addgene Plasmid #85140 [48]). Selection antibiotic was changed from hygromycin to puromycin.
  • pLV-NOP10-IRES-hygro: NOP10 expression plasmid (NM_018648) was acquired from OriGene (CAT#: RC209038). Using pLV-TERT-IRES-hygro backbone, TERT gene was replaced by NOP10 ORF sequence from the aforementioned plasmid, generating a new pLV-NOP10-IRES-hygro vector.
Lentiviral plasmids were introduced in HEK293T cells (CRL-1573, ATCC) [47] using lipofectamine (Thermo Fisher). After cell culture, supernatant-carrying lentiviral particles were collected and used for mesenchymal cell infection. The infection was performed by using a small volume from the viral supernatant, allowing viral particles to physically contact mesenchymal cells. Once cells were selected with their respective antibiotics (Puromycin 0.35 µg/mL, Gibco; Hygromicin: 20 µg/mL; Invitrogen), overexpression of both TERT and NOP10 was confirmed by RT-PCR. Briefly, each cell line was seeded in 60 mm plates. After expansion (3 × 10⁶ cells), RNA was isolated using TRIzol Reagent® (Ambion-Life Technologies, Waltham, MA, USA) following the manufacturer’s instructions. cDNAs were prepared from 500 ng of RNA using the qScriptTM cDNA Synthesis Kit (Quanta Biosciences, Gaithersburg, MD, USA) and mRNA levels were quantified by real-time PCR using the Universal ProbeLibrary set (Roche), as described by the vendor, on a QuantStudio 6 Flex Real-Time PCR System (Applied Biosystems, Waltham, MA, USA) using TaqMan® Universal PCR Master Mix No AmpErase® UNG (Applied Biosystems). Normalization was carried out with the β-ACTIN housekeeping gene and relative mRNA levels were estimated by the ΔΔCt method [49]. Primers and probes used for RT-PCR shown in Table S2.

2.15. Telomere Length Q-FISH on Cell Spreads

For telomere length analysis, non-confluent hMSC were harvested. Cells were collected by centrifugation and after hypotonic swelling in 0.03 M sodium citrate for 30 min at 37 °C, hMSC were fixed in methanol–acetic acid (3:1). Cell suspension was dropped onto wet microscope slides and dried overnight. After drying, we proceeded to carry out quantitative telomere fluorescence in situ hybridization (Q-FISH), as previously described [50].

3. Results

3.1. Description of the PPGL-Telomerome Series

The series comprises a collection of 165 tumors, representative of the genetic landscape of the different susceptibility genes in PPGLs. After genetic characterization, 38.78% of tumors (64/165) belonged to cluster C1A, 8.48% (14/165) to cluster C1B, 33.93% (56/165) to C2 and 4.84% (8/165) to C3. Among the 63 mPPGLs, 52.38% (33/63) belong to the C1A cluster, associated with a high risk of progression. The other ones belong to clusters C1B (3/63), C2 (12/63) and C3 (5/63). This series also included 23 WT samples (23/165) (Figure 1, Table 1).

3.2. Study of the Telomerome Expression Profile and Outlier Selection

After assessing the telomerome expression data, interquartile range analysis was applied for detecting expression outliers of candidate genes, and the number of outliers was compared between metastatic and long follow-up non-metastatic samples (more than 8 years). A total of 3 out of 29 genes, TERT, NOP10 and FBXO4, showed differences between metastatic and non-metastatic PPGLs by Fisher´s exact test after Bonferroni correction. Although not significant, we added ATRX as a prognostic marker because it had already been associated with mPPGLs [14], selecting a final number of four candidate genes for further analyses (Figure S1).

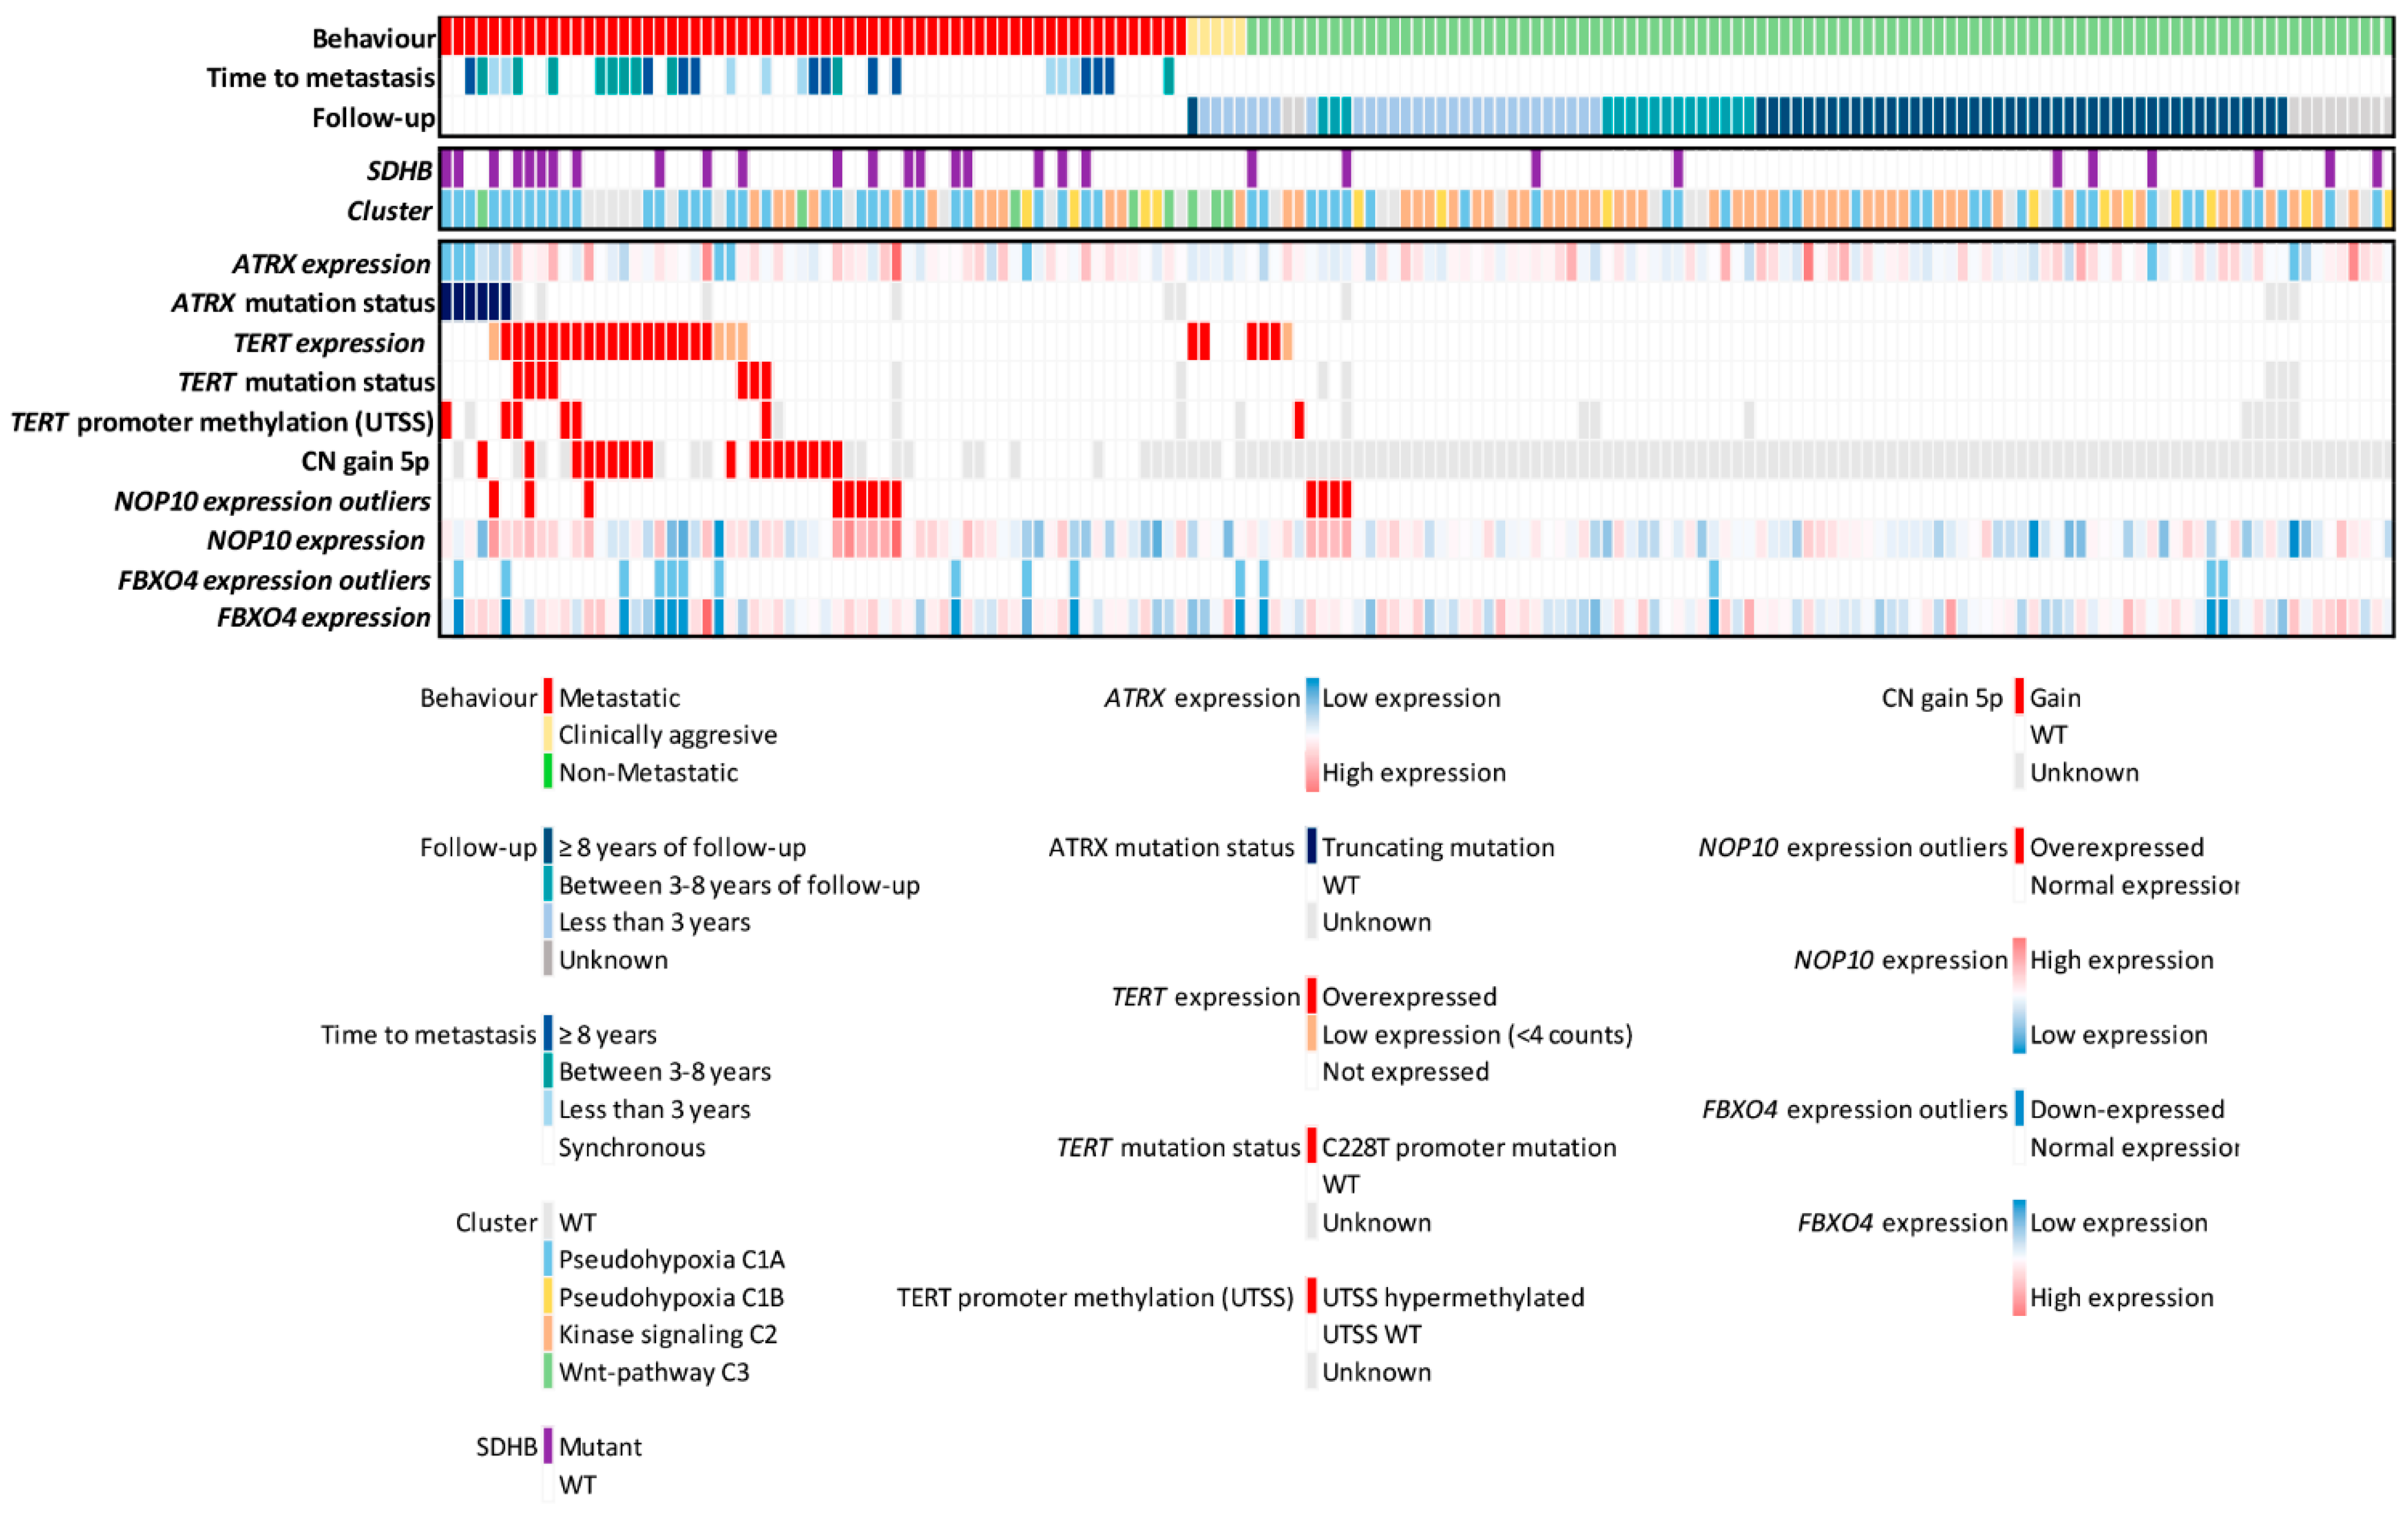
3.3. Mechanisms That Trigger Aberrant Expression of Telomerome Genes in mPPGL

Six tumors carried loss of function mutations in ATRX that correlated with a decreased ATRX expression, three of them being outliers (Table S1). Five of them corresponded to the pseudohypoxia cluster and the remaining one to the Wnt-pathway cluster (Figure 2).
TERT reactivated expression was detected in 23/63 (36.5%) mPPGLs, as well as in two clinically aggressive tumor samples and four non-mPPGLs with short/unknown follow-up (Figure 2). Aberrantly high TERT expression could arise through four major mechanisms: enhancing promoter mutations, promoter hypermethylation in the THOR-UTSS (TERT hypermethylated oncological region untranscribed site), TERT locus amplification and rearrangements involving the super enhancer region located upstream TERT TSS and up to 5.4 Mb [51].
The sequencing of the TERT promoter from 158 PPGLs with available material revealed seven mPPGLs carrying the C228T mutation, from which five showed reactivation of TERT expression. These five mutants with TERT overexpression were also carrying SDHB driver mutations (5/7, 71.4%) (Figure 2).
TERT promoter methylation analysis was performed in 147 tumors with good quality DNA available (Figure S2A). The median hypermethylation value was significantly higher in metastatic samples when compared with non-mPPGLs (mPPGL median 8.34%, SD: 12.7; non-mPPGL median: 3.57%, SD: 3.4; unpaired t-test) (Figure S2B). Seven tumors were considered hypermethylated as they showed median UTSS-THOR methylation value over 16.1%, as previously established [51] (Figure S2A,B). Among them, six were mPPGLs, and the remaining case corresponded to a non-metastatic PPGL without follow-up data. Notably, 6/7 (86%) TERT promoter hypermethylated cases belong to the C1A cluster. Simultaneous events in the TERT promoter (mutation and hypermethylation) were present in one sample (Figure 2).
Among the 44 samples with the copy number data available, we found that gains in the TERT locus (5p15.33) were present in 8 out of 18 TERT expressing samples (40%) and 10/26 non-expressing samples (38%). TERT locus gain overlapped with promoter mutation and/or methylation in 2/18 (11.1%) specimens. Among metastatic samples with TERT locus gains, two of them were SDHB-mutated (2/18, 11.1%), and 5/18 (27.7%) belonged to the C1A cluster. Among the 50 PPGLs showing any type of TERT event, 25 (50%) belonged to the C1A cluster, 1 (0.2%) to cluster C1B, 7 (14%) to C2, 3 (6%) to C3 and 14 (28%) were classified as wild type samples with an unknown driver mutation (Figure 2). Finally, we analyzed the association between events in the TERT locus and its expression. CNAs were the event associated with the highest median TERT expression (Figure S2C).
Regarding NOP10, no pathogenic mutations were found that could explain its upregulation, neither in the exons nor in the studied part of the gene promoter (200 bp upstream the TSS). Furthermore, no significant correlation was found between NOP10 expression and the methylation status of any of the nine CpG sites studied at the gene locus (2 CpG) or promoter region (7 CpG) (up to 230 bp from TSS), according to TCGA and CNIO data sets. Similarly, the expression of miRNAs with conserved binding sites at the NOP10 locus, according to TargetScan tool (http://www.targetscan.org/vert_72/, accessed on 17 February 2021), miRNAs -204, -211, -194, -27, -128 and -135 did not inversely correlate with NOP10 expression. Additionally, no alterations in the number of copies for the NOP10 locus were detected in our sample set. Therefore, none of the canonical mechanisms associated with an altered gene expression underlay the significantly higher NOP10 expression levels found in mPPGLs (Figure 2). Nevertheless, a selection of samples with high NOP10 expression showed a significantly higher NOP10 staining at the nuclear and nucleolar levels by immunohistochemistry (Figure 3A,B). Moreover, NOP10 IHC staining and gene expression were highly correlated (Pearson r = 0.784; p-value: 0.012) (Figure 3C).

3.4. Telomerome Significant Genes Identification and Predictive Value

The risk given by the two candidate genes (NOP10 and FBXO4) was evaluated using a univariate logistic regression model, as well as TERT+ATRX as a single variable (bona fide markers of immortalization) and SDHB as a genetic variable associated with worse prognosis. The univariate regression model revealed that each of them were associated with a higher risk to develop metastatic disease. Finally, a step-wise model selected TERT+ATRX and NOP10 as the best classifier of metastasis (Table S3). FBXO4 and SDHB were excluded from the model, suggesting that they did not confer malignancy by themselves.
We applied the AUC analysis to determine the metastatic risk predictive value of the selected genes. Although events in TERT/ATRX explained a significant number of metastatic cases (AUC = 0.767, 95%CI = 0.678–0.856, p-value = 2.46 × E−6), the TERT/ATRX/NOP10 combination was a better predictor (AUC = 0.798, 95%CI = 0.714–0.882, p-value = 1.35 × E−7), suggesting that NOP10 aberrant expression contributes to the PPGL progression (Figure 4A). In addition, patients carrying alterations in TERT/ATRX/NOP10 showed a significant shorter time to progression than those without events (p-value: 4.73 × E−10, HR: 5.05, 95%CI: 2.76–9.23) (Figure 4B).

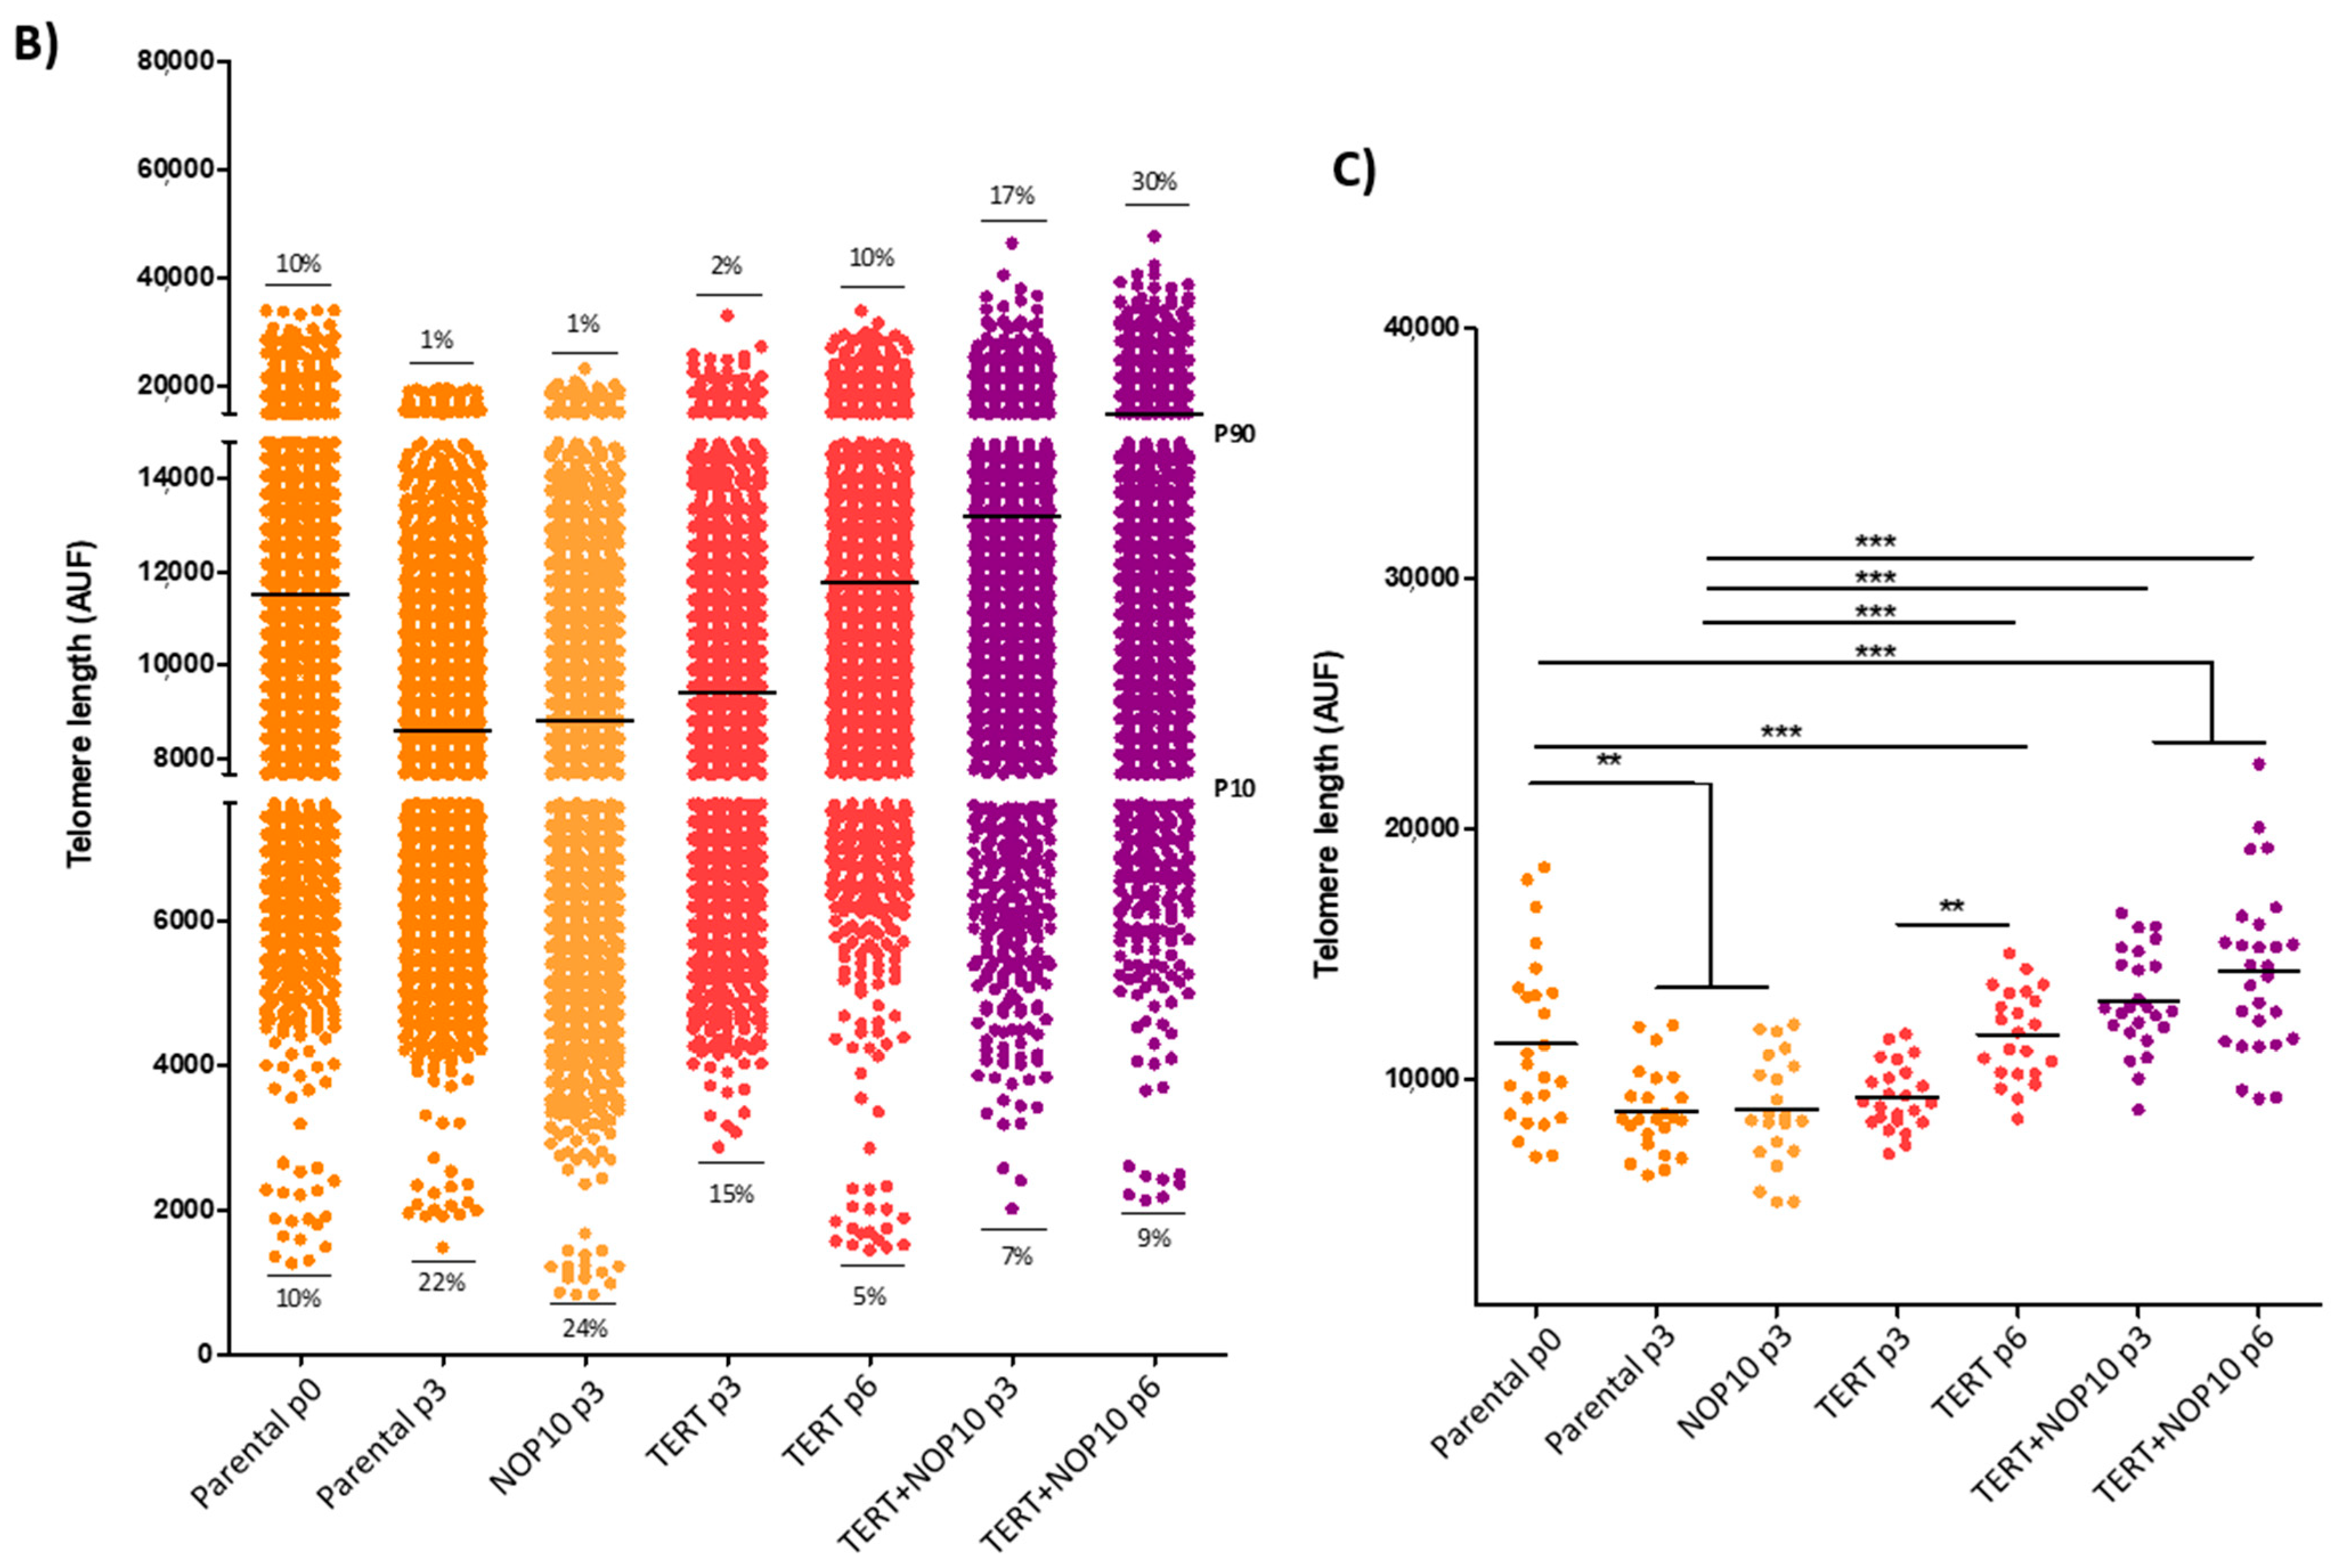
3.5. TERT, ATRX and NOP10 Events Affect Telomere Length

We measured telomere length in samples with TERT, ATRX and NOP10-altered profiles by Q-FISH technique. Additionally, three non-metastatic samples without any alterations in any of these genes and three normal adrenal medullae were included as controls.
Confocal microscopy analysis revealed that tumors harboring TERT alterations had shorter telomeres than the controls. Those with ATRX mutations presented higher heterogeneity in the telomere length, as observed by the wider telomere distribution shown and the high number of extremely long telomeres. Tumors overexpressing NOP10 showed an intermediate phenotype between short and long telomeres (Figure 5A,B). Differences in the distribution of telomere average intensity between groups were statistically significant, showing a higher frequency of long telomeres in ATRX mutants and NOP10-altered samples compared with the normal and non-metastatic ones, and a higher frequency of short telomeres in TERT-altered samples (Figure 5C). Differences in the mean of telomere spot size were also observed, confirming the results obtained with the mean telomere intensity analysis (Figure 5D).
The alternative telomere lengthening (ALT) phenotype is characterized by the high heterogeneity of telomere length and the presence of extremely long telomeres. ALT has unequivocally been associated with ATRX alterations [52,53]. We analyzed the colocalization of PML nuclear bodies with telomeres (ALT-associated PML nuclear bodies or APBs), a phenomenon previously described in ALT-positive cells with increased telomere recombination [54]. Representative samples were selected for APB assays (Figure S3A). The percentage of PML-positive cells was significantly higher in ATRX mutated samples as compared to ATRX WT ones (Figure S3B). In addition, a larger number of APBs was observed in the ATRX mutants (Figure S3C). Samples without ATRX mutations did not show APBs, whereas three out of four ATRX mutant samples presented a high number of APBs and were therefore classified as ALT+. Interestingly, samples with NOP10 alteration presenting intermediate/long telomeres, though showing PML-positive cells (5%) did not present APBs (Figure S3A–C), ruling out ALT mechanism in NOP10 overexpressing samples.

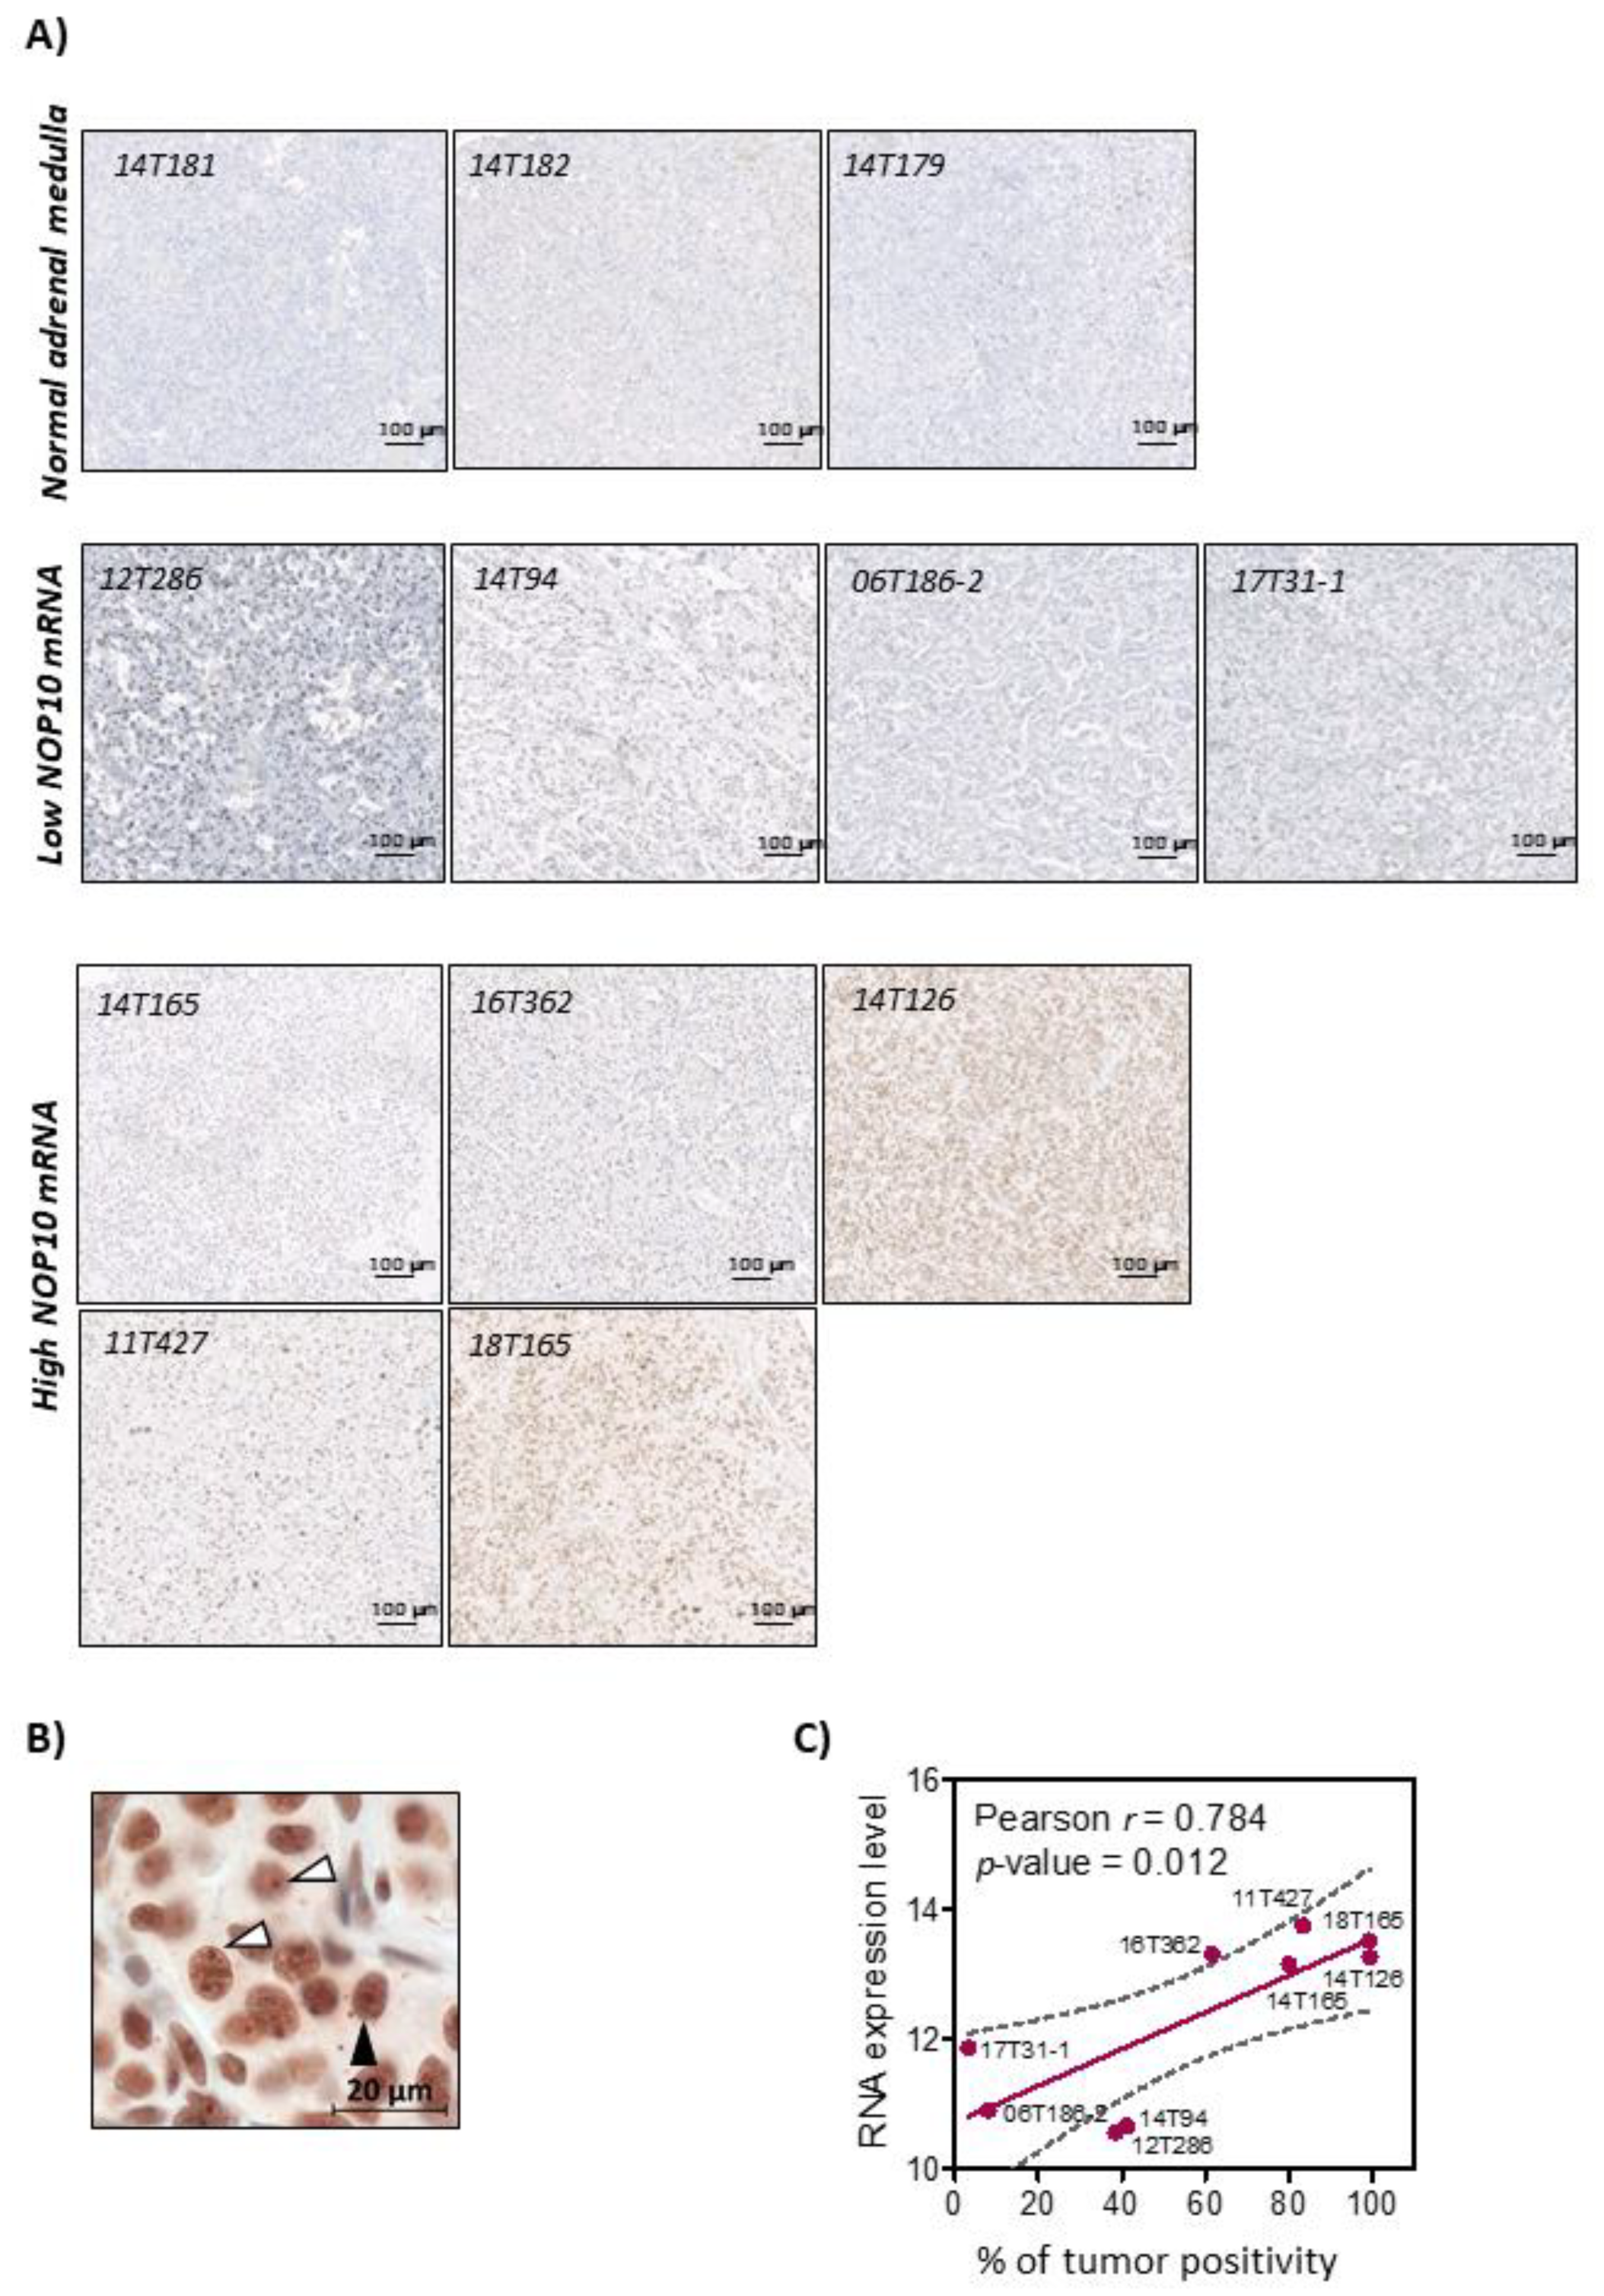
3.6. NOP10 and TERT Expression in Primary Cultures Affect Telomere Length Maintenance

To determine the role of NOP10 overexpression in cell immortalization and telomere lengthening, primary cultures from human umbilical cord mesenchymal stem cells (hUCMSC) were modeled to overexpress either NOP10, TERT or both genes simultaneously (Figure S4A,B). An unmodified primary culture (parental) of hUCMSC was used as the control condition.
Cell growth curve analysis of the isogenic primary cultures showed that both the parental control and NOP10 cells became quiescent/non-replicative after three passages, acquiring an expanded/quiescent morphology. TERT expression alone or in combination with NOP10 delayed the non-replicative status until passage 8 and 10, respectively, in accordance with a higher number of fibroblastic/dividing cell morphology in both conditions (Figure 6A and Figure S4A–C).
Analysis of telomere length by Q-FISH of all isogenic primary cultures at passage three, when parental and NOP10 conditions reached the replicative quiescent state (Figure 6A), showed that both cultures presented equally short telomeres and a similar percentage of critically short telomeric signals (>20% below 10th percentile of parental cells) (Figure 6B, Figure S4A,C). In contrast, TERT overexpressing cells presented a progressive reduction in the percentage of short telomeres and an increase in median telomere length from passage three to passage six (p-value < 0.001), indicating a TERT-dependent telomere lengthening (Figure 6A,B). Notably, TERT+NOP10 overexpressing primary cultures had the longest median telomeric lengths of all the tested conditions (p-values < 0.001), suggesting an enhanced effect of TERT and NOP10 on telomere length maintenance (Figure 6B,C). Indeed, the proportion of long telomeres (>90th percentile) was 3-fold higher in TERT+NOP10 cells as compared to TERT cells at passage six (Figure 6B,C).

4. Discussion

To date, some PPGL-specific markers have been described [8,10,11,12,41,42,43,45]. However, the problem still facing PPGL patients is the lack of molecular markers capable of predicting the development of metastases at an earlier stage. PPGL patients can develop metastases up to 10 years after the diagnosis of the first tumor, and any PPGL should be considered as potentially metastatic, as the most recent WHO classification states [34,55].
Additionally, mechanisms that appear widely de-regulated in cancer, such as cell immortality, have also been described in PPGL [56]. In this regard, there is sufficient evidence to support the association of TERT and ATRX alterations with disease progression [14]. In this work, we aimed to analyze the prognostic value of these and other additional genes involved in this biological process.
Our results are in consonance with previous studies: TERT expression is commonly mediated by genetic and epigenetic mechanisms [3,14,15,57,58] and only detectable in metastatic PPGL but not in non-metastatic cases [59]. In addition, among all the mechanisms associated with TERT expression, we found that copy number gains of TERT locus showed the highest levels of TERT transcriptional activation [14,15,60,61]. Similarly, rearrangements in the TERT promoter have been reported to be associated with high levels of TERT expression [60]. This mechanism could explain the data observed in three TERT-WT samples of our series, which showed equally high levels as samples with TERT locus gains. Additionally, some samples that harbor events involving TERT have not shown significant changes in TERT expression levels. However, the prognostic value of these alterations remains significant, as they are almost exclusive of mPPGLs. We found that mutations in ATRX were also exclusive of mPPGLs and associated with a decreased expression [14,62,63].
We validated the distribution of TERT and ATRX events among PPGL genetic classes [14,64,65,66]. Most of these samples belong to C1A, although they are not exclusive of this cluster nor SDHB-mutant tumors, as previously reported [14,15]. These data reinforce previous evidence of the role of TERT and ATRX as prognostic markers in PPGL [13,67,68,69,70].
Additionally, our study identified NOP10 overexpression as a novel prognostic marker in PPGL. Probably both the size of the series of available metastatic cases, the extensive follow-up time for a considerable number of patients and the comprehensive analysis of genes related to telomere maintenance have allowed the identification of NOP10 as a new risk marker, which until now had gone unnoticed in other previous studies. In this regard, a pan-cancer study based on the systematic analysis of immortalization mechanisms identified the TCGA-PPGL series as a tumor type with limited occurrence of immortalization hallmarks [56]. This is probably due to the reduced number of metastatic cases of this latter series in comparison to ours. Our prognostic model prioritized alterations in telomere maintenance genes (TERT+ATRX+NOP10) over SDHB-mutation status. The SDHB prognostic role has already been questioned when a comprehensive set of clinico-pathological features was considered [13]. Notably, the TERT+ATRX+NOP10 combination identified the group of patients with the shortest time to progression in our series.
NOP10 belongs to the family of H/ACA small nucleolar ribonucleoproteins (snoRNPs), which is also comprised by DKC1, NHP2 and GAR1. These snoRNPs have a constitutive expression at the nuclear and nucleolar level and have two functions: as part of the telomerase complex, they are involved in its stabilization [71,72], and they also participate in rRNA post-transcriptional modifications through pseudourydilation [73,74].
Highly positive NOP10 IHC staining has been already associated with shorter time to progression and aggressiveness in lung and breast cancer [75,76,77,78]. Our IHC results have demonstrated that NOP10 expression outliers have a highly positive staining. The good correlation between expression and IHC supports the implementation of NOP10 immunohistochemistry as an additional prognostic tool. Additionally, NOP10 protein is located both at the nuclear and nucleolar level, suggesting the dual role of NOP10 in our mPGGL.
Regarding the role of NOP10 in telomere maintenance, our in vitro results showed that NOP10 on its own has not had a direct effect on the telomere length. However, when NOP10 overexpression coexists with TERT, telomeres lengthen and cells delay the entrance on a quiescent state. In agreement with this finding, Q-FISH analysis of telomeric lengths on tumors showed that the mPPGL 16T362, with a TERT copy gain and NOP10 overexpression, had a significantly higher median telomeric length as compared to that of mPPGLs bearing only TERT alterations. In addition, NOP10 overexpressing mPPGLs displayed a higher mean telomere length and a lower percentage of short telomeres compared with TERT-only mPPGLs. None of these samples were classified as ALT(+), strongly supporting a NOP10 role in facilitating telomerase-dependent telomere lengthening in these tumors.
Given the fact that NOP10 is involved in the anchorage of the telomerase complex to the Cajal bodies [79,80], we speculate that the overexpression of this protein could help to generate a more durable interaction favoring telomere lengthening. However, based on our NOP10 nucleolar staining, we cannot rule out additional indirect effects in telomere lengthening through RNA stabilization.
One of the limitations of this study, as occurs in many other tumors, is that we cannot rule out that intratumoral heterogeneity is limiting the discriminatory ability of our analysis. Therefore, it is plausible that we are not detecting the immortalization markers reported in this study in some of the PPGLs.

5. Conclusions

In summary, we showed that NOP10 is a novel metastatic risk marker in PPGLs, which in combination with alterations in TERT and ATRX, provided the strongest means of stratification in our series, independently of SDHB-mutation status. In NOP10 overexpressing tumors, we observed an intermediate-length telomere phenotype without ALT, which together with in vitro results, suggest that NOP10 has a role in telomerase-dependent telomere maintenance.
We propose to include NOP10 immunostaining within the current battery of markers for stratifying PPGL patients to fine-tune their prognosis, thereby providing early detection of metastatic disease and ultimately bettering the planning of treatment options.

Supplementary Materials

The following are available online at https://www.mdpi.com/article/10.3390/cancers13194758/s1, Figure S1: Print of telomerome expression outliers, Figure S2: Mechanisms altering TERT expression, Figure S3: APBs detection, Figure S4: Summary of in-vitro experiment. Table S1: Summary of the mutations found in ATRX by NGS (exome sequencing and customized panel). Table S2: Summary of the primers used for NGS in blue, Sanger sequencing in green and RT-PCR in purple, Table S3: Univariate logistic regression analysis and stepwise conditional logistic regression model to assess the odds of metastasis risk.

Author Contributions

Conceptualization, M.R. and C.M.-C.; methodology, M.M. (María Monteagudo), L.J.L.-G., P.M., B.C., M.P.-A., R.L., E.G., A.D.-T. and S.M.; software Á.M.M.-M., M.P.-M. and D.M.; validation, C.M.-C., Á.M.M.-M., L.J.L.-G., B.C., E.C., P.G. and M.M. (María Monteagudo); formal analysis, M.M. (María Monteagudo), L.J.L.-G., P.M. and C.M.-C.; investigation, M.M. (María Monteagudo), L.J.L.-G., P.M., M.P.-A., R.T.-R., S.R.-P., G.R., S.J.-V., B.C., E.C. and M.A.B.; resources, M.R., C.Á.-E., R.M.R., M.C., S.G., M.C.-F., E.R., L.C., S.N., H.R., M.F., N.B., G.E., M.M. (Massimo Mannelli), F.B. and M.Q.; data curation, M.M. (María Monteagudo), P.M., Á.M.M.-M. and C.M.-C.; writing—original draft preparation, M.M. (María Monteagudo); writing—review and editing, M.M., L.J.L.-G., C.M.-C., C.R.-A., A.C., M.R., Á.M.M.-M. and A.D.-T.; visualization, M.M. (María Monteagudo); supervision, L.J.L.-G., C.M.-C. and M.R.; project administration, M.R.; funding acquisition, M.R. All authors have read and agreed to the published version of the manuscript.

Funding

This work was supported by Project PI17/01796 and PI20/01169 to M.R. [Instituto de Salud Carlos III (ISCIII), Acción Estratégica en Salud, cofinanciado a través del Fondo Europeo de Desarrollo Regional (FEDER)], Paradifference Foundation [no grant number applicable to M.R.] and Pheipas Association [no grant number applicable to M.R.]. Research in the M.A.B. lab was funded by the Spanish State Research Agency (AEI), Ministry of Science and Innovation, cofounded by the European Regional Development Fund (ERDF) (SAF2017-82623-R and SAF2015-72455-EXP), the Comunidad de Madrid Project (S2017/BMD-3770), the World Cancer Research (WCR) Project (16-1177), the European Research Council (ERC-AvG Shelterines GA882385) and the Fundación Botín (Spain). International collaborators research has been supported by the Deutsche Forschungsgemeinschaft (DFG) within the CRC/Transregio 205/1 “The Adrenal: Central Relay in Health and Disease” to F.B., S.N., M.F.-C., N.B. and G.E. and by the Immuno-TargET project under the umbrella of the University Medicine Zurich to F.B. and S.N. M.M. was supported by the Spanish Ministry of Science, Innovation and Universities “Formación del Profesorado Universitario—FPU” fellowship with ID number FPU18/00064. L.J.L.-G. was supported both by the Banco Santander Foundation and La Caixa Postdoctoral Junior Leader Fellowship (LCF/BQ/PI20/11760011). C.M.-C. was supported by a grant from the AECC Foundation (AIO15152858 MONT). A.M.M.-M. was supported by CAM (S2017/BMD-3724; TIRONET2-CM). B.C. was supported by the Rafael del Pino Foundation (Becas de Excelencia Rafael del Pino 2017) and currently by the ISCIII project PI17/01796. A.D.-T. is supported by the Centro de Investigacion Biomédica en Red de Enfermedades Raras (CIBERER). We thank the Spanish National Tumor Bank Network (RD09/0076/00047) for the support in obtaining tumor samples and all patients, physicians and tumor biobanks involved in the study.

Institutional Review Board Statement

The study was conducted according to the guidelines of the Declaration of Helsinki and approved by the following ethics committees: Hospital Universitario 12 de Octubre (15/024), Madrid, Spain; Universität Spital (2017-00771) Zurich, Germany; Klinikum der Universität (379-10), Munich, Germany; University Hospital Würzburg (ENS@T Ethics Committee 88/11); Azienda Ospedaliera Universitaria Careggi (Prot. N. 2011/0020149) Florence, Italy; Berlin Chamber of Physicians (Eth-S-R/14) Berlin, Germany.

Informed Consent Statement

Informed consent was obtained from all subjects involved in the study.

Data Availability Statement

Data will be available upon reasonable request.

Conflicts of Interest

The authors declare no conflict of interest. The funders had no role in the design of the study; in the collection, analyses or interpretation of data; in the writing of the manuscript or in the decision to publish the results.

References

  1. Favier, J.; Amar, L.; Gimenez-Roqueplo, A.P. Paraganglioma and phaeochromocytoma: From genetics to personalized medicine. Nat. Rev. Endocrinol. 2015, 11, 101–111. [Google Scholar] [CrossRef]
  2. Cascón, A.; Remacha, L.; Calsina, B.; Robledo, M. Pheochromocytomas and paragangliomas: Bypassing cellular respiration. Cancers 2019, 11, 683. [Google Scholar] [CrossRef] [PubMed] [Green Version]
  3. Fishbein, L.; Leshchiner, I.; Walter, V.; Danilova, L.; Robertson, A.G.; Johnson, A.R.; Lichtenberg, T.M.; Murray, B.A.; Ghayee, H.K.; Else, T.; et al. Comprehensive molecular characterization of pheochromocytoma and paraganglioma. Cancer Cell 2017, 31, 181–193. [Google Scholar] [CrossRef] [Green Version]
  4. Baudin, E.; Habra, M.A.; Deschamps, F.; Cote, G.; Dumont, F.; Cabanillas, M.; Arfi-Roufe, J.; Berdelou, A.; Moon, B.; Ghuzlan, A.A.; et al. Therapy of endocrine disease: Treatment of malignant pheochromocytoma and paraganglioma. Eur. J. Endocrinol. 2014, 171, R111–R122. [Google Scholar] [CrossRef] [PubMed]
  5. Jimenez, C. Treatment for patients with malignant pheochromocytomas and paragangliomas: A perspective from the hallmarks of cancer. Front. Endocrinol. 2018, 9, 277. [Google Scholar] [CrossRef] [PubMed]
  6. De Filpo, G.; Maggi, M.; Mannelli, M.; Canu, L. Management and outcome of metastatic pheochromocytomas/paragangliomas: An overview. J. Endocrinol. Investig. 2021, 44, 15–25. [Google Scholar] [CrossRef]
  7. Jochmanova, I.; Pacak, K. Pheochromocytoma: The first metabolic endocrine cancer. Clin. Cancer Res. 2016, 22, 5001–5011. [Google Scholar] [CrossRef] [PubMed] [Green Version]
  8. Plouin, P.F.; Amar, L.; Dekkers, O.M.; Fassnach, M.; Gimenez-Roqueplo, A.P.; Lenders, J.W.M.; Lussey-Lepoutre, C.; Steichen, O. European society of endocrinology clinical practice guideline for long-term follow-up of patients operated on for a phaeochromocytoma or a paraganglioma. Eur. J. Endocrinol. 2016, 174, G1–G10. [Google Scholar] [CrossRef] [Green Version]
  9. Plouin, P.F.; Fitzgerald, P.; Rich, T.; Ayala-Ramirez, M.; Perrier, N.D.; Baudin, E.; Jimenez, C. Metastatic pheochromocytoma and paraganglioma: Focus on therapeutics. Horm. Metab. Res. 2012, 44, 390–399. [Google Scholar] [CrossRef]
  10. John, H.; Ziegler, W.H.; Hauri, D.; Jaeger, P. Pheochromocytomas: Can malignant potential be predicted? Urology 1999, 53, 679–683. [Google Scholar] [CrossRef]
  11. Eisenhofer, G.; Lenders, J.W.M.; Siegert, G.; Bornstein, S.R.; Friberg, P.; Milosevic, D.; Mannelli, M.; Linehan, W.M.; Adams, K.; Timmers, H.J.; et al. Plasma methoxytyramine: A novel biomarker of metastatic pheochromocytoma and paraganglioma in relation to established risk factors of tumour size, location and SDHB mutation status. Eur. J. Cancer 2012, 48, 1739–1749. [Google Scholar] [CrossRef] [PubMed] [Green Version]
  12. Gimenez-Roqueplo, A.P.; Favier, J.; Rustin, P.; Rieubland, C.; Crespin, M.; Nau, V.; van Kien, P.K.; Corvol, P.; Plouin, P.F.; Jeunemaitre, X. Mutations in the SDHB gene are associated with extra-adrenal and/or malignant phaeochromocytomas. Cancer Res. 2003, 63, 5615–5621. [Google Scholar] [PubMed]
  13. Hescot, S.; Curras-Freixes, M.; Deutschbein, T.; van Berkel, A.; Vezzosi, D.; Amar, L.; de La Fouchardiere, C.; Valdes, N.; Riccardi, F.; Do Cao, C.; et al. Prognosis of malignant pheochromocytoma and paraganglioma (MAPP-PronO Study): A European network for the study of adrenal tumors retrospective study. J. Clin. Endocrinol. Metab. 2019, 104, 2367–2374. [Google Scholar] [CrossRef] [PubMed] [Green Version]
  14. Job, S.; Draskovic, I.; Burnichon, N.; Buffet, A.; Cros, J.; Lepine, C.; Venisse, A.; Robidel, E.; Verkarre, V.; Meatchi, T.; et al. Telomerase Activation and ATRX Mutations Are Independent Risk Factors for Metastatic Pheochromocytoma and Paraganglioma. Clin. Cancer Res. 2019, 25, 760–770. [Google Scholar] [CrossRef] [Green Version]
  15. Dwight, T.; Flynn, A.; Amarasinghe, K.; Benn, D.E.; Lupat, R.; Li, J.; Cameron, D.L.; Hogg, A.; Balachander, S.; Candiloro, I.L.M.; et al. TERT Structural Rearrangements in Metastatic Pheochromocytomas. Endocr. Relat. Cancer 2018, 25, 1–9. [Google Scholar] [CrossRef] [Green Version]
  16. De Lange, T. Shelterin: The protein complex that shapes and safeguards human telomeres. Genes Dev. 2005, 19, 2100–2110. [Google Scholar] [CrossRef] [Green Version]
  17. Chan, S.W.-L.; Blackburn, E.H. New ways not to make ends meet: Telomerase, DNA damage proteins and heterochromatin. Oncogene 2002, 21, 553–563. [Google Scholar] [CrossRef]
  18. Funk, W.D.; Wang, C.K.; Shelton, D.N.; Harley, C.B.; Pagon, G.D.; Hoeffler, W.K. Telomerase expression restores dermal integrity to in vitro-aged fibroblasts in a reconstituted skin model. Exp. Cell Res. 2000, 258, 270–278. [Google Scholar] [CrossRef] [PubMed]
  19. Blasco, M.A.; Funk, W.; Villeponteau, B.; Greider, C.W. Functional characterization and developmental regulation of mouse telomerase RNA. Science 1995, 269, 1267–1270. [Google Scholar] [CrossRef] [Green Version]
  20. Shay, J.W.; Wright, W.E. Role of telomeres and telomerase in cancer. Semin. Cancer Biol. 2011, 21, 349–353. [Google Scholar] [CrossRef] [Green Version]
  21. Maciejowski, J.; de Lange, T. Telomeres in cancer: Tumour suppression and genome instability. Nat. Rev. Mol. Cell Biol. 2017, 18, 175–186. [Google Scholar] [CrossRef] [PubMed] [Green Version]
  22. Wright, W.E.; Piatyszek, M.A.; Rainey, W.E.; Shgy, J.W.; Byrd, W. Telomerase activity in human germline embryonic tissues and cells. Dev. Genet. 1996, 18, 18173–18179. [Google Scholar] [CrossRef]
  23. Martínez, P.; Blasco, M.A. Telomeric and extra-telomeric roles for telomerase and the telomere-binding proteins. Nat. Rev. Cancer 2011, 11, 161–176. [Google Scholar] [CrossRef] [PubMed]
  24. Greider, C.W.; Blackburn, E.H. Identification of a specific telomere terminal transferase activity in tetrahymena extracts. Cell 1985, 43, 405–413. [Google Scholar] [CrossRef]
  25. Ulaner, G.A.; Hu, J.-F.; Vu, T.H.; Giudice, L.C.; Hoffman2, A.R. Telomerase activity in human development is regulated by human telomerase reverse transcriptase (HTERT) transcription and by alternate splicing of HTERT Transcripts1. CANCER Res. 1998, 58, 4168–4172. [Google Scholar] [PubMed]
  26. Dunham, M.A.; Neumann, A.A.; Fasching, C.L.; Reddel, R.R. Telomere maintenance by recombination in human cells. Nat. Genet. 2000, 26, 447–450. [Google Scholar] [CrossRef]
  27. Shay, J.W.; Bacchetti, S. A survey of telomerase activity in human cancer. Eur. J. Cancer Part A 1997, 33, 787–791. [Google Scholar] [CrossRef]
  28. Dilley, R.L.; Greenberg, R.A. Alternative telomere maintenance and cancer. Trends Cancer 2015, 1, 145–156. [Google Scholar] [CrossRef] [Green Version]
  29. Schmidt, J.C.; Cech, T.R. Human telomerase: Biogenesis, trafficking, recruitment, and activation. Genes Dev. 2015, 29, 1095–1105. [Google Scholar] [CrossRef] [Green Version]
  30. Venteicher, A.S.; Abreu, E.B.; Meng, Z.; McCann, K.E.; Terns, R.M.; Veenstra, T.D.; Terns, M.P.; Artandi, S.E. A human telomerase holoenzyme protein required for cajal body localization and telomere synthesis. Science 2009, 323, 644–648. [Google Scholar] [CrossRef] [Green Version]
  31. Nykamp, K.; Anderson, M.; Powers, M.; Garcia, J.; Herrera, B.; Ho, Y.-Y.; Kobayashi, Y.; Patil, N.; Thusberg, J.; Westbrook, M.; et al. Sherloc: A comprehensive refinement of the ACMG–AMP variant classification criteria. Genet. Med. 2017, 19, 1105–1117. [Google Scholar] [CrossRef] [PubMed] [Green Version]
  32. Toledo, R.A.; Burnichon, N.; Cascon, A.; Benn, D.E.; Bayley, J.P.; Welander, J.; Tops, C.M.; Firth, H.; Dwight, T.; Ercolino, T.; et al. Consensus statement on next-generation-sequencing-based diagnostic testing of hereditary phaeochromocytomas and paragangliomas. Nat. Rev. Endocrinol. 2017, 13, 233–247. [Google Scholar] [CrossRef]
  33. Trapnell, C.; Pachter, L.; Salzberg, S.L. TopHat: Discovering splice junctions with RNA-Seq. Bioinformatics 2009, 25, 1105–1111. [Google Scholar] [CrossRef] [PubMed]
  34. Graña, O.; Rubio-Camarillo, M.; Fdez-Riverola, F.; Pisano, D.G.; Glez-Peña, D. Nextpresso: Next generation sequencing expression analysis pipeline. Curr. Bioinform. 2017, 13, 583–591. [Google Scholar] [CrossRef]
  35. Ritchie, M.E.; Phipson, B.; Wu, D.; Hu, Y.; Law, C.W.; Shi, W.; Smyth, G.K. Limma powers differential expression analyses for RNA-sequencing and microarray studies. Nucleic Acids Res. 2015, 43, e47. [Google Scholar] [CrossRef]
  36. Rubio-Camarillo, M.; López, G.G.; Fernández, J.M.; Valencia, A.; Pisano, D. RUbioSeq: A suite of parallelized pipelines to automate exome variation and bisulfite-seq analyses. Bioinformatics 2013, 29, 1687–1689. [Google Scholar] [CrossRef] [Green Version]
  37. Poplin, R.; Ruano-Rubio, V.; DePristo, M.; Fennell, T.; Carneiro, M.; van der Auwera, G.; Kling, D.; Gauthier, L.; Levy-Moonshine, A.; Roazen, D.; et al. Scaling accurate genetic variant discovery to tens of thousands of samples. bioRxiv 2017. [Google Scholar] [CrossRef] [Green Version]
  38. Cibulskis, K.; Lawrence, M.S.; Carter, S.L.; Sivachenko, A.; Jaffe, D.; Sougnez, C.; Gabriel, S.; Meyerson, M.; Lander, E.S.; Getz, G. Sensitive detection of somatic point mutations in impure and heterogeneous cancer samples. Nat. Biotechnol. 2013, 31, 213–219. [Google Scholar] [CrossRef]
  39. Gao, J.; Wan, C.; Zhang, H.; Li, A.; Zang, Q.; Ban, R.; Ali, A.; Yu, Z.; Shi, Q.; Jiang, X.; et al. Anaconda: An automated pipeline for somatic copy number variation detection and annotation from tumor exome sequencing data. BMC Bioinform. 2017, 18, 1–6. [Google Scholar] [CrossRef] [Green Version]
  40. Mermel, C.H.; Schumacher, S.E.; Hill, B.; Meyerson, M.L.; Beroukhim, R.; Getz, G. GISTIC2.0 facilitates sensitive and confident localization of the targets of focal somatic copy-number alteration in human cancers. Genome Biol. 2011, 12, 1–14. [Google Scholar] [CrossRef] [Green Version]
  41. Cascón, A.; Comino-Méndez, I.; Currás-Freixes, M.; de Cubas, A.A.; Contreras, L.; Richter, S.; Peitzsch, M.; Mancikova, V.; Inglada-Pérez, L.; Pérez-Barrios, A.; et al. Whole-exome sequencing identifies MDH2 as a new familial paraganglioma gene. J. Natl. Cancer Inst. 2015. [Google Scholar] [CrossRef] [PubMed] [Green Version]
  42. De Cubas, A.A.; Korpershoek, E.; Inglada-Pérez, L.; Letouzé, E.; Currás-Freixes, M.; Fernández, A.F.; Comino-Méndez, I.; Schiavi, F.; Mancikova, V.; Eisenhofer, G.; et al. DNA methylation profiling in pheochromocytoma and paraganglioma reveals diagnostic and prognostic markers. Clin. Cancer Res. 2015, 21, 3020–3030. [Google Scholar] [CrossRef] [PubMed] [Green Version]
  43. Remacha, L.; Currás-Freixes, M.; Torres-Ruiz, R.; Schiavi, F.; Torres-Pérez, R.; Calsina, B.; Letón, R.; Comino-Méndez, I.; Roldán-Romero, J.M.; Montero-Conde, C.; et al. Gain-of-function mutations in DNMT3A in patients with paraganglioma. Genet. Med. 2018, 20, 1644–1651. [Google Scholar] [CrossRef] [PubMed]
  44. Remacha, L.; Pirman, D.; Mahoney, C.E.; Coloma, J.; Calsina, B.; Currás-Freixes, M.; Letón, R.; Torres-Pérez, R.; Richter, S.; Pita, G.; et al. Recurrent germline DLST mutations in individuals with multiple pheochromocytomas and paragangliomas. Am. J. Hum. Genet. 2019, 104, 651–664. [Google Scholar] [CrossRef] [Green Version]
  45. Calsina, B.; Castro-Vega, L.J.; Torres-Pérez, R.; Inglada-Pérez, L.; Currás-Freixes, M.; Roldán-Romero, J.M.; Mancikova, V.; Letón, R.; Remacha, L.; Santos, M.; et al. Integrative multi-omics analysis identifies a prognostic MiRNA signature and a targetable MiR-21-3p/TSC2/MTOR axis in metastatic pheochromocytoma/paraganglioma. Theranostics 2019, 9, 4946–4958. [Google Scholar] [CrossRef]
  46. Bankhead, P.; Loughrey, M.B.; Fernández, J.A.; Dombrowski, Y.; McArt, D.G.; Dunne, P.D.; McQuaid, S.; Gray, R.T.; Murray, L.J.; Coleman, H.G.; et al. QuPath: Open source software for digital pathology image analysis. Sci. Rep. 2017, 7, 1–7. [Google Scholar] [CrossRef] [Green Version]
  47. Torres-Ruiz, R.; Martinez-Lage, M.; Martin, M.C.; Garcia, A.; Bueno, C.; Castaño, J.; Ramirez, J.C.; Menendez, P.; Cigudosa, J.C.; Rodriguez-Perales, S. Efficient recreation of t(11;22) EWSR1-FLI1+ in human stem cells using CRISPR/Cas9. Stem Cell Rep. 2017, 8, 1408–1420. [Google Scholar] [CrossRef] [Green Version]
  48. Hayer, A.; Shao, L.; Chung, M.; Joubert, L.M.; Yang, H.W.; Tsai, F.C.; Bisaria, A.; Betzig, E.; Meyer, T. Engulfed cadherin fingers are polarized junctional structures between collectively migrating endothelial cells. Nat. Cell Biol. 2016, 18, 1311–1323. [Google Scholar] [CrossRef]
  49. Livak, K.J.; Schmittgen, T.D. Analysis of relative gene expression data using real-time quantitative PCR and the 2-ΔΔCT method. Methods 2001, 25, 402–408. [Google Scholar] [CrossRef]
  50. Samper, E.; Flores, J.M.; Blasco, M.A. Restoration of telomerase activity rescues chromosomal instability and premature aging in Terc−/− mice with short telomeres. EMBO Rep. 2001, 2, 800–807. [Google Scholar] [CrossRef] [Green Version]
  51. Lee, D.D.; Leão, R.; Komosa, M.; Gallo, M.; Zhang, C.H.; Lipman, T.; Remke, M.; Heidari, A.; Nunes, N.M.; Apolónio, J.D.; et al. DNA hypermethylation within TERT promoter upregulates TERT expression in cancer. J. Clin. Investig. 2019, 129, 223–229. [Google Scholar] [CrossRef]
  52. de Nonneville, A.; Reddel, R.R. Alternative lengthening of telomeres is not synonymous with mutations in ATRX/DAXX. Nat. Commun. 2021, 12, 1–4. [Google Scholar] [CrossRef] [PubMed]
  53. Amorim, J.P.; Santos, G.; Vinagre, J.; Soares, P. The role of ATRX in the alternative lengthening of telomeres (ALT) phenotype. Genes 2016, 7, 66. [Google Scholar] [CrossRef] [PubMed]
  54. Cesare, A.J.; Reddel, R.R. Alternative lengthening of telomeres: Models, mechanisms and implications. Nat. Rev. Genet. 2010, 11, 319–330. [Google Scholar] [CrossRef]
  55. Klöppel, G.; Couvelard, A.; Hruban, R.H.; Klimstra, D.S.; Komminoth, P.; Osamura, R.Y.; Perren, A.; Rindi, G. Neoplasms of the neuroendocrine pancreas. In WHO Classification of Tumours of the Endocrine Organs; WHO/IARC Classification of Tumours; Lioyd, R.V., Osamura, R.Y., Kloppel, G., Eds.; IARC Press: Lyon, France, 2017; Volume 10, pp. 210–239. ISBN 978-92-832-4493-6. [Google Scholar]
  56. Barthel, F.P.; Wei, W.; Tang, M.; Martinez-Ledesma, E.; Hu, X.; Amin, S.B.; Akdemir, K.C.; Seth, S.; Song, X.; Wang, Q.; et al. Systematic analysis of telomere length and somatic alterations in 31 cancer types. Nat. Genet. 2017, 49, 349–357. [Google Scholar] [CrossRef] [PubMed]
  57. Stern, J.L.; Theodorescu, D.; Vogelstein, B.; Papadopoulos, N.; Cech, T.R. Mutation of the TERT promoter, switch to active chromatin, and monoallelic TERT expression in multiple cancers. Genes Dev. 2015, 29, 2219. [Google Scholar] [CrossRef] [Green Version]
  58. Bell, R.J.A.; Rube, H.T.; Xavier-Magalhães, A.; Costa, B.M.; Mancini, A.; Song, J.S.; Costello, J.F. Understanding TERT promoter mutations: A common path to immortality. Mol. Cancer Res. 2016, 14, 315–323. [Google Scholar] [CrossRef] [PubMed] [Green Version]
  59. Liu, T.; Brown, T.C.; Juhlin, C.C.; Andreasson, A.; Wang, N.; Bäckdahl, M.; Healy, J.M.; Prasad, M.L.; Korah, R.; Carling, T.; et al. The activating TERT promoter mutation C228T is recurrent in subsets of adrenal tumors. Endocr. Relat. Cancer 2014, 21, 427–434. [Google Scholar] [CrossRef]
  60. Gupta, S.; Vanderbilt, C.M.; Lin, Y.-T.; Benhamida, J.K.; Jungbluth, A.A.; Rana, S.; Momeni-Boroujeni, A.; Chang, J.C.; Mcfarlane, T.; Salazar, P.; et al. A pan-cancer study of somatic TERT promoter mutations and amplification in 30,773 tumors profiled by clinical genomic sequencing. J. Mol. Diagnostics 2021, 23, 253–263. [Google Scholar] [CrossRef]
  61. Zhang, A.; Zheng, C.; Hou, M.; Lindvall, C.; Wallin, K.-L.; Ångström, T.; Yang, X.; Hellström, A.-C.; Blennow, E.; Björkholm, M.; et al. Amplification of the telomerase reverse transcriptase (HTERT) gene in cervical carcinomas. Genes Chromosom. Cancer 2002, 34, 269–275. [Google Scholar] [CrossRef]
  62. Dagg, R.A.; Pickett, H.A.; Neumann, A.A.; Napier, C.E.; Henson, J.D.; Teber, E.T.; Arthur, J.W.; Reynolds, C.P.; Murray, J.; Haber, M.; et al. Extensive proliferation of human cancer cells with ever-shorter telomeres. Cell Rep. 2017, 19, 2544–2556. [Google Scholar] [CrossRef] [PubMed] [Green Version]
  63. Viceconte, N.; Dheur, M.S.; Majerova, E.; Pierreux, C.E.; Baurain, J.F.; van Baren, N.; Decottignies, A. Highly aggressive metastatic melanoma cells unable to maintain telomere length. Cell Rep. 2017, 19, 2529–2543. [Google Scholar] [CrossRef] [Green Version]
  64. Papathomas, T.G.; Oudijk, L.; Zwarthoff, E.C.; Post, E.; Duijkers, F.A.; van Noesel, M.M.; Hofland, L.J.; Pollard, P.J.; Maher, E.R.; Restuccia, D.F.; et al. Telomerase reverse transcriptase promoter mutations in tumors originating from the adrenal gland and extra-adrenal paraganglia. Endocr. Relat. Cancer 2014, 21, 653–661. [Google Scholar] [CrossRef] [PubMed] [Green Version]
  65. Vinagre, J.; Almeida, A.; Pópulo, H.; Batista, R.; Lyra, J.; Pinto, V.; Coelho, R.; Celestino, R.; Prazeres, H.; Lima, L.; et al. Frequency of TERT promoter mutations in human cancers. Nat. Commun. 2013, 4, 1–6. [Google Scholar] [CrossRef] [PubMed] [Green Version]
  66. Letouzé, E.; Martinelli, C.; Loriot, C.; Burnichon, N.; Abermil, N.; Ottolenghi, C.; Janin, M.; Menara, M.; Nguyen, A.T.; Benit, P.; et al. SDH mutations establish a hypermethylator phenotype in paraganglioma. Cancer Cell 2013, 23, 739–752. [Google Scholar] [CrossRef] [Green Version]
  67. Xu, Y.; Goldkorn, A. Telomere and telomerase therapeutics in cancer. Genes 2016, 7, 22. [Google Scholar] [CrossRef] [PubMed] [Green Version]
  68. Reddel, R. Telomere maintenance mechanisms in cancer: Clinical implications. Curr. Pharm. Des. 2014, 20, 6361–6374. [Google Scholar] [CrossRef] [Green Version]
  69. Benn, D.E.; Robinson, B.G.; Clifton-Bligh, R.J. 15 years of paraganglioma: Clinical manifestations of paraganglioma syndromes types 1–5. Endocr. Relat. Cancer 2015, 22, T91–T103. [Google Scholar] [CrossRef] [Green Version]
  70. Heaphy, C.M.; Subhawong, A.P.; Hong, S.M.; Goggins, M.G.; Montgomery, E.A.; Gabrielson, E.; Netto, G.J.; Epstein, J.I.; Lotan, T.L.; Westra, W.H.; et al. Prevalence of the alternative lengthening of telomeres telomere maintenance mechanism in human cancer subtypes. Am. J. Pathol. 2011, 179, 1608–1615. [Google Scholar] [CrossRef]
  71. Qin, J.; Autexier, C. Regulation of human telomerase RNA biogenesis and localization. RNA Biol. 2021, 18, 305–315. [Google Scholar] [CrossRef]
  72. Grozdanov, P.N.; Roy, S.; Kittur, N.; Meier, U.T. SHQ1 is required prior to NAF1 for assembly of H/ACA small nucleolar and telomerase RNPs. RNA 2009, 15, 1188–1197. [Google Scholar] [CrossRef] [Green Version]
  73. Kiss, T. Small nucleolar RNA-guided post-transcriptional modification of cellular RNAs. EMBO J. 2001, 20, 3617–3622. [Google Scholar] [CrossRef]
  74. Kiss, A.M.; Jády, B.E.; Darzacq, X.; Verheggen, C.; Bertrand, E.; Kiss, T. A cajal body-specific pseudouridylation guide RNA is composed of two box H/ACA SnoRNA-like domains. Nucleic Acids Res. 2002, 30, 4643–4649. [Google Scholar] [CrossRef] [Green Version]
  75. Mcmahon, M.; Contreras, A.; Ruggero, D. Small RNAs with big implications: New insights into H/ACA SnoRNA function and their role in human disease. Wiley Interdiscip. Rev. RNA 2015, 6, 173–189. [Google Scholar] [CrossRef] [PubMed] [Green Version]
  76. von Stedingk, K.; Koster, J.; Piqueras, M.; Noguera, R.; Navarro, S.; Påhlman, S.; Versteeg, R.; Øra, I.; Gisselsson, D.; Lindgren, D.; et al. SnoRNPs regulate telomerase activity in neuroblastoma and are associated with poor prognosis. Transl. Oncol. 2013, 6, 447-IN6. [Google Scholar] [CrossRef] [Green Version]
  77. Elsharawy, K.A.; Althobiti, M.; Mohammed, O.J.; Aljohani, A.I.; Toss, M.S.; Green, A.R.; Rakha, E.A. Nucleolar protein 10 (NOP10) predicts poor prognosis in invasive breast cancer. Breast Cancer Res. Treat. 2021, 185, 615–627. [Google Scholar] [CrossRef]
  78. Cui, C.; Liu, Y.; Gerloff, D.; Rohde, C.; Pauli, C.; Köhn, M.; Misiak, D.; Oellerich, T.; Schwartz, S.; Schmidt, L.H.; et al. NOP10 predicts lung cancer prognosis and its associated small nucleolar RNAs drive proliferation and migration. Oncogene 2020, 40, 909–921. [Google Scholar] [CrossRef]
  79. Cristofari, G.; Adolf, E.; Reichenbach, P.; Sikora, K.; Terns, R.M.; Terns, M.P.; Lingner, J. Human telomerase RNA accumulation in cajal bodies facilitates telomerase recruitment to telomeres and telomere elongation. Mol. Cell 2007, 27, 882–889. [Google Scholar] [CrossRef]
  80. Ghanim, G.E.; Fountain, A.J.; van Roon, A.-M.M.; Rangan, R.; Das, R.; Collins, K.; Nguyen, T.H.D. Structure of human telomerase holoenzyme with bound telomeric DNA. Nature 2021, 593, 449–453. [Google Scholar] [CrossRef]
Figure 1. CNIO discovery series: genetic characterization of PPGL series: tumor driver gene and cluster classification. The frequency of each driver gene (percentage) per group, material for each sample and tumor tissue type (primary/metastasis) are shown in the figure. The colored dots represent tumors from the same patient; each color corresponds to a different patient.
Cancers 13 04758 g001
Figure 2. Summary of genomic alterations in PPGL series linked to telomerome events. Tumor behavior and patient follow-up are shown, non-metastatic patients mean follow-up = 7.67 years (min: 9 days, max: 36 years). Patients classification was made according to driver mutations. Events in ATRX include ATRX low expression and ATRX loss of function mutations. TERT events include: TERT overexpression, TERT promoter mutation, TERT promoter hypermethylation (UTSS median value > 16.1%) and CN gain 5p. NOP10 and FBXO4 expression outliers and continuous expression data are shown.
Cancers 13 04758 g002
Figure 3. NOP10 immunohistochemistry. (A) Representative staining images of normal adrenal medulla (n = 3), tumors with low NOP10 expression (n = 4) and NOP10 overexpressing tumors (n = 5). (B) Magnified image from an NOP10-positive staining (14T126). Black arrow: representative nuclear staining. White arrows: representative nucleolar staining. (C) Linear regression plot of NOP10 RNA expression and percentage of tumor positivity. Pearson correlation r and p-value are shown.
Cancers 13 04758 g003
Figure 4. (A) Receiver operating characteristic curve (ROC) analysis showing the accuracy of telomerome events to distinguish between metastatic and non-metastatic samples. This data corresponds to all metastatic (n = 54) and non-metastatic cases with ≥8 years of follow-up (n = 45). Metastases (n = 9), clinically aggressive samples (n = 5) and non-metastatic cases with <8 years’ follow-up (n = 52) were excluded. Genes were introduced as a dichotomous variable based on outlier expressors. TERT events: overexpression, promoter mutation, promoter hypermethylation or gains; ATRX events: low expression outliers and mutations; NOP10 events: overexpression outliers. Any event in TERT+ATRX: p-value: 2.46 × E−6, AUC: 0.767; 95%CI: 0.678–0.856; any event in TERT+ATRX+NOP10: p-value: 1.35 × E−7, AUC: 0.798; 95%CI: 0.714–0.882; any event in NOP10: p-value: 0.439, AUC: 0.548; 95%CI: 0.439–0.656. (B) Kaplan–Meier plots of time to progression of patients, according to the events in TERT/ATRX (left) and to the events in the three telomerome significant genes (TERT/ATRX/NOP10) (right). n = number of samples. Log-rank test p-value is shown. Non-metastatic patients with unknown follow-up and those with clinically aggressive tumors were excluded from the analysis.
Cancers 13 04758 g004
Figure 5. (A) Representative Q-FISH images from different tumors. 14T179: normal adrenal medulla with short telomeres. 13T86: non-metastatic PPGL with short telomeres. 17T76: mPPGL with ATRX mutation (c.3622dup, p.Ile1208AsnfsTer4) and long telomeres. 14T288: mPPGL with extremely short telomeres, this patient has TERT overexpression, promoter hypermethylation and 5p amplification. 16T362: mPPGL with medium-long telomeres and NOP10 overexpression. (B) Violin plot of telomere mean intensity per nucleus. Highest values (upper end) represent long telomeric regions. Black dots inside each violin box represent median intensity value. Dashed line represents the median value of normal samples intensity (normal adrenal medulla, n = 3). Non-mPPGL: 17T193 (FGFR1-mutated); 15T392 (WT); 13T86-3 (SDHB-mutated). (C) Mean telomere intensity distribution for each group of samples (Wilcoxon matched-pairs signed rank test, Gaussian Approximation). (D) Box plot representing the mean telomere size (mean pixel size per nucleus) for each tumor: ATRX mutants have extremely long telomeres, NOP10-altered samples show intermediate-long telomeres, TERT-altered present extremely short telomeres. Normal and non-metastatic samples have medium-short telomeres. Dashed line represents the median value of normal samples’ telomere size. The color code chart applies to panels B, C and D (one-way ANOVA Tukey’s multiple comparison test: **: p-value < 0.01).
Cancers 13 04758 g005
Figure 6. In vitro telomere length analysis. (A) Cell proliferation per condition. X axis: number of days in culture since antibiotic selection; Y axis: accumulative number of passages. Parental and NOP10 become quiescent after 3 passages. TERT cells become quiescent after 8 passages and TERT+NOP10 after 10 passages. (B) Scatter dot plot showing telomere length. Percentages of short and long telomeres for each isogenic primary culture are shown. Graph separations were made according to percentile 10 and 90 (P10 and P90) based on “Parental p0”. Median telomere length value graphed in black. (C) Median telomere length value per cell (one-way ANOVA Tukey’s multiple comparison test: **: p-value < 0.01; ***: p-value < 0.001).
Cancers 13 04758 g006aCancers 13 04758 g006b
Table 1. Summary of PPGL series clinical data.
CharacteristicsPatients
CNIO series (n = 149)
Gender
              Female54.4% (81)
              Male43% (64)
              Unknown2.7% (4)
Age at initial diagnosis of PCC/PGL; (range) in years
45 (9–82)
Cluster
              C1A40.3% (55)
              C1B9.4% (14)
              C236.9% (54)
              C34.7% (7)
              WT13.4% (19)
Clinical behavior
              Metastatic34.6% (47)
              Synchronous19.9% (28)
              Metachronous14.7% (19)
              Clinically aggressive3.2% (5)
              Non-metastatic62.2% (97)
Driver
              SDHB21.2% (30)
Tumor type
              PCC54.4% (81)
              PGL29.5% (44)
              Bilateral PCC3.4% (5)
              Multiple PGL3.4% (5)
              PCC+PGL7.4% (11)
              Unknown2% (3)
Publisher’s Note: MDPI stays neutral with regard to jurisdictional claims in published maps and institutional affiliations.

