
Defining the Tumor Microenvironment by Integration of Immunohistochemistry and Extracellular Matrix Targeted Imaging Mass Spectrometry

 ,
,
Abstract
Simple Summary
Abstract

1. Introduction
2. Materials and Methods
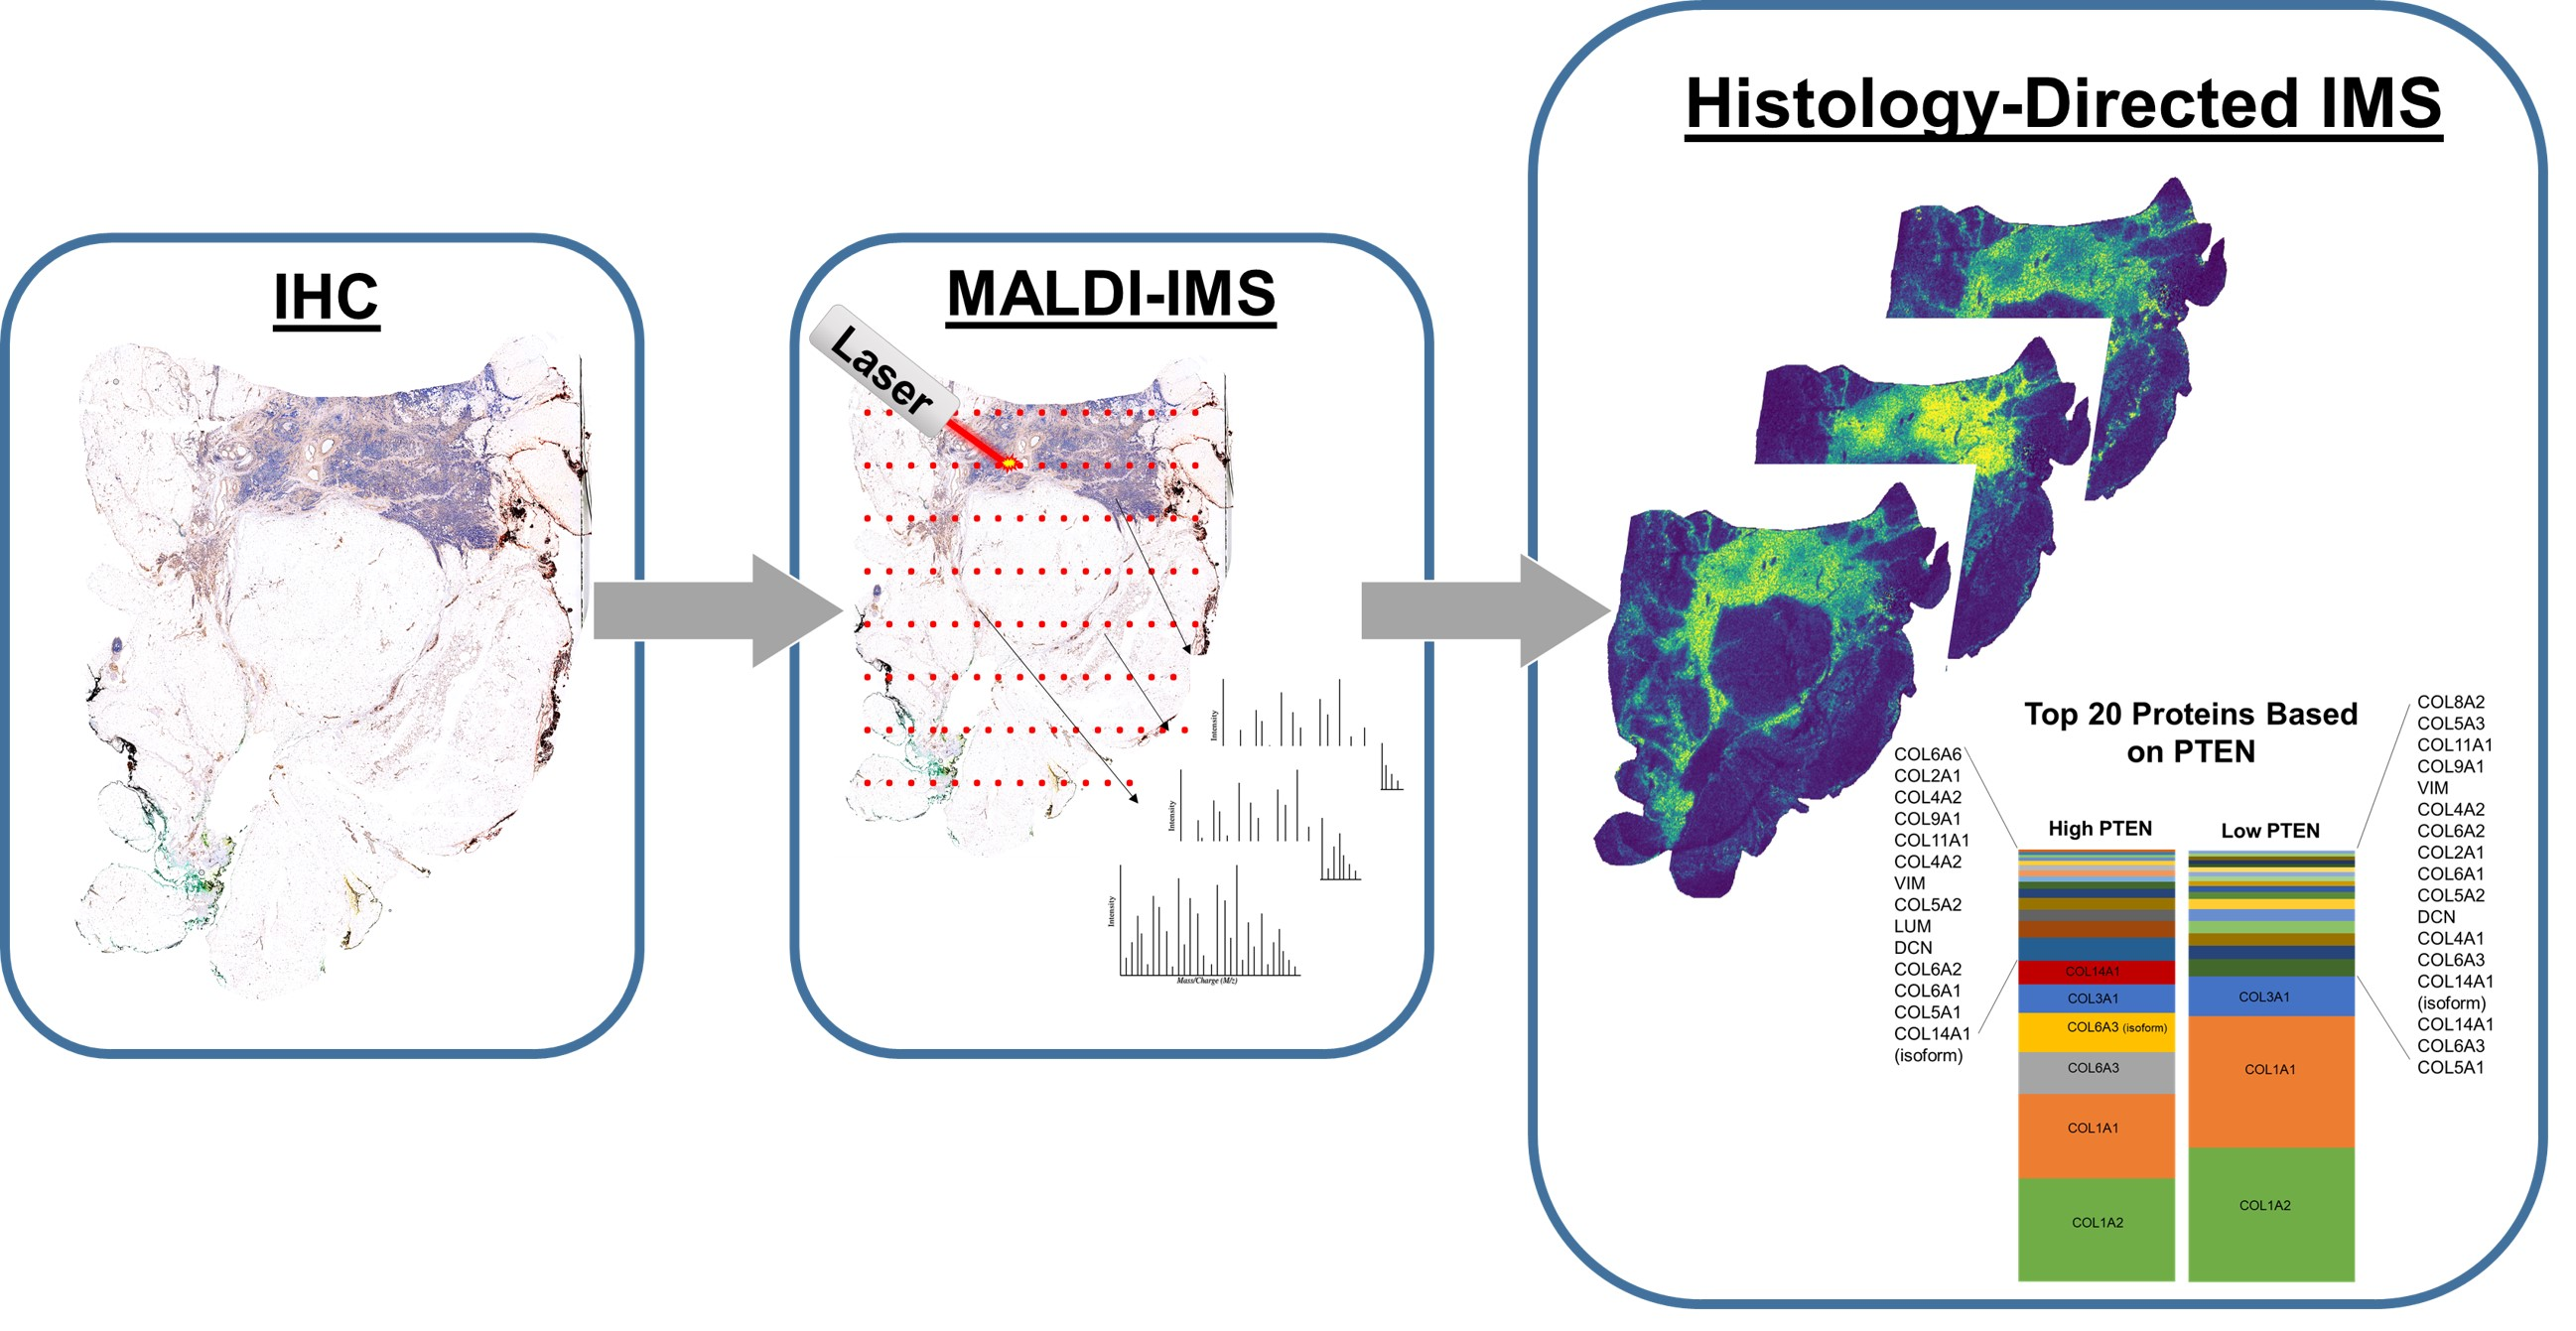
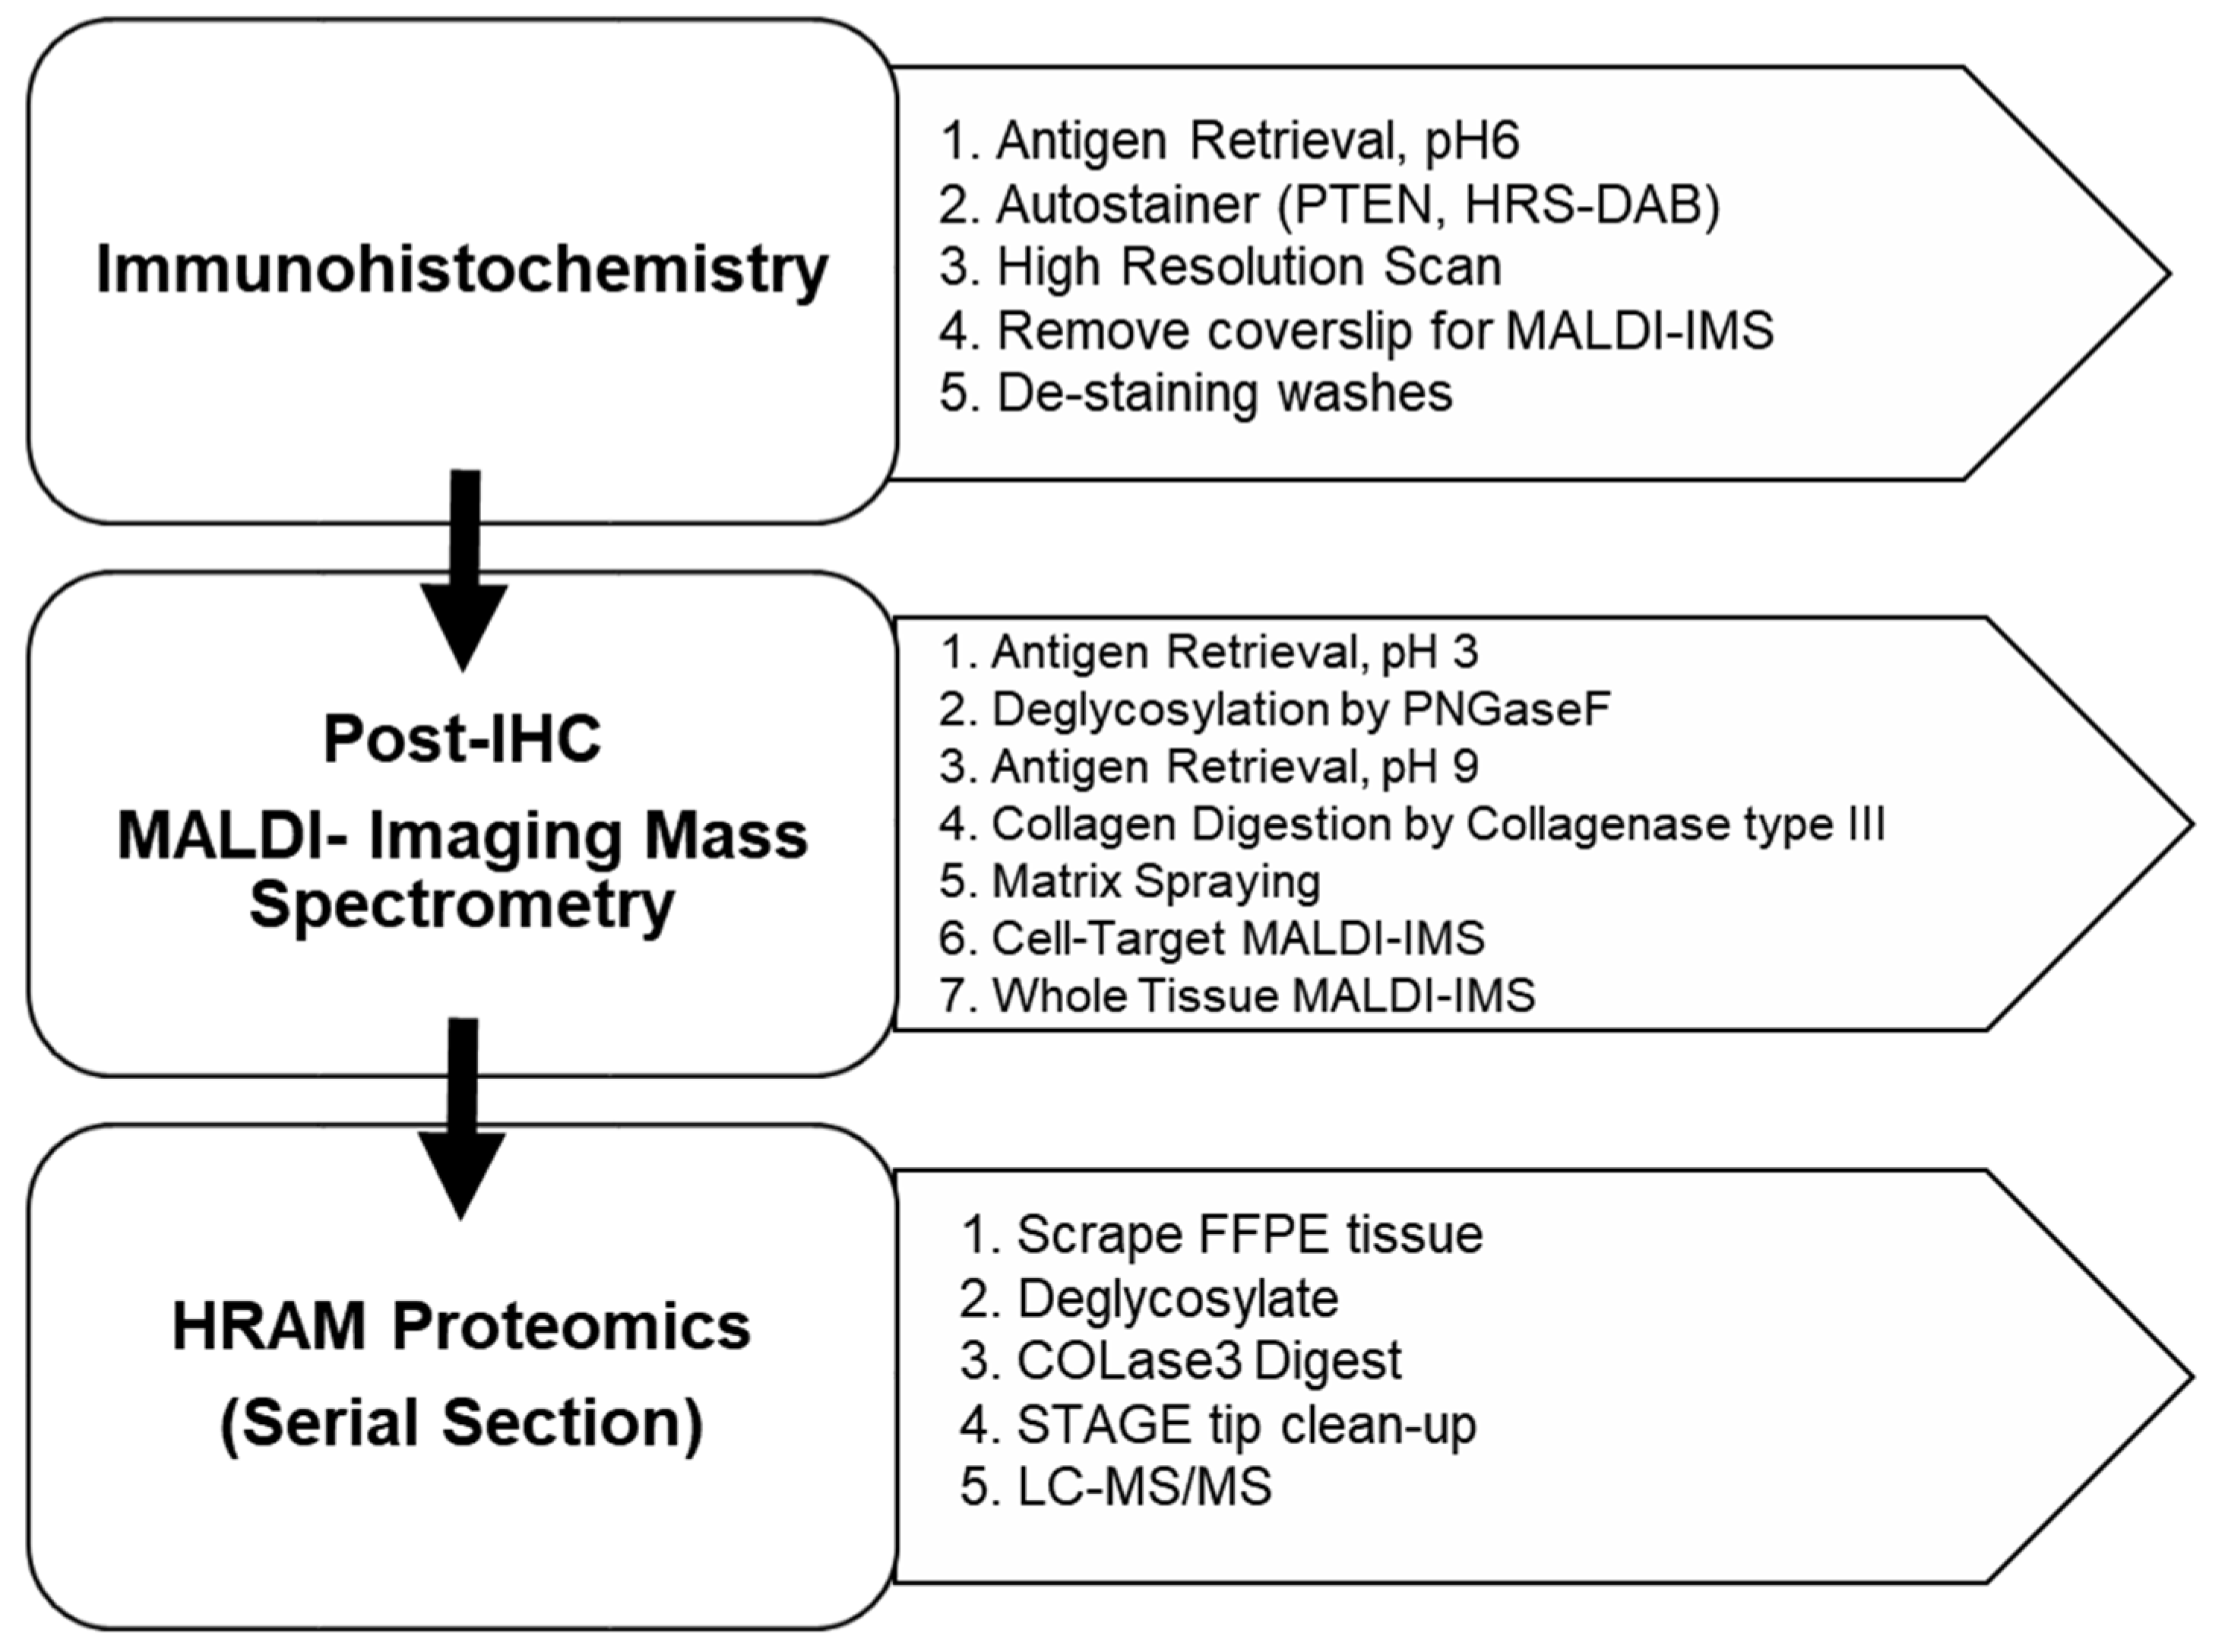
2.1. Overview
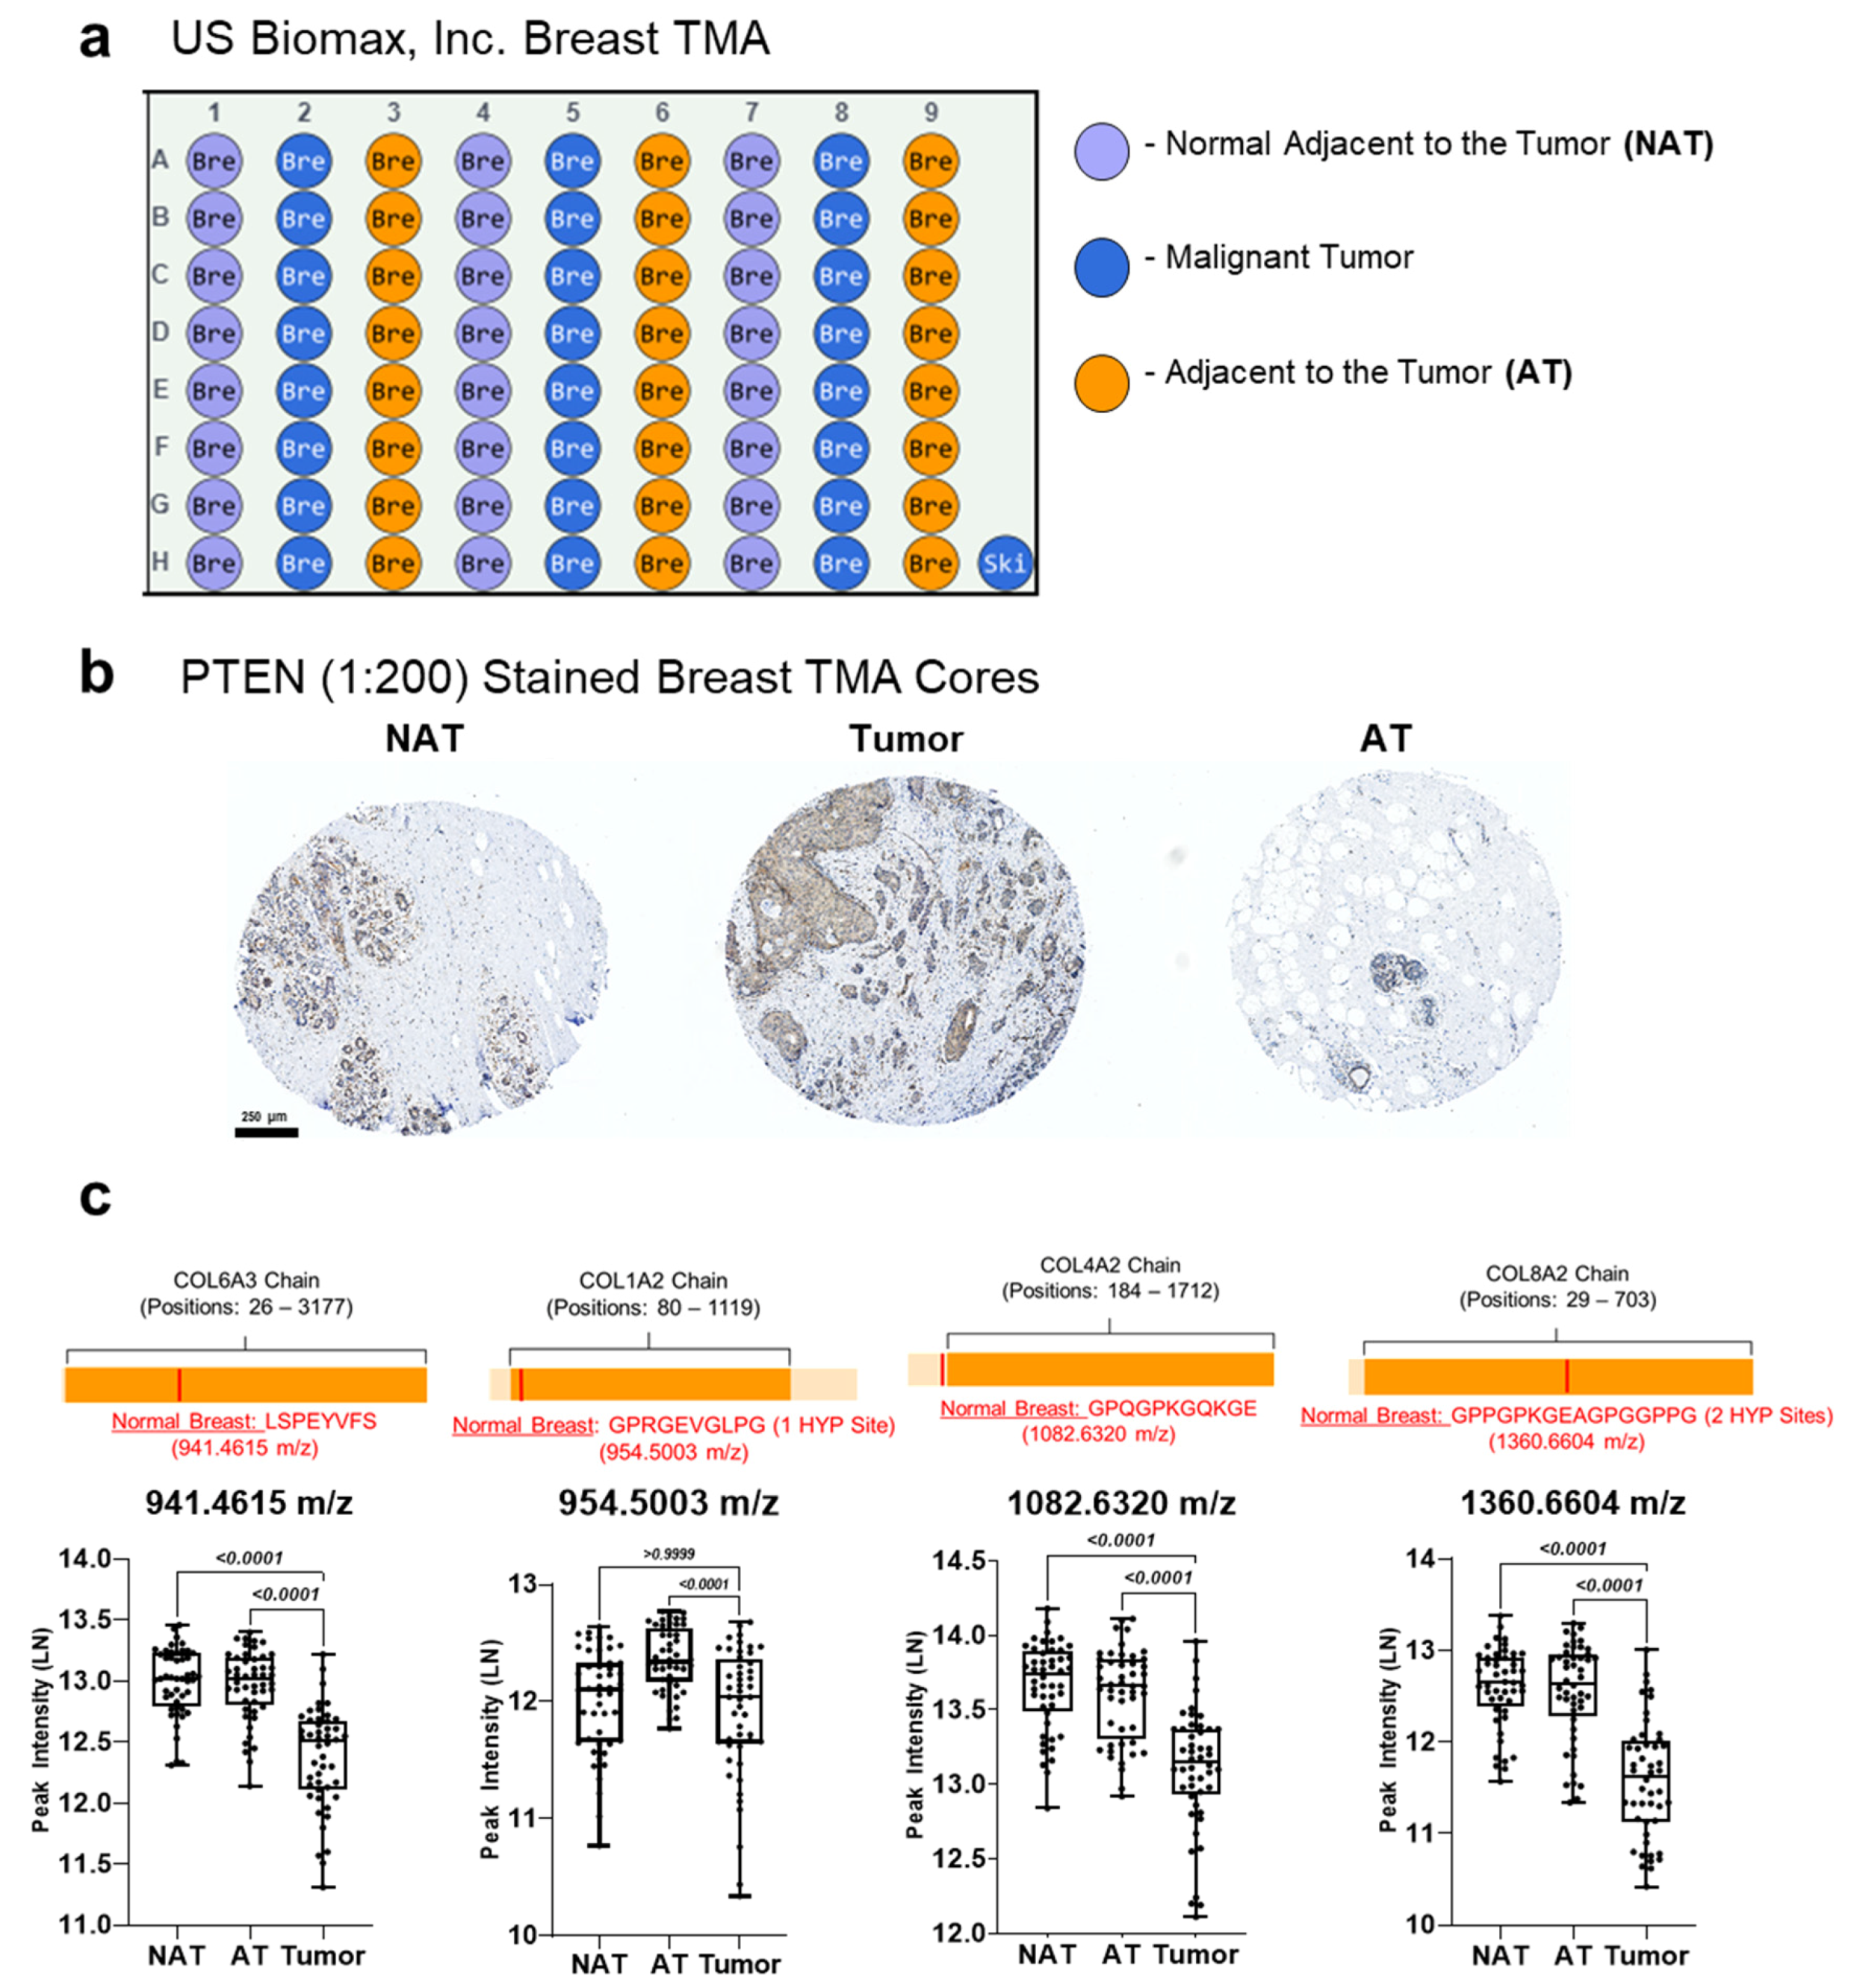
2.2. Tissues
2.3. Immunohistochemistry (IHC) Tissue Preparation
2.4. Imaging Mass Spectrometry (IMS) Preparation
2.5. IMS Data Acquisition
2.6. Proteomics
2.7. Statistical Analysis
3. Results
3.1. Overview
3.2. MALDI-IMS Following IHC Staining Allows Comparable Detection of ECM Peptides
3.3. Nonstained Breast Tissues Reveal Minimal Intrinsic Peak Intensity Variation between Serial and Distant Sections
3.4. Proteomics Demonstrate Heterogeneous PTEN Expression on Tissue Regulate Extracellular Matrix (ECM) Proteins
3.5. PTEN Stained Breast Cancer Tissue Microarrays Reveal Distinct Peptide Peak Expression Patterns Based on Staining and Tumor Region
4. Discussion
5. Conclusions
Supplementary Materials
Author Contributions
Funding
Institutional Review Board Statement
Informed Consent Statement
Data Availability Statement
Acknowledgments
Conflicts of Interest
References
- American Cancer Society, Inc. Available online: https://www.cancer.org/cancer/breast-cancer/understanding-a-breast-cancer-diagnosis/breast-cancer-survival-rates.html (accessed on 21 January 2021).
- DeSantis, C.E.; Ma, J.; Gaudet, M.M.; Newman, L.A.; Miller, K.D.; Sauer, A.G.; Jemal, A.; Siegel, R.L. Breast cancer statistics, 2019. CA Cancer J. Clin. 2019, 69, 438–451. [Google Scholar] [CrossRef] [PubMed]
- Fang, M.; Yuan, J.; Peng, C.; Li, Y. Collagen as a double-edged sword in tumor progression. Tumor Biol. 2014, 35, 2871–2882. [Google Scholar] [CrossRef]
- Pein, M.; Oskarsson, T. Microenvironment in metastasis: Roadblocks and supportive niches. Am. J. Physiol.-Cell Physiol. 2015, 309, C627–C638. [Google Scholar] [CrossRef]
- Conklin, M.W.; Keely, P.J. Why the stroma matters in breast cancer: Insights into breast cancer patient outcomes through the examination of stromal biomarkers. Cell Adhes. Migr. 2012, 6, 249–260. [Google Scholar] [CrossRef] [PubMed]
- Littlepage, L.E.; Egeblad, M.; Werb, Z. Coevolution of cancer and stromal cellular responses. Cancer Cell 2005, 7, 499–500. [Google Scholar] [CrossRef]
- Insua-Rodríguez, J.; Oskarsson, T. The extracellular matrix in breast cancer. Adv. Drug Deliv. Rev. 2016, 97, 41–55. [Google Scholar] [CrossRef]
- Connolly, J.L.; Schnitt, S.J.; Wang, H.H.; Longtine, J.A.; Dvorak, A.; Dvorak, H.F. Tumor Structure and Tumor Stroma Generation. In Holland-Frei Cancer Medicine, 6th ed.; Kufe, D.W., Pollock, R.E., Weichselbaum, R.R., Bast, R.C., Jr., Gansler, T.S., Holland, J.F., Frei, E., III, Eds.; John Wiley & Sons, Inc.: Hoboken, NJ, USA, 2003. [Google Scholar]
- Mueller, M.M.; Fusenig, N.E. Friends or foes—Bipolar effects of the tumour stroma in cancer. Nat. Rev. Cancer 2004, 4, 839–849. [Google Scholar] [CrossRef] [PubMed]
- Frantz, C.; Stewart, K.M.; Weaver, V.M. The extracellular matrix at a glance. J. Cell Sci. 2010, 123, 4195–4200. [Google Scholar] [CrossRef] [PubMed]
- Nazari, S.S.; Mukherjee, P. An overview of mammographic density and its association with breast cancer. Breast Cancer 2018, 25, 259–267. [Google Scholar] [CrossRef]
- Boyd, N.F.; Martin, L.J.; Yaffe, M.J.; Minkin, S. Mammographic density and breast cancer risk: Current understanding and future prospects. Breast Cancer Res. BCR 2011, 13, 223. [Google Scholar] [CrossRef] [PubMed]
- Conklin, M.W.; Eickhoff, J.C.; Riching, K.M.; Pehlke, C.A.; Eliceiri, K.W.; Provenzano, P.P.; Friedl, A.; Keely, P.J. Aligned collagen is a prognostic signature for survival in human breast carcinoma. Am. J. Pathol. 2011, 178, 1221–1232. [Google Scholar] [CrossRef] [PubMed]
- Xu, S.; Xu, H.; Wang, W.; Li, S.; Li, H.; Li, T.; Zhang, W.; Yu, X.; Liu, L. The role of collagen in cancer: From bench to bedside. J. Transl. Med. 2019, 17, 1–22. [Google Scholar] [CrossRef]
- Jones, C.E.; Hammer, A.M.; Cho, Y.; Sizemore, G.M.; Cukierman, E.; Yee, L.D.; Ghadiali, S.N.; Ostrowski, M.C.; Leight, J.L. Stromal PTEN Regulates Extracellular Matrix Organization in the Mammary Gland. Neoplasia 2019, 21, 132–145. [Google Scholar] [CrossRef]
- Kadler, K.E.; Baldock, C.; Bella, J.; Boot-Handford, R.P. Collagens at a glance. J. Cell Sci. 2007, 120, 1955–1958. [Google Scholar] [CrossRef]
- Hompland, T.; Erikson, A.; Lindgren, M.; Lindmo, T.; de Lange Davies, C. Second-harmonic generation in collagen as a potential cancer diagnostic parameter. J. Biomed. Opt. 2008, 13, 054050. [Google Scholar] [CrossRef]
- Trimboli, A.J.; Cantemir-Stone, C.Z.; Li, F.; Wallace, J.A.; Merchant, A.; Creasap, N.; Thompson, J.C.; Caserta, E.; Wang, H.; Chong, J.-L.; et al. Pten in stromal fibroblasts suppresses mammary epithelial tumours. Nature 2009, 461, 1084–1091. [Google Scholar] [CrossRef] [PubMed]
- Hopkins, B.D.; Fine, B.; Steinbach, N.; Dendy, M.; Rapp, Z.; Shaw, J.; Pappas, K.; Yu, J.S.; Hodakoski, C.; Mense, S.; et al. A secreted PTEN phosphatase that enters cells to alter signaling and survival. Science 2013, 341, 399–402. [Google Scholar] [CrossRef]
- Leslie, N.R.; Downes, C.P. PTEN function: How normal cells control it and tumour cells lose it. Biochem. J. 2004, 382, 1–11. [Google Scholar] [CrossRef] [PubMed]
- Papa, A.; Pandolfi, P.P. The PTEN⁻PI3K Axis in Cancer. Biomolecules 2019, 9, 153. [Google Scholar] [CrossRef] [PubMed]
- Noorolyai, S.; Shajari, N.; Baghbani, E.; Sadreddini, S.; Baradaran, B. The relation between PI3K/AKT signalling pathway and cancer. Gene 2019, 698, 120–128. [Google Scholar] [CrossRef]
- Xiong, G.; Stewart, R.L.; Chen, J.; Gao, T.; Scott, T.L.; Samayoa, L.M.; O’Connor, K.; Lane, A.N.; Xu, R. Collagen prolyl 4-hydroxylase 1 is essential for HIF-1α stabilization and TNBC chemoresistance. Nat. Commun. 2018, 9, 4456. [Google Scholar] [CrossRef]
- Kim, M. Cooperative interactions of PTEN deficiency and RAS activation in melanoma metastasis. Small GTPases 2010, 1, 161–164. [Google Scholar] [CrossRef] [PubMed][Green Version]
- Carnero, A.; Paramio, J.M. The PTEN/PI3K/AKT Pathway in vivo, Cancer Mouse Models. Front. Oncol. 2014, 4, 252. [Google Scholar] [CrossRef]
- Fresno Vara, J.A.; Casado, E.; de Castro, J.; Cejas, P.; Belda-Iniesta, C.; González-Barón, M. PI3K/Akt signalling pathway and cancer. Cancer Treat. Rev. 2004, 30, 193–204. [Google Scholar] [CrossRef]
- Vasudevan, K.M.; Burikhanov, R.; Goswami, A.; Rangnekar, V.M. Suppression of PTEN expression is essential for antiapoptosis and cellular transformation by oncogenic Ras. Cancer Res. 2007, 67, 10343–10350. [Google Scholar] [CrossRef]
- Depowski, P.L.; Rosenthal, S.I.; Ross, J.S. Loss of expression of the PTEN gene protein product is associated with poor outcome in breast cancer. Mod. Pathol. 2001, 14, 672–676. [Google Scholar] [CrossRef] [PubMed]
- McMenamin, M.E.; Soung, P.; Perera, S.; Kaplan, I.; Loda, M.; Sellers, W.R. Loss of PTEN expression in paraffin-embedded primary prostate cancer correlates with high Gleason score and advanced stage. Cancer Res. 1999, 59, 4291–4296. [Google Scholar] [PubMed]
- Mutter, G.L.; Lin, M.C.; Fitzgerald, J.T.; Kum, J.B.; Baak, J.P.A.; Lees, J.A.; Weng, L.-P.; Eng, C. Altered PTEN expression as a diagnostic marker for the earliest endometrial precancers. J. Natl. Cancer Inst. 2000, 92, 924–930. [Google Scholar] [CrossRef] [PubMed]
- Soria, J.-C.; Lee, H.-Y.; Lee, J.I.; Wang, L.; Issa, J.-P.; Kemp, B.L.; Liu, D.D.; Kurie, J.M.; Mao, L.; Khuri, F.R. Lack of PTEN expression in non-small cell lung cancer could be related to promoter methylation. Clin. Cancer Res. 2002, 8, 1178–1184. [Google Scholar] [PubMed]
- Thies, K.A.; Lefler, J.E.; Leone, G.; Ostrowski, M.C. PTEN in the stroma. Cold Spring Harb. Perspect. Med. 2019, 9, a036111. [Google Scholar] [CrossRef]
- Wu, Y.; Sarkissyan, M.; Elshimali, Y.; Vadgama, J.V. Triple negative breast tumors in African-American and Hispanic/Latina women are high in CD44+, low in CD24+, and have loss of PTEN. PLoS ONE 2013, 8, e78259. [Google Scholar] [CrossRef]
- Angel, P.M.; Schwamborn, K.; Comte-Walters, S.; Clift, C.; Ball, L.E.; Mehta, A.S.; Drake, R.R. Extracellular Matrix Imaging of Breast Tissue Pathologies by MALDI Imaging Mass Spectrometry. Proteom. Clin. Appl. 2019, 13, e1700152. [Google Scholar] [CrossRef]
- Angel, P.M.; Comte-Walters, S.; Ball, L.E.; Talbot, K.; Mehta, A.; Brockbank, K.G.M.; Drake, R.R. Mapping Extracellular Matrix Proteins in Formalin-Fixed, Paraffin-Embedded Tissues by MALDI Imaging Mass Spectrometry. J. Proteome Res. 2018, 17, 635–646. [Google Scholar] [CrossRef]
- Angel, P.M.; Spruill, L.; Jefferson, M.; Bethard, J.R.; Ball, L.E.; Hughes-Halbert, C.; Drake, R.R. Zonal regulation of collagen-type proteins and posttranslational modifications in prostatic benign and cancer tissues by imaging mass spectrometry. Prostate 2020, 80, 1071–1086. [Google Scholar] [CrossRef] [PubMed]
- Cornett, D.S.; Mobley, J.A.; Dias, E.C.; Andersson, M.; Arteaga, C.L.; Sanders, M.E.; Caprioli, R.M. A novel histology-directed strategy for MALDI-MS tissue profiling that improves throughput and cellular specificity in human breast cancer. Mol. Cell Proteom. 2006, 5, 1975–1983. [Google Scholar] [CrossRef]
- Sizemore, G.M.; Balakrishnan, S.; Thies, K.A.; Hammer, A.M.; Sizemore, S.T.; Trimboli, A.J.; Cuitiño, M.C.; Steck, S.A.; Tozbikian, G.; Kladney, R.D.; et al. Stromal PTEN determines mammary epithelial response to radiotherapy. Nat. Commun. 2018, 9, 2783. [Google Scholar] [CrossRef]
- Uhlén, M.; Fagerberg, L.; Hallström, B.M.; Lindskog, C.; Oksvold, P.; Mardinoglu, A.; Sivertsson, Å.; Kampf, C.; Sjöstedt, E.; Asplund, A.; et al. Tissue-based map of the human proteome. Science 2015, 347, 1260419. [Google Scholar] [CrossRef] [PubMed]
- Schindelin, J.; Arganda-Carreras, I.; Frise, E.; Kaynig, V.; Longair, M.; Pietzsch, T.; Preibisch, S.; Rueden, C.; Saalfeld, S.; Schmid, B.; et al. Fiji: An open-source platform for biological-image analysis. Nat. Methods 2012, 9, 676–682. [Google Scholar] [CrossRef] [PubMed]
- Landini, G.; Martinelli, G.; Piccinini, F. Colour deconvolution: Stain unmixing in histological imaging. Bioinformatics 2020, 37, 1485–1487. [Google Scholar] [CrossRef] [PubMed]
- Ruifrok, A.C.; Johnston, D.A. Quantification of histochemical staining by color deconvolution. Anal. Quant. Cytol. Histol. 2001, 23, 291–299. [Google Scholar]
- Clift, C.L.; Su, Y.R.; Bichell, D.; Smith, H.C.J.; Bethard, J.R.; Norris-Caneda, K.; Comte-Walters, S.; Ball, L.E.; Hollingsworth, M.A.; Mehta, A.S.; et al. Collagen fiber regulation in human pediatric aortic valve development and disease. Sci. Rep. 2021, 11, 9751. [Google Scholar] [CrossRef] [PubMed]
- Angel, P.M.; Bruner, E.; Bethard, J.; Clift, C.L.; Ball, L.; Drake, R.R.; Feghali-Bostwick, C. Extracellular matrix alterations in low-grade lung adenocarcinoma compared with normal lung tissue by imaging mass spectrometry. J. Mass Spectrom. JMS 2020, 55, e4450. [Google Scholar] [CrossRef]
- Clift, C.L.; Drake, R.R.; Mehta, A.; Angel, P.M. Multiplexed imaging mass spectrometry of the extracellular matrix using serial enzyme digests from formalin-fixed paraffin-embedded tissue sections. Anal. Bioanal. Chem. 2021, 413, 2709–2719. [Google Scholar] [CrossRef] [PubMed]
- Angel, P.M.; Mehta, A.; Norris-Caneda, K.; Drake, R.R. MALDI Imaging Mass Spectrometry of N-glycans and Tryptic Peptides from the Same Formalin-Fixed, Paraffin-Embedded Tissue Section. Methods Mol. Biol. 2018, 1788, 225–241. [Google Scholar] [CrossRef]
- Keller, A.; Nesvizhskii, A.I.; Kolker, E.; Aebersold, R. Empirical statistical model to estimate the accuracy of peptide identifications made by MS/MS and database search. Anal. Chem. 2002, 74, 5383–5392. [Google Scholar] [CrossRef] [PubMed]
- Nesvizhskii, A.I.; Keller, A.; Kolker, E.; Aebersold, R. A statistical model for identifying proteins by tandem mass spectrometry. Anal. Chem. 2003, 75, 4646–4658. [Google Scholar] [CrossRef]
- Hanahan, D.; Weinberg, R.A. Hallmarks of cancer: The next generation. Cell 2011, 144, 646–674. [Google Scholar] [CrossRef] [PubMed]
- Hanahan, D.; Coussens, L.M. Accessories to the Crime: Functions of Cells Recruited to the Tumor Microenvironment. Cancer Cell 2012, 21, 309–322. [Google Scholar] [CrossRef] [PubMed]
- Pietras, K.; Ostman, A. Hallmarks of cancer: Interactions with the tumor stroma. Exp. Cell Res. 2010, 316, 1324–1331. [Google Scholar] [CrossRef]
- Yamauchi, M.; Barker, T.H.; Gibbons, D.L.; Kurie, J.M. The fibrotic tumor stroma. J. Clin. Investig. 2018, 128, 16–25. [Google Scholar] [CrossRef]
- Acerbi, I.; Cassereau, L.; Dean, I.; Shi, Q.; Au, A.; Park, C.; Chen, Y.Y.; Liphardt, J.; Hwang, E.S.; Weaver, V.M. Human breast cancer invasion and aggression correlates with ECM stiffening and immune cell infiltration. Integr. Biol. 2015, 7, 1120–1134. [Google Scholar] [CrossRef]
- Dykes, S.S.; Hughes, V.S.; Wiggins, J.M.; Fasanya, H.O.; Tanaka, M.; Siemann, D. Stromal cells in breast cancer as a potential therapeutic target. Oncotarget 2018, 9, 23761–23779. [Google Scholar] [CrossRef]
- Turley, S.J.; Cremasco, V.; Astarita, J.L. Immunological hallmarks of stromal cells in the tumour microenvironment. Nature reviews. Immunology 2015, 15, 669–682. [Google Scholar] [CrossRef] [PubMed]
- Monteran, L.; Erez, N. The Dark Side of Fibroblasts: Cancer-Associated Fibroblasts as Mediators of Immunosuppression in the Tumor Microenvironment. Front. Immunol. 2019, 10, 1835. [Google Scholar] [CrossRef] [PubMed]
- Karsdal, M.A.; Nielsen, M.J.; Sand, J.M.; Henriksen, K.; Genovese, F.; Bay-Jensen, A.-C.; Smith, V.; Adamkewicz, J.I.; Christiansen, C.; Leeming, D.J. Extracellular matrix remodeling: The common denominator in connective tissue diseases. Possibilities for evaluation and current understanding of the matrix as more than a passive architecture, but a key player in tissue failure. Assay Drug Dev. Technol. 2013, 11, 70–92. [Google Scholar] [CrossRef] [PubMed]
- Willumsen, N.; Nissen, N.I.; Karsdal, M.A. Chapter 34—The roles of collagens in cancer. In Biochemistry of Collagens, Laminins and Elastin Structure: Function and Biomarkers, 2nd ed.; Academic Press: Cambridge, MA, USA, 2019; pp. 341–352. [Google Scholar] [CrossRef]
- Bihlet, A.R.; Karsdal, M.A.; Andersen, J.R.; Bager, C.L. Chapter 35—Use of extracellular matrix biomarkers in clinical research. In Biochemistry of Collagens, Laminins and Elastin Structure: Function and Biomarkers, 2nd ed.; Academic Press: Cambridge, MA, USA, 2019; pp. 353–362. [Google Scholar] [CrossRef]
- Nissen, N.I.; Karsdal, M.; Willumsen, N. Collagens and Cancer associated fibroblasts in the reactive stroma and its relation to Cancer biology. J. Exp. Clin. Cancer Res. 2019, 38, 115. [Google Scholar] [CrossRef]
- Yagnik, G.; Liu, Z.; Rothschild, K.J.; Lim, M.J. Highly Multiplexed Immunohistochemical MALDI-MS Imaging of Biomarkers in Tissues. J. Am. Soc. Mass Spectrom. 2021, 32, 977–988. [Google Scholar] [CrossRef] [PubMed]
- Rzagalinski, I.; Volmer, D.A. Quantification of low molecular weight compounds by MALDI imaging mass spectrometry—A tutorial review. Biochim. Biophys. Acta-Proteins Proteom. 2017, 1865, 726–739. [Google Scholar] [CrossRef]
- Chumbley, C.W.; Reyzer, M.L.; Allen, J.L.; Marriner, G.A.; Via, L.E.; Barry, C.E., III; Caprioli, R.M. Absolute Quantitative MALDI Imaging Mass Spectrometry: A Case of Rifampicin in Liver Tissues. Anal. Chem. 2016, 88, 2392–2398. [Google Scholar] [CrossRef]
- Groseclose, M.R.; Castellino, S. A Mimetic Tissue Model for the Quantification of Drug Distributions by MALDI Imaging Mass Spectrometry. Anal. Chem. 2013, 85, 10099–10106. [Google Scholar] [CrossRef]
- Lamont, L.; Hadavi, D.; Viehmann, B.; Flinders, B.; Heeren, R.M.A.; Vreeken, R.J.; Siegel, T.P. Quantitative mass spectrometry imaging of drugs and metabolites: A multiplatform comparison. Anal. Bioanal. Chem. 2021, 413, 2779–2791. [Google Scholar] [CrossRef] [PubMed]
- Porta, T.; Lesur, A.; Varesio, E.; Hopfgartner, G. Quantification in MALDI-MS imaging: What can we learn from MALDI-selected reaction monitoring and what can we expect for imaging? Anal. Bioanal. Chem. 2015, 407, 2177–2187. [Google Scholar] [CrossRef] [PubMed]
- Perez-Riverol, Y.; Csordas, A.; Bai, J.; Bernal-Llinares, M.; Hewapathirana, S.; Kundu, D.J.; Inuganti, A.; Griss, J.; Mayer, G.; Eisenacher, M.; et al. The PRIDE database and related tools and resources in 2019: Improving support for quantification data. Nucleic Acids Res. 2018, 47, D442–D450. [Google Scholar] [CrossRef] [PubMed]


| Gene Name | Sequence a | Modified b | AA Position | Peptide Score c | Theoretical M + H | Observed m/z | PPM | H-Score Correlation |
|---|---|---|---|---|---|---|---|---|
| COL5A1 | GPx(0.015)Px(0.985)GEVIQPLPIQASR | 1568; 1569 | 1567–1582 | 321.03 | 1674.9173 | 1674.9173 | 0.03 | 0.92 |
| *HSPG2 | LVASQPALQGPERR | No | 1444–1457 | 104.41 | 1521.8496 | 1521.8200 | *19.5 | 0.87 |
| COL1A1 | FLPQPPQEKAHD | No | 1200–1211 | 80.98 | 1406.7063 | 1406.7063 | 0 | 0.83 |
| COL1A1 | GGPx(1)GSRGFPx(1)GADGVAGPK | 490; 496 | 488–505 | 62.20 | 1615.7823 | 1615.7823 | 0 | 0.73 |
| COL14A1 | VKWDISDSDVQQ | No | 753–764 | 95.57 | 1419.6750 | 1419.6750 | 0.04 | 0.73 |
| COL5A1 | GPx(0.5)Px(0.5)GTMLMLPFRFGGGGDA | 515; 516 | 514–532 | 75.09 | 1925.8884 | 1925.8899 | −0.76 | 0.73 |
| COL16A1 | MQFPx(1)MEMAAAPx(0.436)GRPx(0.564) | 1465; 1472; 1475 | 1462–1475 | 75.29 | 1597.6807 | 1597.6807 | 0.03 | 0.71 |
| Peak m/z | NAT vs. Tumor | AT vs. Tumor | NAT vs. AT |
|---|---|---|---|
| 941.4615 | 0.90 * | 0.88 * | 0.52 |
| 954.5003 | 0.54 | 0.78 * | 0.74 * |
| 1082.632 | 0.87 * | 0.84 * | 0.56 |
| 1360.6604 | 0.90 * | 0.86 * | 0.51 |
Publisher’s Note: MDPI stays neutral with regard to jurisdictional claims in published maps and institutional affiliations. |
© 2021 by the authors. Licensee MDPI, Basel, Switzerland. This article is an open access article distributed under the terms and conditions of the Creative Commons Attribution (CC BY) license (https://creativecommons.org/licenses/by/4.0/).
Share and Cite
Rujchanarong, D.; Lefler, J.; Saunders, J.E.; Pippin, S.; Spruill, L.; Bethard, J.R.; Ball, L.E.; Mehta, A.S.; Drake, R.R.; Ostrowski, M.C.; et al. Defining the Tumor Microenvironment by Integration of Immunohistochemistry and Extracellular Matrix Targeted Imaging Mass Spectrometry. Cancers 2021, 13, 4419. https://doi.org/10.3390/cancers13174419
Rujchanarong D, Lefler J, Saunders JE, Pippin S, Spruill L, Bethard JR, Ball LE, Mehta AS, Drake RR, Ostrowski MC, et al. Defining the Tumor Microenvironment by Integration of Immunohistochemistry and Extracellular Matrix Targeted Imaging Mass Spectrometry. Cancers. 2021; 13(17):4419. https://doi.org/10.3390/cancers13174419
Chicago/Turabian StyleRujchanarong, Denys, Julia Lefler, Janet E. Saunders, Sarah Pippin, Laura Spruill, Jennifer R. Bethard, Lauren E. Ball, Anand S. Mehta, Richard R. Drake, Michael C. Ostrowski, and et al. 2021. "Defining the Tumor Microenvironment by Integration of Immunohistochemistry and Extracellular Matrix Targeted Imaging Mass Spectrometry" Cancers 13, no. 17: 4419. https://doi.org/10.3390/cancers13174419
APA StyleRujchanarong, D., Lefler, J., Saunders, J. E., Pippin, S., Spruill, L., Bethard, J. R., Ball, L. E., Mehta, A. S., Drake, R. R., Ostrowski, M. C., & Angel, P. M. (2021). Defining the Tumor Microenvironment by Integration of Immunohistochemistry and Extracellular Matrix Targeted Imaging Mass Spectrometry. Cancers, 13(17), 4419. https://doi.org/10.3390/cancers13174419